Function and firing of the Streptomyces coelicolor contractile injection system requires the membrane protein CisA
- Department of Biology, Institute of Molecular Biology & Biophysics, Eidgenössische Technische Hochschule Zürich, Switzerland
- John Innes Centre, Department of Molecular Microbiology, Norwich Research Park, United Kingdom
- Cryo-EM Knowledge Hub, Eidgenössische Technische Hochschule Zürich, Switzerland
- Centre for Microbial Interactions, Norwich Research Park, United Kingdom
Figures
Figure 1 with 1 supplement
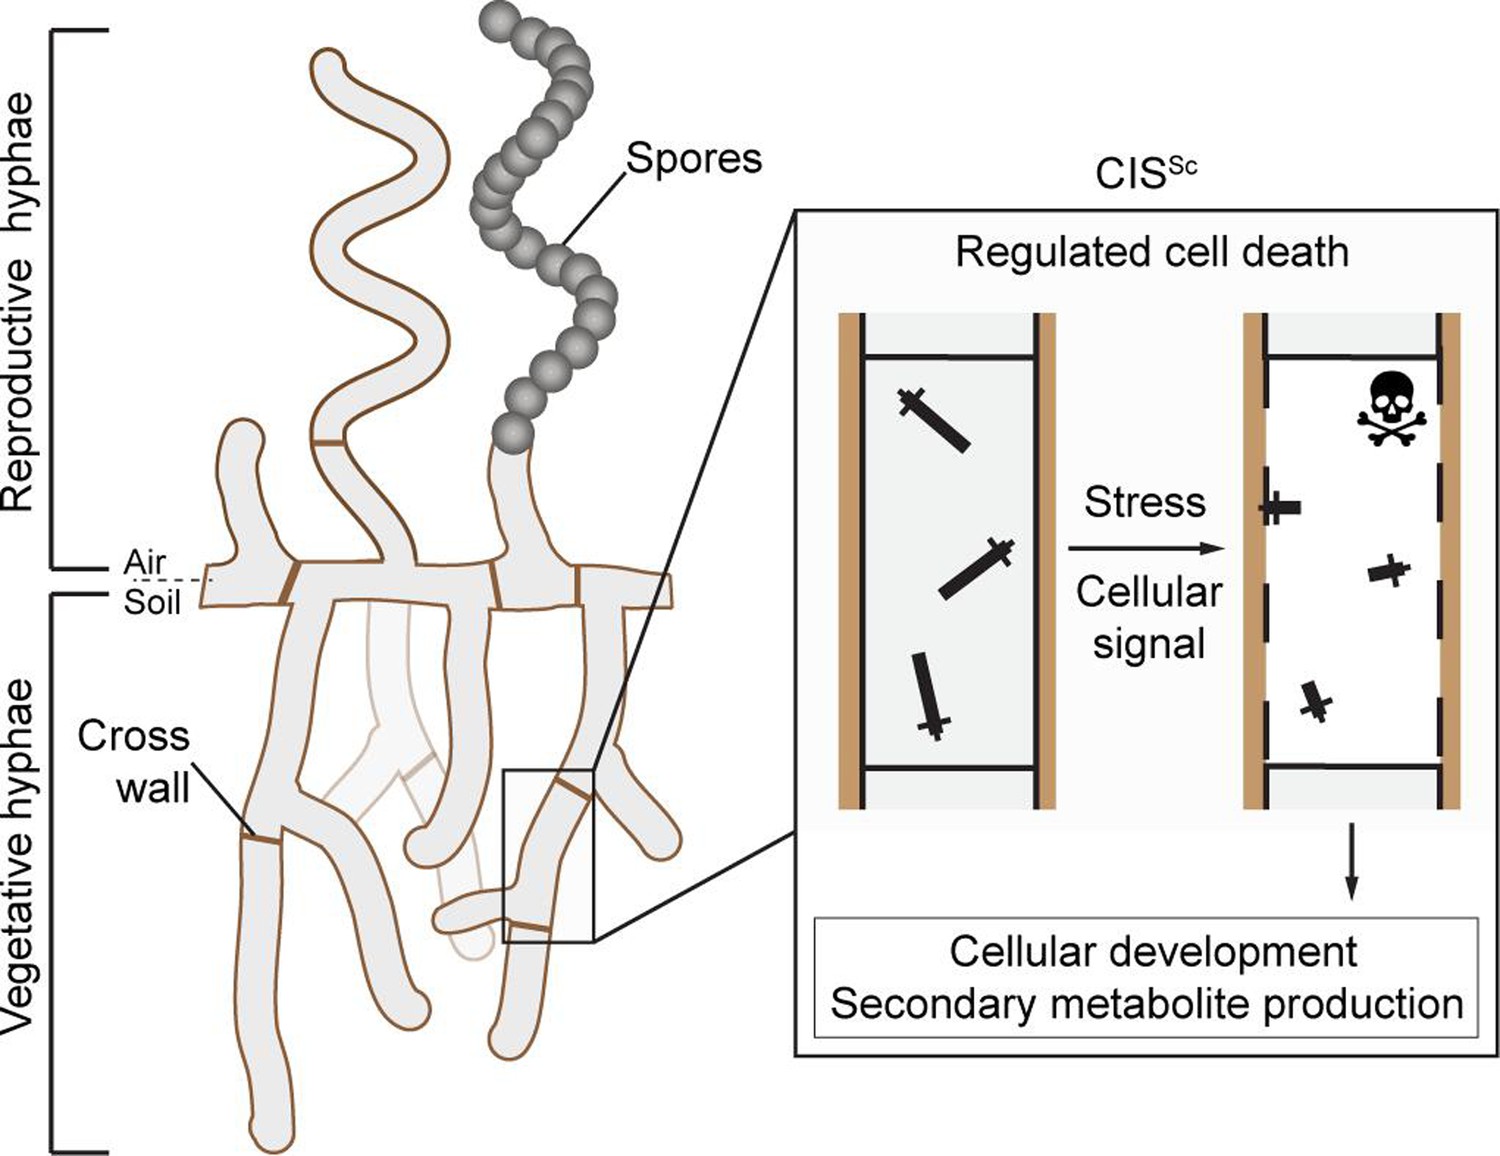
Schematic of the mode of action of the intracellular contractile injection system CISSc in Streptomyces coelicolor.
CISSc are assembled as free-floating particles in the cytoplasm of vegetative hyphae (Casu et al., 2023; Vladimirov et al., 2023). In response to extracellular stress and/or an unknown cellular signal, CISSc particles contract, resulting in regulated cell death (mediated by released effectors) and impacting cellular development.
Figure 1—figure supplement 1
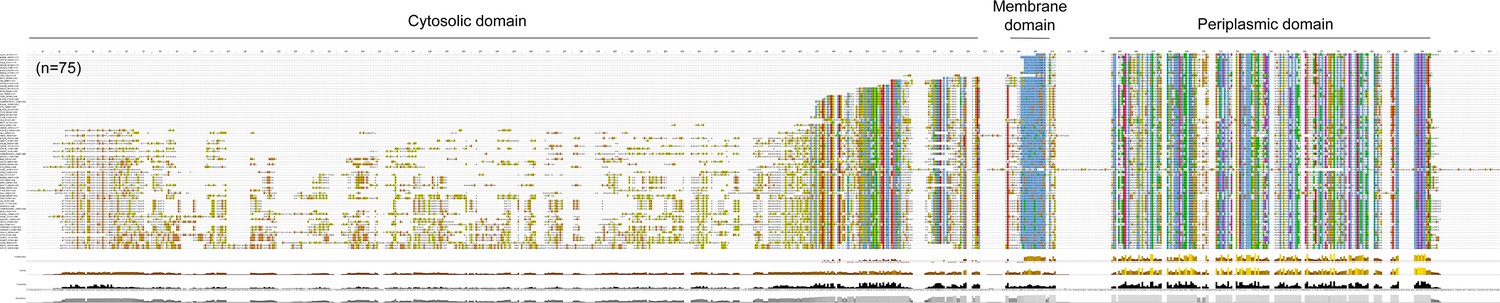
CisA is conserved among CIS-positive Streptomyces and actinomycete species.
Protein alignment of CisA homologs identified via reciprocal BLAST search in genomes of Streptomyces and actinomycete species previously reported to encode an eCIS class IId region. Protein sequences (n=75) were aligned with Clustal Omega and visualized using JalView. CisA domain structure is indicated on top.
-
Figure 1—figure supplement 1—source data 1
Genome accession numbers and BLAST results used to generate Figure 1—figure supplement 1.
- https://cdn.elifesciences.org/articles/104064/elife-104064-fig1-figsupp1-data1-v1.xlsx
Figure 2 with 1 supplement
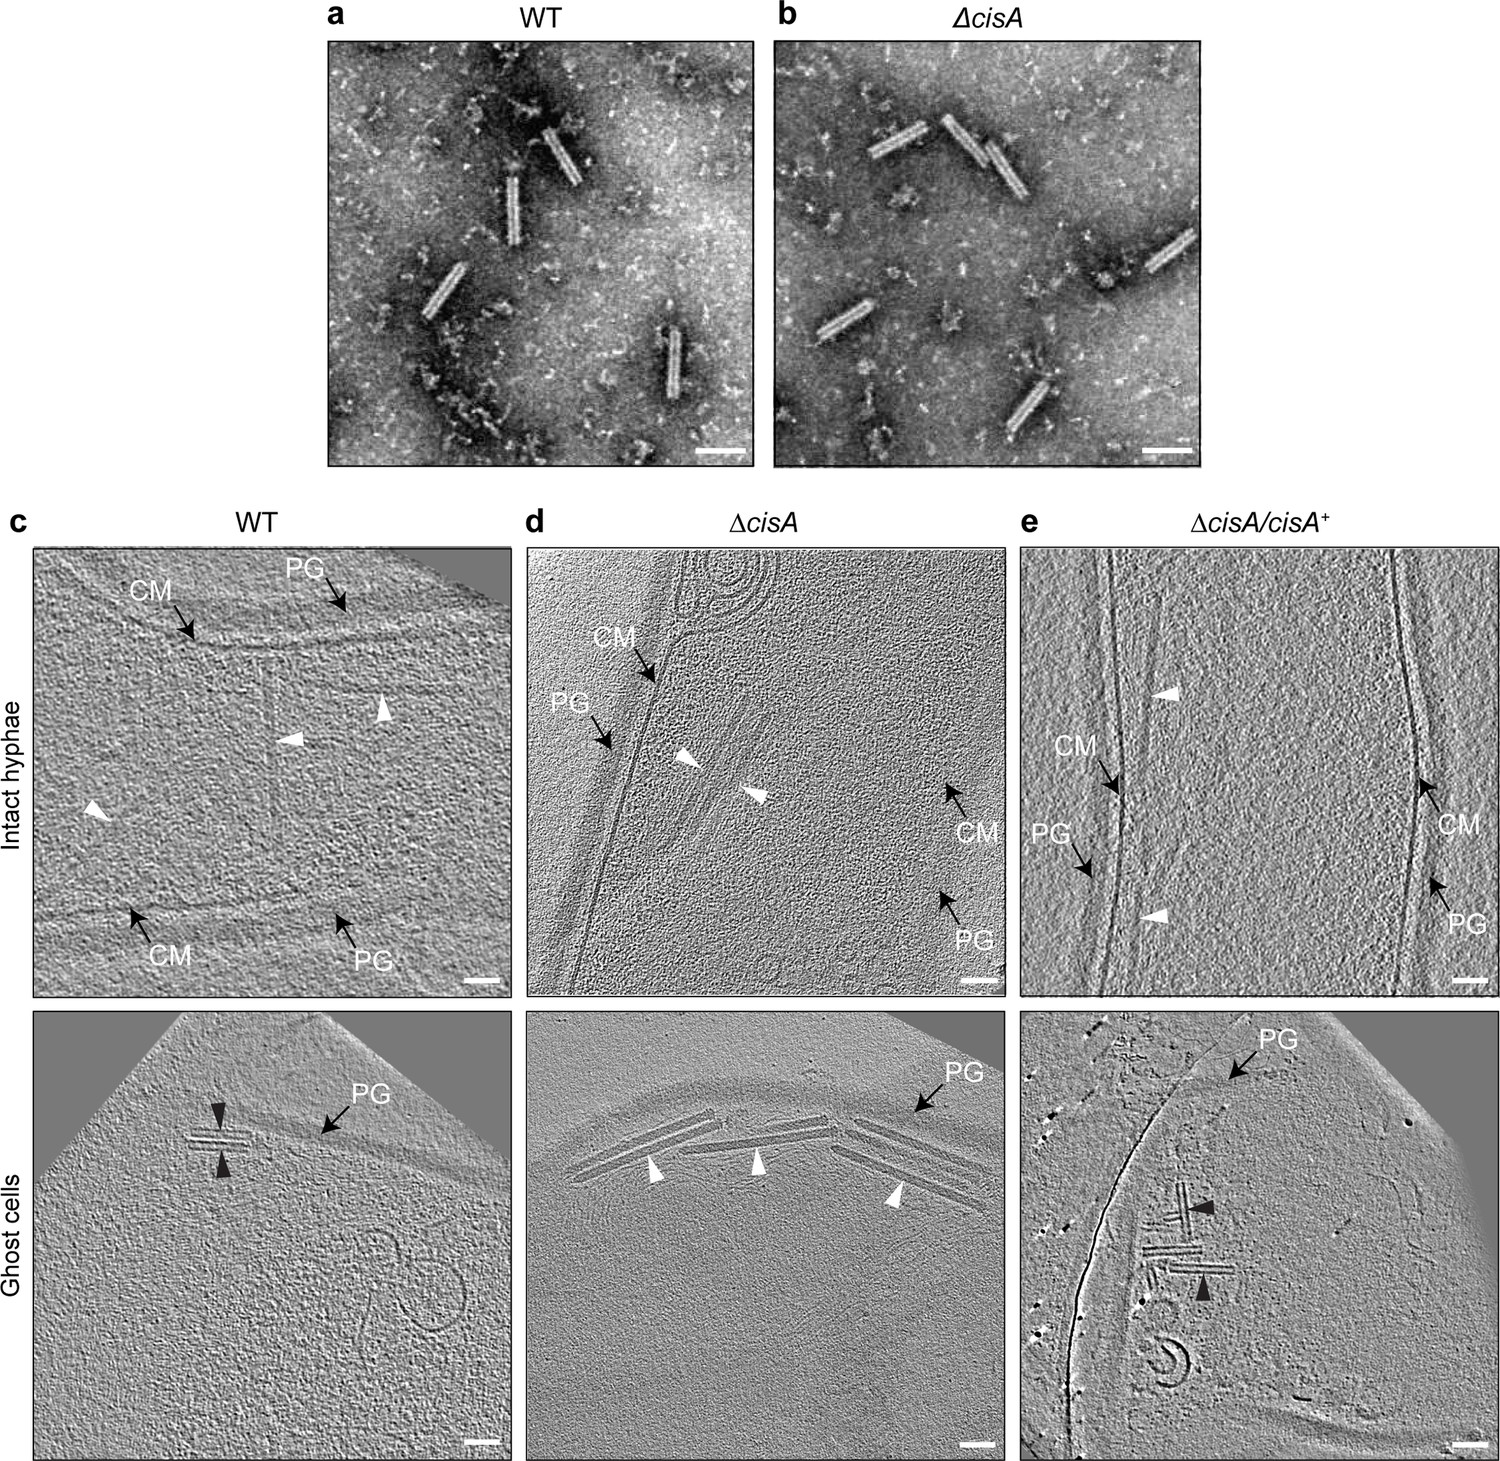
Contraction of CISSc in situ is dependent on CisA.
(a, b) Negative-stain electron micrographs of purified CISSc particles from S. coelicolor wildtype (WT) (a) and the ∆cisA mutant (b), show that all CISSc particles are functional and contract upon purification. Experiments were performed three times independently. Bars, 100 nm. (c–e) Shown are representative images of cryo-electron tomogram slices (thickness 11 nm) of vegetative hyphae (top: intact cells; bottom: ghost cells) of S. coelicolor WT (c), ∆cisA mutant (d), and the complemented ∆cisA/cisA+ mutant (f). CISSc particles remain almost exclusively in an extended state (white arrowheads) in the ∆cisA mutant, whereas in ghost cells derived from the WT and the complemented mutant, CISSc particles (black arrowheads) are mostly contracted. PG, peptidoglycan; CM, cytoplasmic membrane; Bars, 50 nm.
Figure 2—figure supplement 1
Sheath contraction in situ is linked to the presence of CisA.
(a–c) Shown are additional cryo-tomographic slices (thickness 11 nm) of S. coelicolor ∆cisA vegetative hyphae, which were observed as ‘Intact hyphae’ (a), ‘Partially lysed hyphae’ (b) and ‘Ghost cells’ (c) Note that all visible CISSc particles (white arrowheads) are in the extended conformation. PG, peptidoglycan; CM, cytoplasmic membrane/membranes. Bars, 50 nm. (d) Shown is a quantification of CISSc assemblies per tomogram and their conformations as observed in different classes of DcisA hyphae. Almost all CISSc particles were seen in the extended conformation, indicating that sheath contraction in situ correlates with the presence of CisA. Data show the mean values and standard deviations obtained from biological triplicate experiments, with n=30 tomograms for each class of hyphae.
Figure 3 with 4 supplements
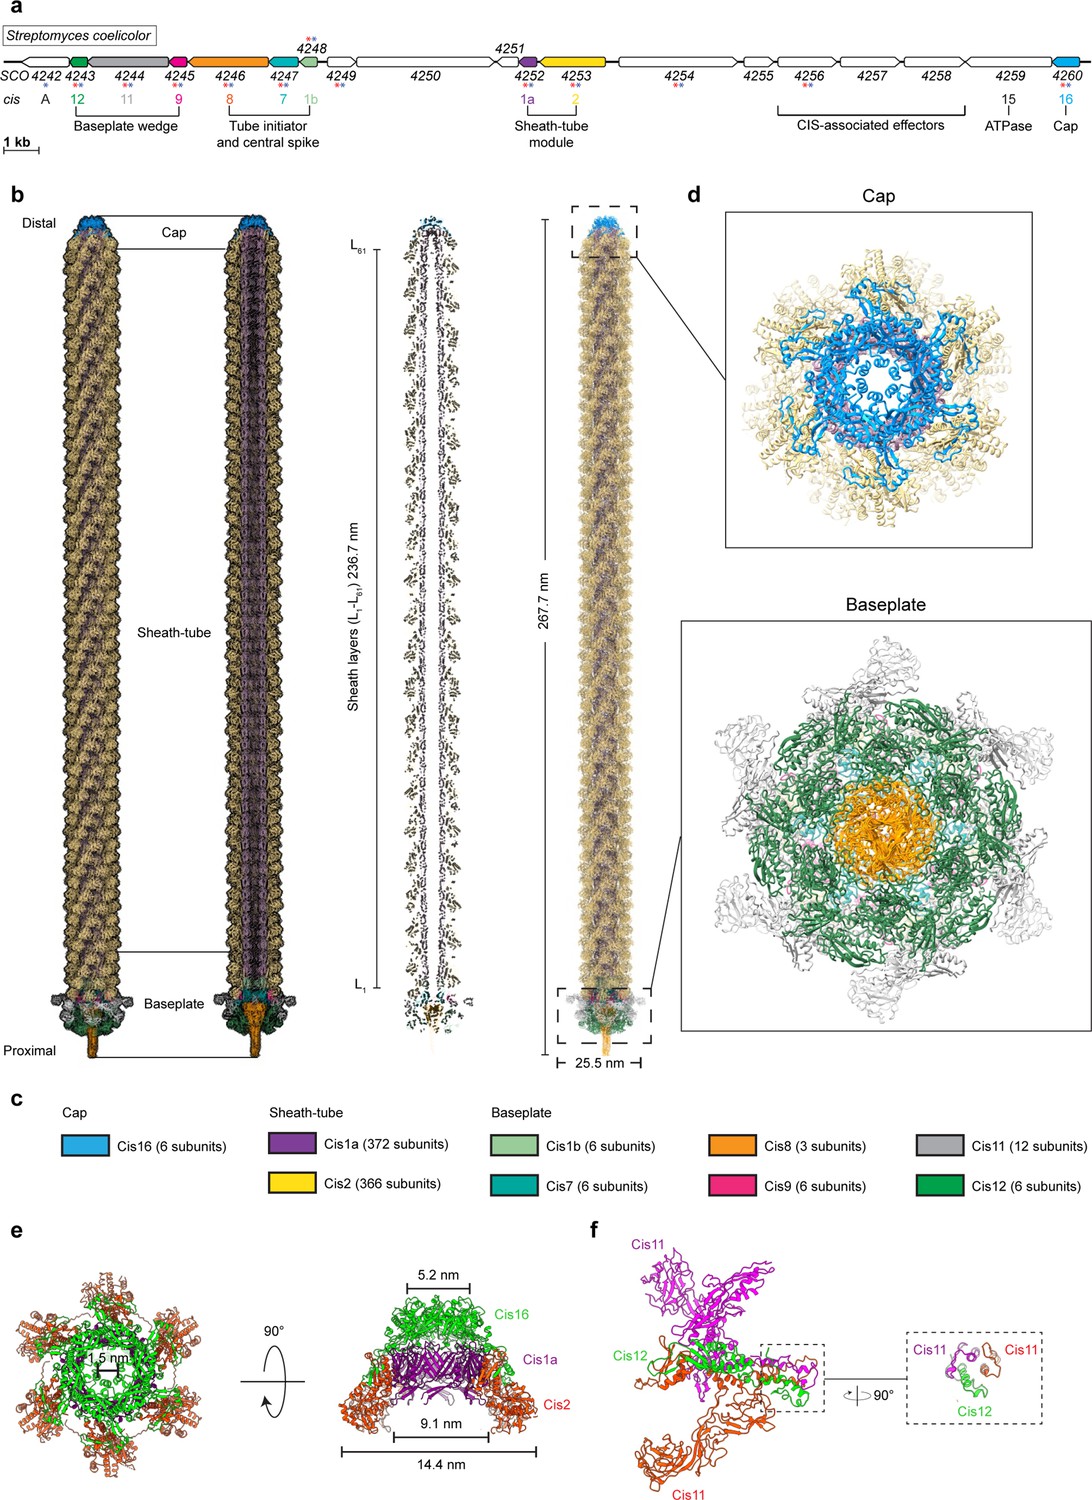
CryoEM structure of the extended CISSc assembly reveals its composition.
(a) Schematic illustrating the CISSc gene cluster (adapted from Figure 1B from Casu et al., 2023). Asterisks indicate gene products that were detected by mass spectrometry analyzing crude preparations of CISSc particles (red). See also Figure 3—source data 1. (b, c) Single-particle cryoEM structure of an extended CISSc assembly purified from a non-contractile CISSc mutant. Shown are the composite atomic model in surface (left) and ribbon (right) rendering (b) Subunits are color-coded according to (a), and their copy numbers in the assembly are indicated in (c). (d) Perpendicular views of the ribbon representation of the CISSc model of the cap and baseplate modules. (e) Top view (left) and side view (right) of ribbon diagrams showing the cap module of CISSc, revealing that the cap is composed of a Cis16 hexamer. (f) Ribbon diagrams showing a single baseplate wedge subunit, which is composed of two copies of Cis11 and one copy of Cis12.
-
Figure 3—source data 1
Proteins detected by mass spectrometry in samples of purified CISSc sheath particles following treatment with and without nisin.
- https://cdn.elifesciences.org/articles/104064/elife-104064-fig3-data1-v1.docx
Figure 3—figure supplement 1
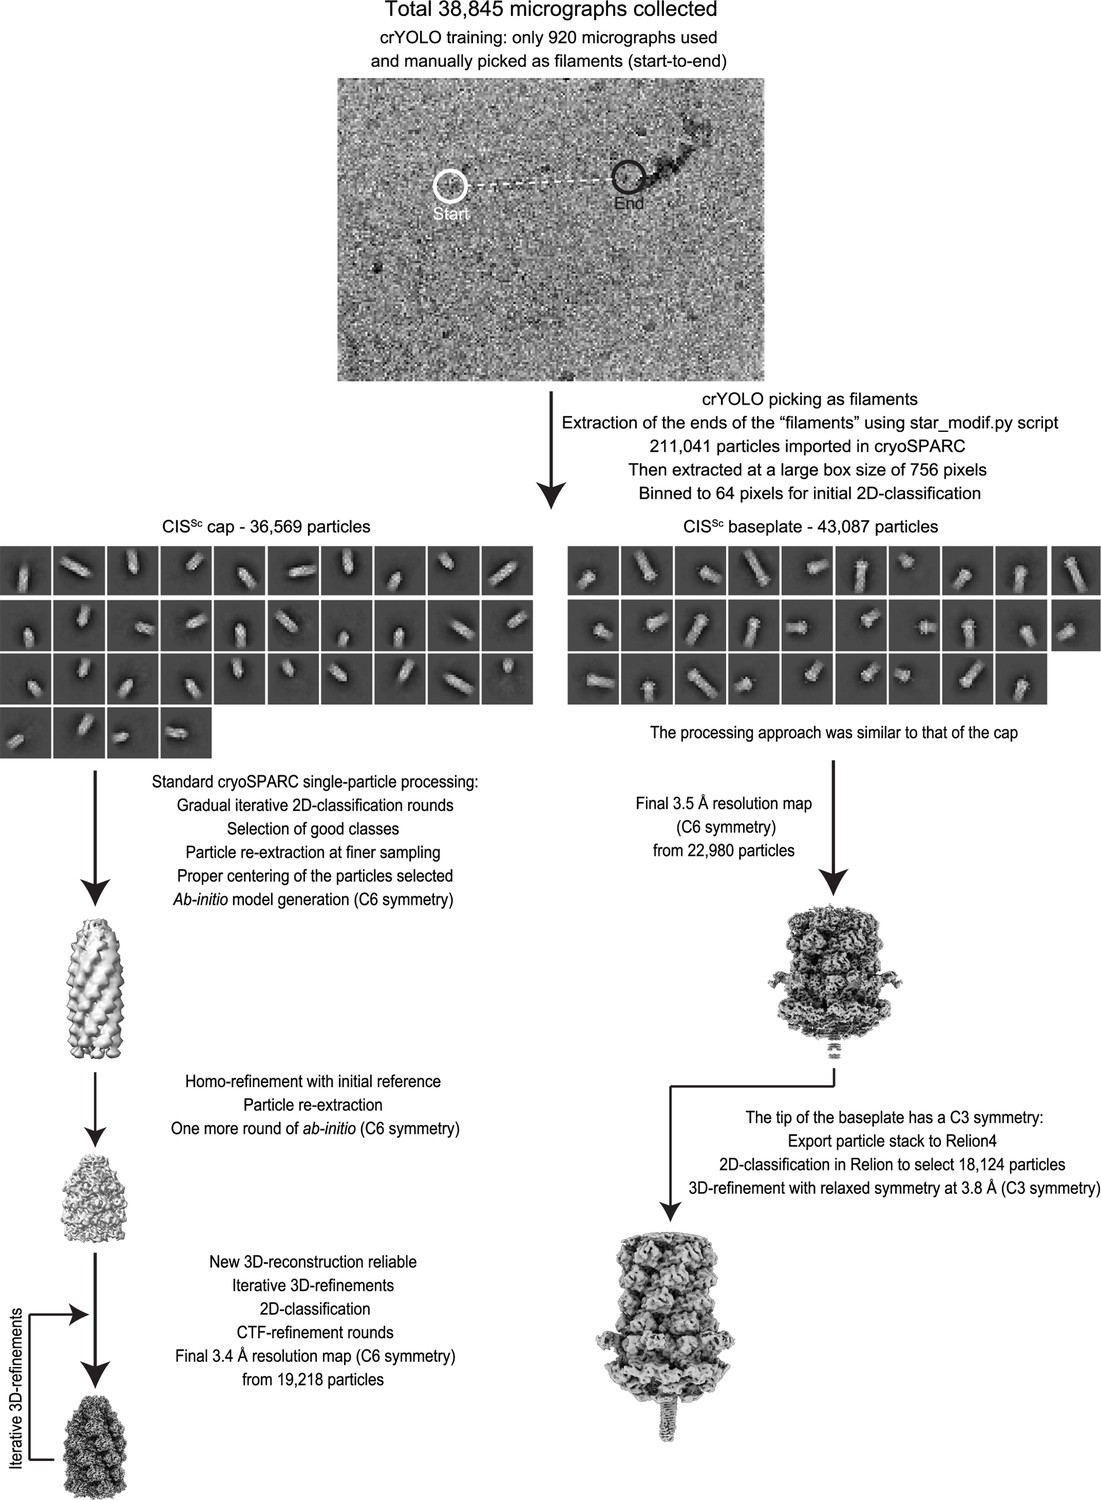
Workflow for the cryoEM structural determination of the extended CISSc.
Flowchart for cryoEM reconstruction of the extended CISSc particle. See Materials and methods and for details.
-
Figure 3—figure supplement 1—source data 1
Cryo-EM data statistical analysis.
- https://cdn.elifesciences.org/articles/104064/elife-104064-fig3-figsupp1-data1-v1.docx
Figure 3—figure supplement 2
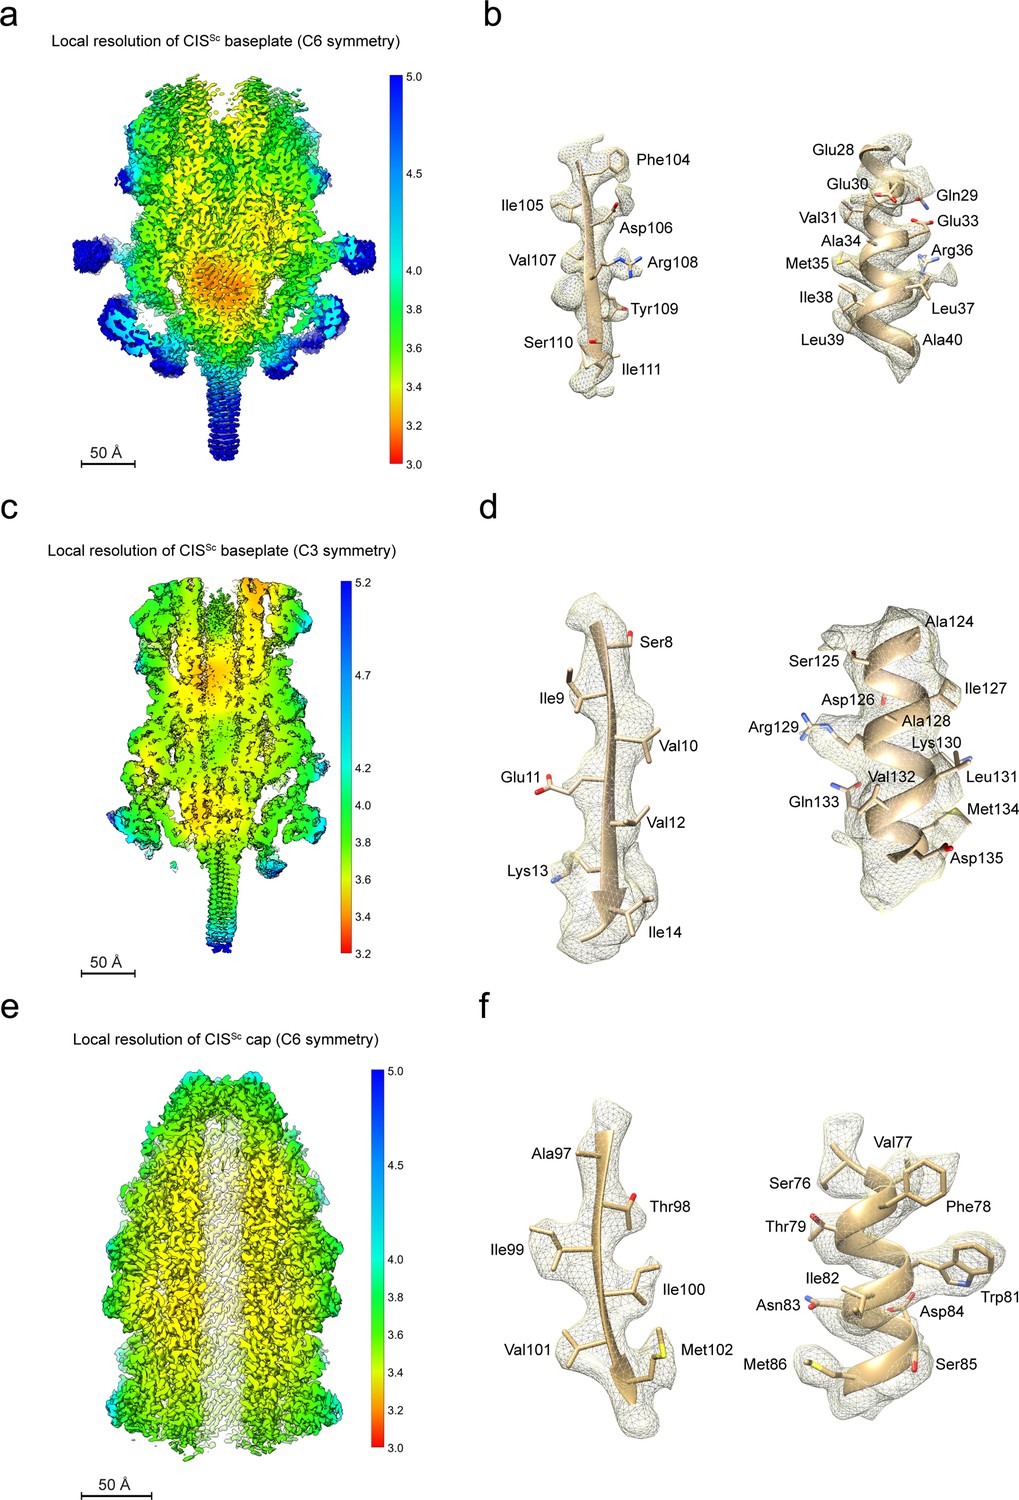
Map qualities of different CISSc modules.
(a–f) Local resolution maps of the CISSc baseplate with C6 symmetry (a), CISSc baseplate with C3 symmetry (c), and the CISSc cap with C6 symmetry (e). (d-f) shows regions of the cryoEM density map (mesh) that were superimposed with the atomic models (ribbons and sticks), demonstrating the agreement between the observed and modeled amino acid side chains for one beta-sheet (left) and one alpha helix (right). Shown are examples of the baseplate with C6 symmetry (b), the baseplate with C3 symmetry (d), and the cap with C6 symmetry (f).
Figure 3—figure supplement 3
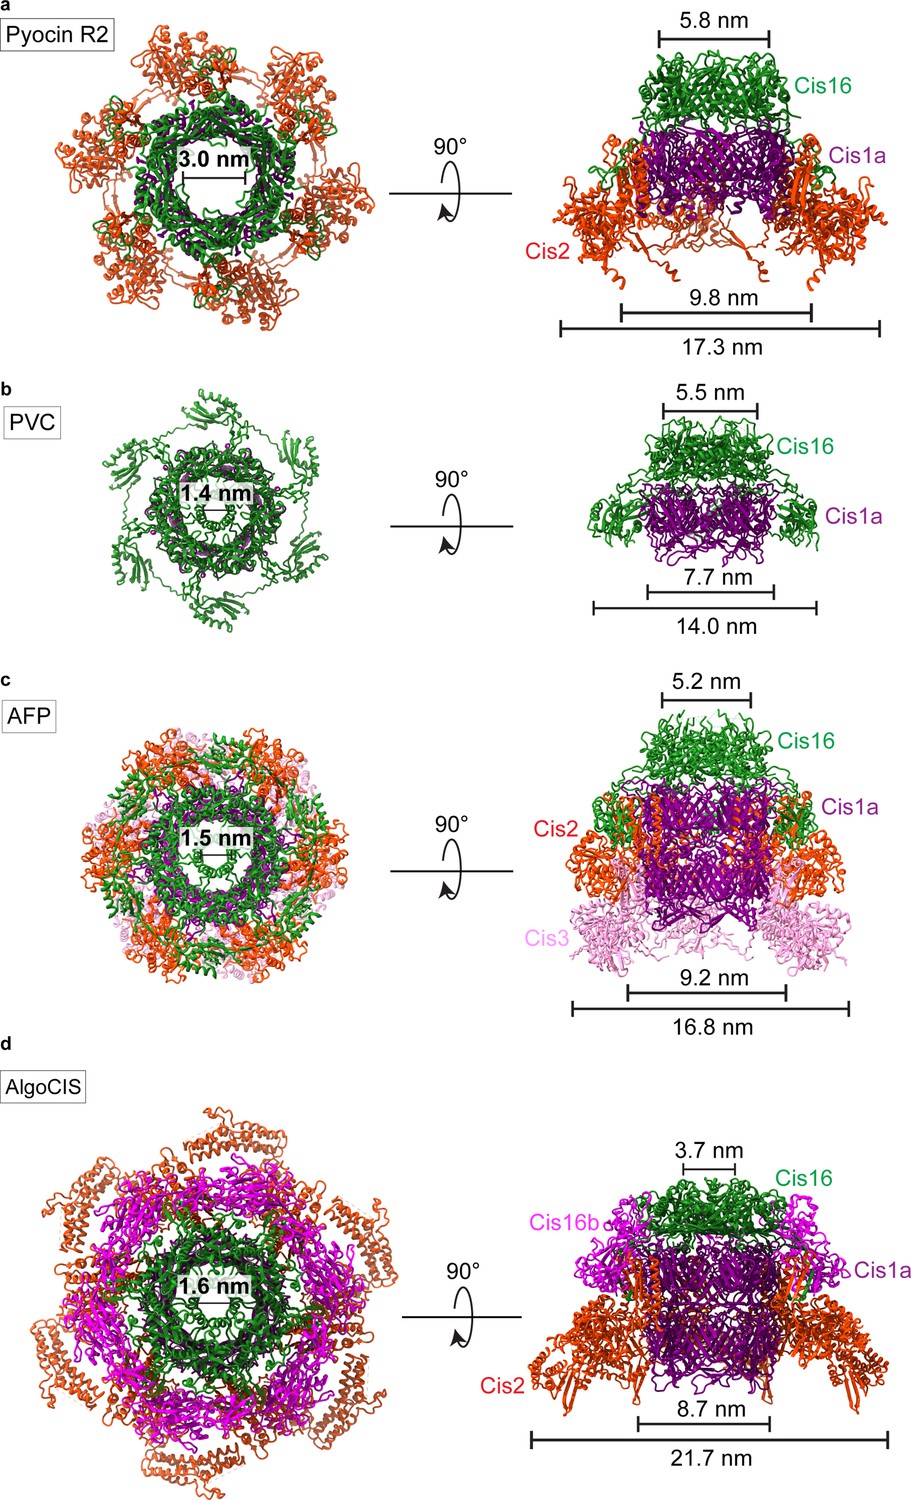
Structures of the cap modules of other CISs.
(a–d) Top views (left) and side views (right) of ribbon representations of the structures of CIS cap modules of Pyocin R2 (a, PDB 6U5B), PVC (b, PDB 6J0N), AFP (c, PDB 6RAP), and AlgoCIS (d, PDB 7ADZ).
Figure 3—figure supplement 4
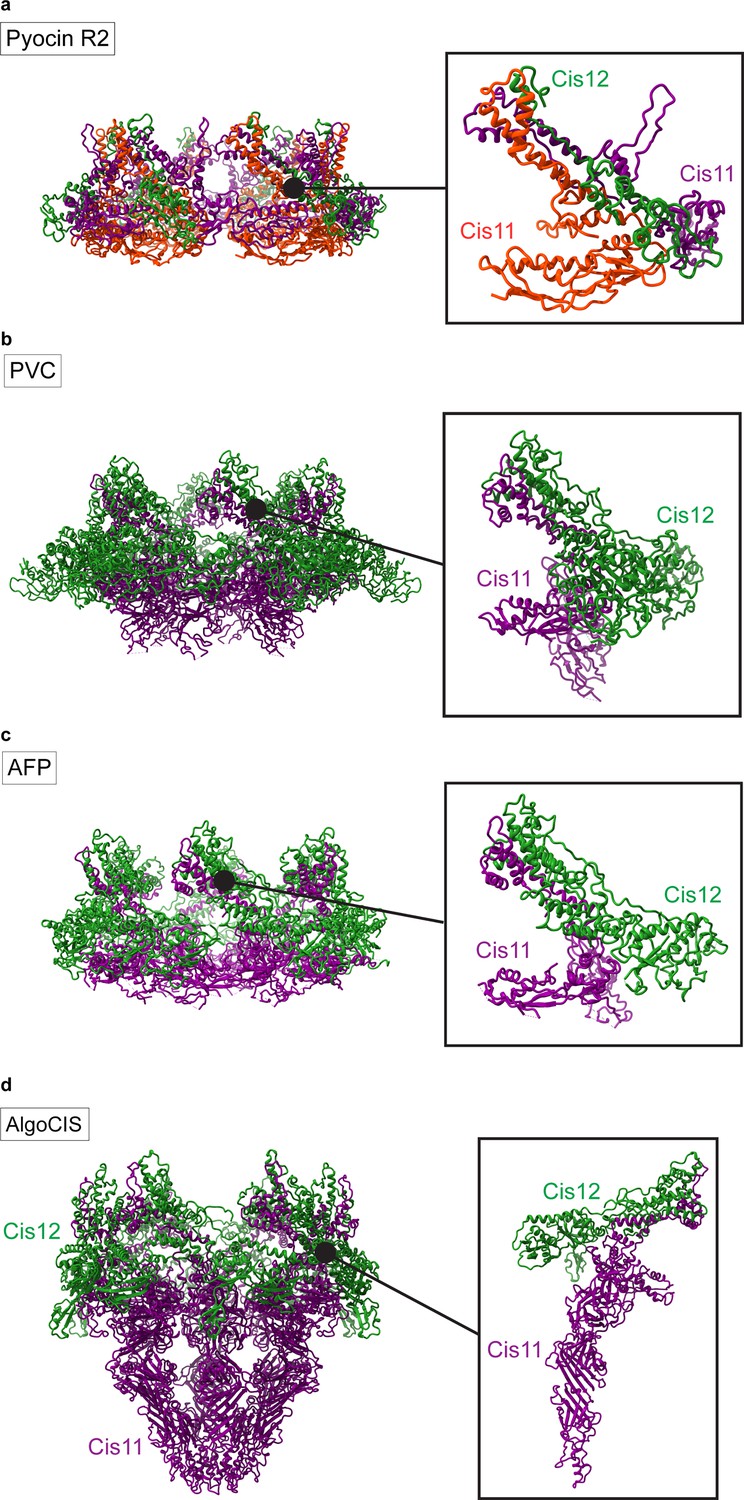
Structures of the baseplate modules of other CISs.
(a–d) Ribbon representations of the full structures (left) and the individual wedge subunit (right) of the CIS baseplate components (Cis11/12) of Pyocin R2 (a, PDB 6U5F), PVC (b, PDB 6J0F), AFP (c, PDB 6RAO), and AlgoCIS (d, PDB 7AEB).
Figure 4
CisA is a single-pass membrane protein predicted to oligomerize.
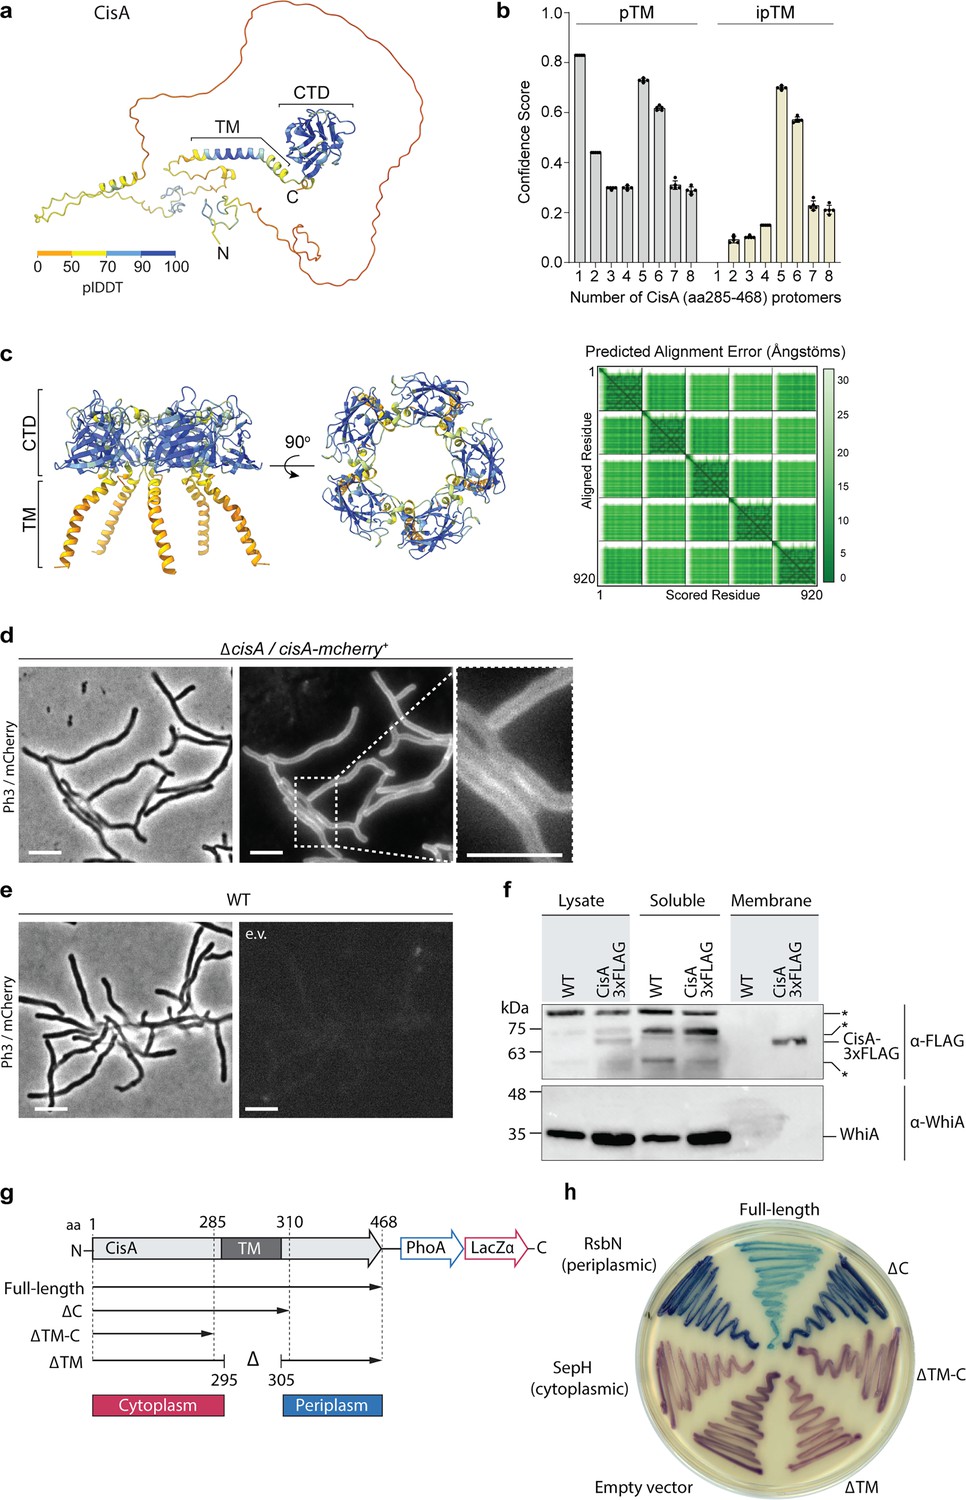
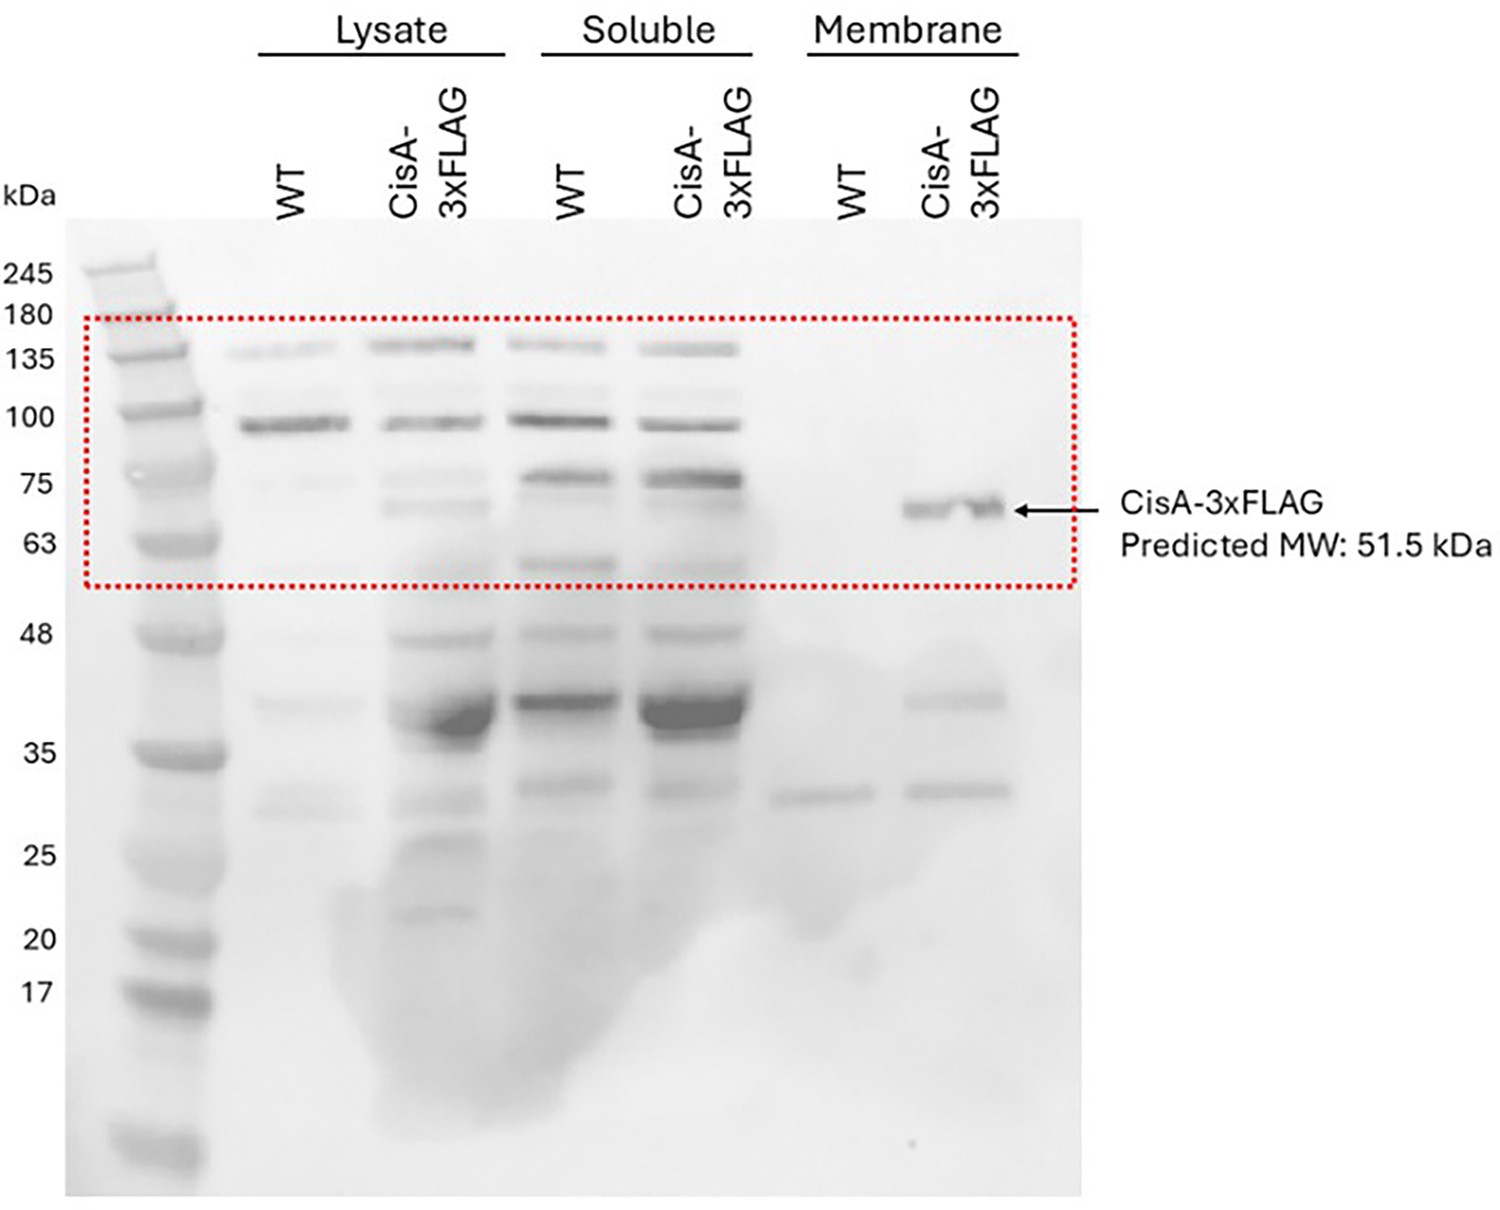
(a) AlphaFold3 model of CisA colored in pLDDT values. CisA is predicted to contain a largely unstructured N-terminal domain, a transmembrane domain (TM), and a conserved C-terminal domain (CTD). (b) Confidence scores for the predicted oligomeric configuration of CisA. Shown are the predicted template modeling (pTM) and the predicted interface pTM scores (ipTM) obtained from n=5 predictions per CisA configuration. An ipTM score greater than 0.7 indicates a likely protein–protein interaction. CisA aa 285–468, including the transmembrane domain and the CTD (amino acid 285–468), was used as input sequences for modeling. (c) AlphaFold3 model of a CisA (amino acids 285–468) pentamer and the corresponding predicted alignment error (PAE) plot. (d, e). Representative micrographs (left panels: phase contrast, Ph3; right panel: mCherry) of strains of S. coelicolor vegetative hyphae either constitutively expressing CisA-mCherry (ΔcisA/cisA-mcherry) in trans (d) or WT cells carrying an empty vector (e.v.) to control for background fluorescence (e). Box shows a magnified region of hyphae with CisA-mCherry accumulation in the cellular periphery. Bars, 5 µm. (f) Western blot of the cellular fractionation of samples from the S. coelicolor WT or the ∆cisA mutant constitutively expressing a CisA-3xFLAG fusion in trans. Lysate and soluble and membrane fractions were probed for the presence of CisA-3xFLAG with an α-FLAG antibody (top). Fractionation efficiency was assessed using an α-WhiA antibody to detect the soluble transcription factor WhiA (bottom). The same volumes for each fraction were loaded and analyzed by immunoblotting. CisA-3xFLAG was detected in the lysate and the membrane fraction. Asterisks denote non-specific signals. The experiment was performed in biological duplicates, and shown is a representative image. (g, h) Experimental determination of the CisA membrane topology using the dual phoA-lacZα reporter in E. coli. The schematic diagram (g) depicts the four CisA constructs used in the assay and indicates the relevant amino acid (aa) deleted in the three CisA mutant derivatives. The analysis of colony coloration (h); pink coloration for cytosolic proteins and blue coloration for periplasmic proteins indicates that the CisA N-terminus is localized in the cytoplasm and the CisA C-terminus is localized to the periplasm, and this topology is dependent on the transmembrane domain (TM). E. coli strains carrying an empty reporter plasmid or reporter plasmids with the Streptomyces genes for SepH (cytoplasmic) and RsbN (periplasmic) were used as controls. Note that the expression of full-length CisA in E. coli is toxic, resulting in reduced growth and a lighter blue coloration.
-
Figure 4—source data 1
AlphaFold3 confidence scores used to generate graph in Figure 4b.
- https://cdn.elifesciences.org/articles/104064/elife-104064-fig4-data1-v1.xlsx
-
Figure 4—source data 2
Uncropped micrographs used to generate Figure 4d, e.
- https://cdn.elifesciences.org/articles/104064/elife-104064-fig4-data2-v1.zip
-
Figure 4—source data 3
Original files for western blot analysis displayed in Figure 4f.
- https://cdn.elifesciences.org/articles/104064/elife-104064-fig4-data3-v1.zip
-
Figure 4—source data 4
Original files of raw immunoblots with relevant bands labeled, related to Figure 4f.
- https://cdn.elifesciences.org/articles/104064/elife-104064-fig4-data4-v1.zip
Figure 5 with 3 supplements
CisA is required for regulated cell death and cellular function of CISSc.
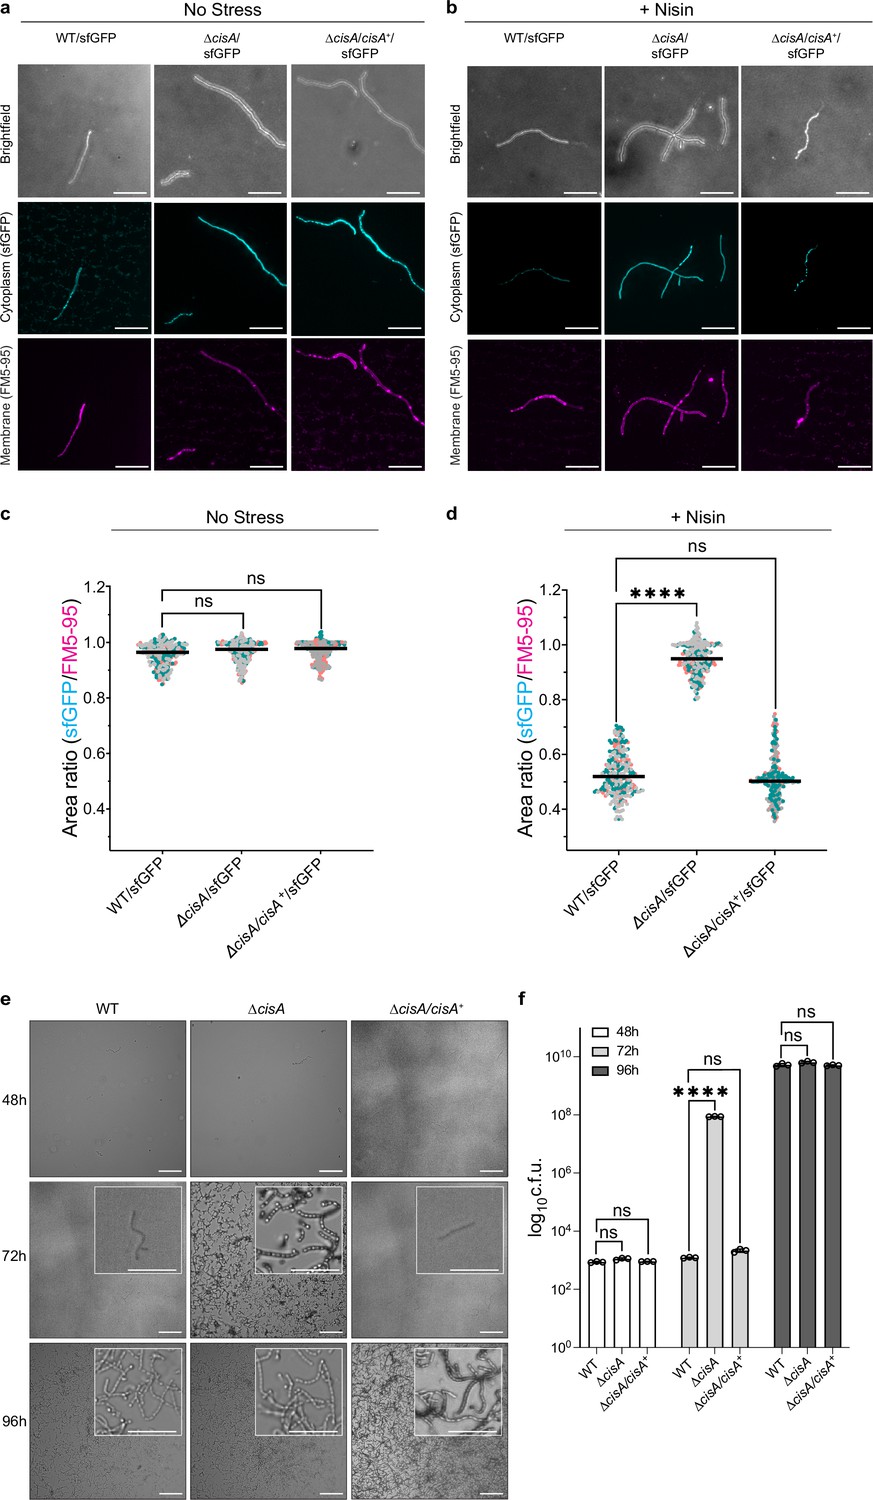
(a-d) Light microscopy-based viability assay showing that CISSc does not mediate cell death in cisA-deficient hyphae in response to exogenous stress. Shown are representative micrographs of the WT/sfGFP, the ∆cisA/sfGFP, and the complemented ∆cisA/cisA+/sfGFP mutant expressing cytosolic sfGFP (indicator for live cells). Strains were grown for 48 hr and then either incubated without (a) or with (b) the membrane-disrupting antibiotic nisin (1 µg/ml nisin for 90 min). Samples were briefly vortexed to break up mycelial clumps and subsequently stained with the fluorescent membrane dye FM5-95. Bars, 10 µm. Z-stacks were taken of the samples, and the resulting relative fluorescence ratios of sfGFP to FM5-95 are shown in c, d. WT and ∆cisA/cisA+ + cells showed a significantly higher rate of cell death in response to nisin treatment than ∆cisA cells. There is no significant difference in the viability of the tested strains in the absence of nisin. Experiments were performed in three biological replicates, as indicated by the green, gray, and magenta data points. Black lines indicate the mean ratio derived from biological triplicate experiments (n=100 images per replicate). ns (not significant) and **** (p < 0.0001) were determined using a one-way ANOVA and Tukey’s post-test. (e) Visualization of spore production in WT, ∆cisA mutant, and ∆cisA/cisA+ reveals accelerated cellular development and sporulation of the ∆cisA mutant. Shown are representative brightfield images of surface impressions of plate-grown colonies of each strain taken at the indicated time points. Only sporulating hyphae will attach to the hydrophobic surface of the cover glass. Insets show magnified regions of the colony surface containing spores and spore chains. Bars, 50 µm. (f) Quantification of sporulation shown in (e) via counts of colony-forming units (c.f.u.). The graph shows a sixfold higher c.f.u. count at 72 h in the ∆cisA mutant. Strains were grown on R2YE agar, and spores were harvested after 48 hr, 72 hr, and 96 hr of incubation. Data show mean ± s.d. obtained from biological triplicate experiments. ns (not significant) and **** (p < 0.0001) were determined using a one-way ANOVA and Tukey’s post-test.
-
Figure 5—source data 1
Raw data for Figure 5c, d.
- https://cdn.elifesciences.org/articles/104064/elife-104064-fig5-data1-v1.xlsx
-
Figure 5—source data 2
Raw data for Figure 5f.
- https://cdn.elifesciences.org/articles/104064/elife-104064-fig5-data2-v1.xlsx
Figure 5—figure supplement 1
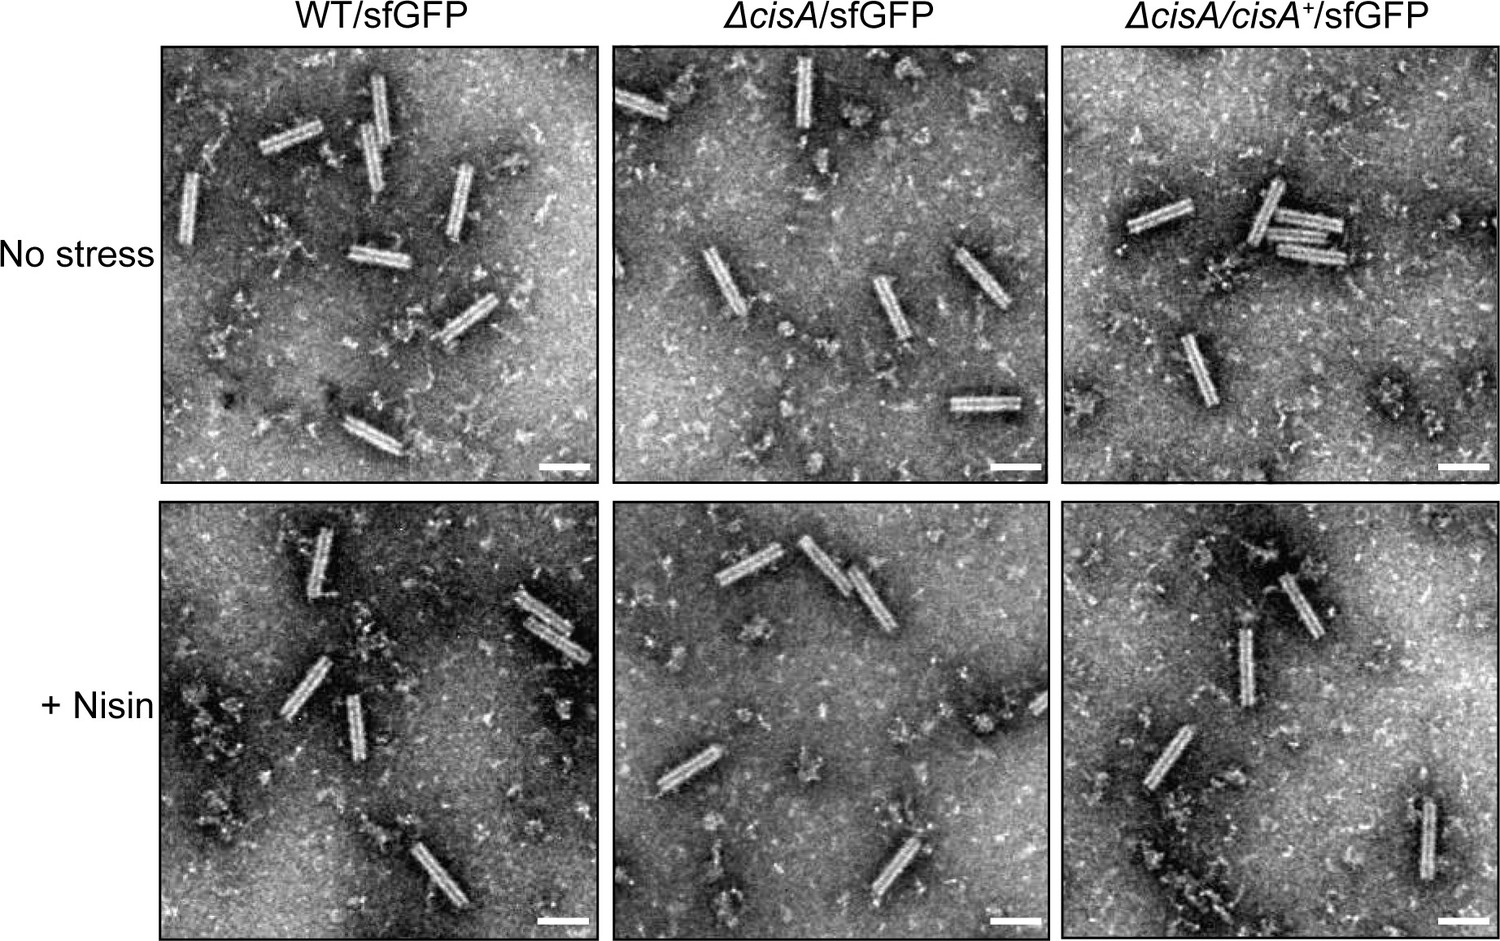
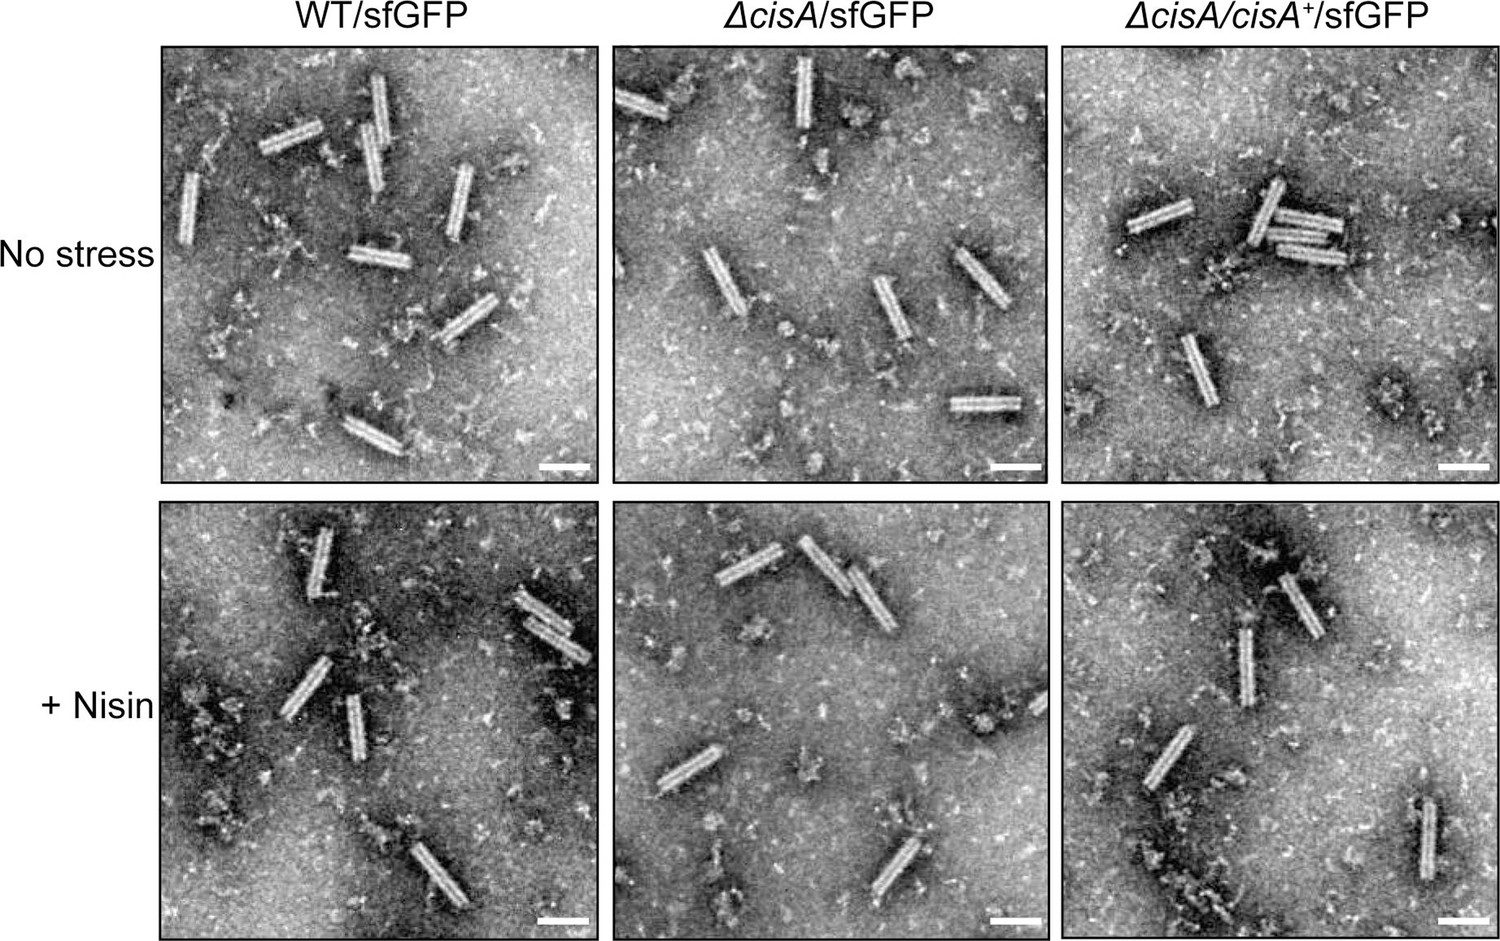
Control experiment showing that the behavior of purified CISSc particles is wild-type-like in the strains used in the viability assay.
Representative negative-stain electron micrographs of purified CISSc particles from the WT/sfGFP, the ∆cisA/sfGFP mutant, and the ∆cisA/∆cisA+/sfGFP complemented mutant exposed to no stress (upper row) or 1 µg/ml nisin (lower row). No differences were observed between the overall structure of CISSc particles. These experiments were performed three independent times. Bars, 100 nm.
Figure 5—figure supplement 2
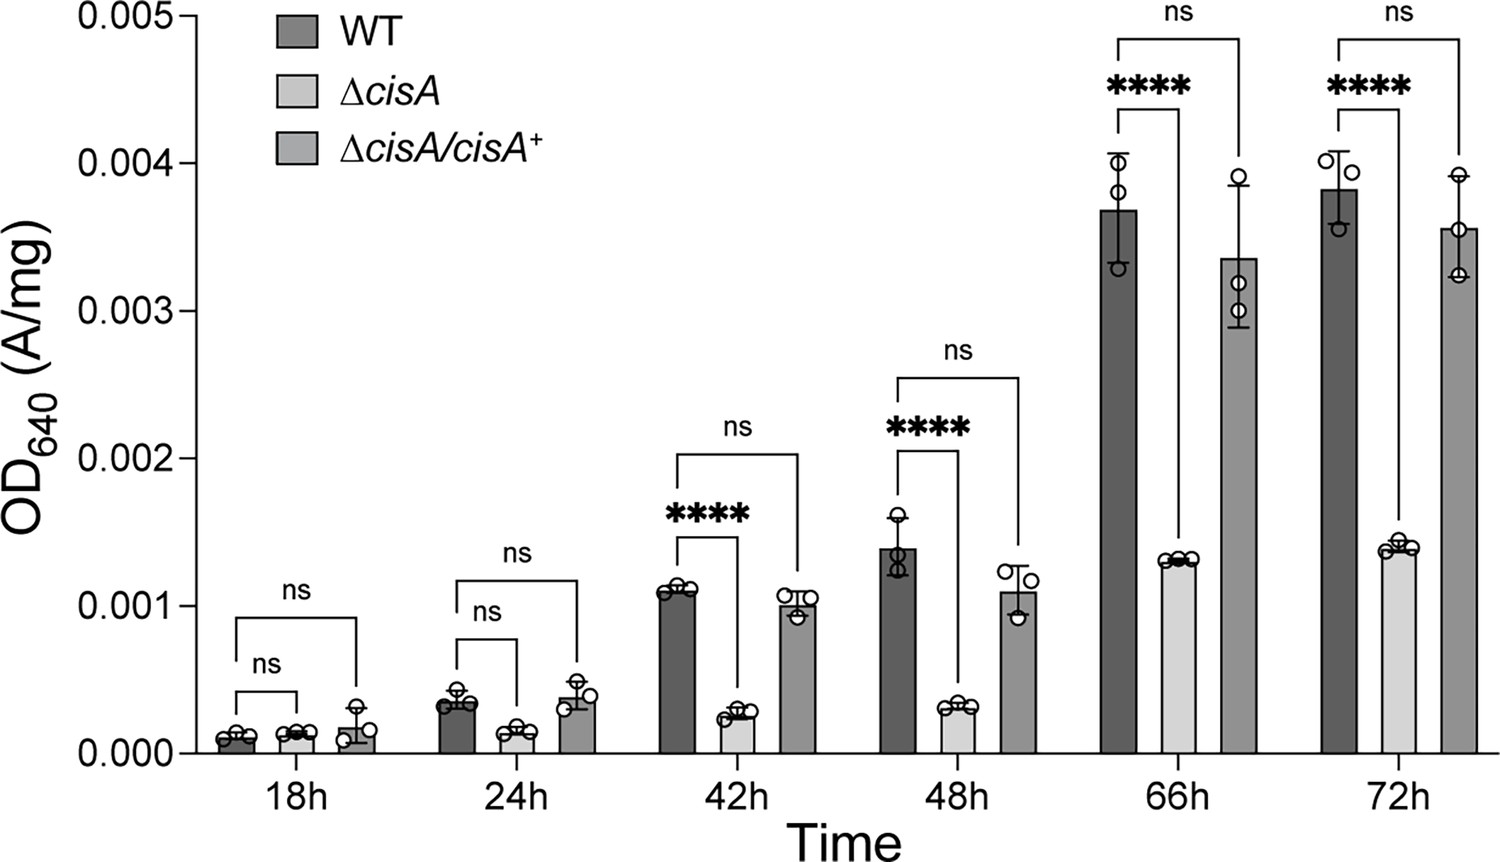
CisA impacts secondary metabolite production.
Quantification of total actinorhodin production by the WT, the ∆cisA mutant, and the complemented ∆cisA/∆cisA+ mutant grown in R2YE medium, revealing reduced actinorhodin production in the ∆cisA mutant. Samples were taken at the indicated time points. Actinorhodin was extracted and quantified by measuring the optical density OD640 of the culture supernatant and normalized to the wet cell pellet weight. Analyses were performed in biological triplicate experiments. The mean values and standard error are shown. ns (not significant) and **** (p < 0.0001) were calculated using one-way ANOVA and Tukey’s post-test.
-
Figure 5—figure supplement 2—source data 1
Raw data for Figure 5—figure supplement 2.
- https://cdn.elifesciences.org/articles/104064/elife-104064-fig5-figsupp2-data1-v1.xlsx
Figure 5—figure supplement 3
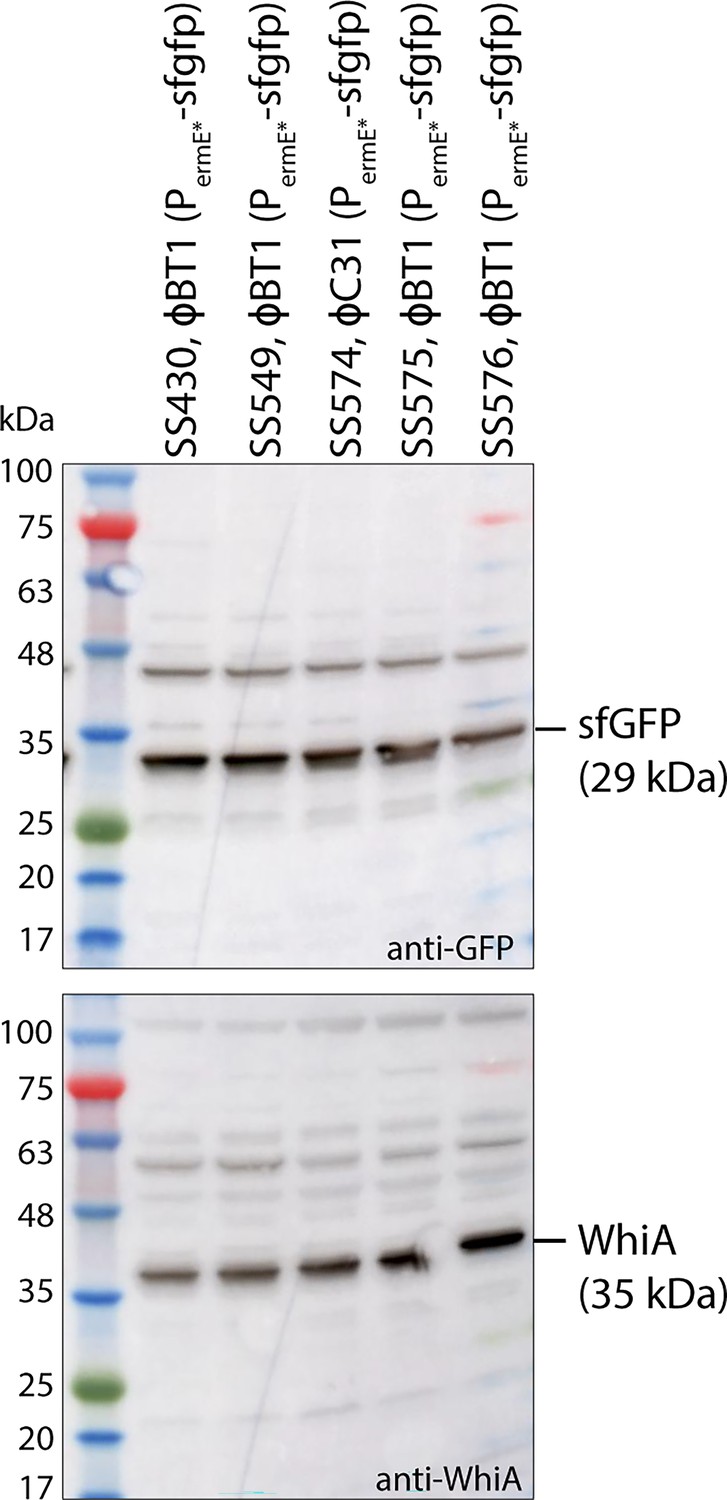
Control experiment showing equal level of cytoplasmic sfGFP in the different strains used for the analysis, displayed in Figure 5a, b.
-
Figure 5—figure supplement 3—source data 1
Original files for western blot analysis shown in Figure 5—figure supplement 3.
- https://cdn.elifesciences.org/articles/104064/elife-104064-fig5-figsupp3-data1-v1.zip
-
Figure 5—figure supplement 3—source data 2
Original files of raw immunoblots with relevant bands labeled, related to Figure 5—figure supplement 3.
- https://cdn.elifesciences.org/articles/104064/elife-104064-fig5-figsupp3-data2-v1.zip
Figure 6 with 2 supplements
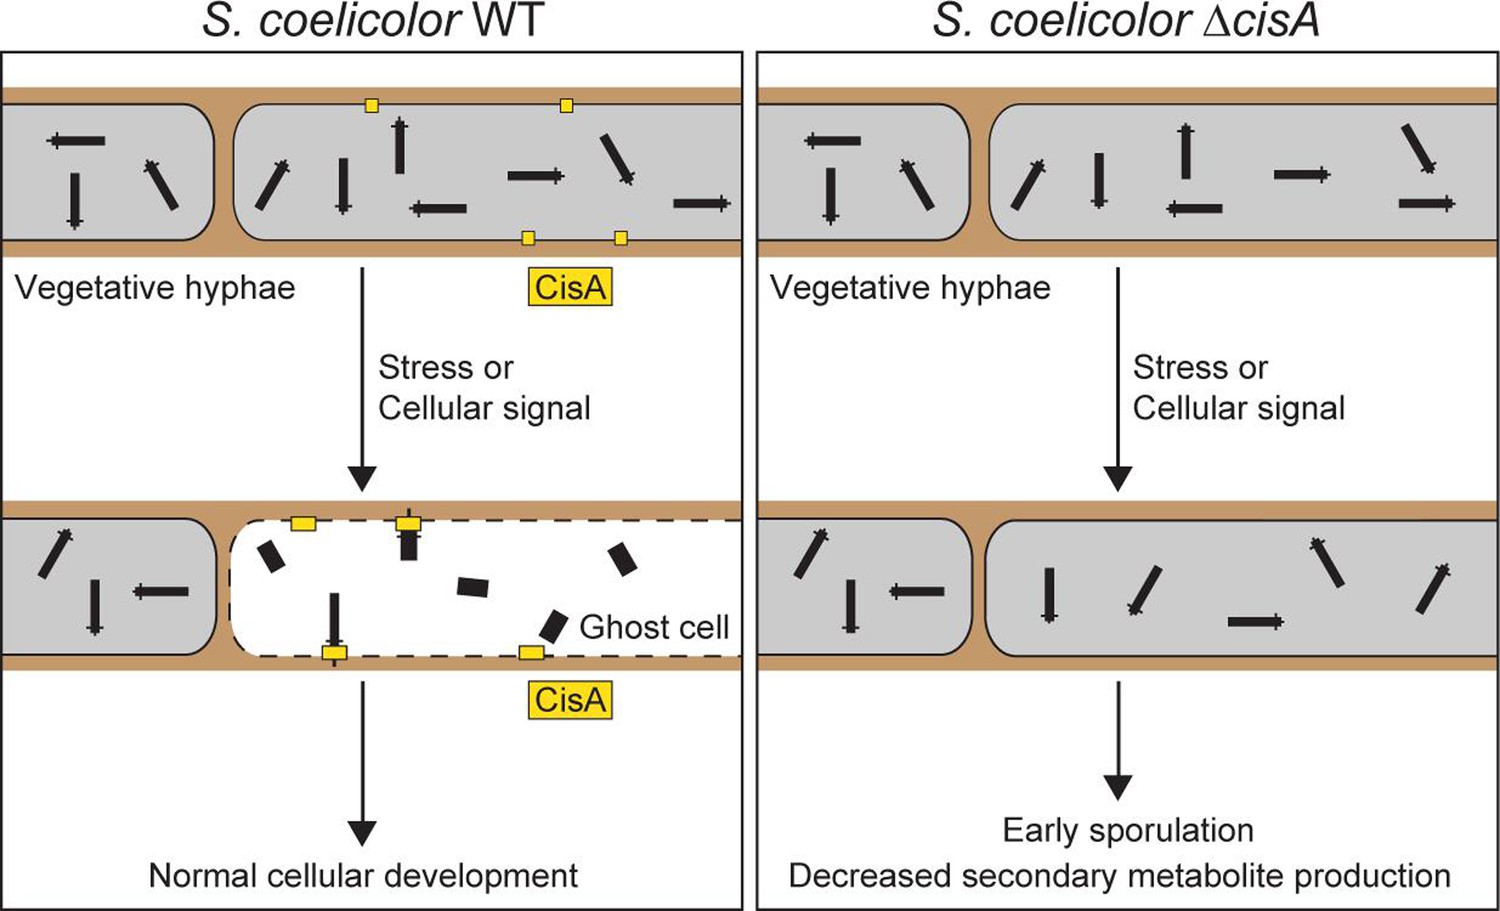
Proposed role of the membrane protein CisA in mediating the contraction and firing of cytoplasmic CISSc in Streptomyces coelicolor.
In response to exogenous stress or an unknown cellular signal, membrane-bound CisA either directly or indirectly mediates the association of free-floating CISSc particles with the cytoplasmic membrane. This interaction triggers CISSc firing and cell death. In hyphae lacking cisA, CISSc particles mostly remain in their extended (non-contracted) state, leading to reduced hyphal cell death and, consequently, affecting the developmental life cycle of Streptomyces.
Figure 6—figure supplement 1
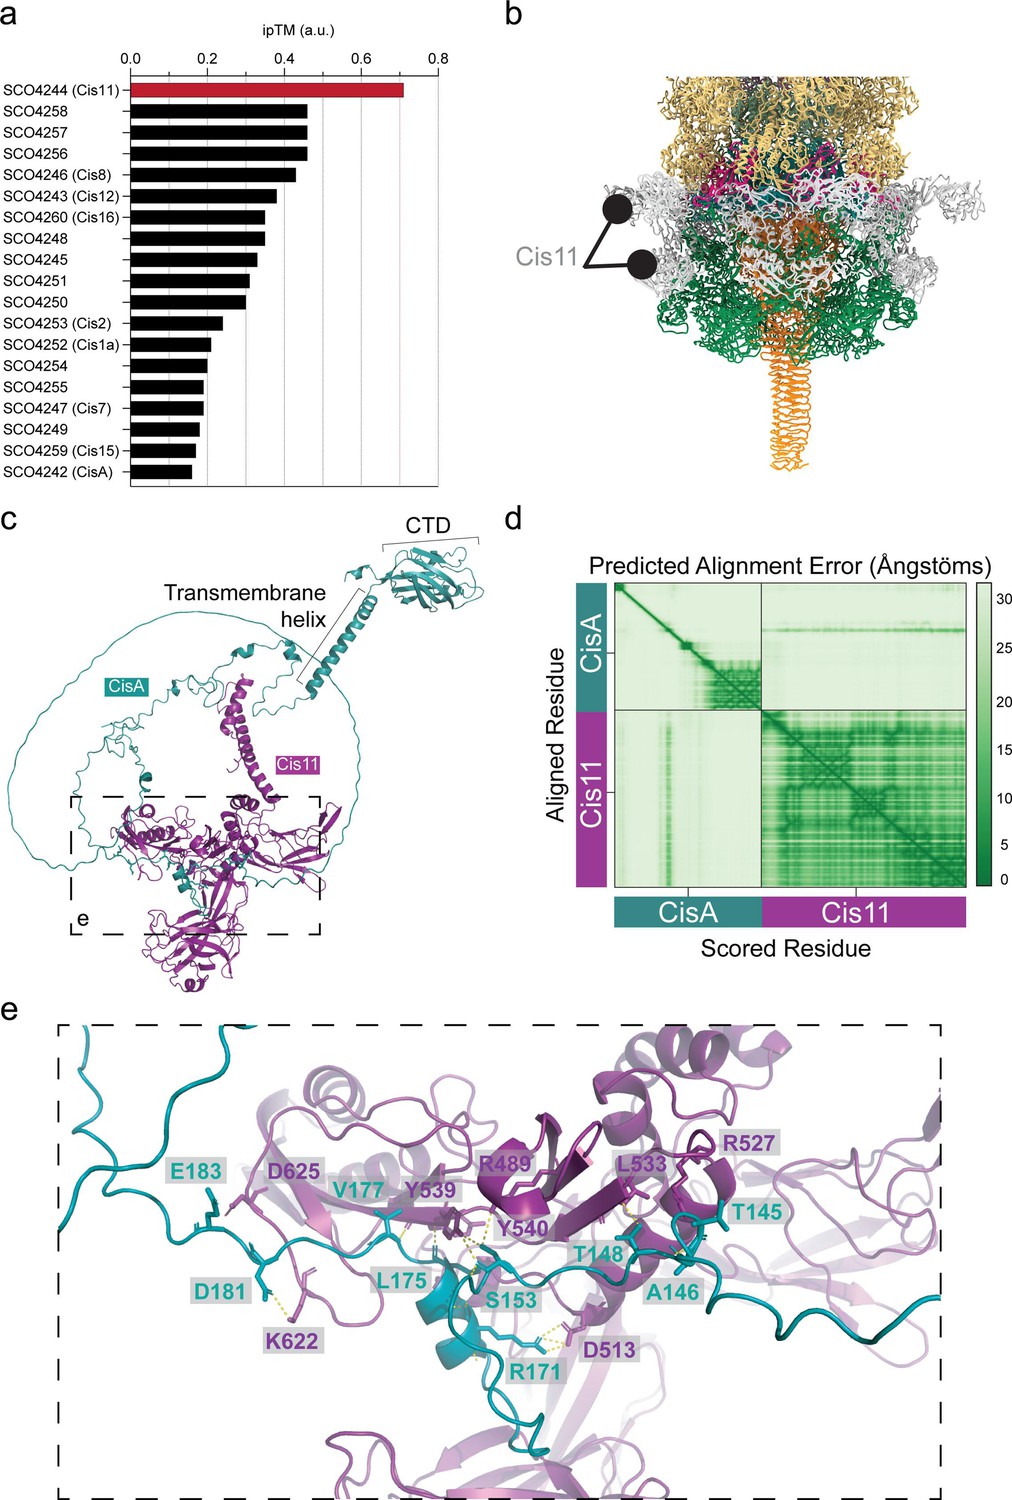
In silico protein-protein interaction analyses predict that CisA binds a CISSc baseplate component.
(a) An AlphaFold2-Multimer-based protein-protein interaction screen between monomeric CisA and the 19 gene products of the CISSc gene cluster suggests an interaction between CisA and the baseplate component Cis11. The likelihood of a protein-protein interaction was ranked based on the interface pTM (ipTM) confidence score, with an ipTM greater than 0.7 indicating a potential protein-protein interaction. (b) Zoomed-in view of the SPA-cryoEM structure of the CISSc baseplate complex (Figure 3b, d), illustrating the peripheral and surface-exposed position of Cis11. (c) The AlphaFold3 model of the CisA-Cis11 complex. The conserved C-terminal domain (CTD) of CisA is in the periplasm. (d) The AlphaFold3 predicted aligned error (%) heatmap plot of the concatenated Cis11 and CisA input sequence. (e) Zoomed-in view of the relevant side chains at the CisA-Cis11 interface.
-
Figure 6—figure supplement 1—source data 1
LazyAF output with confidence scores for in silico prediction of protein-protein interactions between monomeric CisA and CISSc components.
- https://cdn.elifesciences.org/articles/104064/elife-104064-fig6-figsupp1-data1-v1.xlsx
-
Figure 6—figure supplement 1—source data 2
Structural model shown in Figure 6—figure supplement 1e.
- https://cdn.elifesciences.org/articles/104064/elife-104064-fig6-figsupp1-data2-v1.zip
Figure 6—figure supplement 2
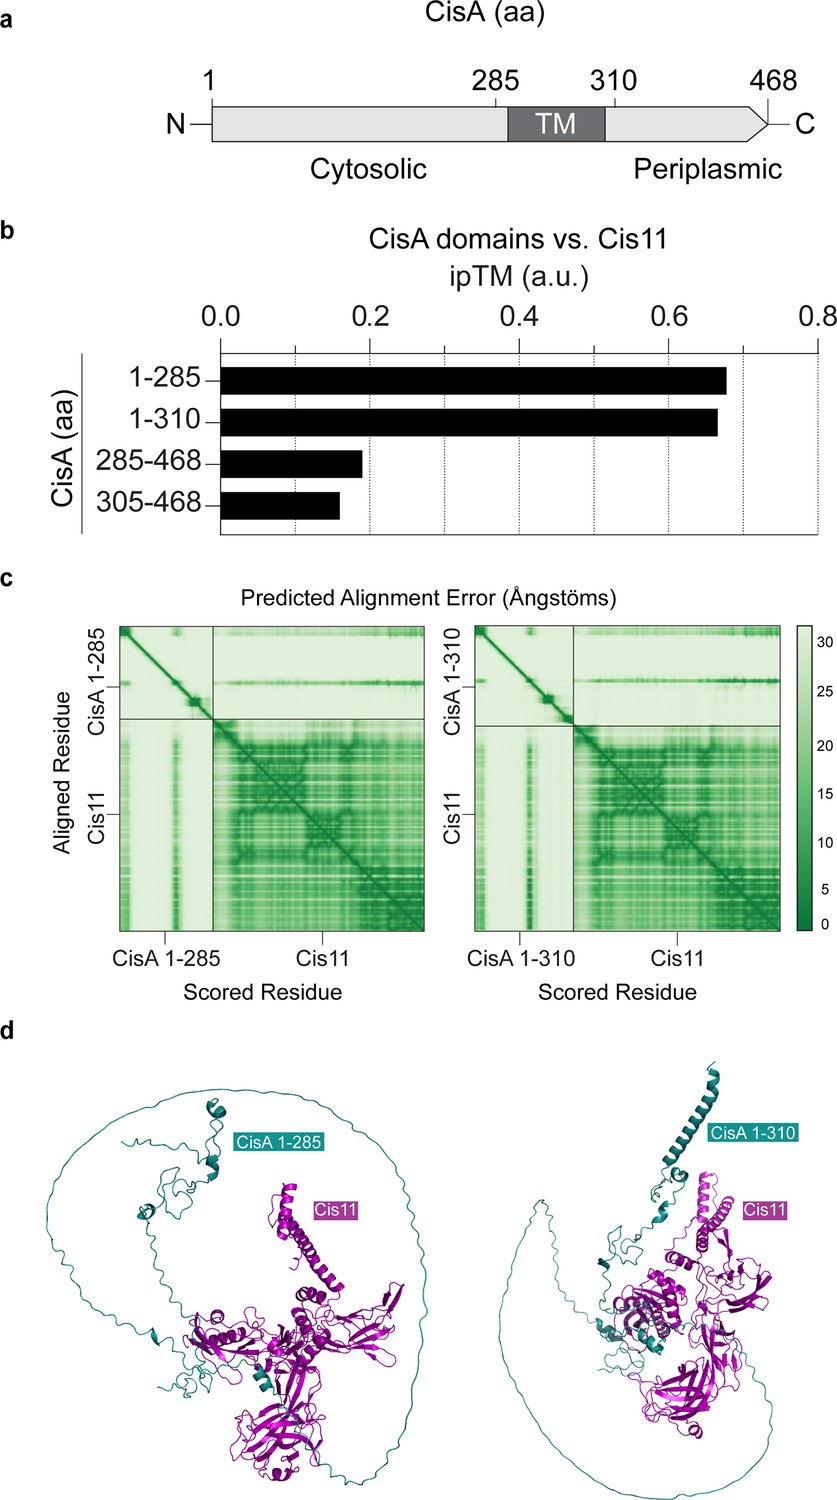
The cytosolic part of CisA is predicted to interact with Cis11.
(a) Schematic showing the CisA domain organization. Relevant amino acid (aa) positions are shown above. TM, transmembrane domain. (b) AlphaFold2-Multimer based protein-protein interaction screen between monomers of CisA and truncated versions of CisA and Cis11. The likelihood of a protein-protein interaction was ranked based on the interface pTM (ipTM) confidence score. (c, d) Predicted CisA-Cis11 complexes using truncated versions of CisA (aa 1–285 and 1–310) show that the largely unstructured cytosolic portion of CisA is required to interact with Cis11. (c) The AlphaFold3 predicted aligned error (%) heatmap plots of the concatenated Cis11 and truncated CisA 1–285 and CisA 1–310 input sequences. (d) The AlphaFold3 model of the CisA (aa1-285)-Cis11 (left) and CisA (aa1-310)-Cis11 (right) complexes.
-
Figure 6—figure supplement 2—source data 1
Structural models shown in Figure 6—figure supplement 2d.
- https://cdn.elifesciences.org/articles/104064/elife-104064-fig6-figsupp2-data1-v1.zip
Author response image 1
Additional files
-
Supplementary file 1
Complete list of strains and plasmids used in this study.
- https://cdn.elifesciences.org/articles/104064/elife-104064-supp1-v1.docx
-
Supplementary file 2
Oligonucleotides used in this study.
- https://cdn.elifesciences.org/articles/104064/elife-104064-supp2-v1.docx
-
MDAR checklist
- https://cdn.elifesciences.org/articles/104064/elife-104064-mdarchecklist1-v1.docx
Download links
A two-part list of links to download the article, or parts of the article, in various formats.
Downloads (link to download the article as PDF)
Open citations (links to open the citations from this article in various online reference manager services)
Cite this article (links to download the citations from this article in formats compatible with various reference manager tools)
Function and firing of the Streptomyces coelicolor contractile injection system requires the membrane protein CisA
eLife 14:RP104064.
https://doi.org/10.7554/eLife.104064.3


