Integration of parallel pathways for flight control in a hawkmoth reflects prevalence and relevance of natural visual cues
- Behavioral Physiology and Sociobiology (Zoology II), University of Würzburg, Biozentrum am Hubland, Germany
- Department of Biology, University of Konstanz, Germany
Figures
Figure 1

Optic flow and directional responses partition the visual field for flight control in the hummingbird hawkmoth.
Flight control in most insects is strongly based on optic flow, the apparent movement of the environment across the visual field, induced by the animals’ own movement. Ventrolateral translational optic flow supports straight flight, compared to featureless environments. Most insects keep the magnitude of translational optic flow constant across their eyes by adjusting their speed and perpendicular distance to optic flow-inducing textures. In hawkmoths, optic flow cues presented in the dorsal visual field induce directional responses, which align the hawkmoths’ flight with the main direction of the visual cue. Moreover, hawkmoths avoid any structures in the dorsal, but not the ventral, visual field, even if they generate only weak translational optic flow.
Figure 2
Optic flow-based flight control and dorsal directional responses.
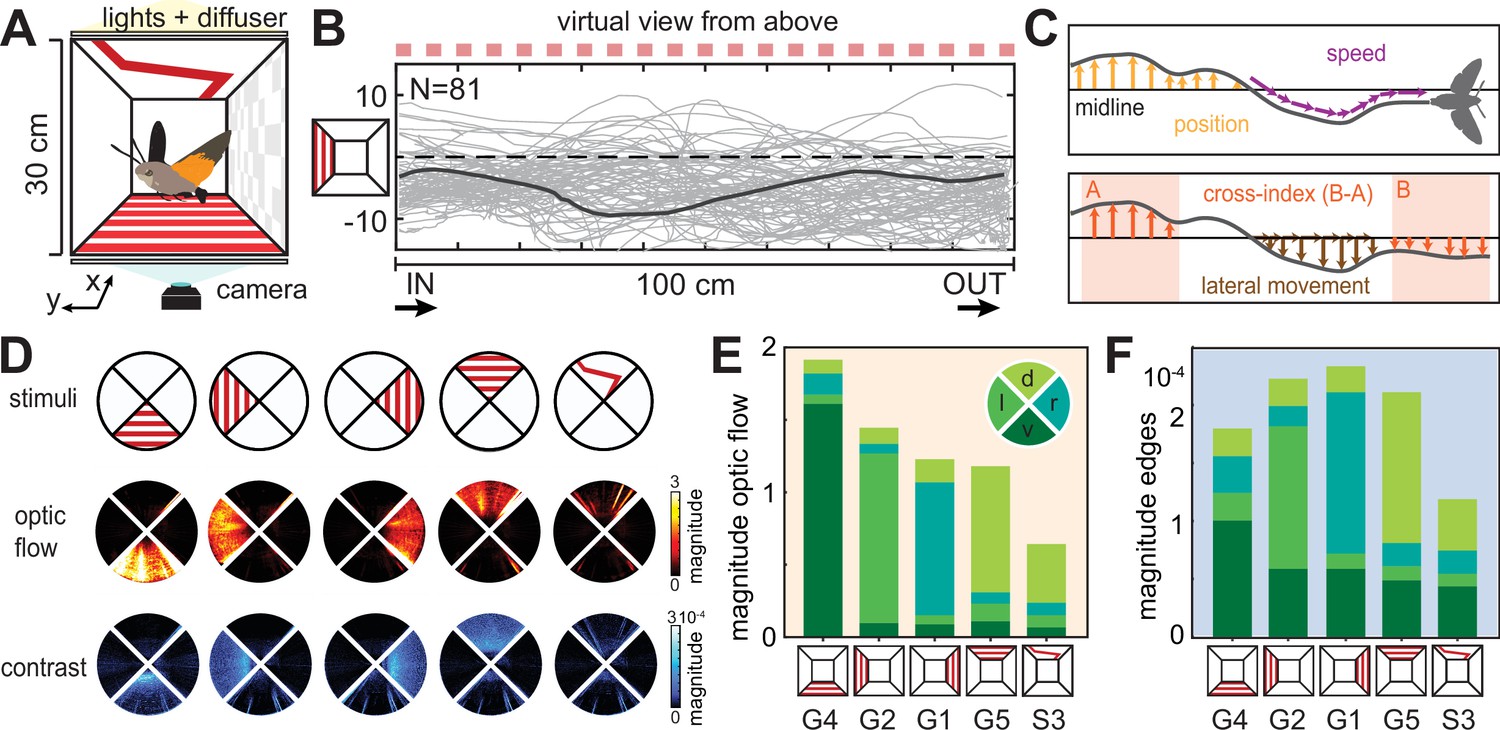
(A) Hawkmoth flight behaviour was tested in a 100 cm long, 30-by-30 cm wide and high tunnel, in which visual patterns could be presented on any side to generate translational optic flow and directional cues. (B) The hawkmoths’ flight paths (virtually rotated to be shown from above the tunnel, with a grating pattern on the left tunnel side indicated as red squares) were digitised with a camera mounted below the tunnel. N gives the number of flights. The dark grey line highlights one representative path. (C) From the flight paths, we quantified the median position off the midline, the average frame-by-frame speed, the proportion of lateral movement (as the ratio of frame-by-frame movement perpendicular and parallel to the longitudinal axis of the tunnel), and the cross-index; the difference in lateral position in the first and last third of the tunnel. (D) Heatmaps of the magnitude of translational optic flow (middle row) and contrast edges (bottom row) in the different tunnel conditions (top row) used in conflict experiments. (E, F) Stacked bars present the average magnitude of translational optic flow (E) and contrast edges (F) in each of the four quadrants (ventral, left, right, and dorsal) in the five tunnel conditions depicted in (D). For the letter-number identifiers of each condition, see Supplementary file 1.
Figure 3 with 1 supplement

Optic flow-based flight control and dorsal directional responses.
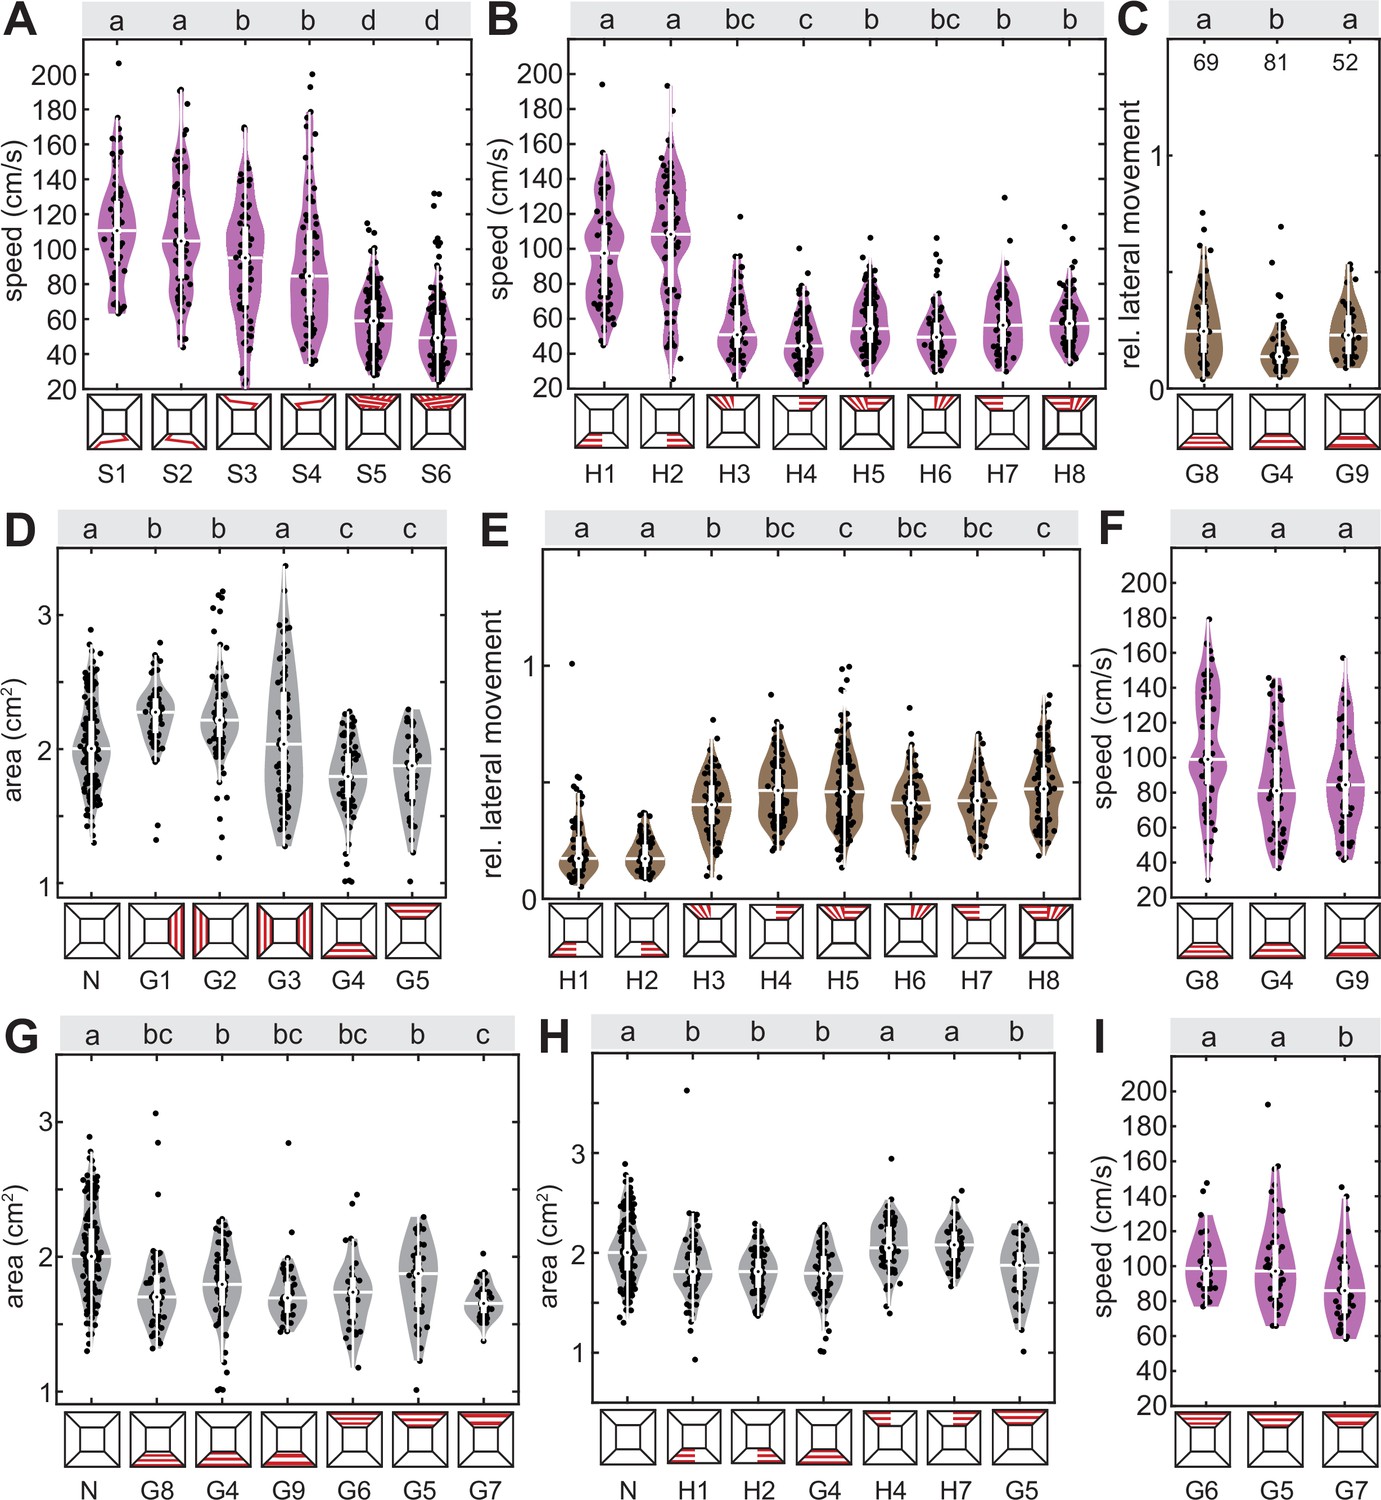
(A–C) Median position, average speed, and proportion of lateral movement with grating patterns on either tunnel side. (D) Cross-index with a red stripe which changed its position in the central third of the tunnel, crossing from one tunnel side to the other. The last two conditions present a version of this stripe, which repeated at the same spatial frequency as the grating patterns. (E) Proportion of lateral movement with gratings of different spatial frequencies (repeating every 3 cm, 6 cm, and 12 cm), mounted to the tunnel ceiling. (F) Median position of flight tracks with gratings perpendicular (generating strong translational optic flow) and parallel (weak translational optic flow) to the tunnel’s longitudinal axis, covering one side of either the tunnel ceiling or floor. Black letters show statistically significant differences in group means or median, depending on the normality of the test residuals (see ‘Materials and methods’, confidence level: 5%). The red letters in (A) represent statistically significant differences in group variance from pairwise Brown–Forsythe tests (significance level 5%). Conditions with different letters were significantly different from each other. The white boxplots depict the median and 25–75% range, the whiskers represent the data exceeding the box by more than 1.5 interquartile ranges, and the violin plots indicate the distribution of the individual data points shown in black. For the letter-number identifiers below each condition, as well as each sample size, see Supplementary file 1.
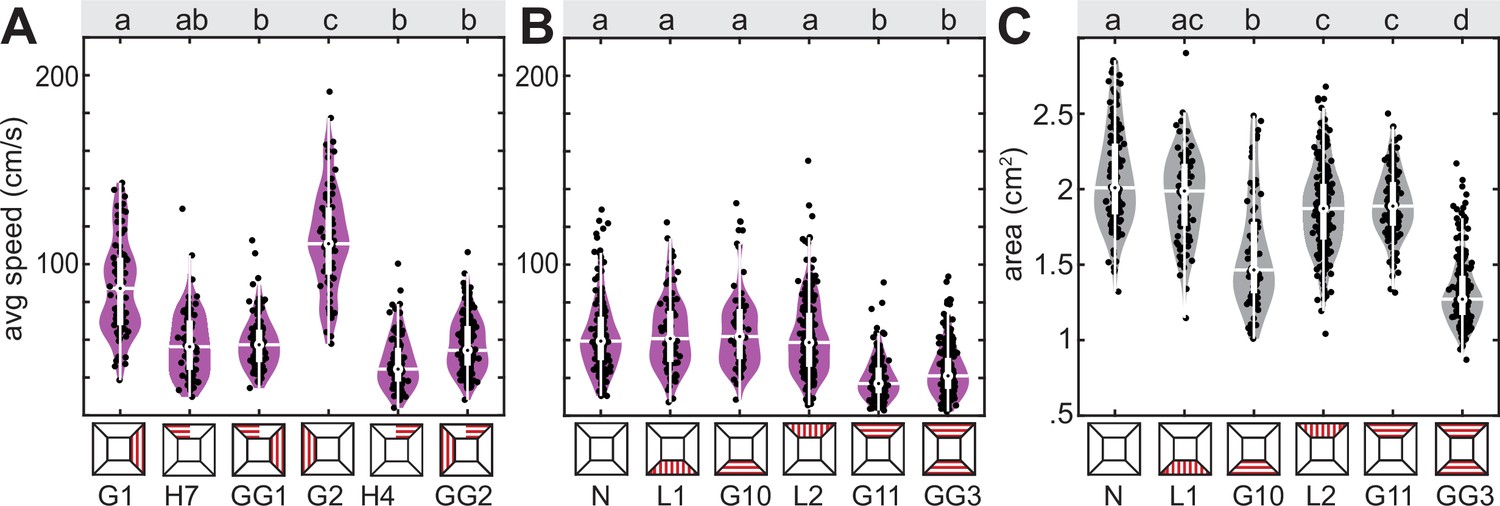
Figure 3—figure supplement 1
Optic flow-based flight control and dorsal directional responses.
(A) Average speed of flight paths with a red stripe which changed its position in the central third of the tunnel, crossing from one tunnel side to the other. The last two conditions present a version of this stripe, which repeated at the same frequency as the grating patterns. (B, E) Average speed and proportion of lateral movement of flight paths with gratings perpendicular (generating strong translational optic flow) and parallel (weak translational optic flow) to the tunnel’s longitudinal axis, covering one side of either the tunnel ceiling or floor. (C, F, I) Proportion of lateral movement and average speed with gratings of different spatial frequencies (repeating every 3 cm, 6 cm, and 12 cm), mounted on the tunnel floor or ceiling, respectively. (D, G, H) Area of hawkmoth silhouette in tunnel videos as a measure of their flight height above the tunnel floor (the smaller the area, the higher the hawkmoths) with grating patterns (D) on either tunnel side, (G) gratings of various spatial frequencies mounted ventrally and dorsally, and (H) gratings covering half the tunnel or the full tunnel ventrally and dorsally. Black letters show statistically significant differences in group means or median, depending on the normality of the test residuals (see ‘Materials and methods’, confidence level: 5%). Conditions with different letters were significantly different from each other. The white boxplots depict the median and 25–75% range, the whiskers represent the data exceeding the box by more than 1.5 interquartile ranges, and the violin plots indicate the distribution of the individual data points shown in black. For the letter-number identifiers below each condition, as well as each sample size, see Supplementary file 1.
Figure 4 with 1 supplement

Cue conflict: lateral optic flow and dorsal directional cues.
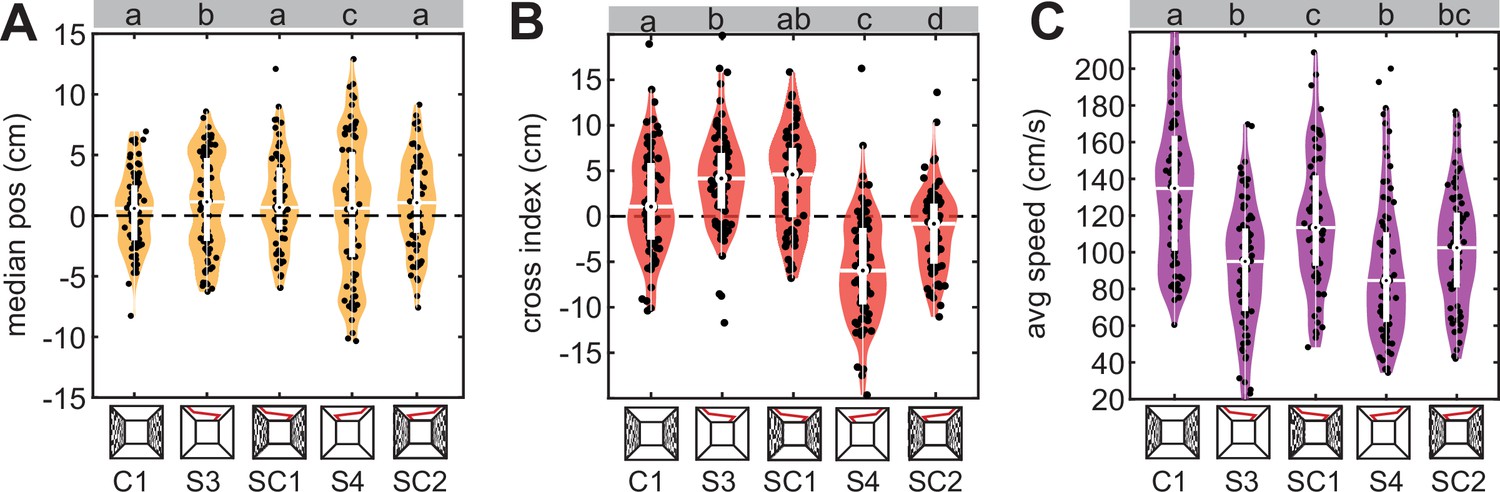
(A, B) Flight tracks of hawkmoths virtually rotated to be shown from above the tunnel, which were presented with a lateral grating inducing translational optic flow indicated on the top in (A) and bottom in (B), and a dorsal line which switched sides from the first to the last third of the tunnel (the start and end points are indicated with red squares). N represents the number of flights. The dark grey line highlights a single representative flight track. (C–E) Median position, cross-index, and proportion of lateral movement with either grating patterns, the dorsal line stimulus, or a combination of both. Black letters in (C–E) show statistically significant differences in group means or median, depending on the normality of the test residuals (see ‘Materials and methods’, confidence level: 5%). Conditions with different letters were significantly different from each other. The white boxplots depict the median and 25–75% range, the whiskers represent the data exceeding the box by more than 1.5 interquartile ranges, and the violin plots indicate the distribution of the individual data points shown in black. For the letter-number identifiers below each condition, as well as each sample size, see Supplementary file 1.
Figure 4—figure supplement 1
Cue conflict: lateral optic flow and dorsal directional cues.
(A–C) Median lateral position, cross-index, and average speed of flight paths with a red stripe which changed its position in the central third of the tunnel, crossing from one tunnel side to the other, and a 50% contrast checkerboard pattern on both lateral tunnel sides, presented individually and in combination. Black letters show statistically significant differences in group means or median, depending on the normality of the test residuals (see ‘Materials and methods’, confidence level: 5%). Conditions with different letters were significantly different from each other. The white boxplots depict the median and 25–75% range, the whiskers represent the data exceeding the box by more than 1.5 interquartile ranges, and the violin plots indicate the distribution of the individual data points shown in black. For the letter-number identifiers below each condition, as well as each sample size, see Supplementary file 1.
Figure 5 with 1 supplement
Cue conflict: lateral versus dorsal avoidance.
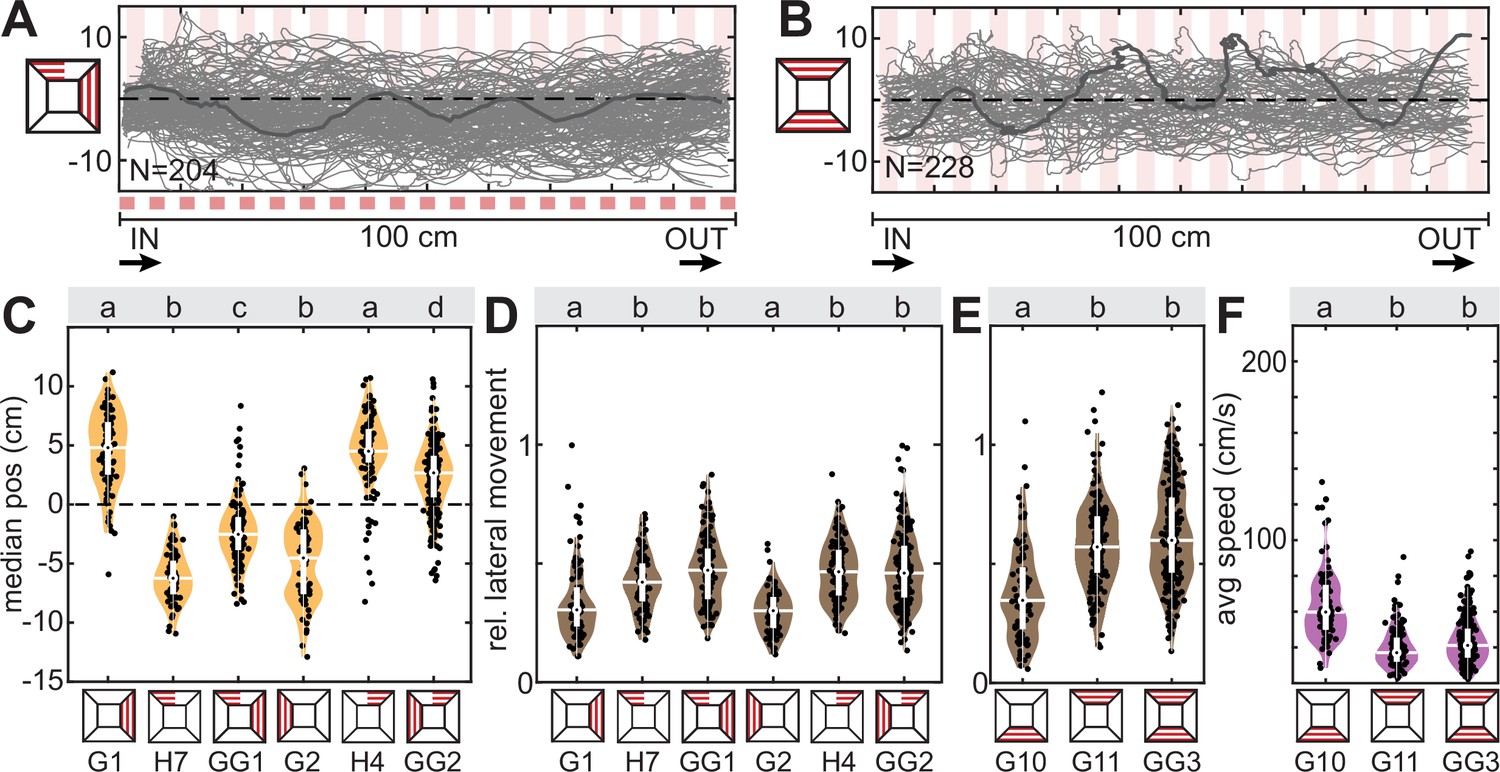
Flight tracks of hawkmoths virtually rotated to be shown from above the tunnel, which were presented with (A) a lateral (red squared) and a dorsal grating pattern spanning one half of the tunnel (semi-transparent red stripes), and (B) a ventral and dorsal grating pattern. N represents the number of flights. The dark grey line highlights a single representative flight track. (C–F) Median position, proportion of lateral movement and flight speed with either pattern in isolation and in combination. Black letters in (C–E) show statistically significant differences in group means or median, depending on the normality of the test residuals (see ‘Materials and methods’, confidence level: 5%). Conditions with different letters were significantly different from each other. The white boxplots depict the median and 25–75% range, the whiskers represent the data exceeding the box by more than 1.5 interquartile ranges. The violin plots indicate the distribution of the individual data shown in black. For the letter-number identifiers below each condition, as well as each sample size, see Supplementary file 1.
Figure 5—figure supplement 1
Cue conflict: lateral distance regulation versus dorsal avoidance.
(A) Average speed of flight paths with lateral gratings, and dorsal gratings covering half the tunnel, presented individually and in combination, and for (B) dorsal and ventral gratings perpendicular (optic flow inducing) and parallel to the flight direction. (C) Average area of hawkmoths as a readout for flight height (the smaller the area, the higher the hawkmoths in the tunnel) in videos with dorsal and ventral longitudinal and perpendicular gratings. Black letters show statistically significant differences in group means or median, depending on the normality of the test residuals (see ‘Materials and methods’, confidence level: 5%). Conditions with different letters were significantly different from each other. The white boxplots depict the median and 25–75% range, the whiskers represent the data exceeding the box by more than 1.5 interquartile ranges, and the violin plots indicate the distribution of the individual data points shown in black. For the letter-number identifiers below each condition, as well as each sample size, see Supplementary file 1.
Figure 6

Integration of optic flow and directional responses in the context of natural visual cues.
(A) The response features of translational optic flow-based flight control and the dorsal response in the hummingbird hawkmoth. Filled boxes represent response features we observed for the respective control systems, and empty boxes represent features we did not observe in response to ventrolateral optic flow cues, or dorsal cues, respectively. Which feature within each system contributed to the key flight parameters we measured is depicted by the coloured links between the feature boxes and flight parameters. Both systems acted on flight control in parallel and produced mixed responses of equal magnitude as either system individually. Only when a mixed response of equal strength was not possible, did we observe a hierarchy between the systems. Its effect on the key flight parameters for the stimuli we tested is qualitatively depicted by the gradient of colours. (B) The distribution of optic flow and contrast cues across different habitat types: open (no bushes or trees within 500 m of the camera), semi-open (lateral vegetation but no closed canopy), and closed (entirely closed canopy), with one example image per habitat type. Boxplots depict the mean magnitude of translational optic flow (left panel) and contrast edges (right panel) across habitat types, and for three different scenes within habitats in the dorsal, ventral, and lateral segments of the visual field (see coloured inset). The boxplots depict the median and 25–75% range, the whiskers represent the data exceeding the box by more than 1.5 interquartile ranges, and the individual data points are shown in black. Statistical results from a linear mixed-effects model (see Methods) are abbreviated as *p<0.05, **p<0.01, ***p<0.001.
Additional files
-
MDAR checklist
- https://cdn.elifesciences.org/articles/104118/elife-104118-mdarchecklist1-v1.docx
-
Supplementary file 1
Summary of visual stimulation conditions (labels as used in data repository; https://doi.org/10.6084/m9.figshare.26820091) and number of flight tracks per condition.
- https://cdn.elifesciences.org/articles/104118/elife-104118-supp1-v1.docx
Download links
A two-part list of links to download the article, or parts of the article, in various formats.
Downloads (link to download the article as PDF)
Open citations (links to open the citations from this article in various online reference manager services)
Cite this article (links to download the citations from this article in formats compatible with various reference manager tools)
Integration of parallel pathways for flight control in a hawkmoth reflects prevalence and relevance of natural visual cues
eLife 14:RP104118.
https://doi.org/10.7554/eLife.104118.4


