Forward genetics in C. elegans reveals genetic adaptations to polyunsaturated fatty acid deficiency
- Department of Chemistry and Molecular Biology, University of Gothenburg, Sweden
- Department of Molecular and Clinical Medicine/Wallenberg Laboratory, Institute of Medicine, University of Gothenburg, Sweden
Figures
Figure 1
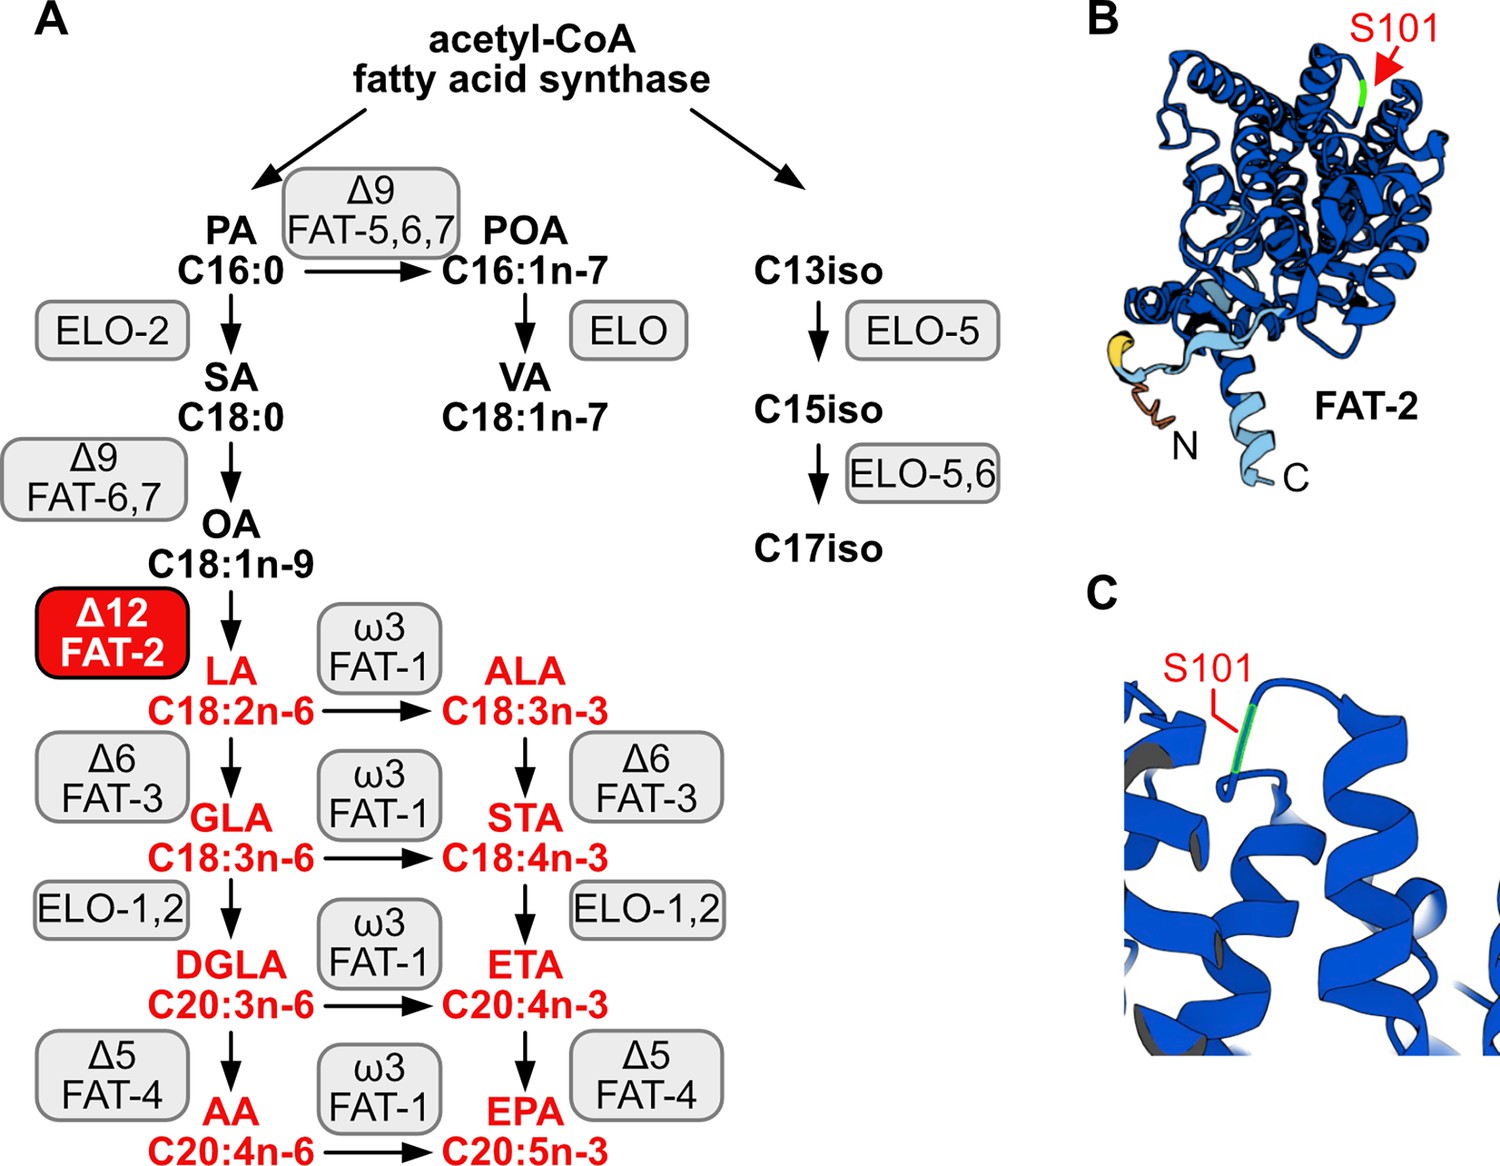
C.elegans fatty acid synthesis pathway and FAT-2 desaturase.
(A) Simplified pathway of fatty acid synthesis and desaturation in C. elegans. Boxes indicate the name of the enzymes, with the FAT-2 desaturase being indicated in a red box. Fatty acids whose synthesis is dependent on FAT-2 are indicated in red. Fatty acid abbreviations are as follow: palmitic acid (PA), palmitoleic acid (POA), vaccenic acid (VA), stearic acid (SA), oleic acid (OA), linoleic acid (LA), alpha-linolenic acid (ALA), gamma-linolenic acid (GLA), stearidonic acid (STA), dihomo-gamma-linolenic acid (DGLA), eicosatetraenoic acid (ETA), arachidonic acid (AA), and eicosapentaenoic acid (EPA). (B) AlphaFold2 predicted the FAT-2 structure with the serine at position 101 indicated with a red arrow. (C) Same structure as in B, zoomed in and angled to show that the S101 position that is mutated to phenylalanine in the fat-2(wa17) allele lies in a loop connecting two alpha helices.
Figure 2
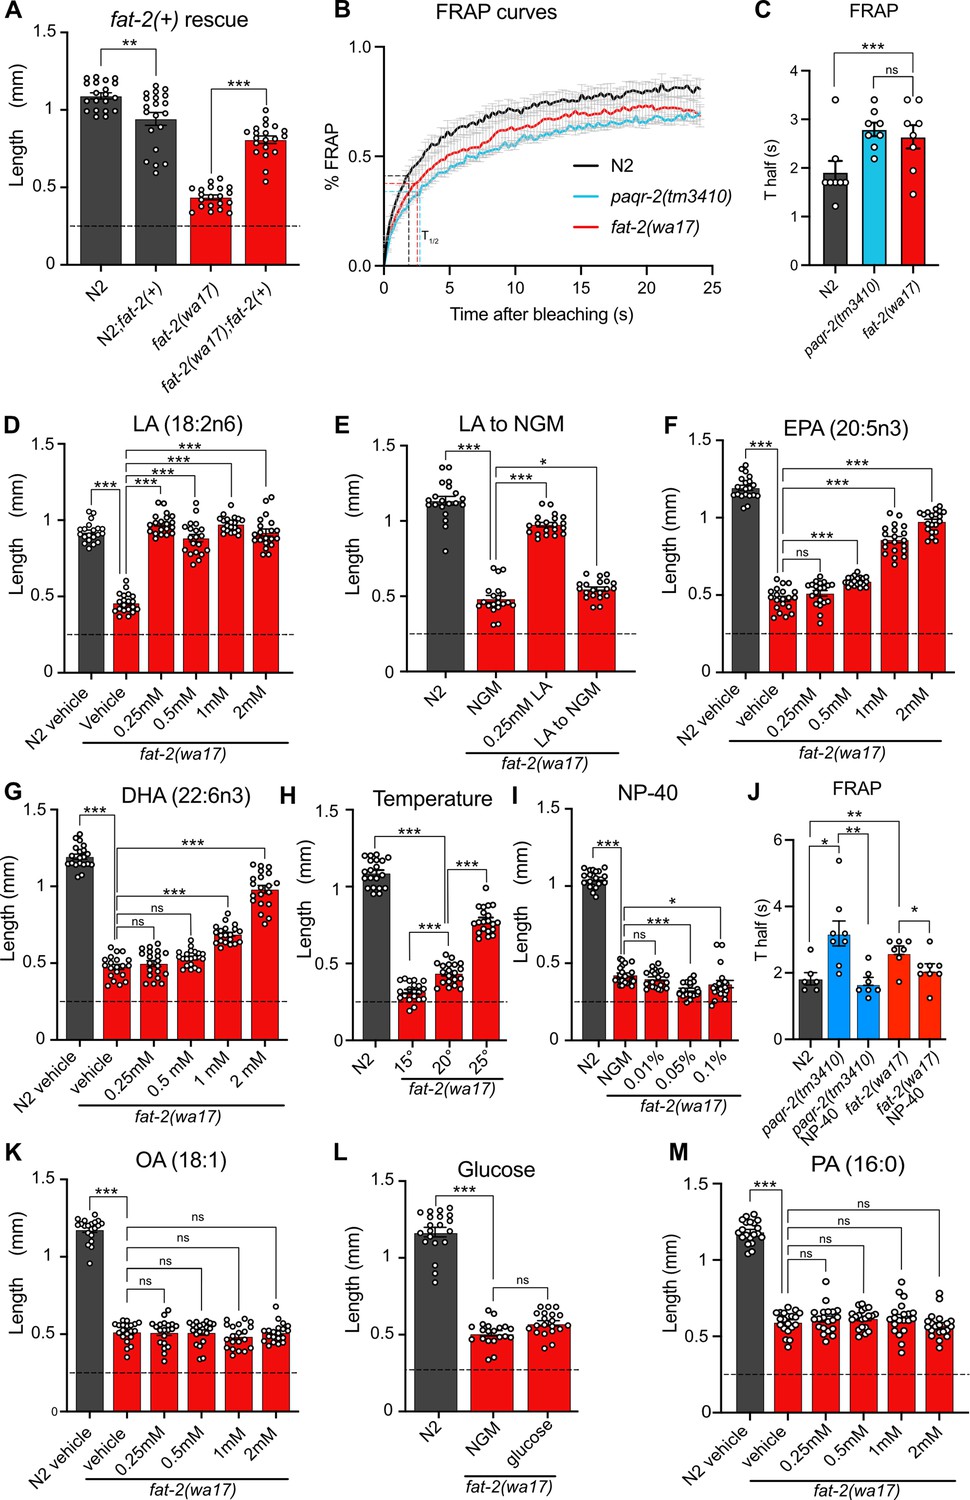
Characterization and rescue of fat-2(wa17).
(A) Introduction of the wild-type fat-2(+) allele on an extrachromosomal array rescues the fat-2(wa17) growth defect. n=20 for each genotype. (B–C) Fluorescence recovery after photobleaching (FRAP) curve and Thalf value show that fat-2(wa17) has rigid membranes similar to paqr-2(tm3410) control. n=8 for each genotype. (D–I, K–M) The lengths of fat-2(wa17) worms grown from L1 stage for 72 hr in the indicated conditions; horizontal dashed lines indicate the approximate lengths of the synchronized L1s at the start of the experiments. n=20 for each genotype/condition. (J) FRAP Thalf values show that NP-40 rescues fat-2(wa17) rigid membranes similarly to paqr-2(tm3410). From left to right, n=6, 8, 7, 7, 8. Error bars show the standard error of the mean. *p<0.05, **p<0.01, ***p<0.001 indicate significant differences compared to the fat-2(wa17) control (ordinary one-way ANOVA with Tukey multiple comparisons test).
Figure 3 with 1 supplement
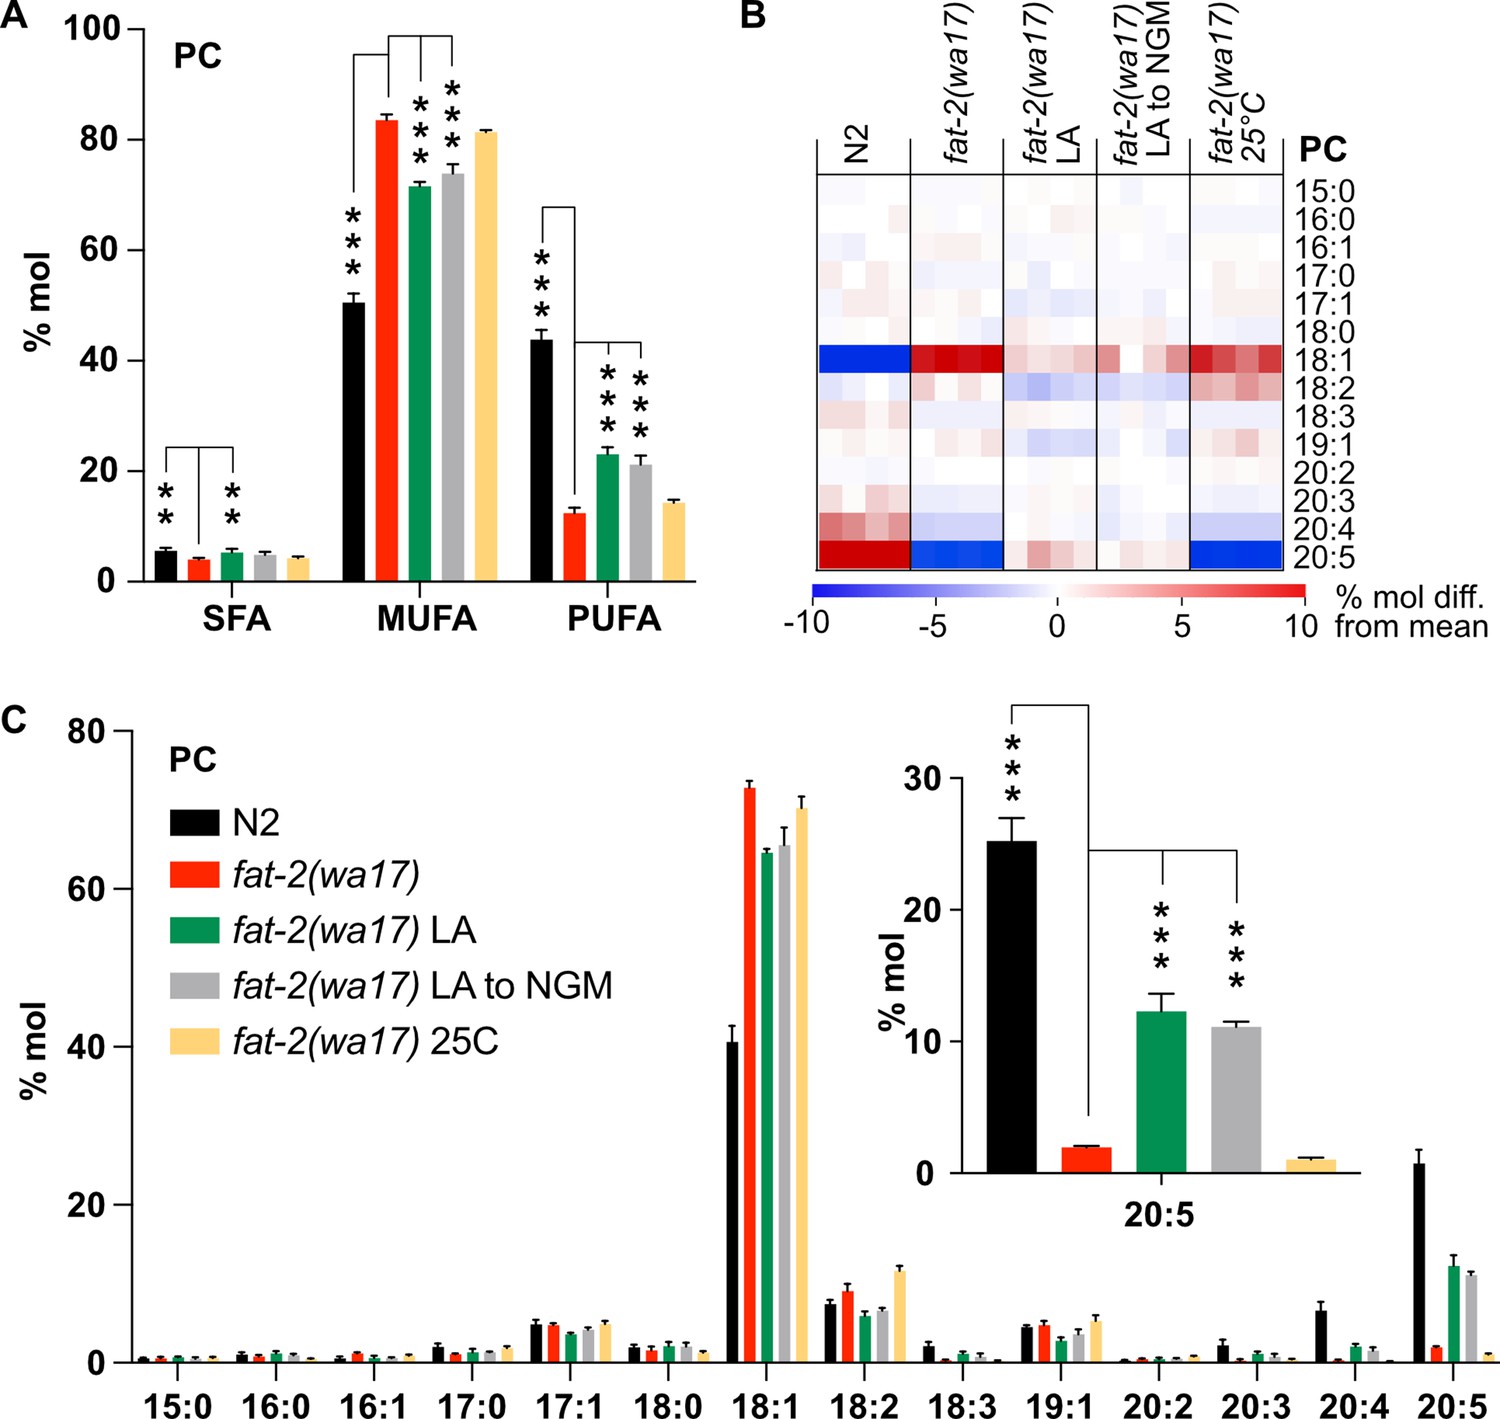
Lipidomic analysis of fat-2(wa17) mutant.
(A) Saturated fatty acid (SFA), monounsaturated fatty acid (MUFA), and polyunsaturated fatty acid (PUFA) levels in phosphatidylcholines (PCs) of fat-2(wa17) grown in various conditions. Note that cultivation on 2 mM LA boosts PUFA levels. Linoleic acid (LA) to NGM worms were grown on 2 mM LA before being transferred to NGM 6 hr prior to harvesting. (B) Heatmap of phosphatidylcholine (PC) species in fat-2(wa17) in all conditions. (C) Levels of individual FA species in PCs for all conditions. The inset shows that levels of 20:5 FA are increased by providing fat-2(wa17) with linoleic acid. n=4 populations for each genotype/condition. For A and C (inset), *p<0.05, **p<0.01, ***p<0.001 indicate significant differences compared to the fat-2(wa17) control and using one-way ANOVA followed by a Dunnett’s multiple comparison test.
-
Figure 3—source data 1
Data from the targeted lipidomics analysis, related to Figures 3 and 7, Figure 3—figure supplement 1, Figure 7—figure supplement 1.
- https://cdn.elifesciences.org/articles/104181/elife-104181-fig3-data1-v1.xlsx
Figure 3—figure supplement 1

Lipidomics analysis of phosphatidylethanolamines (PEs) in fat-2(wa17) in various cultivation conditions.
(A) Saturated fatty acid (SFA), monounsaturated fatty acid (MUFA), and polyunsaturated fatty acid (PUFA) levels in phosphatidylethanolamine (PEs) of fat-2(wa17) grown in various conditions. Cultivation on 2 mM linoleic acid (LA) boosts PUFA levels. LA to NGM worms were grown on 2 mM LA before being transferred to NGM 6 hr prior to harvesting. (B) Heatmap of PE species in fat-2(wa17) in all conditions. (C) Levels of individual FA species in PEs for all conditions. Inset shows that the levels of C20:5 are increased by providing fat-2(wa17) with LA. n=4 populations for each genotype/condition. For A and C (inset), *p<0.05, **p<0.01, ***p<0.001 indicate significant differences compared to the fat-2(wa17) control and using one-way ANOVA followed by a Dunnett’s multiple comparison test.
Figure 4
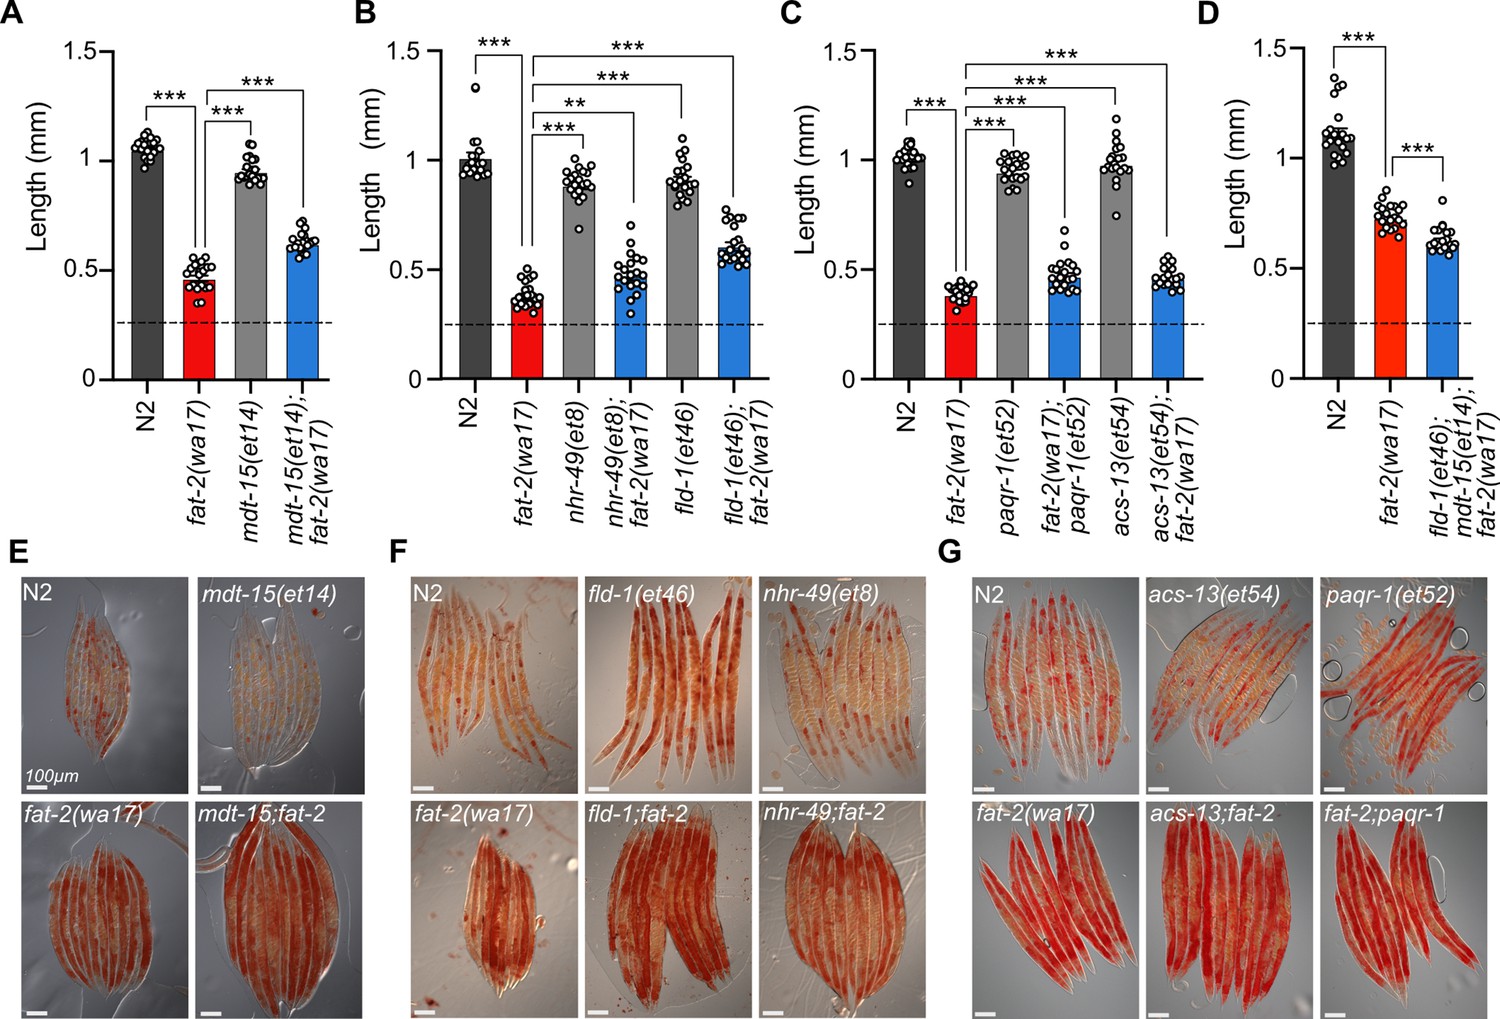
Membrane fluidizing mutations partially rescue fat-2(wa17).
(A–D) Fluidizing paqr-2(tm3410) suppressor mutations only slightly rescue fat-2(wa17) growth. Dashed horizontal lines indicate the approximate length of L1s at the start of the experiments; length was measured 72 hr post-synchronization. n=20 for each genotype. Error bars show the standard error of the mean. *p<0.05, **p<0.01, ***p<0.001 indicate significant differences compared to the fat-2(wa17) control (ordinary one-way ANOVA with Tukey multiple comparisons test). (E–G) Oil Red O staining of day 1 adults shows that the high lipid abundance in fat-2(wa17) is not suppressed by paqr-2(tm3410) fluidizing mutations.
Figure 5 with 1 supplement
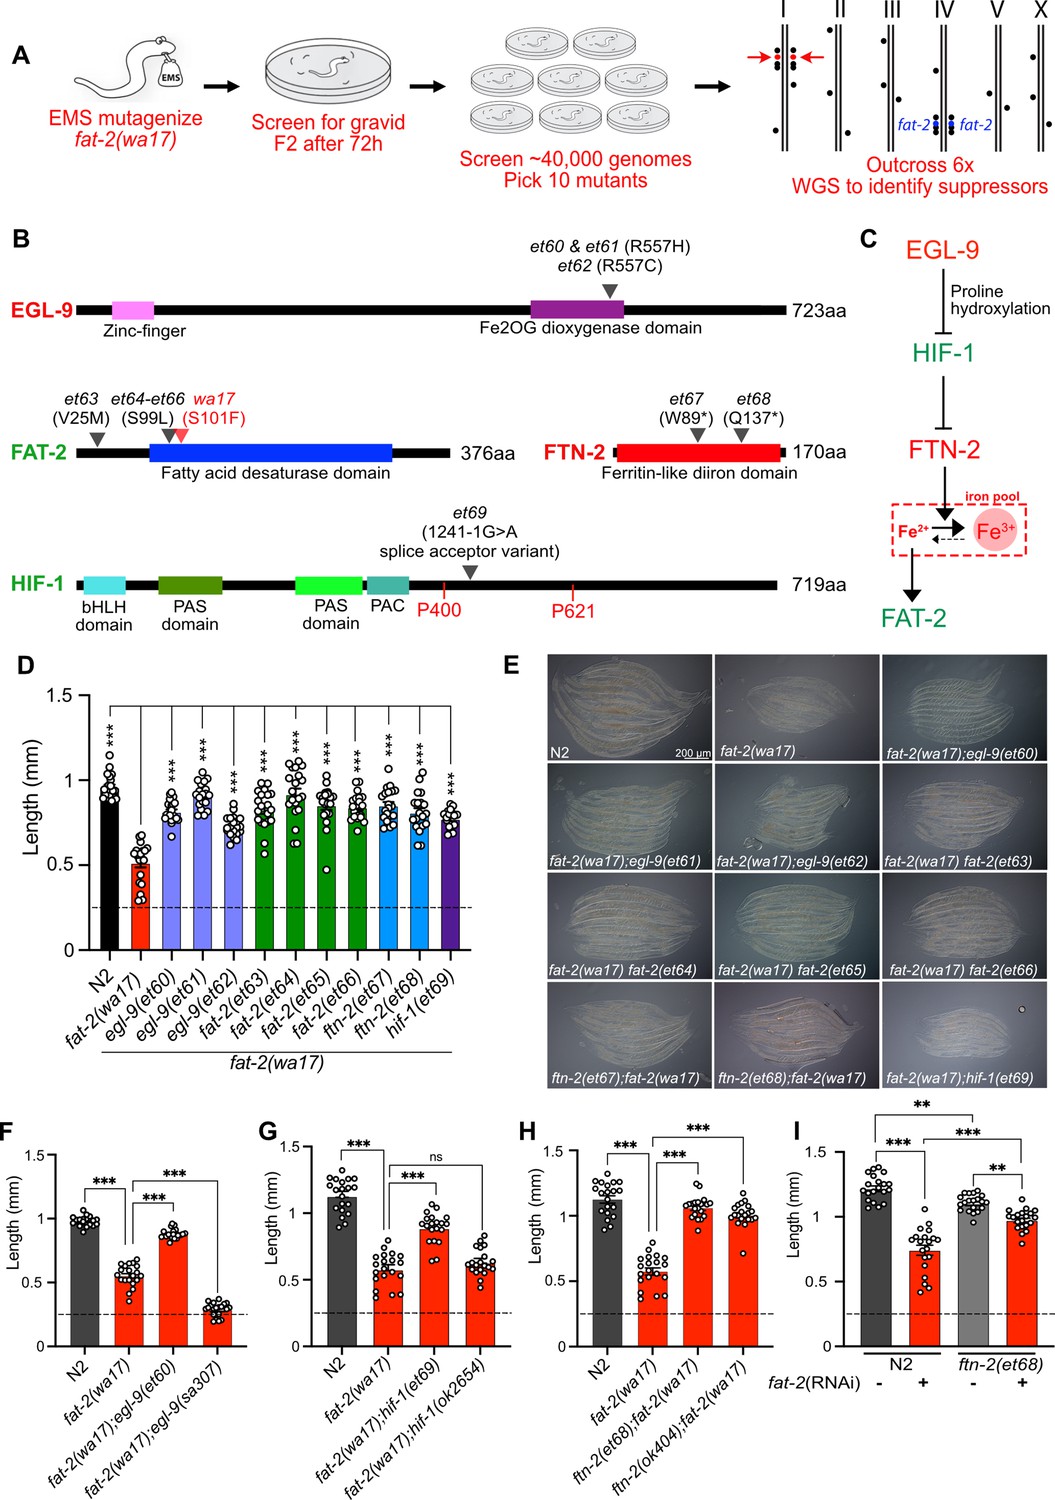
A forward genetic screen reveals that fat-2(wa17) is suppressed by mutations in the HIF-1 pathway.
(A) Overview of the forward genetics screen strategy to isolate fat-2(wa17) suppressors. (B) Identity and position of the fat-2(wa17) suppressors as well as the positions of functional domains. Novel mutations are marked by a black triangle with the corresponding allele name and mutation effect; the red triangle in FAT-2 indicates the original wa17 allele. Gene names in red represent loss- or reduction-of-function mutations; gene names in green represent gain-of-function mutations. (C) Proposed pathway of fat-2(wa17) suppression by mutations in the HIF-1 pathway. Reduction of EGL-9 constitutively activates HIF-1, and HIF-1 activation inhibits FTN-2. The loss of FTN-2 increases the levels of Fe2+, thus boosting FAT-2 desaturase activity. Gain-of-function mutations are labeled in green, loss- or reduction-of-function mutations are labeled in red. (D) Length of all fat-2(wa17) suppressors measured 72 hr after the L1 stage. (E) Representative images of fat-2(wa17) suppressors after 72 h of growth. (F–H) Null alleles of egl-9 and hif-1 do not rescue fat-2(wa17), but the null allele of ftn-2 does, confirming that ftn-2(et67) and ftn-2(et68) are loss-of-function alleles. Lengths were measured 72 hr after L1 synchronization. (I) ftn-2(et68) rescue of fat-2(RNAi) worms, confirming that the suppressors are not wa17 specific. The horizontal dashed line indicates the approximate length of L1s at the start of each experiment. n=20 for each genotype/condition. Error bars show the standard error of the mean. *p<0.05, **p<0.01, ***p<0.001 indicate significant differences compared to the fat-2(wa17) control (ordinary one-way ANOVA with Tukey multiple comparisons test).
Figure 5—figure supplement 1

fat-2(wa17) and fat-2(syb7458) with suppressors.
(A) Confirmation of hif-1(et69) suppression of fat-2(wa17) by CRISPR-Cas9. (B) The hif-1(et69) allele acts best as a fat-2(wa17) suppressor when in a heterozygous state. (C) ftn-2(et68) does not act as a suppressor for the fat-2(syb7458) allele. (D) ftn-2(et68) still suppresses fat-2(wa17) in a hif-1 null background. (E) hif-1(et69) suppresses fat-2(wa17) in a ftn-2 null background. (A–E) All length measurements were taken 72 hr after L1 synchronization. The horizontal dashed line represents the approximate size of L1s at the start of each experiment. n=20 for each genotype/conditions. Error bars show the standard error of the mean. *p<0.05, **p<0.01, ***p<0.001 indicate significant differences compared to the fat-2(wa17) control (ordinary one-way ANOVA with Tukey multiple comparisons test).
Figure 6 with 1 supplement
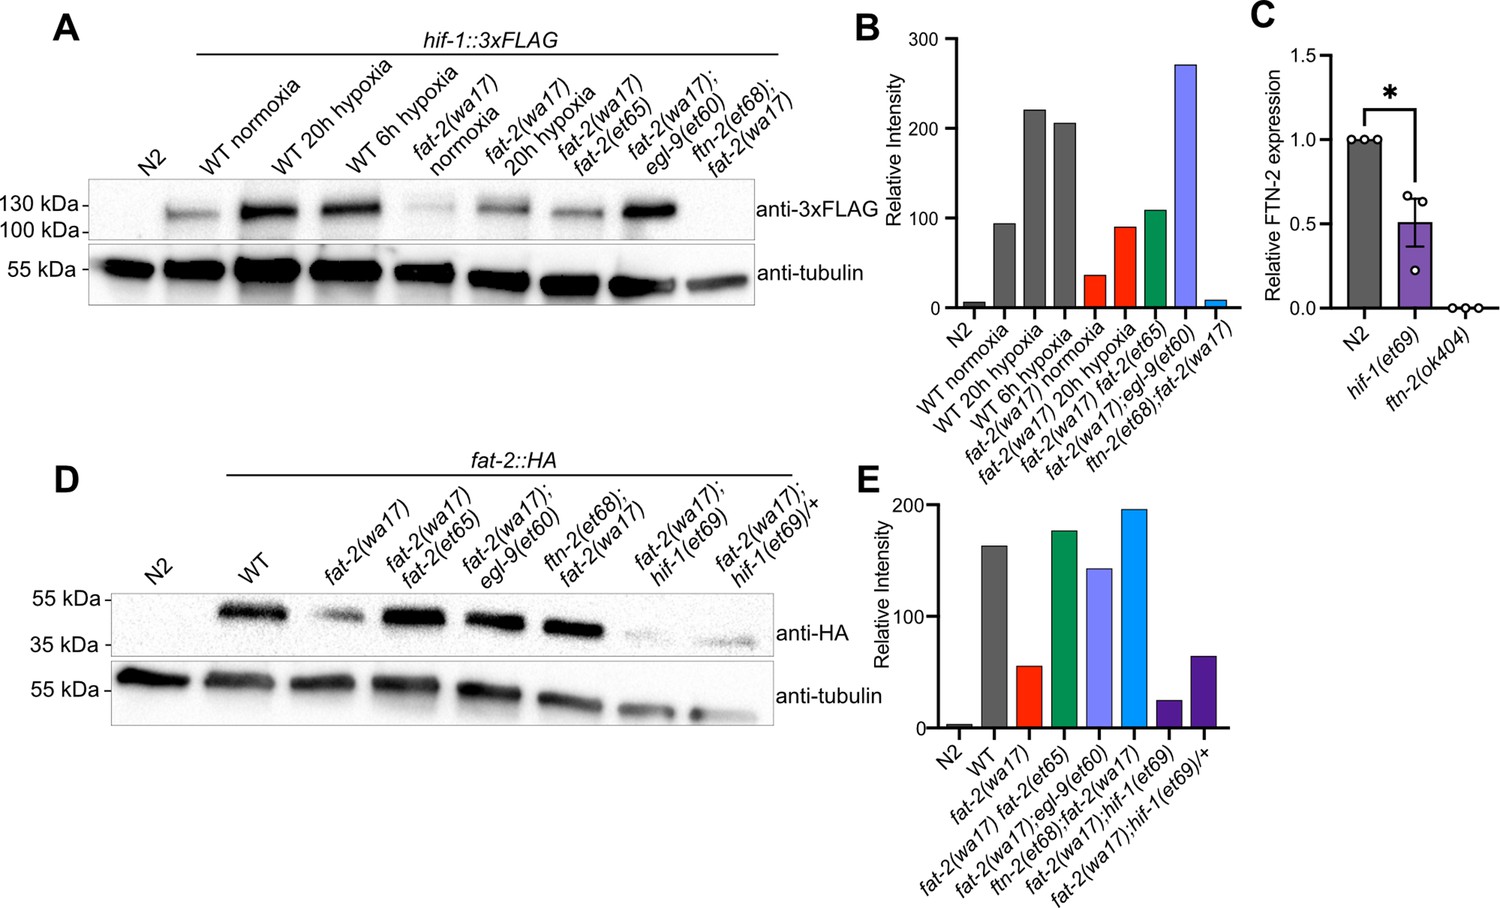
fat-2(wa17) suppressors belong in the HIF-1 pathway and influence HIF-1 levels.
(A) Western blot confirming that hif-1::3xFLAG levels in fat-2(wa17) are increased by egl-9(et60), but not by ftn-2(et68). Hypoxia treatment increases HIF-1 levels in wild-type (WT) and fat-2(wa17), confirming successful protein tagging. (B) Quantification of Western blot in A showing relative intensity of the HIF-1 signal normalized to that of tubulin. (C) mRNA expression of FTN-2, confirming that hif-1(et69) reduces FTN-2 levels. n = the mean of 3 independent normalized replicates for each genotype. *p<0.05 (unpaired t-test). (D) Western blot confirming that fat-2::HA levels in fat-2(wa17) are greatly reduced but increased in suppressor strains. (E) Quantification of Western blot in D showing relative intensity of the FAT-2 signal normalized to that of tubulin.
-
Figure 6—source data 1
PDF file containing original western blots for Figure 6, indicating the relevant bands and treatments.
- https://cdn.elifesciences.org/articles/104181/elife-104181-fig6-data1-v1.zip
-
Figure 6—source data 2
Original files for western blot analysis displayed in Figure 6.
- https://cdn.elifesciences.org/articles/104181/elife-104181-fig6-data2-v1.zip
Figure 6—figure supplement 1

Suppressors influence HIF-1 and FAT-2 levels.
(A) Western blot showing that hif-1::3xFLAG levels in fat-2(wa17) are increased by egl-9(et60). (B) Quantification of Western blot in A showing normalized relative intensity of the HIF-1 signal to that of tubulin. (C) Western blot showing that fat-2::HA levels are reduced in fat-2(wa17) but increased by suppressors. (D) Quantification of Western blot in C showing normalized relative intensity of HIF-1 signal to that of tubulin.
-
Figure 6—figure supplement 1—source data 1
PDF file containing original western blots for Figure 6—figure supplement 1, indicating the relevant bands and treatments.
- https://cdn.elifesciences.org/articles/104181/elife-104181-fig6-figsupp1-data1-v1.zip
-
Figure 6—figure supplement 1—source data 2
Original files for western blot analysis displayed in Figure 6—figure supplement 1.
- https://cdn.elifesciences.org/articles/104181/elife-104181-fig6-figsupp1-data2-v1.zip
Figure 7 with 1 supplement
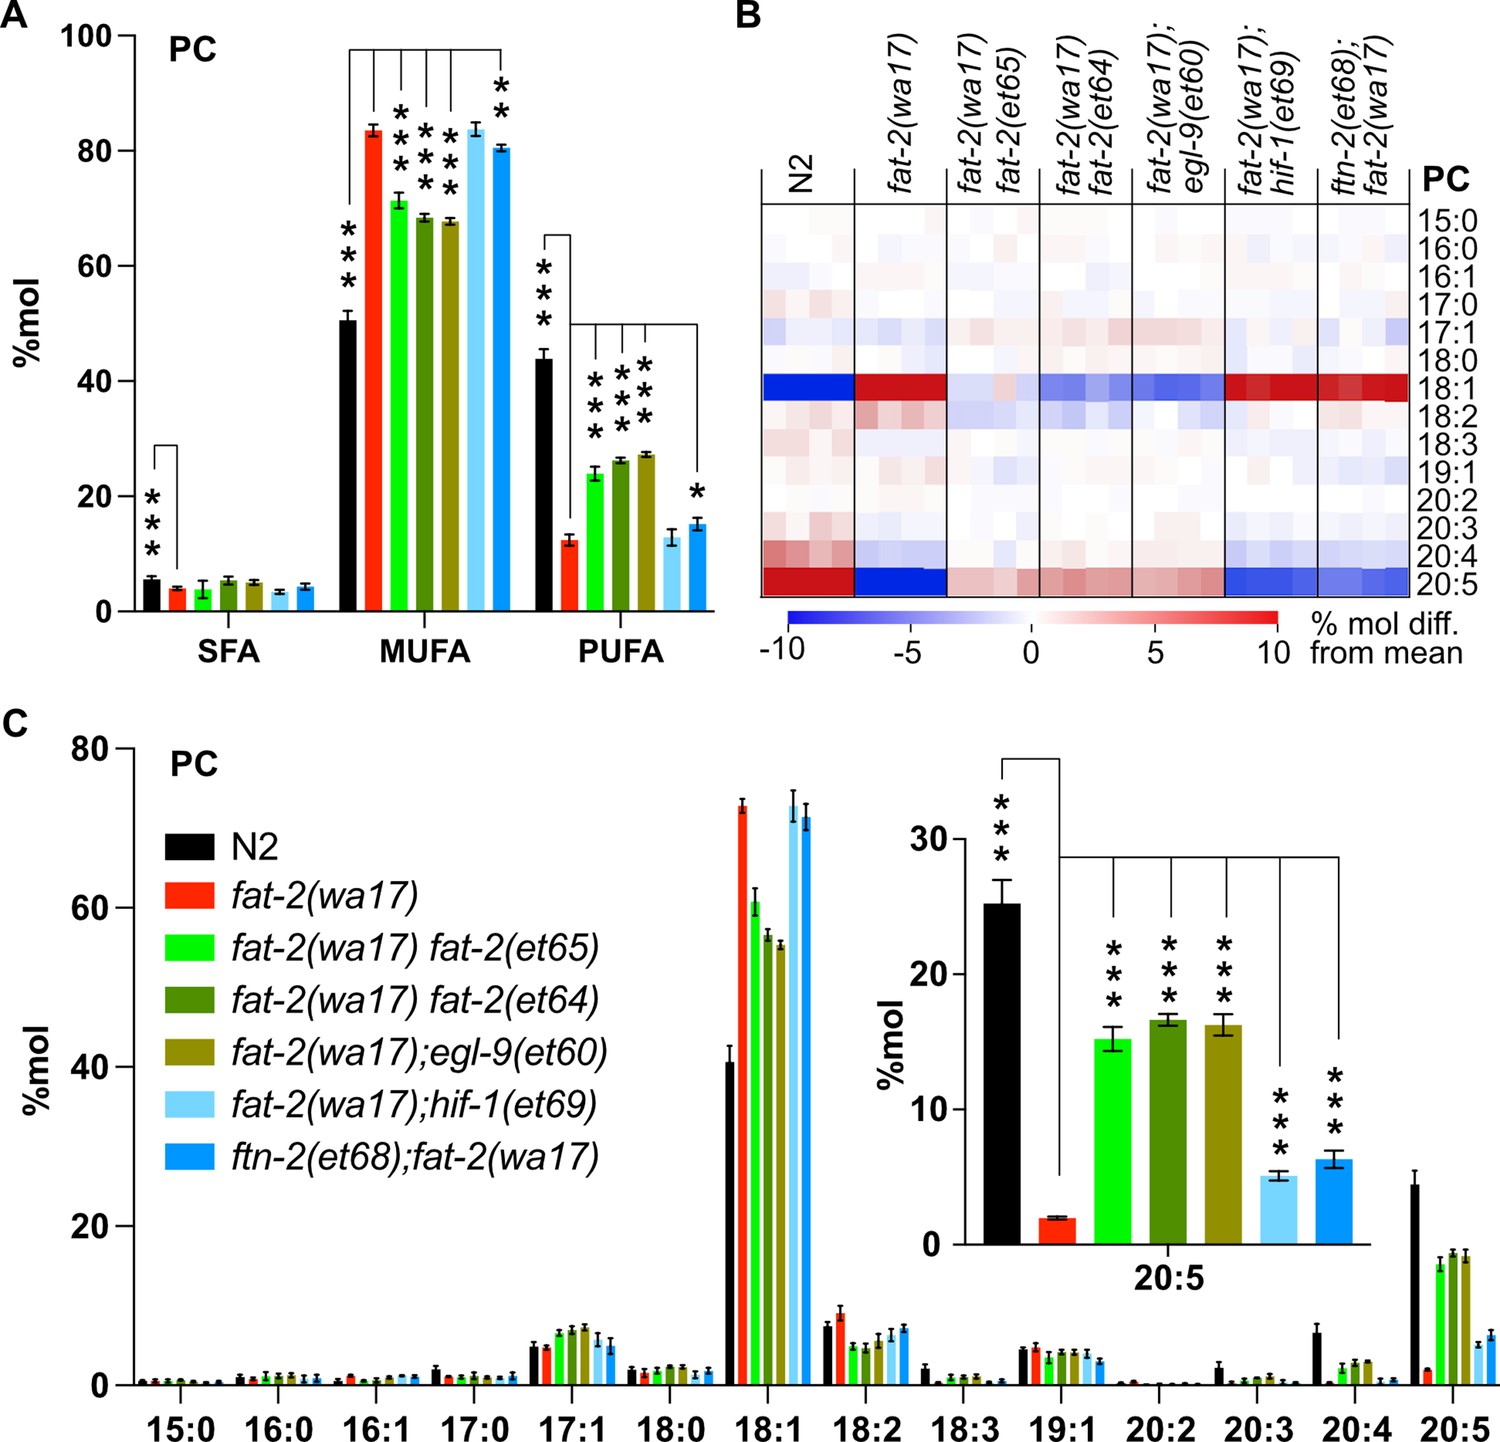
Lipidomic analysis of fat-2(wa17) suppressors reveals that polyunsaturated fatty acid (PUFA) levels are increased.
(A) Levels of saturated fatty acids (SFAs), monounsaturated fatty acids (MUFAs), and PUFAs in phosphatidylcholines (PCs) measured in fat-2(wa17) suppressors confirm that the suppressors increase PUFA levels in fat-2(wa17). Worms were homozygous for all indicated genotypes, but note that the hif-1(et69) allele suppresses fat-2(wa17) best in a heterozygous state. (B) Heat map analysis of PC species in suppressor mutants. (C) Levels of individual FA species in PCs in fat-2(wa17) suppressors, the insert shows that levels of C20:5 are significantly increased in all double mutant strains. n=4 populations for each genotype. For A and C (inset), *p<0.05, **p<0.01, ***p<0.001 indicate significant differences compared to the fat-2(wa17) control and using one-way ANOVA followed by a Dunnett’s multiple comparison test. Note that the N2 and fat-2(wa17) samples are the same as in Figure 3.
Figure 7—figure supplement 1

Lipidomics of phosphatidylethanolamines (PEs) in fat-2(wa17) suppressors.
(A) Levels of saturated fatty acids (SFAs), monounsaturated fatty acids (MUFAs), and polyunsaturated fatty acids (PUFAs) in PEs measured in fat-2(wa17) suppressors confirm that the suppressors increase PUFA levels in fat-2(wa17). (B) Heat map analysis of PE species in suppressor mutants. (C) Levels of individual FA species in PEs in fat-2(wa17) suppressors, the insert shows that levels of 20:5 are increased in all double mutant strains. n=4 populations for each genotype. For A and C (inset), *p<0.05, **p<0.01, ***p<0.001 indicate significant differences compared to the fat-2(wa17) control and using one-way ANOVA followed by a Dunnett’s multiple comparison test.
Figure 8
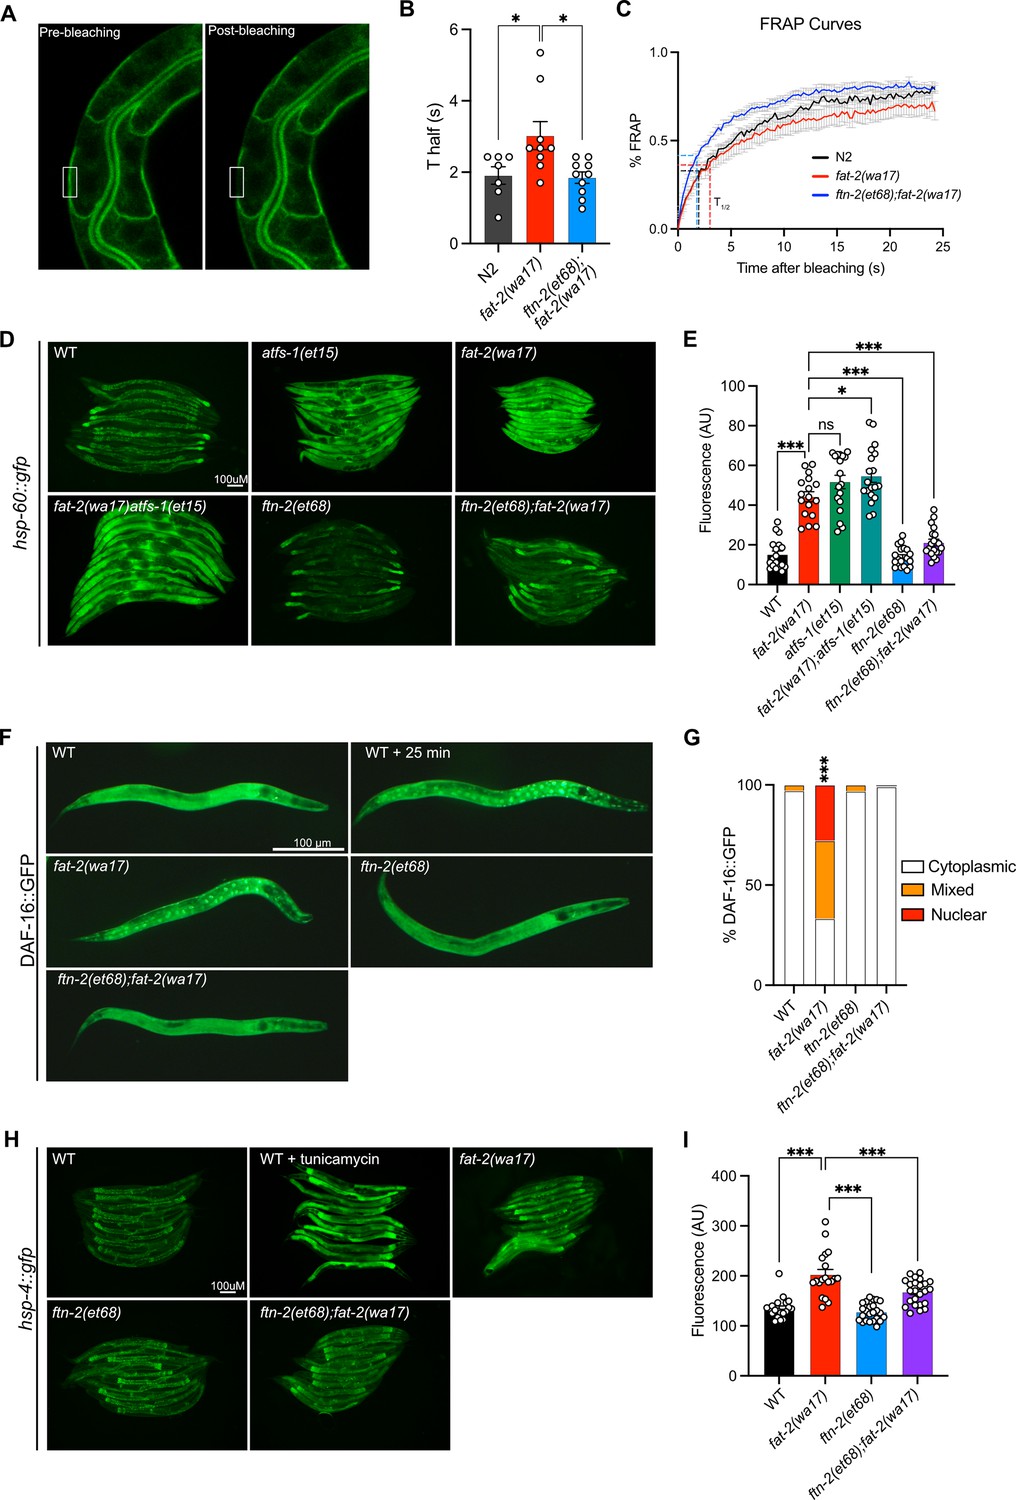
ftn-2(et68) rescues fat-2(wa17)’s stress responses.
(A) Representative image of a fluorescence recovery after photobleaching (FRAP) experiment, showing pGLO-1::GFP-CAAX-positive intestinal membranes. The rectangle indicates the bleached area. (B–C) Thalf values and FRAP curves show that ftn-2(et68);fat-2(wa17) has less rigid membranes than fat-2(wa17). From left to right, n=7, 9, 10. (D–E) Representative images and quantification of ftn-2(et68) rescue of fat-2(wa17) mitochondrial stress with a hsp-60::gfp reporter. atfs-1(et15) serves as a control for high mitochondrial UPR activation. n=20 for each genotype. (F–G) Representative images and quantification of DAF-16::GFP localization showing that the DAF-16 stress response is constitutively active in the fat-2(wa17) mutant but normalized by ftn-2(et68). Chi-squared test shows that fat-2(wa17) is significantly different from wild-type (WT). n=100 for each genotype. (H–I) Representative images and quantification of mild ER stress in fat-2(wa17) that is slightly rescued by ftn-2(et68) using a hsp-4::gfp reporter. n=20 for each genotype. *p<0.05, **p<0.01, ***p<0.001 indicate significant differences compared to the fat-2(wa17) control (ordinary one-way ANOVA with Tukey multiple comparisons test).
Figure 9 with 1 supplement
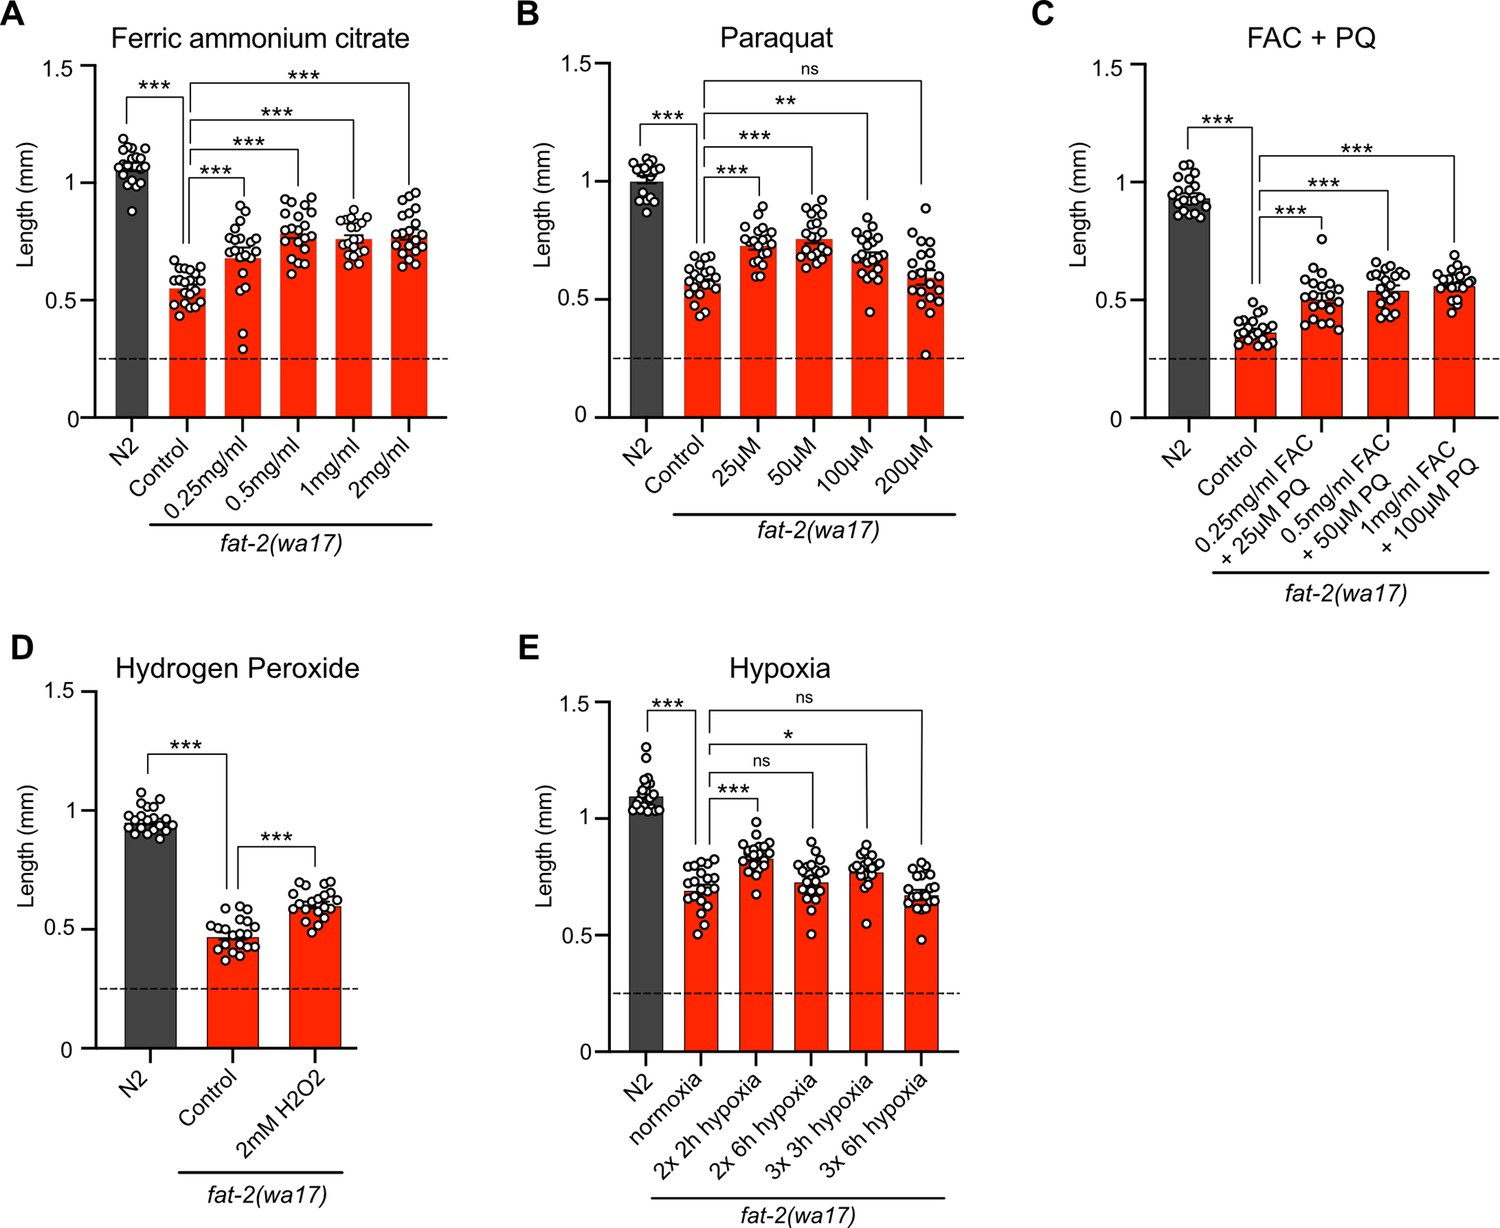
Exogenous treatments that mimic fat-2(wa17) suppressors partially rescue fat-2(wa17).
(A–E) Length assay of fat-2(wa17) cultivated with different treatments for 72 hr after L1 stage synchronization. The horizontal dashed line represents the approximate length of L1 worms at the start of each experiment. n=20 for each genotype/condition. *p<0.05, **p<0.01, ***p<0.001 indicate significant differences compared to the fat-2(wa17) control (ordinary one-way ANOVA with Tukey multiple comparisons test).
Figure 9—figure supplement 1

Exogenous treatment of fat-2(wa17) to mimic suppressors.
(A–E) Length of fat-2(wa17) treated with various diets for 72 hr after L1 synchronization, attempting to mimic effects of egl-9, ftn-2, and hif-1 suppressors. Horizontal dashed line represents the approximate size of worms at the start of each experiment. n=20 for each genotype/condition. *p<0.05, **p<0.01, ***p<0.001 indicate significant differences compared to the fat-2(wa17) control (ordinary one-way ANOVA with Tukey multiple comparisons test).
Additional files
-
Supplementary file 1
Primers for genotyping.
- https://cdn.elifesciences.org/articles/104181/elife-104181-supp1-v1.xlsx
-
MDAR checklist
- https://cdn.elifesciences.org/articles/104181/elife-104181-mdarchecklist1-v1.docx
Download links
A two-part list of links to download the article, or parts of the article, in various formats.
Downloads (link to download the article as PDF)
Open citations (links to open the citations from this article in various online reference manager services)
Cite this article (links to download the citations from this article in formats compatible with various reference manager tools)
Forward genetics in C. elegans reveals genetic adaptations to polyunsaturated fatty acid deficiency
eLife 13:RP104181.
https://doi.org/10.7554/eLife.104181.4


