Engineering cardiolipin binding to an artificial membrane protein reveals determinants for lipid-mediated stabilization
- Department of Microbiology, Tumor and Cell Biology, Karolinska Institutet, Sweden
- School of Physiology, Pharmacology & Neuroscience, University of Bristol, United Kingdom
- Department of Biochemistry and Biophysics, Stockholm University, Sweden
- Institute of Organic Chemistry and Biochemistry, Academy of Science of the Czech Republic, Czech Republic
- Department of Chemistry – BMC, Uppsala University, Sweden
- Department of Biochemistry and Biophysics, Science for Life Laboratory, Stockholm University, Sweden
- Department of Chemistry, University of Oxford, United Kingdom
- Kavli Institute for Nanoscience Discovery, University of Oxford, United Kingdom
- Department of Applied Physics, Science for Life Laboratory, KTH Royal Institute of Technology, Sweden
- School of Life Sciences & Chemistry, University of Warwick, United Kingdom
- Department for Cell and Molecular Biology, Uppsala University, Sweden
Figures
Figure 1 with 2 supplements
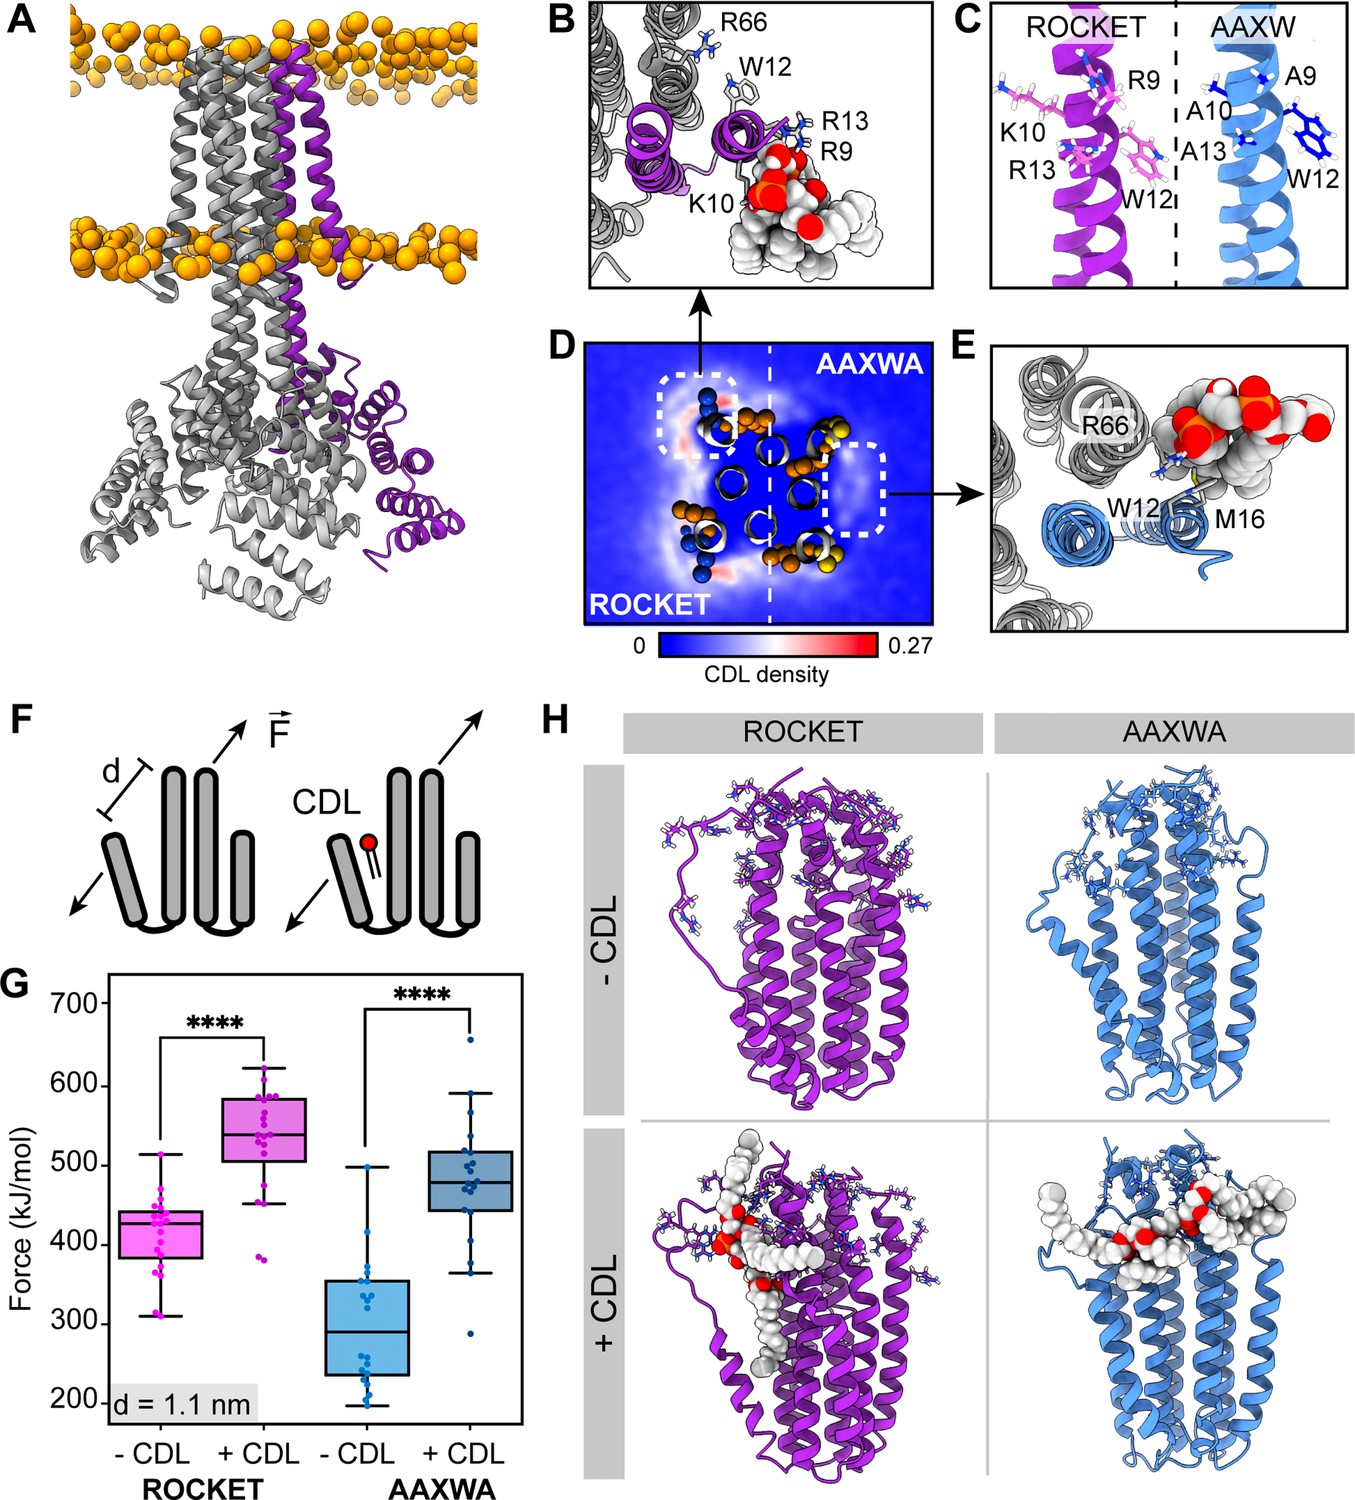
ROCKET contains two CDL binding sites with different structural implications.
(A) Structure of ROCKET (PDB ID 6B85) in the membrane, with one protein subunit highlighted in purple and phosphate headgroups for the membrane shown as orange spheres. The structure was obtained from MemProtMD. (B) Top view of CDL binding to Site 1 taken from a 10 µs snapshot of a CG-MD simulation. The poses was converted to atomistic using CG2AT2 (Vickery and Stansfeld, 2021) to the CHARMM36m force field (Huang and MacKerell, 2013). CDL is shown as spacefill, and residues R9, K10, W12, R13, and R66 as sticks. The CDL-binding subunit is highlighted in purple. (C) Design of the ROCKETAAXWA variant. Site 1 on helix 1 of ROCKET is shown on the left (purple), and ROCKETAAXWA with the mutations R9A/K10A/R13A on the right blue. (D) CG-MD-derived CDL densities around a heterotetramer composed of two ROCKET subunits (left) and two ROCKETAAXWA subunits (right). Units are number density. Site 1 on ROCKET and Site 2 on ROCKETAAXWA are highlighted by dashed boxes. R9, K10, W12, and R13 are shown as spheres (basic in blue, aromatic in orange). Densities are computed over 5x10 µs simulations. (E) Top view of CDL binding to Site 2 in ROCKETAAXWA following CG-MD and converted to atomistic as per panel B. Interacting residues W12, M16, and R66 on the neighboring subunit (grey) are shown as sticks. (F) Setup of gas-phase MD simulations for unfolding of ROCKET and ROCKETAAXWA with and without lipids. The placement of the lipid in the schematic is arbitrary. (G) Plots of the integral of the force required to separate helix 1 and 2 (d=1.1 nm), for ROCKET (purple) (p=3.85*10–7) and ROCKETAAXWA (blue) (p=2.93*10–8) with and without bound CDL show a more pronounced increase in stability for CDL-bound ROCKETAAXWA compared to ROCKET (two-tailed t-test with n=20).(H) Snapshots from gas-phase MD simulations show broad interactions of CDL across the subunits of lipid-bound ROCKETAAXWA (blue) and more localized interactions with fewer intermolecular contacts for ROCKET (purple). Amino acid position 9, 10, 12, 13, and 66 are shown as sticks in each subunit.
Figure 1—figure supplement 1
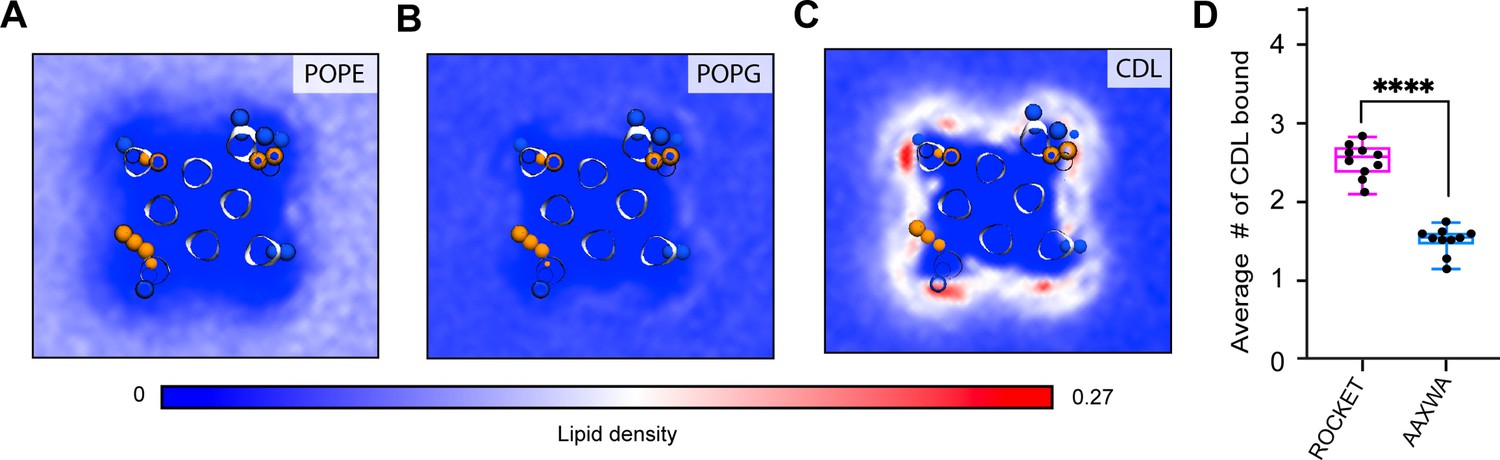
CG-MD simulations of lipid interactions with ROCKET and ROCKETAAXWA.
CG-MD-derived lipid densities around tetrameric ROCKET for all lipid components in the model E. coli membrane, (A) POPE, (B) POPG, and (C) CDL. Only CDL displays preferential binding. POPE; on the other hand, is largely excluded from the protein surface. (D) The average number of CLD molecules bound to tetrameric ROCKET and ROCKETAAXWA in CG-MD simulations, as analyzed using gmx select with a distance of 0.6 nm between CDL headgroup and the protein surface used as cut-off, see Materials and methods for details. Statistics are from two-tailed t-tests (n=5) (**** p<0.0001).
Figure 1—figure supplement 2
Molecular dynamics simulations of ROCKET in the gas phase.
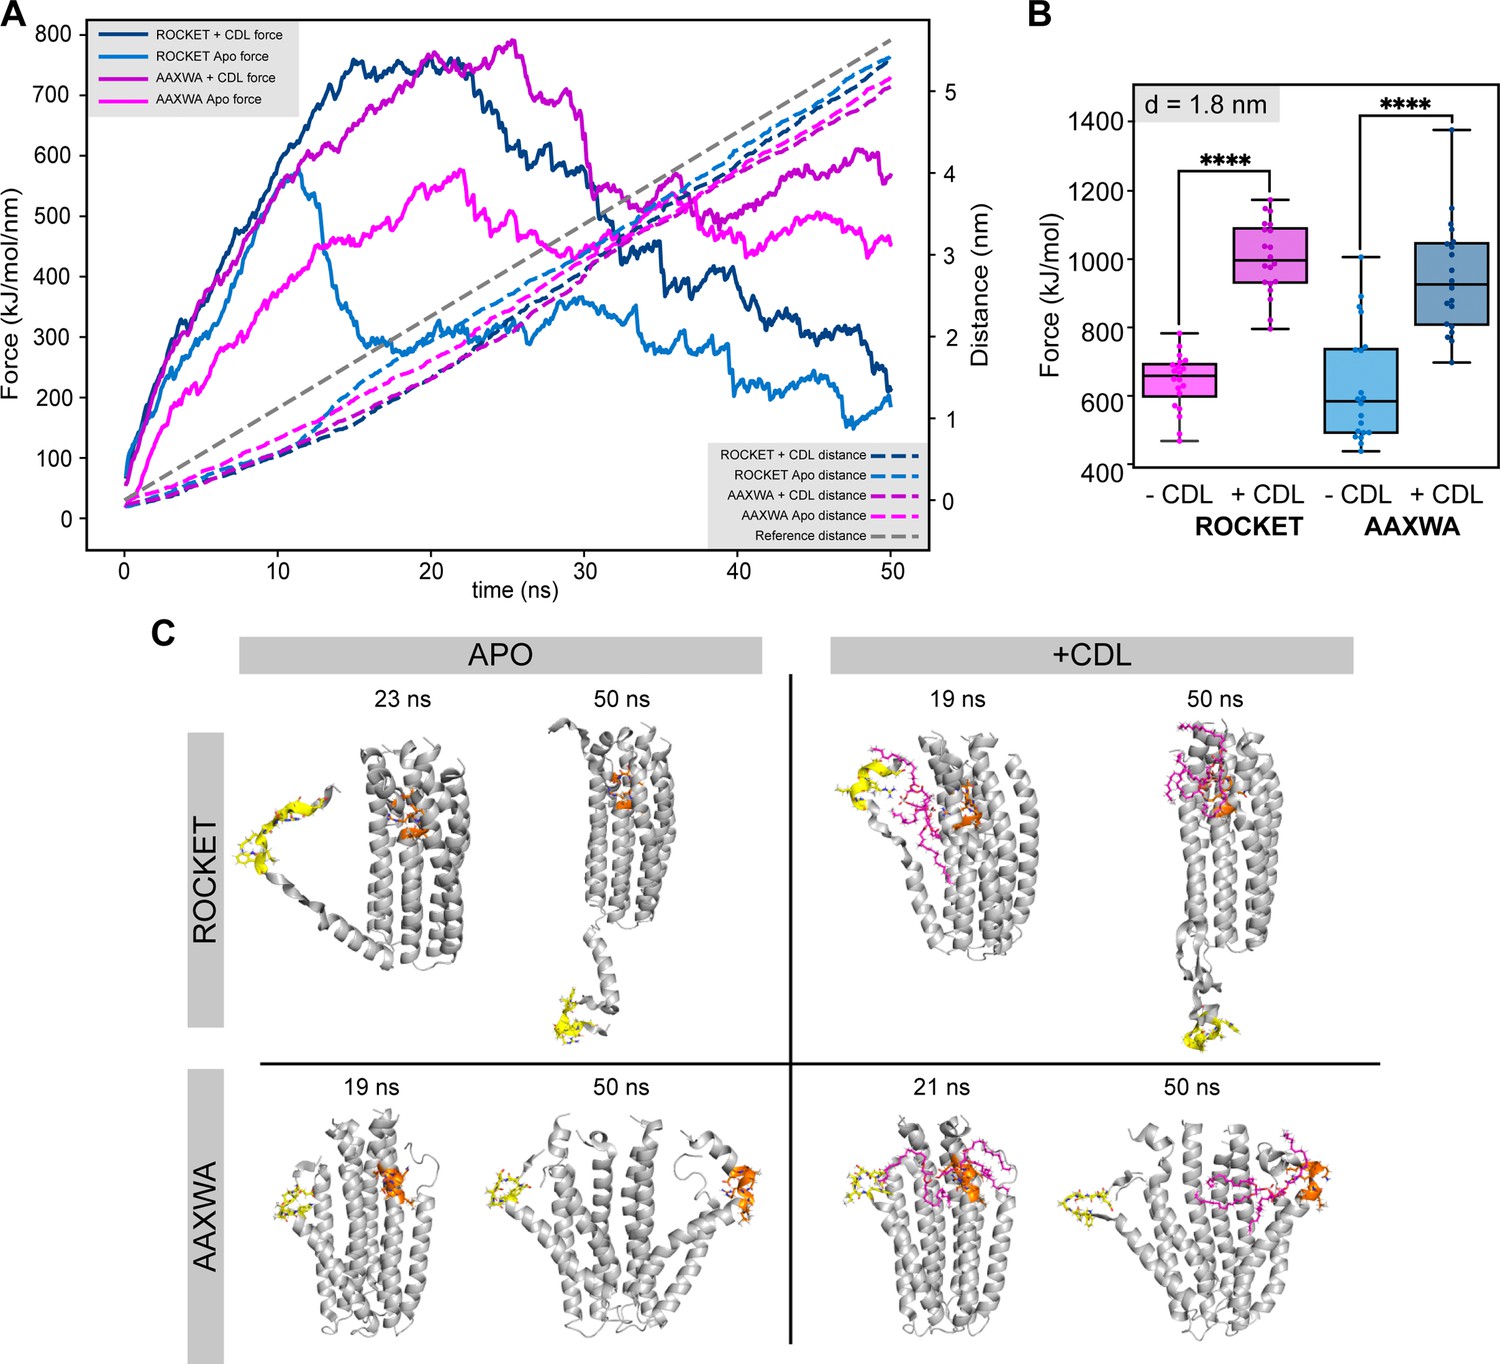
(A) Trajectory of gas phase simulations showing the force (dashed lines) and the total distance between the N- and C-terminal ends of helices 1 and 2, respectively (solid lines) over the 50 ns simulation for ROCKET and ROCKETAAXWA with and without CDL. The measurements are averages of the 20 replicate simulations. At around 10 ns, the contacts between helix 1 and 2 are disrupted. (B) Plots of the total force required to separate helix 1 and 2 by d = 1.8 nm for ROCKET (purple) (p = 1.99*10-14) and ROCKETAAXWA (blue) (p = 5.34*10-7) with and without bound CDL. At 1.8 nm, the core of the tetramer dissociates, which is prevented by CDL for both ROCKET variants (two-tailed t-test, n=20). (C) Snapshots of unfolding trajectory of ROCKET and ROCKETAAXWA in the absence (left) and presence (right) of CDL at 19-20 ns, where helix 1 is completely dissociated, and at the end of the simulations (50 ns). (D) Helix content of ROCKET and ROCKETAAXWA over the course of the gas phase unfolding simulations. The conformation of Helix 1 in ROCKET is stabilized by CDL binding. The AAXWA mutation stabilizes the helical conformation independently of CDL binding.
Figure 2 with 3 supplements
nMS analysis of lipid binding and lipid mediated stabilization of ROCKET and ROCKETAAXWA.
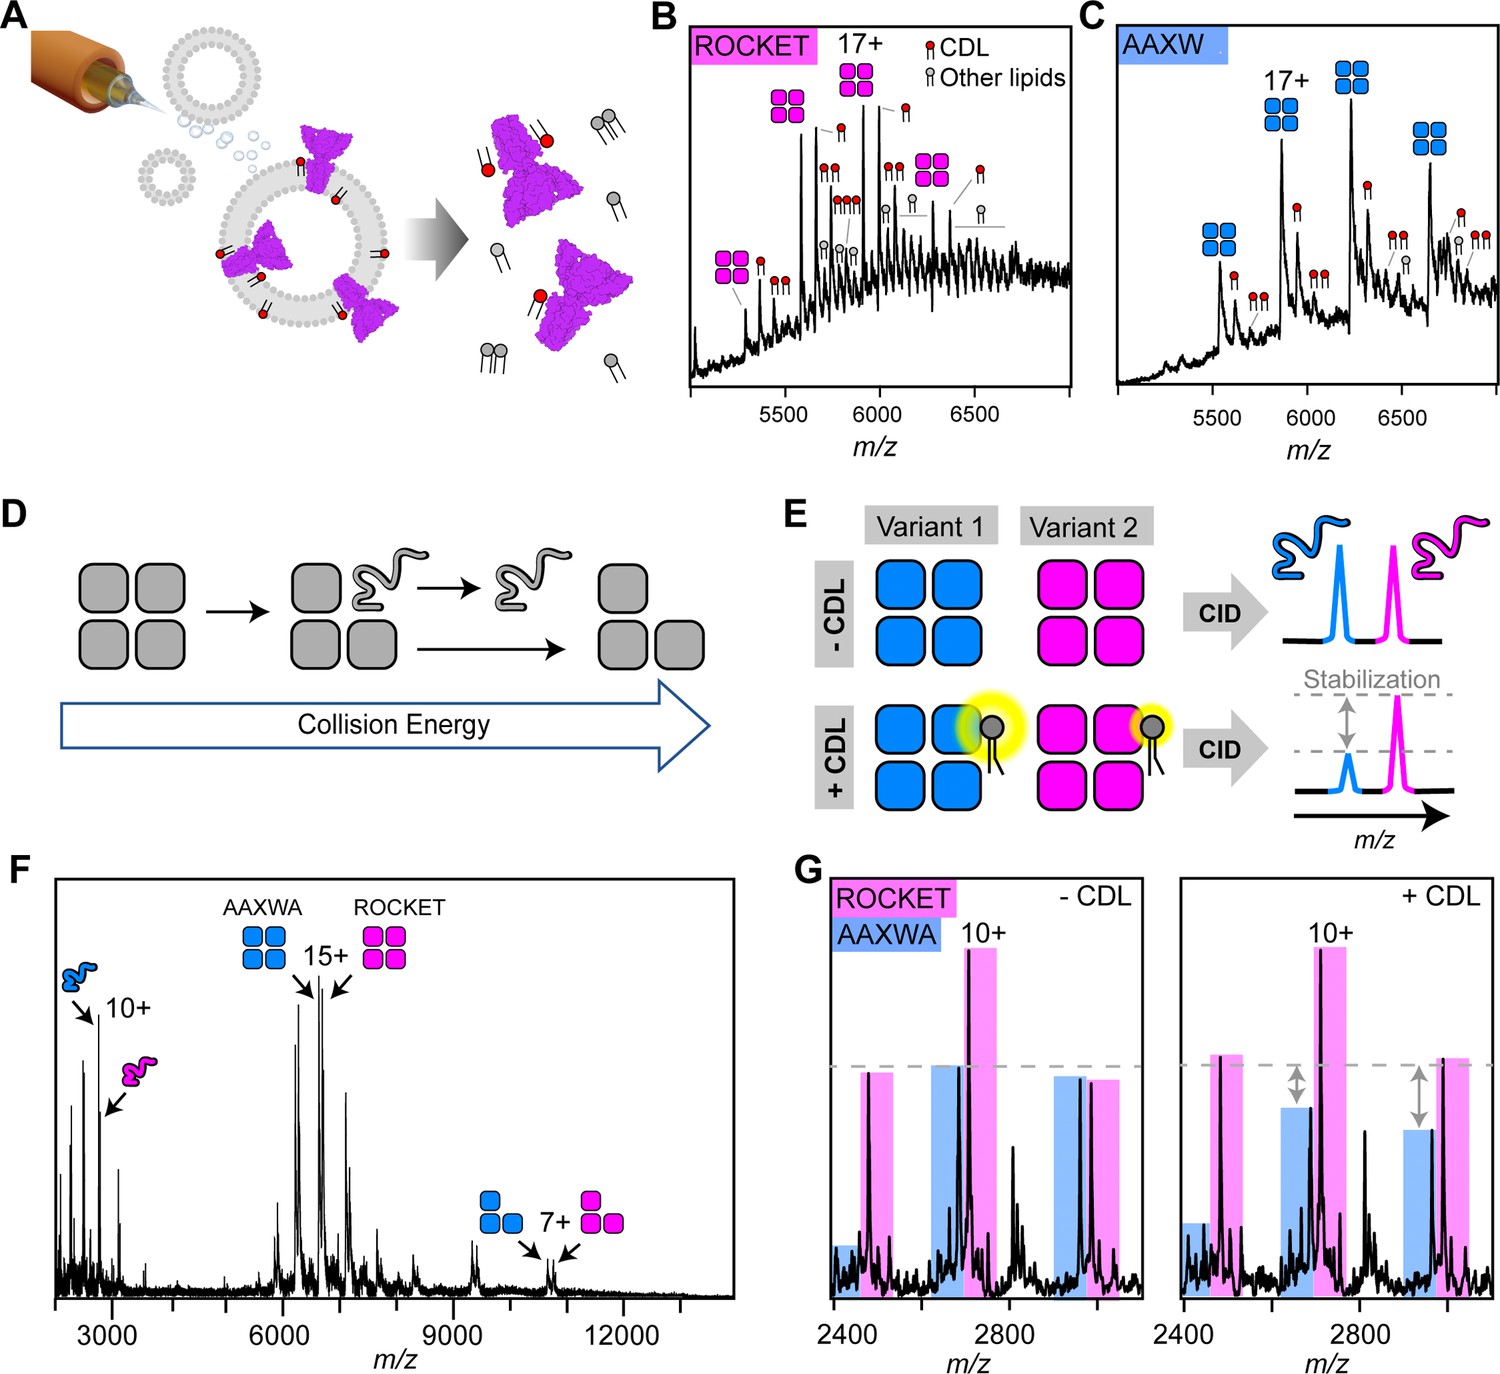
(A) Schematic depiction of electrospray ionization (ESI) process for proteo-liposomes, leading to the ejection of protein-lipid complexes into the gas-phase. (B) A representative mass spectrum of ROCKET released from proteoliposomes shows tetramers with 1–3 bound CDL molecules, as judged by the characteristic mass shift of 1.4 kDa, as well as additional lipids with molecular weights between 700 and 800 Da. (C) Release of ROCKETAAXWA from proteoliposomes shows retention of CDL molecules. For the 18+ion of the tetramer, a maximum of three CDL adducts can be assigned unambiguously. The reduced lipid adduct intensity compared to ROCKET indicates reduced lipid binding and/or complex stability. (D) Schematic illustrating the process of gas-phase subunit unfolding and ejection from ROCKET tetramers at increasing collision energies. (E) A nMS assay to assess CDL-mediated stabilization of ROCKET and ROCKETAAXWA. Simultaneous dissociation of ROCKET and ROCKETAAXWA leads to the ejection of unfolded monomers, which can be quantified by nMS (top row). Addition of CDL to the same mixture results in lipid binding to tetramers. If CDL binding stabilizes one tetrameric variant more than the other, the amount of ejected monomers will be reduced accordingly (bottom row). (F) Representative mass spectrum of ROCKET and ROCKETAAXWA at a collision voltage of 220 V. Intact tetramers are seen in the middle, ejected monomers and stripped trimers are seen in the low and high m/z regions, respectively. (G) Zoom of the low m/z region of a mixture of 25 µM each of ROCKET and ROCKETAAXWA with a collision voltage of 200 V before (left) and after (right) the addition of 50 µM CDL. The three main charge states for both variants can be distinguished based on their mass difference. Addition of CDL reduces the intensity of the ROCKETAAXWA monomer peaks compared to ROCKET (dashed line).
Figure 2—figure supplement 1
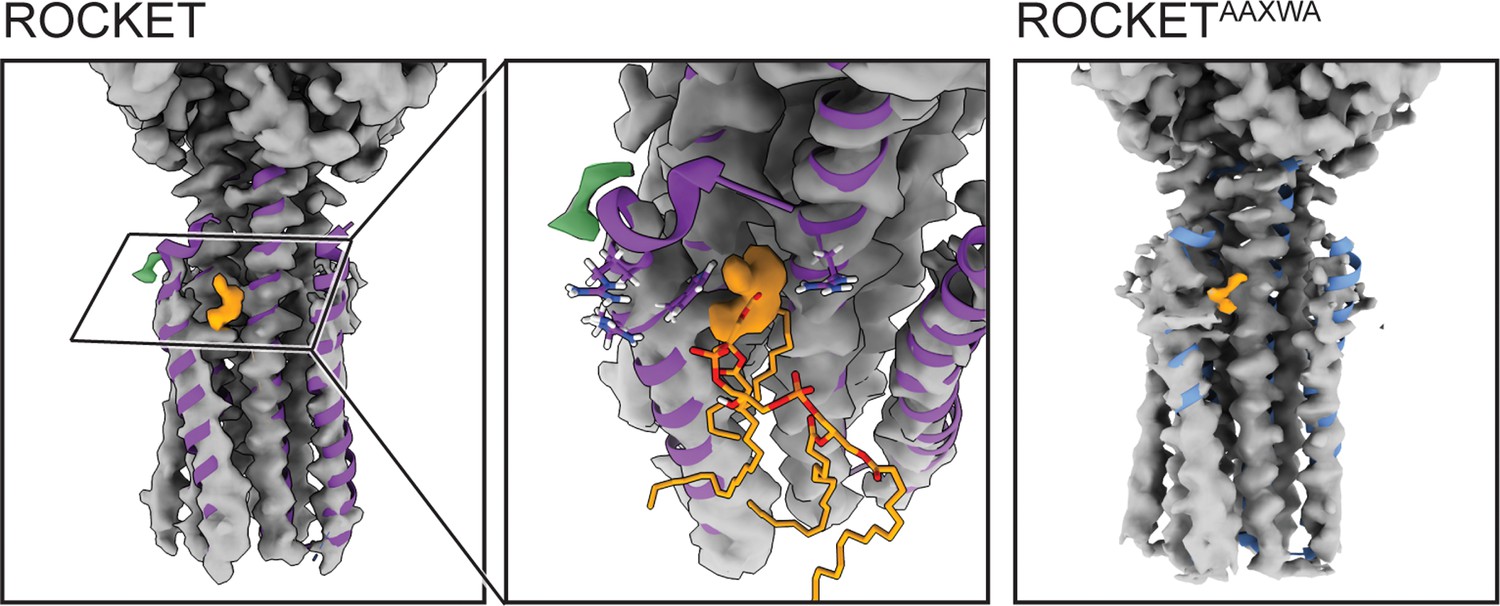
Cryo-EM densities for ROCKET and ROCKETAAXWA in the presence of CDL.
The MD-relaxed backbone of the X-ray structure of ROCKET (shown as ribbons) largely aligns with the densities. No substantial differences can be observed between the densities determined for ROCKET (left panel) and ROCKETAAXWA (right panel). The N-terminal end of helix 1 (residues 1–12) is relatively poorly resolved, possibly due to intrinsic flexibility. For both variants, a diffuse non-protein density (orange) partially overlaps with the lipid headgroup of CDL predicted in site 2 (middle panel).
Figure 2—figure supplement 2
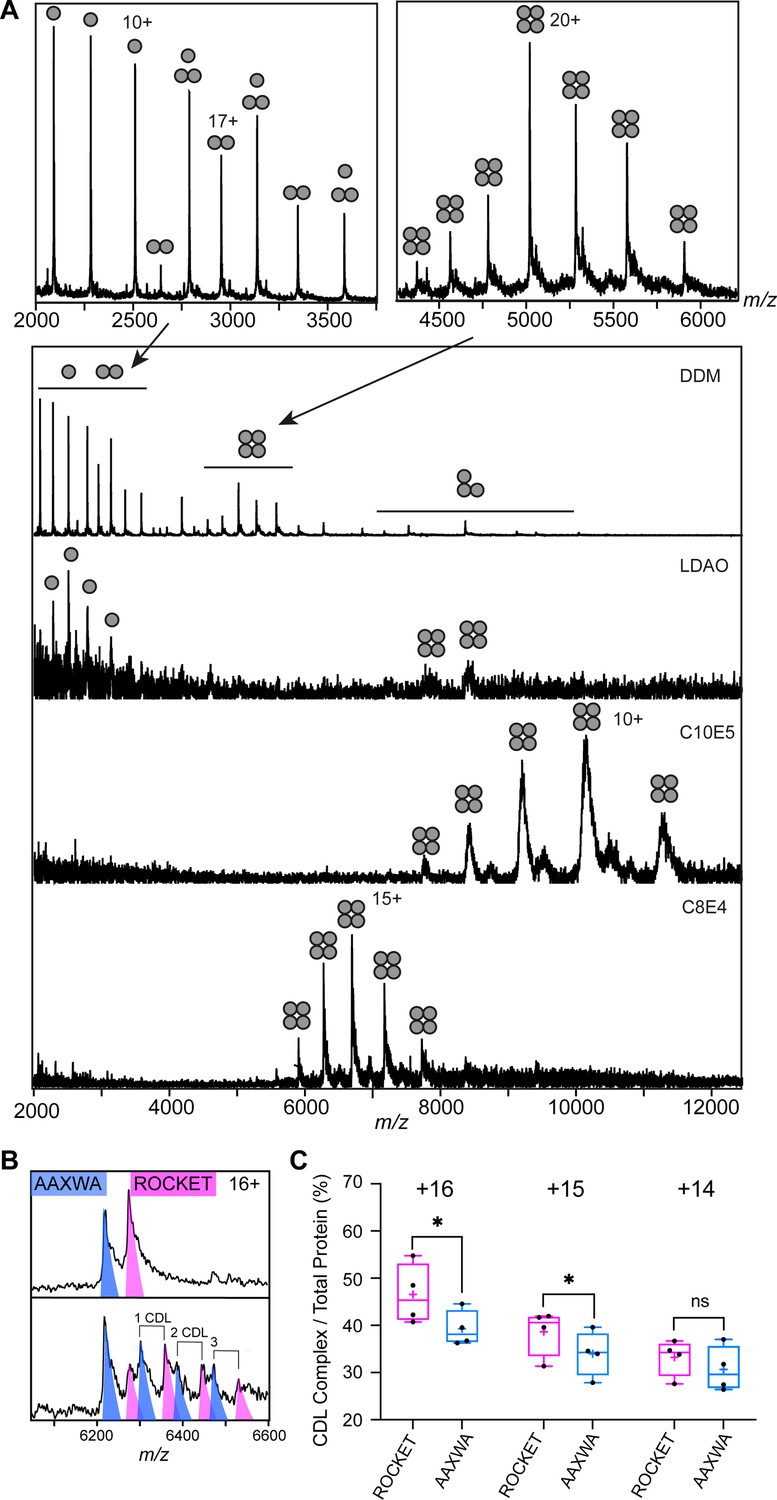
Detergent screening and CDL binding to ROCKET and ROCKETAAXWA.
(A) Detergent screening of ROCKET with nMS. Detergents DDM, LDAO, C10E5, and C8E4 were compared, only the PEG detergent C8E4 yielded intact tetramers. (B) CDL binding assay with equimolar amounts of ROCKET and ROCKETAAXWA in C8E4 before (top) and after (below) addition of CDL show preferential binding to ROCKET. The 16+charge state is shown. Spectra were recorded at collision voltage of 170 V. (C) Quantification of lipid binding difference between ROCKET and ROCKETAAXWA (as shown in Figure S4b) for the main charge states. The higher charge states (+16 and+ 15) show a significant change in lipid binding between ROCKET and ROCKETAAXWA, indicating that positively charged residues contribute to CDL binding (two-tailed t-tests (n=4), p=0.0140 and p=0.0284 for 16+and 15+, respectively, p=0.1733 for 14+).
Figure 2—figure supplement 3
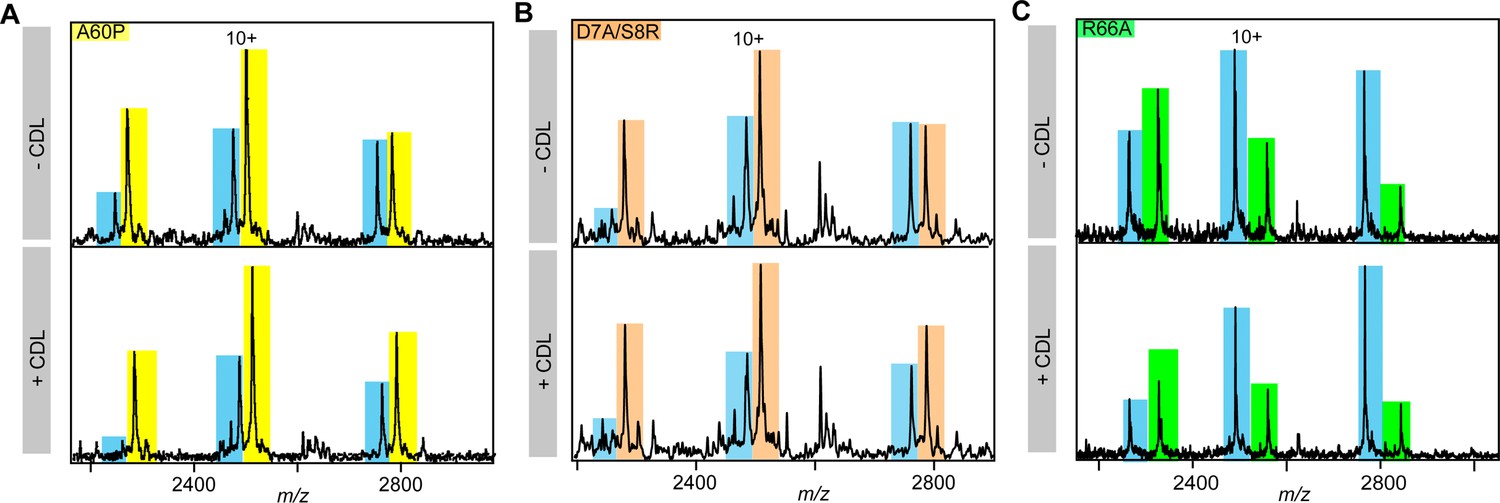
nMS spectra showing lipid-mediated stabilization of ROCKETAAXWA and ROCKETR66A (yellow).
Representative nMS spectra showing the intensity changes for unfolded monomers released from ROCKETAAWXA (blue) and (A) ROCKETA60P (yellow), (B) ROCKETD7A/S8R (orange), and (C) ROCKETR66A (green). See Figure 3 for quantification.
Figure 3 with 1 supplement
Assessment of lipid-mediated stabilization effects on ROCKET variant.
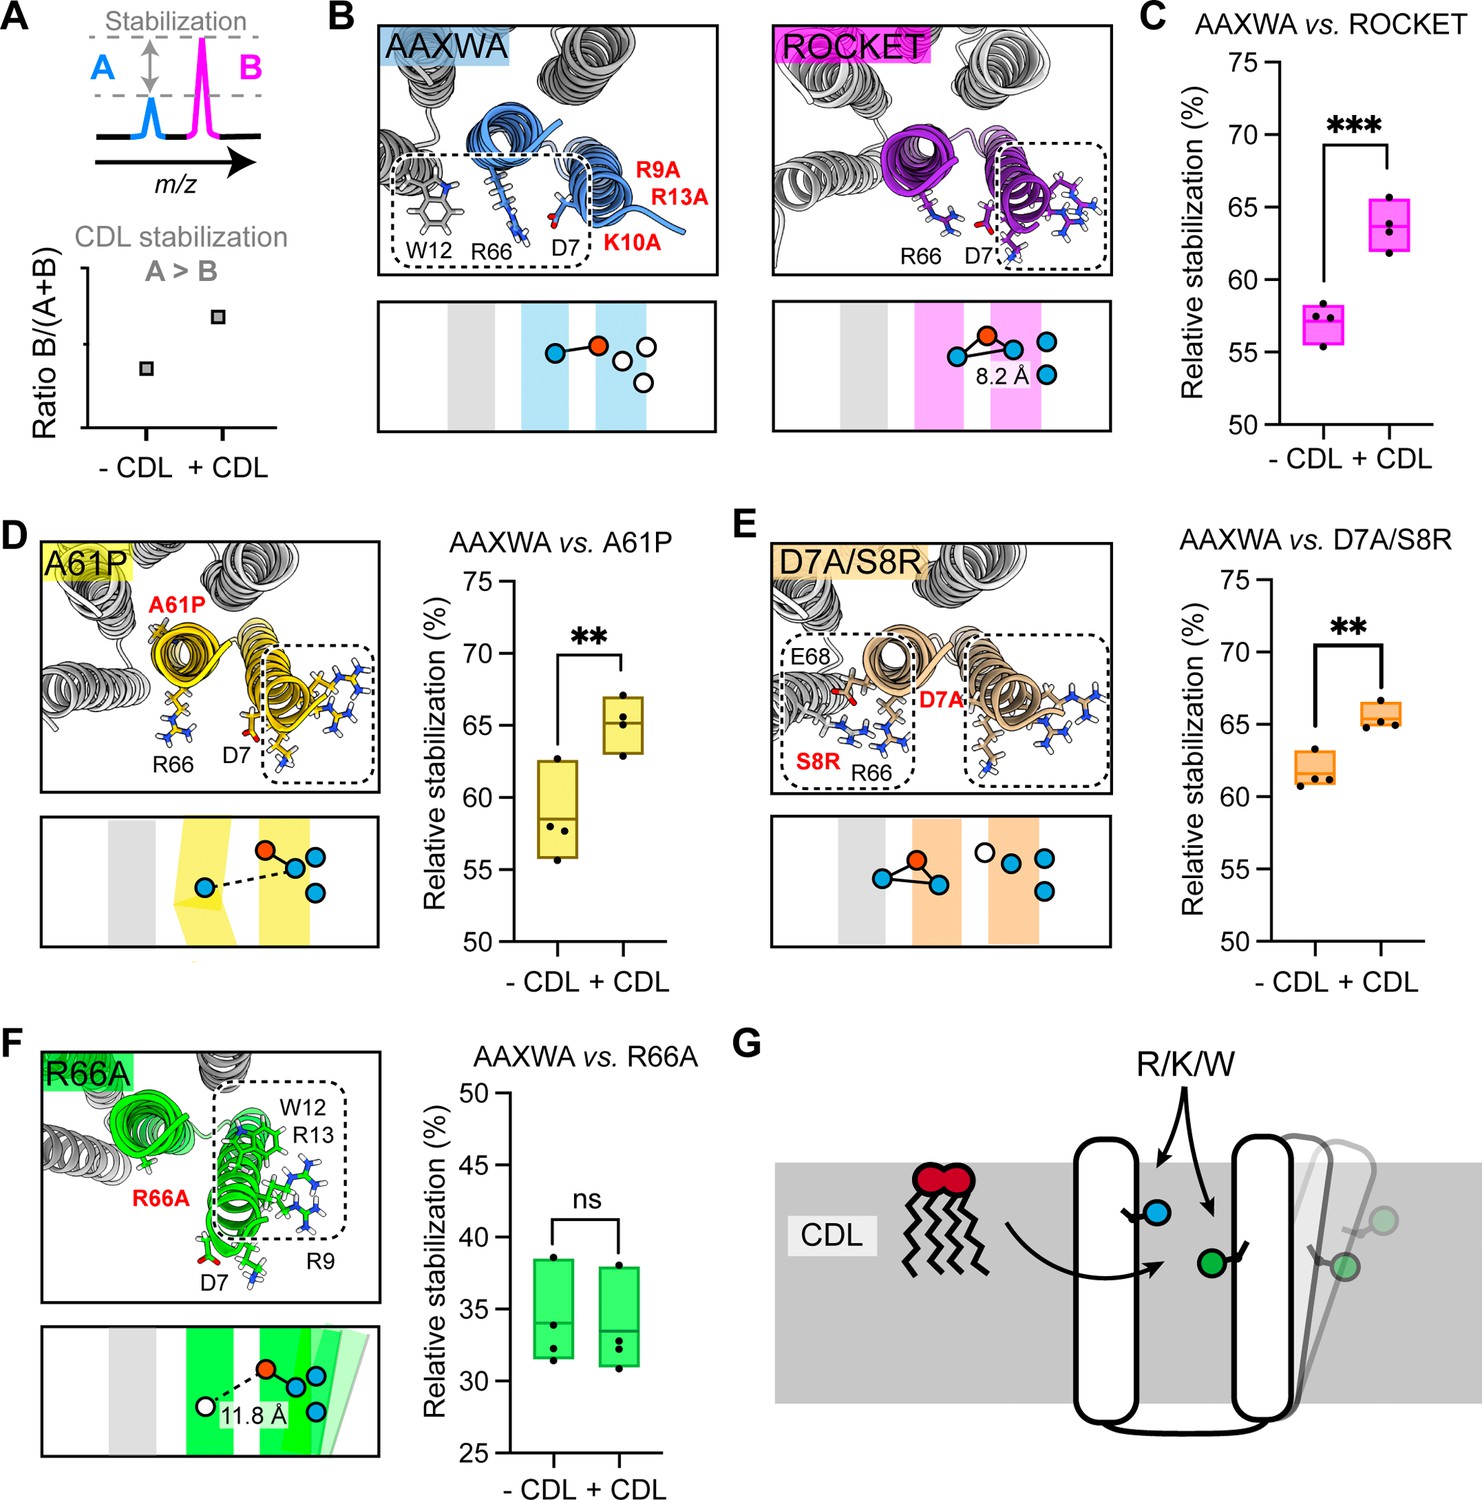
(A) Principle for pairwise analysis of protein stabilization by CDL. Peaks representing monomers released of protein A and B display intensity changes upon lipid addition. Plotting the peak intensities as a ratio of B to total protein (A+B) shows an increase upon CDL addition, if A is stabilized more than B. (B) Residues involved in CDL headgroup binding to ROCKET and ROCKETAAXWA were derived from CG-MD simulations (Figure 1) and are shown based on AlphaFold2 models as top view, with the area occupied by CDL as a dashed rectangle. A single subunit is colored (purple for ROCKET and blue for ROCKETAAXWA). Below the structure, the orientation of the CDL site and the helices are shown as schematics. Positively and negatively charged residues are blue dots, respectively. Residues mutated to alanine are shown as white dots. (C) Plotting the peak intensity ratios of ROCKET to (ROCKETAAXWA +ROCKET) in the presence and absence of CDL shows a decrease in ROCKETAAXWA monomers when CDL is added (p=0.0007, two-tailed t-tests with n=4). (D) The CDL binding site and location of the A61P mutation (yellow) mapped on the AlphaFold2 model of ROCKETA61P and shown as a schematic as a side view below. Intensity ratios show significantly more pronounced stabilization of ROCKETAAXWA than ROCKETA61P (p=0.0084, two-tailed t-tests with n=4). (E) Introduction of a second CDL binding site in the D7A/S8R variant (orange) mapped on the AlphaFold2 model of ROCKETD7A/S8R and shown as a schematic as a side view below. The shift in intensity ratios show that ROCKETAAXWA is still stabilized to a greater extent (p=0.0019, two-tailed t-tests with n=4), but with a smaller margin than ROCKET or ROCKETA61P. (F) The R66A mutation, designed to disconnect helix 1 from the tetrameric protein core, results in an outward rotation of the CDL binding site, as shown in the AlphaFold2 model (green) and the side view schematic. Intensity ratios show no change upon CDL addition, suggesting that ROCKETR66A is stabilized to a similar extent as ROCKETAAXWA (p=0.8113, two-tailed t-tests with n=4).(G) Conceptual diagram depicting structural features that promote CDL-mediated stabilization. Distributing the residues that interact with the lipid headgroup, usually basic and aromatic residues, between two helices, as well as involvement of flexible protein segments, indicated by an outward movement of the right helix, also enhances stabilization by CDL.
Figure 3—figure supplement 1
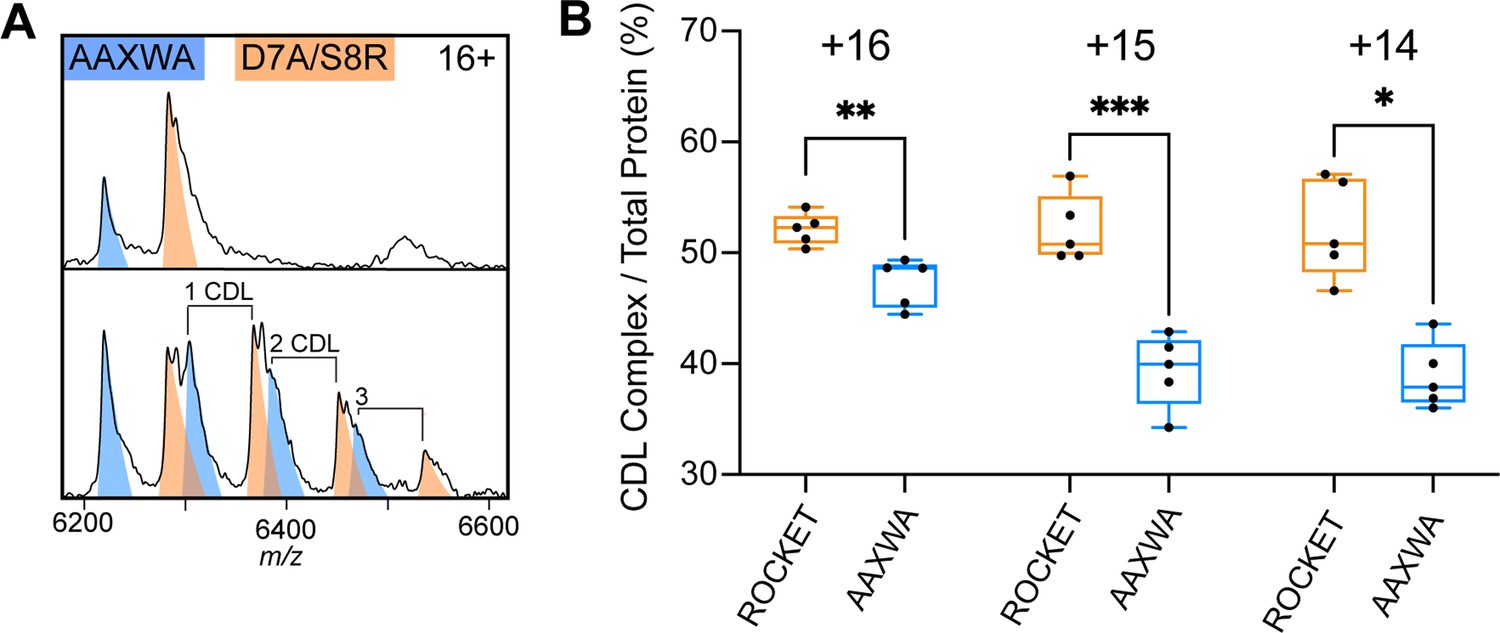
Lipid binding to ROCKETAAXWA vs ROCKETD7A/S8R.
(A) CDL binding assay with equimolar amounts of ROCKETD7A/S8R and ROCKETAAXWA in C8E4 before (top) and after (below) addition of CDL show preferential binding to ROCKET. The 16+charge state is shown. Spectra were recorded at collision voltage of 170 V. (B) Quantification of lipid binding difference between ROCKETD7A/S8R and ROCKETAAXWA (as shown in Figure S6a) for the main charge states. The higher charge states (+16 and+15) show a significant change in lipid binding between ROCKETD7A/S8R and ROCKETAAXWA, indicating that positively charged residues contribute to CDL binding (two-tailed t-tests (n=5), p=0.0039 and p=0.0009 for 16+ and 15+, respectively, p=0.0102 for 14+).
Figure 4 with 2 supplements
Identification of a functional CDL binding site in the GlpG membrane protease.
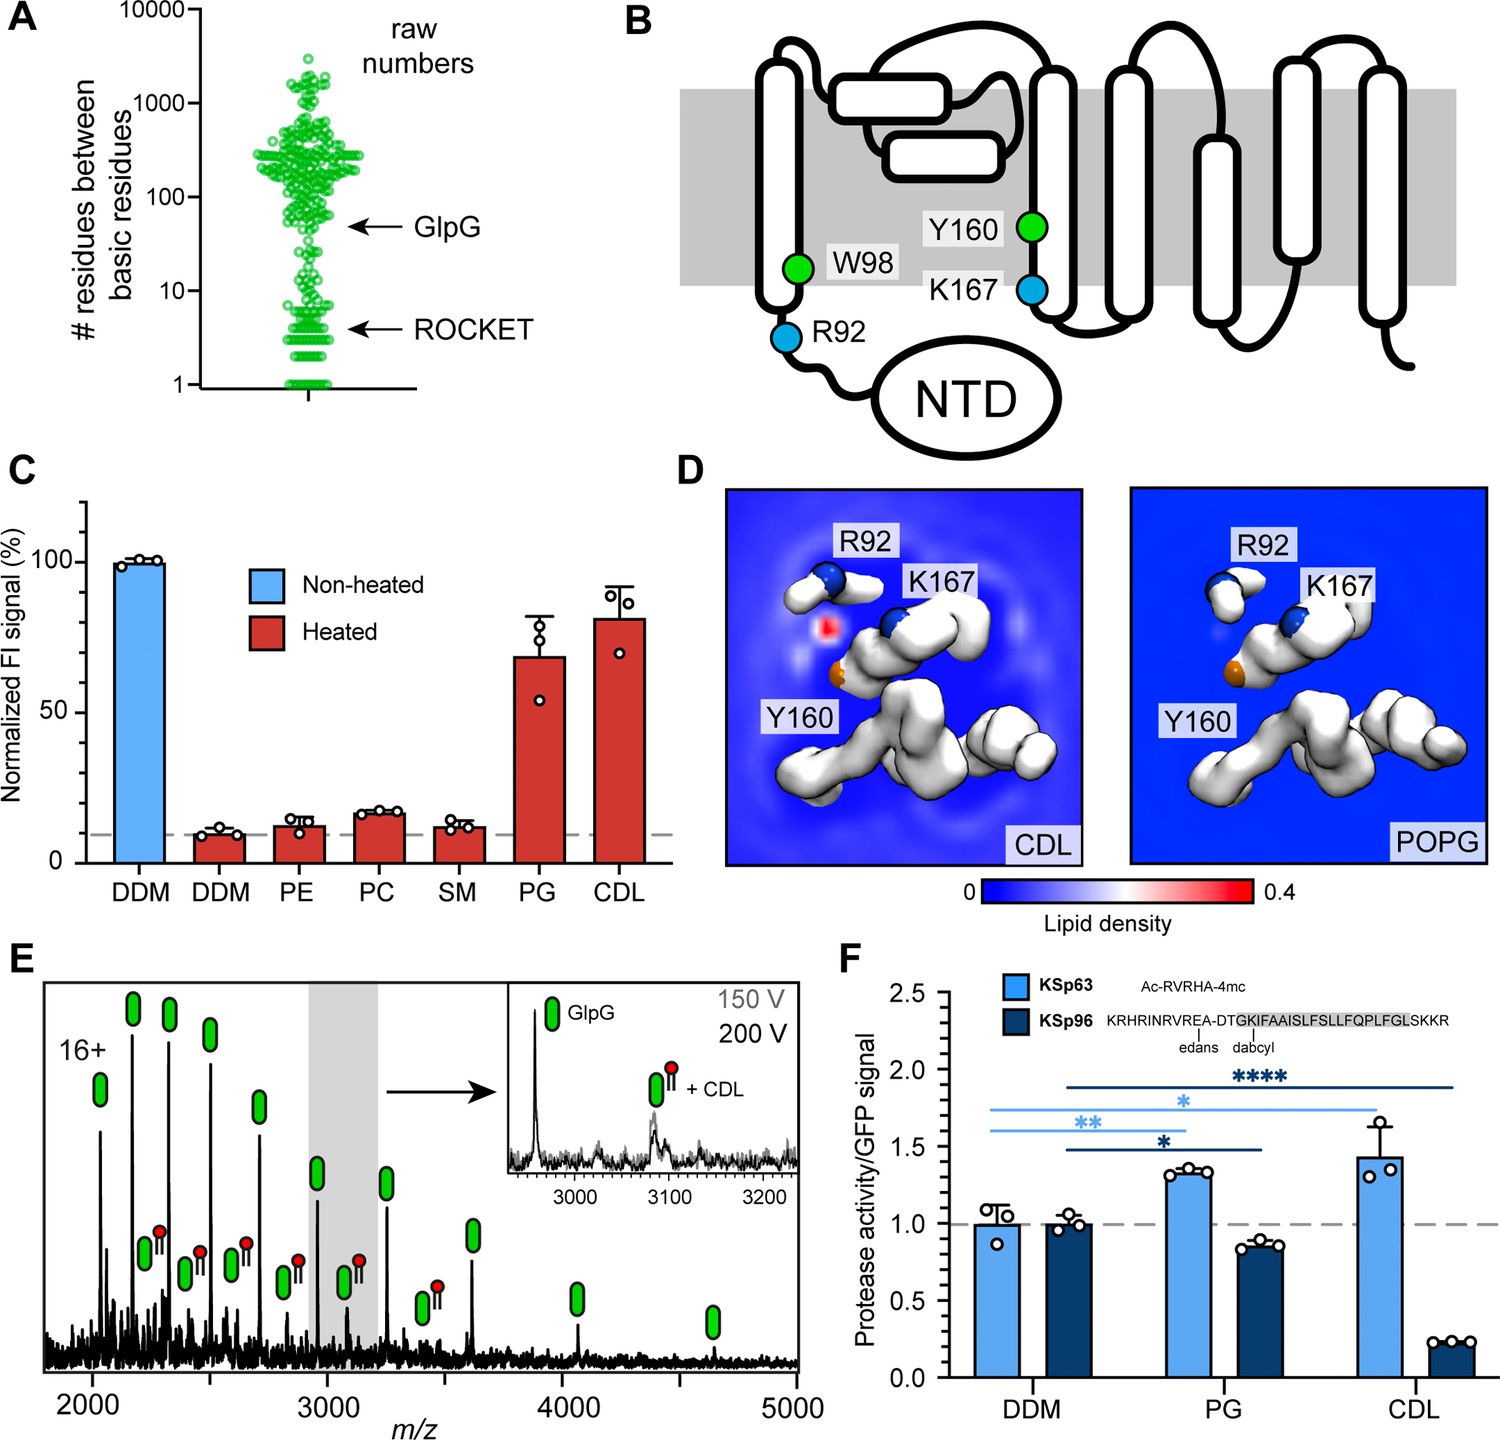
(A) Distances between basic residues within the same CDL binding site and their occurrence in E. coli membrane proteins. GlpG contains a CDL binding site with two basic residues separated by 75 positions. Site 1 in ROCKET (four positions) is indicated for reference. (B) Topology diagram of GlpG indicating the locations of basic (R; arginine, L; lysine) and aromatic (W; tryptophan, Y; tyrosine) residues that interact with CDL. (C) GFP-thermal shift assay of GlpG in detergent or in the presence of PE, PC, SM, PG, or CDL. The average fluorescence intensity (FI) indicates the fraction of soluble protein before (unheated) or after heating to 63 °C and removing precipitated protein. Data are normalized against the non-heated control in detergent. All measurements were performed in triplicates (n=3). (D) CG-MD-derived Lipid density plots for CDL (left) and POPG (right) around the transmembrane region of GlpG (PDB ID 2IC8) viewed from the cytoplasmic side. Units are number density. CDL, but not POPG, exhibits preferential binding to the R92-K167 site. The backbones of R92, K67, and Y160 are shown as spheres (basic in blue, aromatic in orange). (E) nMS spectra of GlpG released from detergent micelles show a 1.4 kDa adduct which can be removed through collisional activation of the protein. (F) GlpG proteolytic cleavage rates (specific activity, by normalizing to the GFP signal) for soluble (extramembrane) substrate (KSp63) or transmembrane substrate (KSp96, transmembrane helix shaded) in the presence of PG or CDL. Both lipids increase the cleavage rate for the soluble substrate by approximately 40%. For the transmembrane substrate, addition of PG causes a moderate reduction in cleavage activity, whereas CDL causes near-complete inhibition of cleavage (CDL KSp96 p<0.0001, CDL KSp63 p=0.028, PG KSp96 p=0.0171, and PG KSp63 p=0.0089, all analyzed with two-tailed t-test, n=3).
Figure 4—figure supplement 1
Analysis of CDL binding sites in E. coli proteins and GlpG.
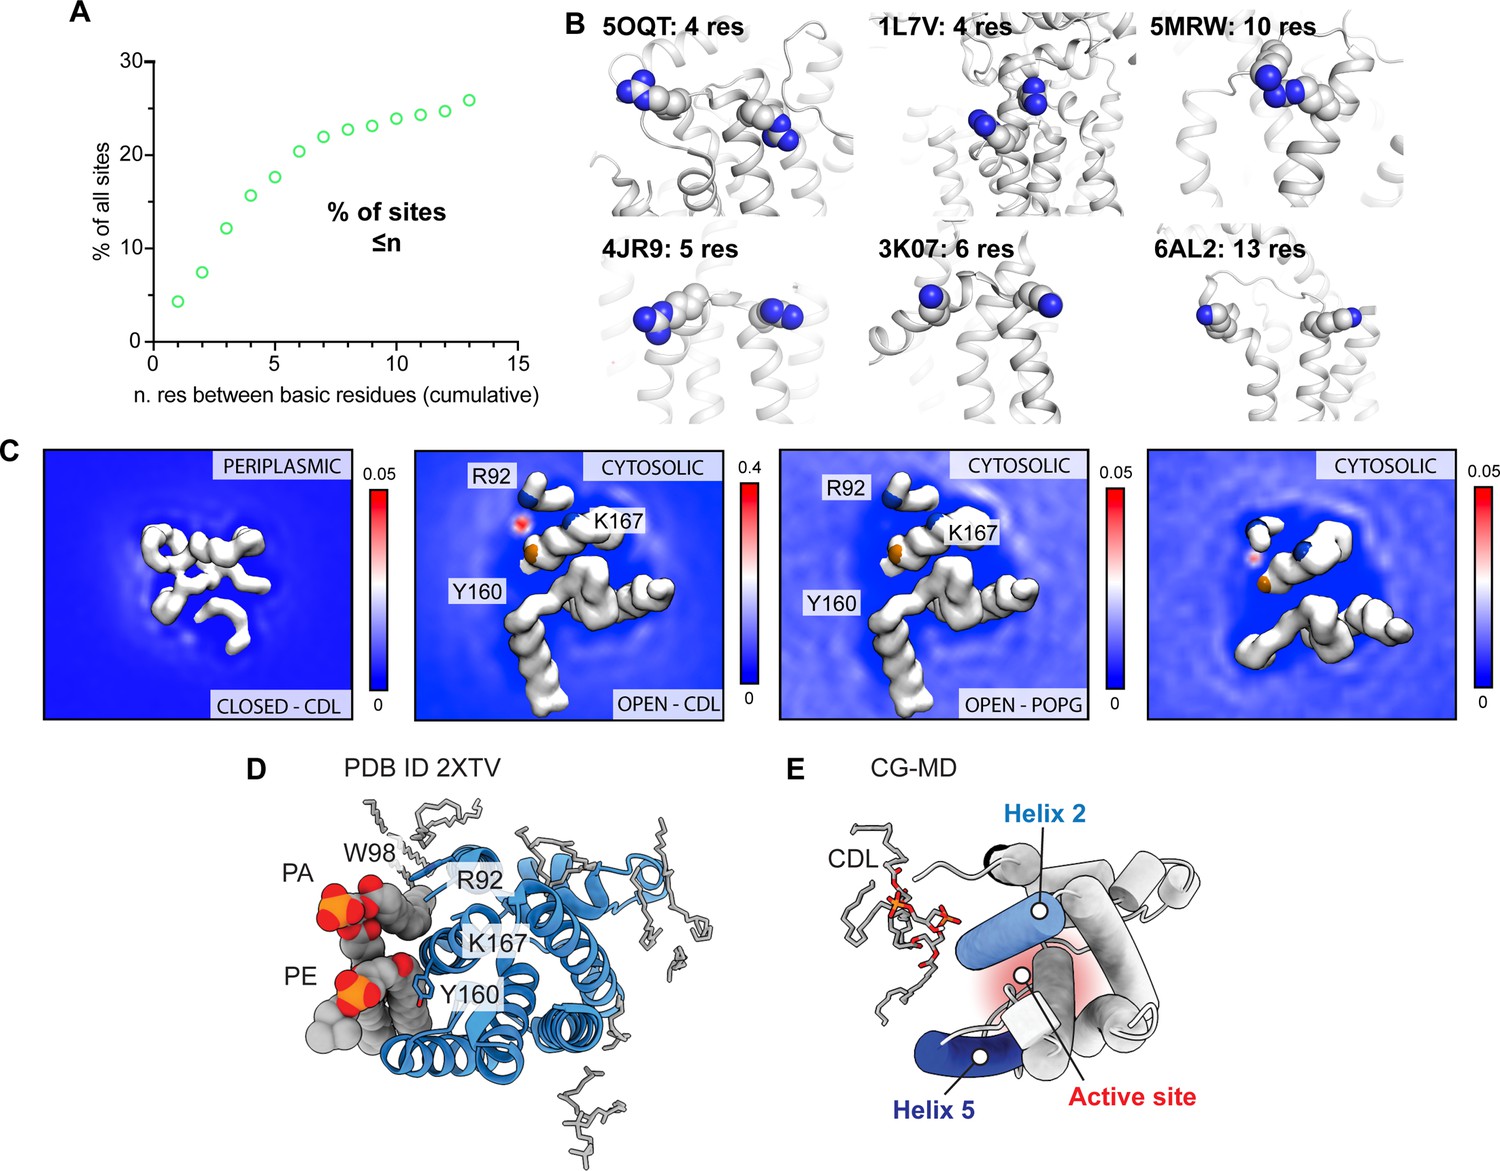
(A) Distributions of distances between basic residues within single CDL binding sites in E. coli membrane proteins. Less than 20% of all binding sites contain basic residues separated by <10 sequence positions, which is a requirement for CDL binding to a single helix. (B) Representative CDL binding sites with less than ten residues between the basic residues show confinement to a single helix or loop region. Sites were identified by CG-MD simulations, see Ref (Landreh et al., 2017). (C) Lipid density maps derived from CG-MD simulations of the closed state (PDB ID 2NRF) and open state (PDB ID 2IC8) of GlpG. The left panel shows the periplasmic side, the other panels the cytoplasmic side as in Figure 4d. The ‘CDL’ data are from a 10% CDL, 10% POPG, and 80% POPE membrane, whereas the ‘POPG’ data are from a 10% POPG and 90% POPE membrane. All density plots are taken over the total 5x10 µs of CG-MD. (D) Crystal structure of GlpG with bound lipids shows tentatively modeled PA and PE lipids occupying the CDL binding site (PDB ID 2XTV). (E) CG-MD snapshot of CDL bound to the closed conformation of GlpG, showing insertion of acyl chains into the gap between helices 2 and 5 that provides access to the active site on the other leaflet (red).
Figure 4—figure supplement 2
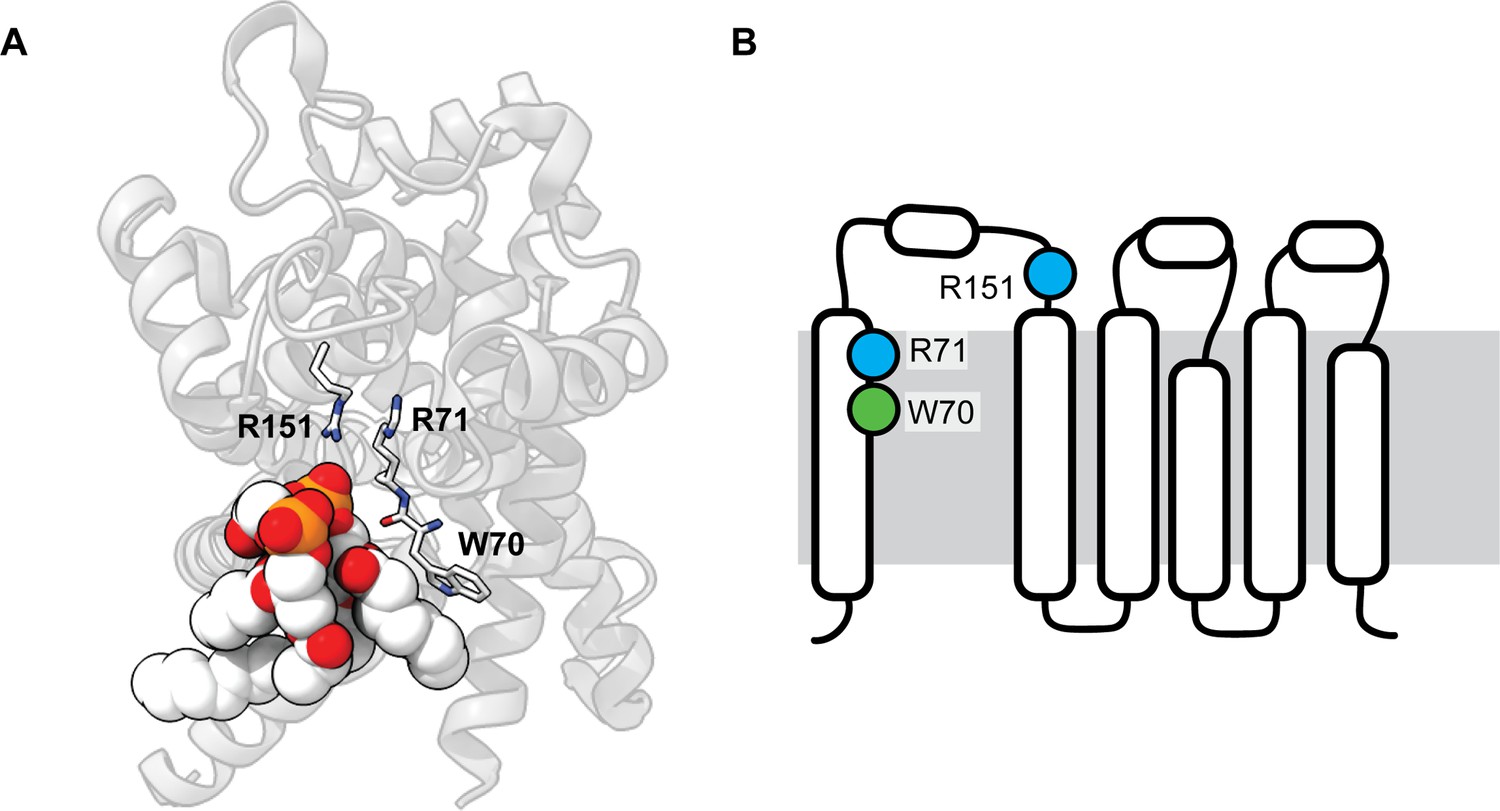
Analysis of the stabilizing CDL binding site in the Yeast ADP/ATP carrier Aac2.
(A) Crystal structure of Aac2 shows a CDL bound to W70/R71/R151. The residues coordinating CDL are shown as sticks, the CDL molecule is rendered as spacefill (PDB ID 1OKC). (B) The CDL site connects helix 1 to the helical core of Aac2, with high overall similarlty to the CDL site in GlpG.
Additional files
-
Supplementary file 1
Supplementary tables 1-3.
- https://cdn.elifesciences.org/articles/104237/elife-104237-supp1-v1.docx
-
MDAR checklist
- https://cdn.elifesciences.org/articles/104237/elife-104237-mdarchecklist1-v1.pdf
Download links
A two-part list of links to download the article, or parts of the article, in various formats.
Downloads (link to download the article as PDF)
Open citations (links to open the citations from this article in various online reference manager services)
Cite this article (links to download the citations from this article in formats compatible with various reference manager tools)
Engineering cardiolipin binding to an artificial membrane protein reveals determinants for lipid-mediated stabilization
eLife 14:RP104237.
https://doi.org/10.7554/eLife.104237.3


