Wag31, a membrane tether, is crucial for lipid homeostasis in mycobacteria
- CSIR-Centre for Cellular and Molecular Biology (CSIR-CCMB), India
- Academy of Scientific and Innovative Research (AcSIR), India
- Indian Institute of Science Education and Research Pune, India
- CSIR-Institute of Genomics and Integrative Biology (CSIR-IGIB), India
- Vaccine and Infectious Disease Organisation, University of Saskatchewan, Canada
- Department of Biochemistry, Microbiology and Immunology, University of Saskatchewan, Canada
- National Institute of Immunology, India
Figures
Figure 1 with 1 supplement
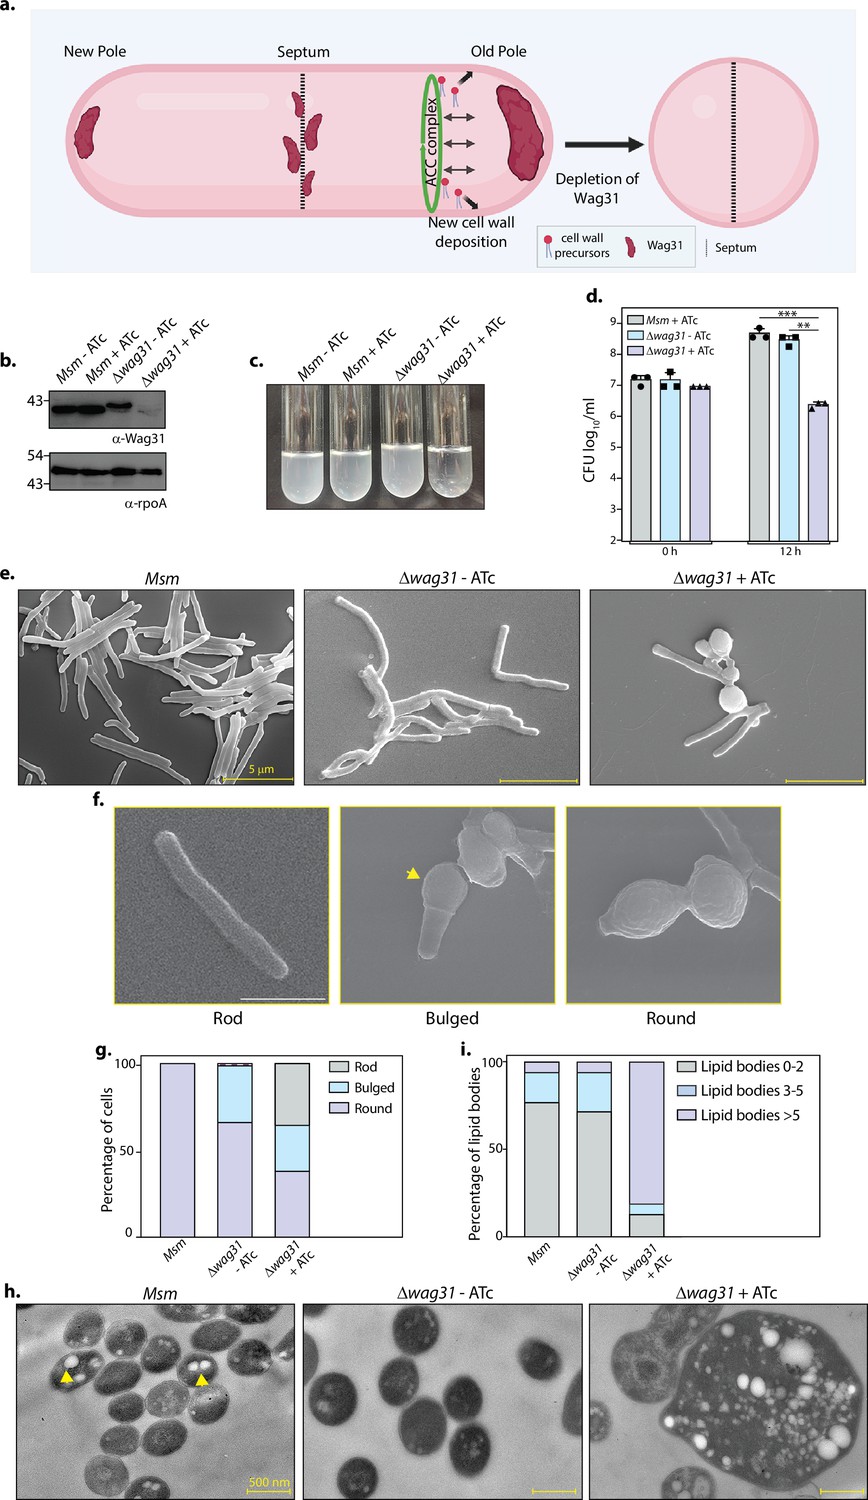
Loss of Wag31 leads to the formation of intracellular lipid inclusions (ILIs).
(a) Illustration depicting the known role of Wag31 in directing polar elongation and maintaining rod-shaped morphology of cells. Created in BioRender.com. (b) Whole-cell lysates (WCL) were prepared from Msm and Δwag31 either untreated or treated with 100 ng/ml ATc for 12 hr, and 40 μg lysate was resolved on a 12% gel, transferred on nitrocellulose membrane, and probed with either α-Wag31 or α-rpoA antibody (loading control), respectively. (c) Cultures showing growth of Msm and Δwag31 either untreated or treated with 100 ng/ml ATc for 12 hr. (d) Msm+ATc, Δwag31-ATc, and Δwag31+ATc were tracked for bacillary survival at 0 and 12 hr by enumerating CFUs. Appropriate serial dilutions were plated on 7H11 plates (without antibiotic or ATc), and bar graphs demonstrating bacillary survival (CFU log10/ml ± standard deviations (SD), represented by error bars) were plotted at indicated time points. Statistical significance was calculated using two-way ANOVA 0.0021 (**), 0.0002 (***). The experiment was performed twice independently, each performed in triplicates. (e) Scanning electron micrographs (SEM) showing Msm, Δwag31-ATc, and Δwag31+ATc at 12 hr post-treatment. (f) Cells depicting rod, bulged, or round morphology. The yellow arrowhead indicates bulged pole of the cell. (g) 200 cells from each group were checked for either rod, bulged, or round morphology, and the percentage of cells with these morphologies in all the three strains was plotted in a bar graph. (h) Transmission electron micrographs (TEM) showing Msm, Δwag31-ATc, and Δwag31+ATc at 12 hr post-treatment. (i) 250 cells, each from Msm, Δwag31-ATc, and 185 cells from Δwag31+ATc, were divided into three classes (0–2, 2–5, and >5 ILIs) based on the number of ILIs and the percentage of each class in every strain was plotted in a bar graph.
-
Figure 1—source data 1
Source data used for Figure 1b, c, e, f, h.
The areas used for making the final figure are marked by yellow boxes.
- https://cdn.elifesciences.org/articles/104268/elife-104268-fig1-data1-v1.zip
-
Figure 1—source data 2
Unmarked and uncropped source data used for Figure 1b, c, e, f, h.
- https://cdn.elifesciences.org/articles/104268/elife-104268-fig1-data2-v1.zip
-
Figure 1—source data 3
Source data used for plotting Figure 1d, g, i.
All the plots were generated using GraphPad Prism.
- https://cdn.elifesciences.org/articles/104268/elife-104268-fig1-data3-v1.zip
Figure 1—figure supplement 1
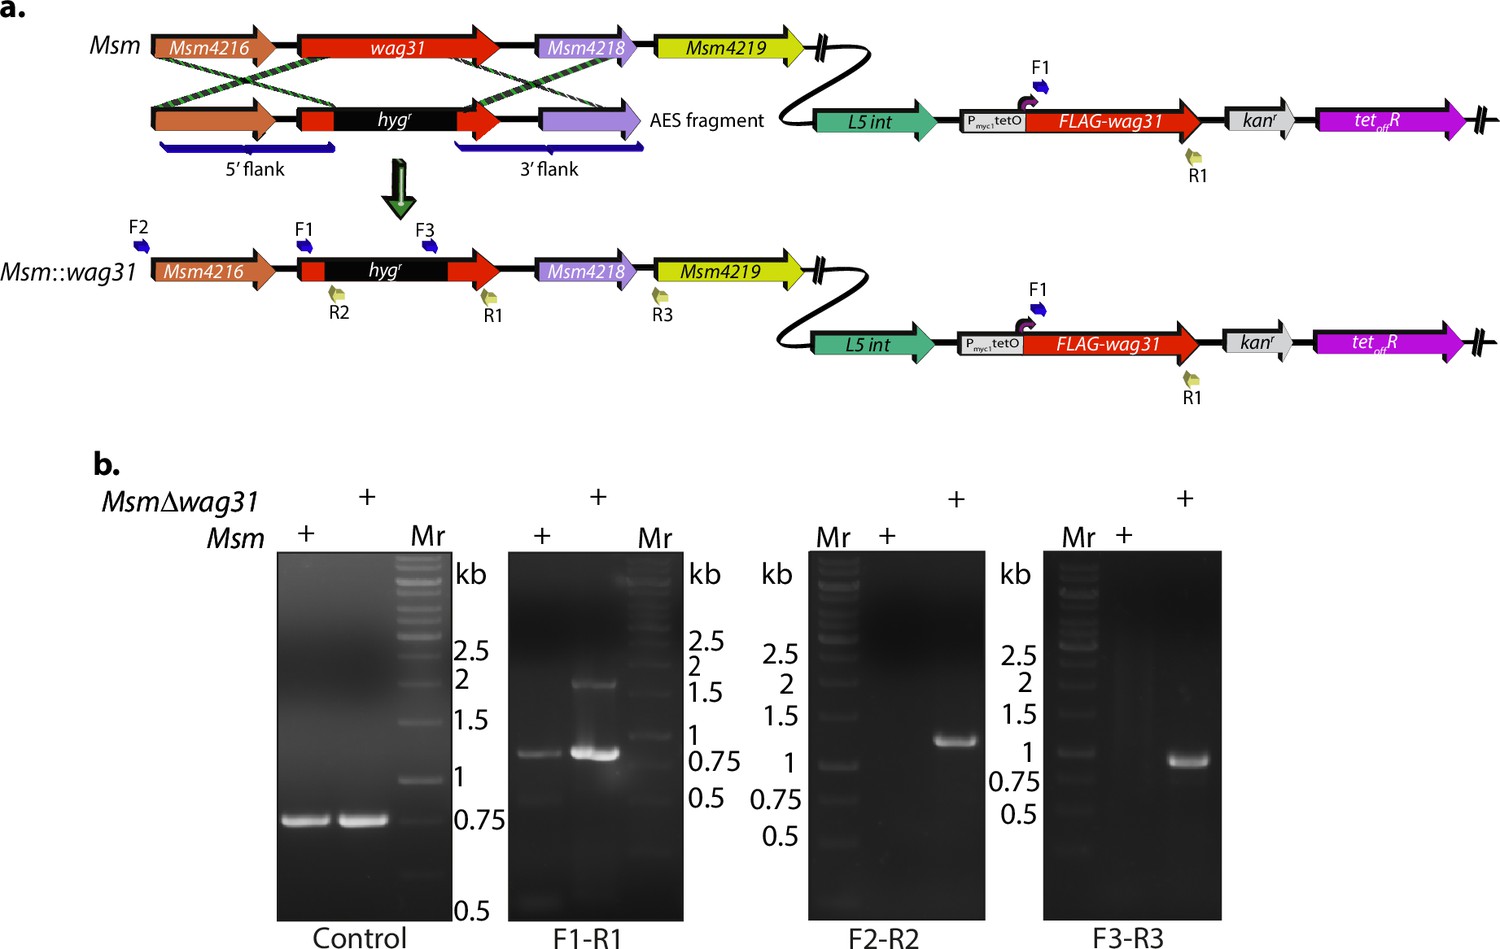
Generation of Wag31 knockdown.
(a) Schematic showing the wag31 locus in Msm and Δwag31 and illustrating the strategy utilized to replace wag31 locus with hygromycin resistance cassette. Primers used for knockout confirmation are indicated as F1, R1, F2, R2, F3, and R3. (b) 1% agarose gels showing confirmatory PCRs performed with different primer sets. The first PCR, or the control PCR, was done using SepIVA (738 bp) primers showing amplicon at ~750 bp. It indicates an equal amount of gDNA isolated from Msm and Δwag31 and subsequently used for all PCRs. The next panel shows amplicons from the PCR performed with the F1–R1 pair, which bind to wag31 locus (~819 bp). They yield an 819 bp amplicon in the case of Msm and 819 bp and an additional ~1.5 kb amplicon in the case of Δwag31. The third and fourth panels show amplicons amplified using the F2–R2 set (expected amplicon ~1.2 kb) and F3–R3 set (expected amplicon ~0.9 kb), which are expected only in the case of Δwag31 confirming legitimate recombination at the native locus.
-
Figure 1—figure supplement 1—source data 1
Source data used for Figure 1—figure supplement 1b.
The lanes used for making the figure are made of yellow boxes.
- https://cdn.elifesciences.org/articles/104268/elife-104268-fig1-figsupp1-data1-v1.zip
-
Figure 1—figure supplement 1—source data 2
Unmarked and uncropped source data used for Figure 1—figure supplement 1b.
- https://cdn.elifesciences.org/articles/104268/elife-104268-fig1-figsupp1-data2-v1.zip
Figure 2 with 1 supplement

Wag31 levels perturb lipid homeostasis.
Representative micrographs showing BODIPY staining in (a) Msm+ATc, Δwag31-ATc, and Δwag31+ATc samples imaged 12 hr post-ATc treatment. (b) Msm+IVN, Msm::wag31+IVN samples imaged 12 h post 5 μM IVN treatment. (c) Corrected total cell fluorescence was calculated in individual bacterial cells from Msm+ATc, Δwag31-ATc, and Δwag31+ATc strains (N = 48) and plotted in a graph. Horizontal bar represents median corrected total cell fluorescence (CTCF). Statistical analysis was performed using one-way ANOVA followed by Brown–Forsythe test (Tukey’s multiple comparison test; 0.0021 (**),<0.0001 (****)). (d) Corrected total cell fluorescence was calculated for 42 individual cells from Msm+IVN, and Msm::wag31+IVN strains and plotted in a graph (statistical analysis was performed using Welch’s t-test 0.0021 (**)). (e) Schematic depicting the workflow of Lipidomics (LC–MS). Created in BioRender.com. (f, g) Heatmap depicting log2 fold change (FC) in indicated lipid classes of Msm+ATc, Δwag31-ATc, and Δwag31+ATc as compared to Msm-ATc. The experiment was performed with six biological replicates, and the abundances of identified lipid classes were normalized to Msm-ATc to yield relative abundances of lipids in other strains. Blue and red colours indicate up- and downregulated lipid classes; colour intensity variation changes with log2 FC. (h) Bar graph (mean ± SEM) depicting the abundance of α-MA in Msm and Msm::wag31 treated with 5 μM IVN for 12 hr. Values on the y-axis represent area under the curve (AUC) normalized to an internal standard (FFA 15:0). x-axis represents various species (chain length variations) of α-MA (statistical analysis was performed using two-way ANOVA followed by a Tukey’s multiple comparison’s test; <0.0001 (****)).
-
Figure 2—source data 1
Source data used for Figure 2a, b.
The areas used for making the figure are marked.
- https://cdn.elifesciences.org/articles/104268/elife-104268-fig2-data1-v1.zip
-
Figure 2—source data 2
Unmarked and uncropped source data used for Figure 2a, b.
- https://cdn.elifesciences.org/articles/104268/elife-104268-fig2-data2-v1.zip
-
Figure 2—source data 3
Source data used for plotting Figure 2c, d, f–h.
All the plots were generated using GraphPad Prism.
- https://cdn.elifesciences.org/articles/104268/elife-104268-fig2-data3-v1.zip
Figure 2—figure supplement 1

Wag31 levels perturb lipid homeostasis.
(a) Whole-cell lysates (WCL) were prepared from Msm and Msm::wag31 treated with 5 μM IVN for 12 hr, and 40 μg lysate was resolved on a 12% gel, transferred on nitrocellulose membrane, and probed with either α-FLAG or α-rpoA antibody (loading control), respectively. Bar graphs (mean ± SEM) depicting the abundance of various lipids classes, (b) TAG, (c) DAG, (d) FFA, (e) PE, (f) PI, and (g) CL in Msm and Msm::wag31 treated with 5 μM IVN for 12 hr. Values on the y-axis represent area under the curve (AUC) normalized to an internal standard. x-axis represents various species (chain length variations) of the above mentioned lipid classes. The experiment was performed with six biological replicates, and the abundances of identified lipid classes were normalized to Msm-IVN to yield relative abundances of lipids in Msm::wag31+IVN.
-
Figure 2—figure supplement 1—source data 1
Source data used for making Figure 2—figure supplement 1a.
- https://cdn.elifesciences.org/articles/104268/elife-104268-fig2-figsupp1-data1-v1.zip
-
Figure 2—figure supplement 1—source data 2
Unmarked and uncropped source data used for making Figure 2—figure supplement 1a.
- https://cdn.elifesciences.org/articles/104268/elife-104268-fig2-figsupp1-data2-v1.zip
-
Figure 2—figure supplement 1—source data 3
Source data used for plotting Figure 2—figure supplement 1b–d, f, g.
All the plots were generated using GraphPad Prism.
- https://cdn.elifesciences.org/articles/104268/elife-104268-fig2-figsupp1-data3-v1.zip
Figure 3 with 2 supplements
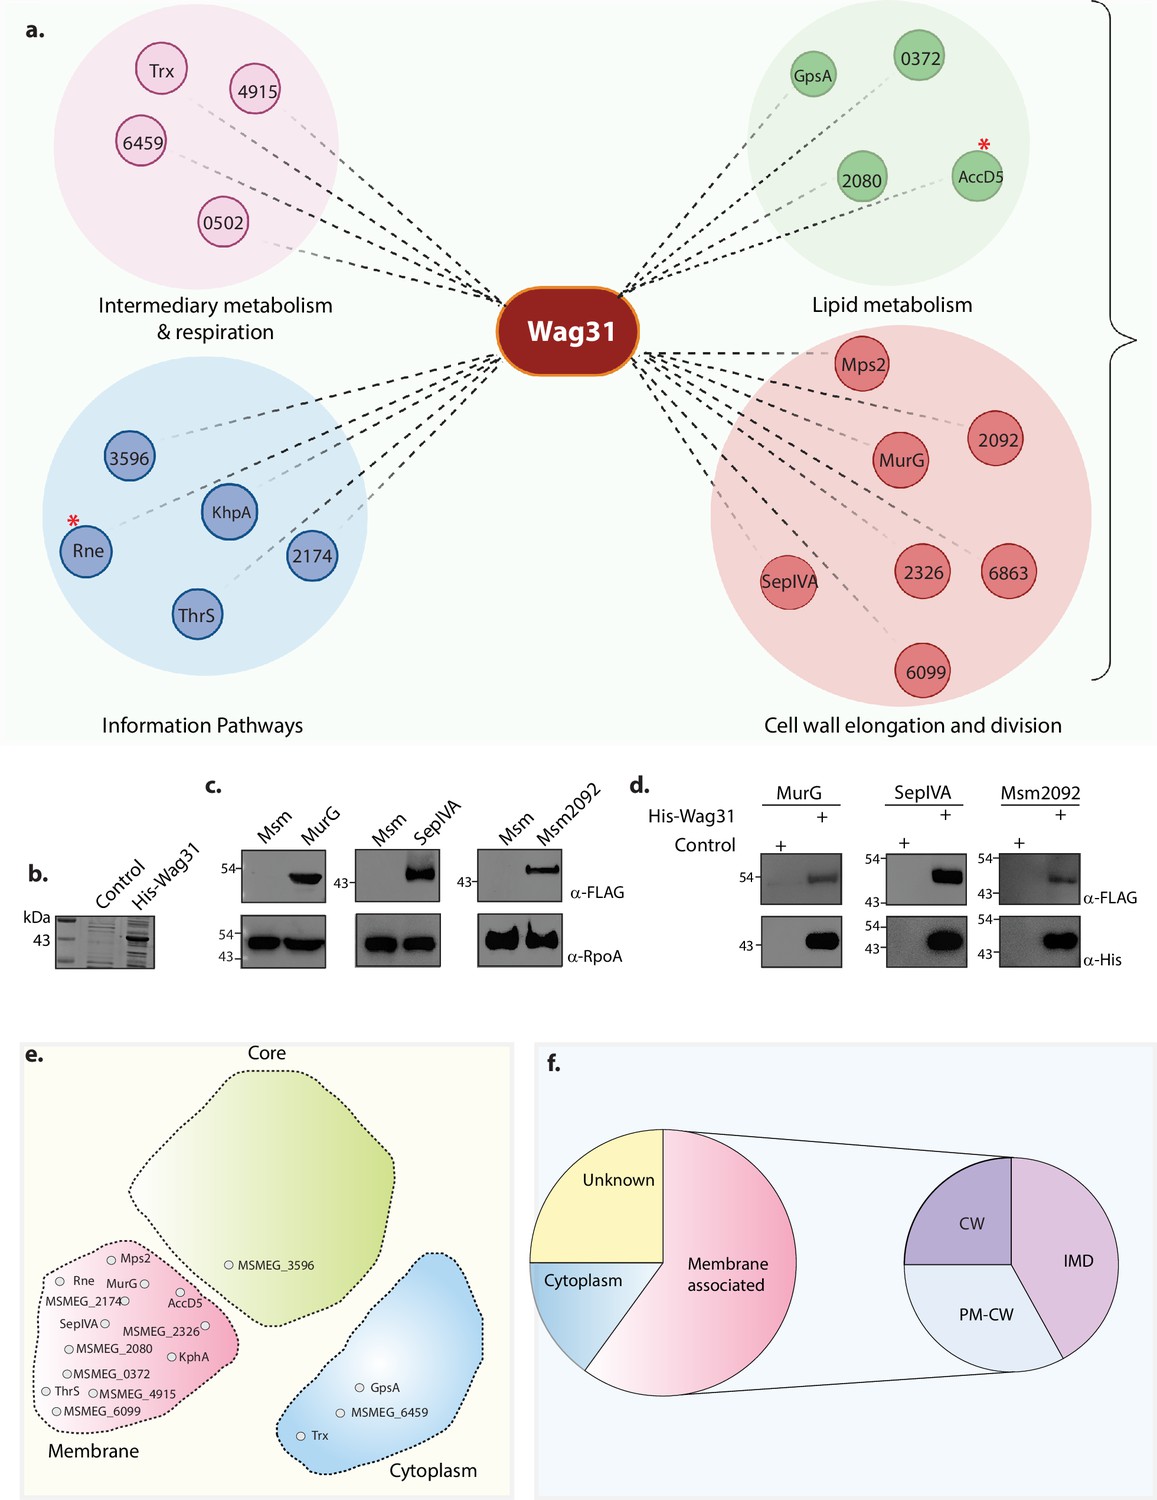
Molecular interactions of Wag31 with membrane-associated proteins govern cellular homeostasis.
(a) Illustration showing the distribution of the top 20 interactors of Wag31 identified from MS/MS analysis from three independent immunoprecipitations. Interactors were classified on the basis of their functional category based on data available in Mycobrowser (Kapopoulou et al., 2011). MSMEG numbers or the identity of interactors are marked in smaller circles. Created in BioRender.com. (b) Coomassie Brilliant blue (CBB) staining of plain E. coli lysate and E. coli lysate expressing His-Wag31. E. coli lysate prepared from BL21-DE3 strain was used as the control. (c) Representative western blots demonstrating expression of 3XFLAG tagged-MurG, -SepIVA, and -Msm2092. Whole-cell lysates (WCLs) were prepared from 0.5 μM IVN induced Msm::murG, Msm::sepIVA, Msm::msm2092 and 40 μg of each was resolved on a 10% SDS–PAGE, transferred onto a nitrocellulose membrane and probed with α-FLAG and α-RpoA (loading control). (d) Representative western blots showing interaction of MurG, SepIVA, and, Msm2092 with Wag31. Msm and E. coli lysates represented in (b, c) incubated together and pulled down with Cobalt beads were resolved on a 10–12% SDS–PAGE, transferred onto nitrocellulose membrane and probed with α-His to detect the pulldown and α-FLAG to detect the interaction. The experiment was performed independently twice. (e) Graphic representation (adapted from Figure 3E from Zhu et al., 2021) shows the distribution of the top 20 interactors in different compartments of a mycobacterial cell: membrane, cytoplasm, or core (involved in DNA replication and recombination). Interactors from each compartment are marked inside the respective domain. (f) Pie chart shows the distribution of interactors belonging to the IMD, PM-CW, or membrane proteins whose specific localization is not determined. Percentage of proteins (top 20 hits) belonging to each membrane compartment is mentioned.
-
Figure 3—source data 1
Source data used for generating Figure 3a, e, f.
- https://cdn.elifesciences.org/articles/104268/elife-104268-fig3-data1-v1.zip
-
Figure 3—source data 2
Unmarked and uncropped source data used for generating Figure 3a, e, f.
- https://cdn.elifesciences.org/articles/104268/elife-104268-fig3-data2-v1.zip
-
Figure 3—source data 3
Source data used for generating Figure 3b–d.
Areas used for making the figure are marked.
- https://cdn.elifesciences.org/articles/104268/elife-104268-fig3-data3-v1.zip
Figure 3—figure supplement 1
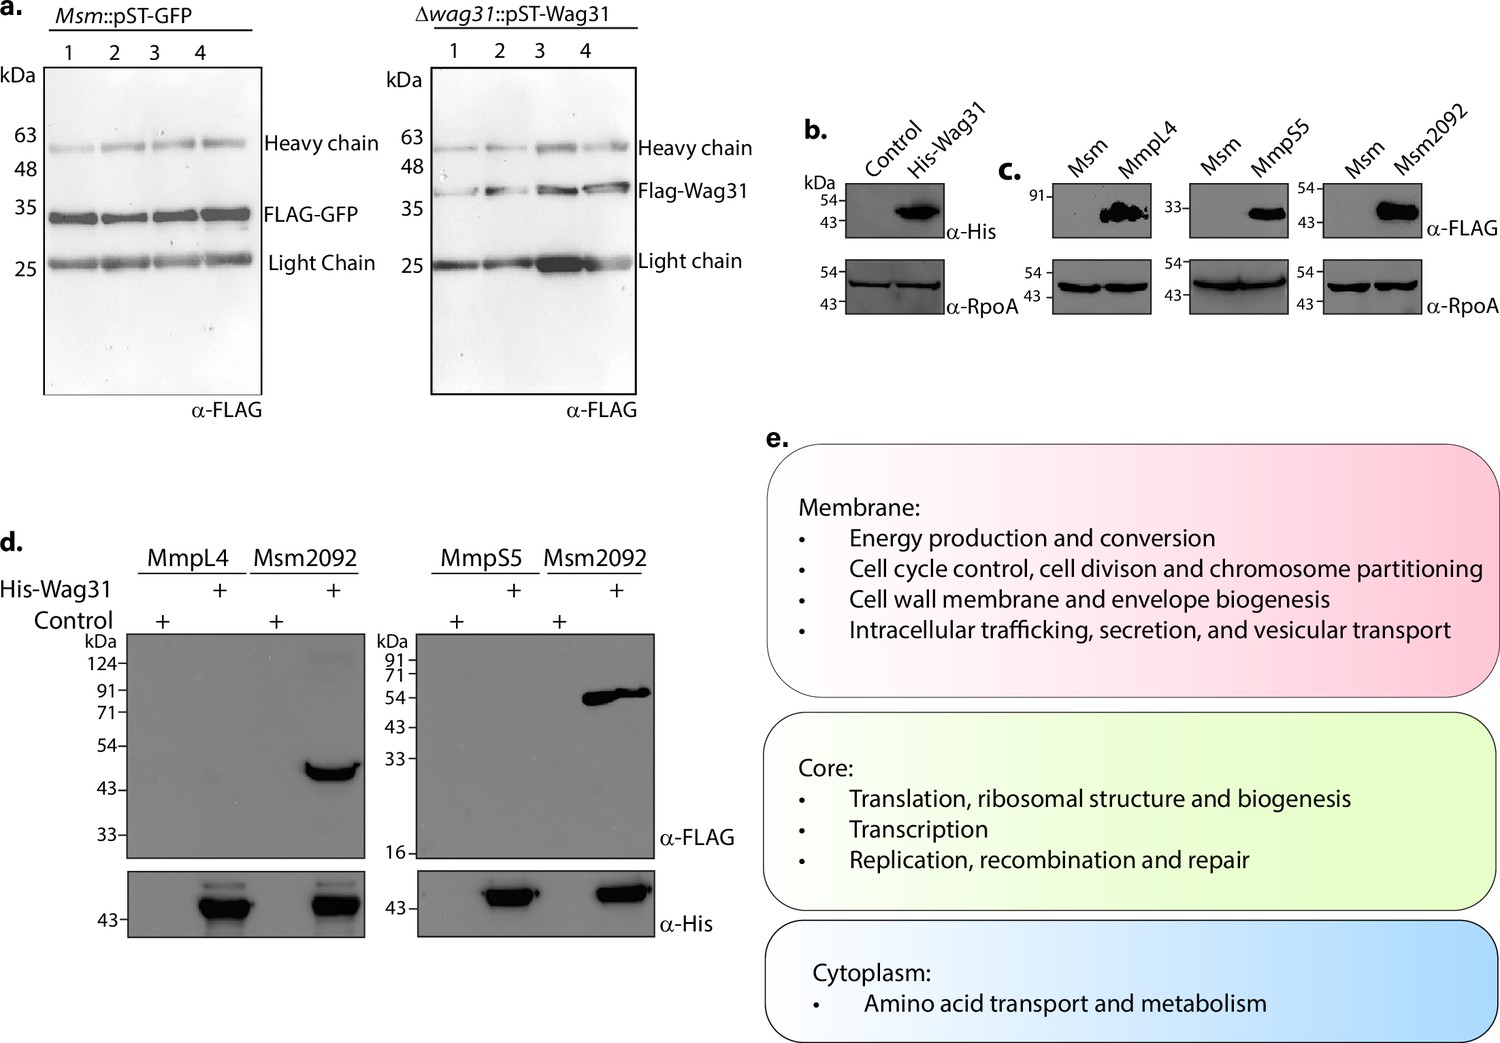
Molecular interactions of wag31 with membrane proteins govern cellular homeostasis.
(a) Western blots showing FLAG-GFP (left panel) and FLAG-Wag31 (right panel) immunoprecipitations. 3 mg lysate from each group was processed for overnight FLAG immunoprecipitations, resolved on a 10% gel, and probed with α-Flag antibody. HC and LC are short for heavy chain and light chain, respectively. (b) Western blot showing expression of His-Wag31 used for the His pulldown experiments. (c) Representative western blots demonstrating expression of 3XFLAG tagged-MmpL4, -MmpS5, and -Msm2092. Whole-cell lysates (WCLs) were prepared from 0.5 μM IVN induced Msm::mmpL4, Msm::mmpS5, Msm::msm2092, and 40 μg of each was resolved on a 10% SDS–PAGE, transferred onto a nitrocellulose membrane and probed with α-FLAG and α-RpoA (loading control). (d) Representative western blots showing the absence of interaction of Wag31 with both MmpL4 and MmpS5. Msm2092, a Wag31 interactor was used as a positive control. E. coli and Msm lysates represented in (b, c) incubated together and pulled down with Cobalt beads were resolved on a 10–12% SDS–PAGE, transferred onto nitrocellulose membrane and probed with α-His to detect the pulldown and α-FLAG to detect the interaction. The experiment was performed independently twice. (e) Classification of cellular processes that occur in different cellular compartments of Msm, as shown in Zhu et al., 2021.
-
Figure 3—figure supplement 1—source data 1
Source data used for generating Figure 3—figure supplement 1a–d.
- https://cdn.elifesciences.org/articles/104268/elife-104268-fig3-figsupp1-data1-v1.zip
-
Figure 3—figure supplement 1—source data 2
Unmarked and uncropped source data used for generating Figure 3—figure supplement 1a–d.
- https://cdn.elifesciences.org/articles/104268/elife-104268-fig3-figsupp1-data2-v1.zip
Figure 3—figure supplement 2
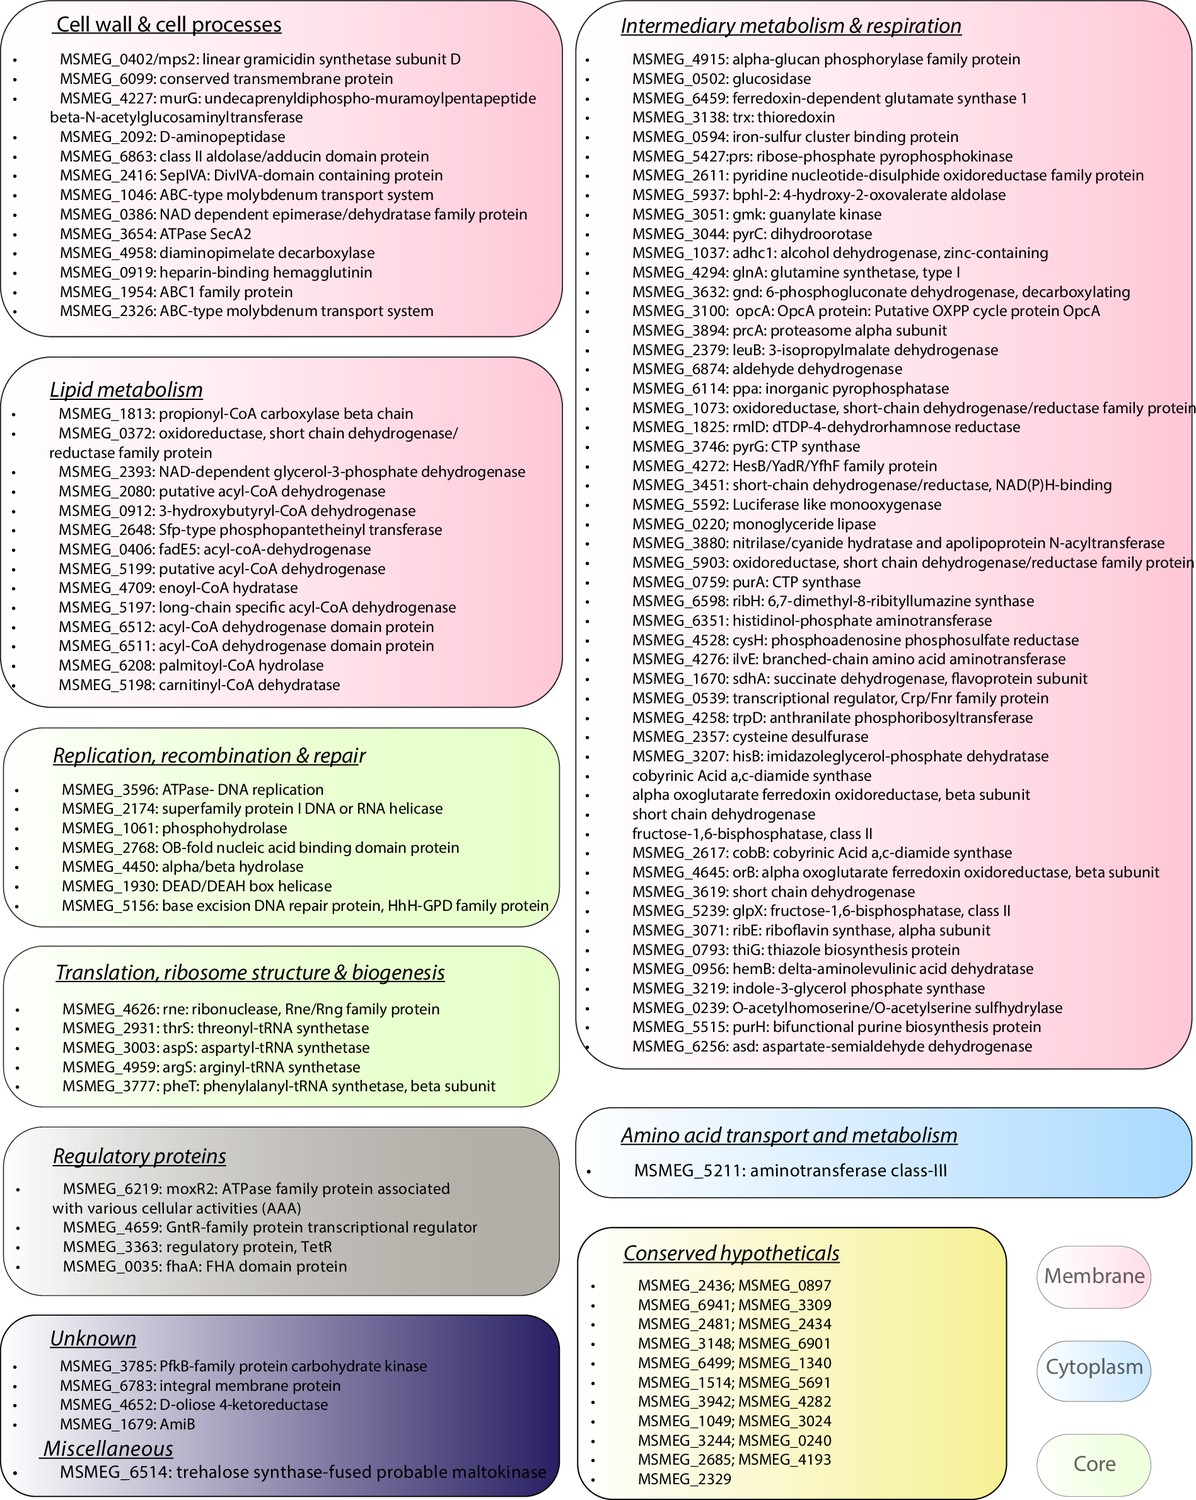
Molecular interactions wag31 with membrane proteins govern cellular homeostasis.
The list of Wag31 interactors is classified according to functional categories based on the data available in Mycobrowser. The colour of the textbox indicates localization of the proteins: Pink – membrane, blue – cytoplasm, and core – green.
-
Figure 3—figure supplement 2—source data 1
Source data used for generating Figure 3—figure supplement 2.
- https://cdn.elifesciences.org/articles/104268/elife-104268-fig3-figsupp2-data1-v1.zip
Figure 4

Wag31 binds and tethers mycobacterial membrane.
(a) Schematic showing the workflow of the proximity-based labelling of membrane-associated protein (PLiMAP) assay. Created in BioRender.com. (b) Coomassie Brilliant blue (CBB) staining of His-Wag31 and in-gel fluorescence (FI) from a representative PLiMAP experiment performed using 2 μM Wag31 and hundred-fold excess of 30 mol% of either 1,2-dioleoyl-sn-glycero-3-phosphoethanolamine (DOPE-), and1′,3′-bis[1,2-dioleoyl-sn-glycero-3-phospho]-glycerol (DOPG-), or CL-containing liposomes. (c) CBB and FL gels from a representative PLiMAP experiment performed with 2 µM Wag31, Wag31K20A, or Wag31ΔN either in the presence or absence of 30 mol% CL liposomes. Note the presence of SDS-resistant higher-order polymers in gel indicated by the red curly bracket. (d) Quantitation of PLiMAP data from (c) showing a difference in binding propensities of His-Wag31, His-Wag31K20A, and His-Wag31ΔN. Data represent the mean ± SD of three independent experiments. Statistical analysis was performed using a two-tailed unpaired Student’s t-test in GraphPad Prism 9. Wag31 vs Wag31K20A showed no significant difference (ns, p-value = 0.5667) whereas Wag31 vs Wag31ΔN (p-value = 0.0081, **) and Wag31K20A vs Wag31ΔN (p-value = 0.0002, ***) showed significant difference in binding. (e) Representative micrographs from binding and tethering assay showing CL-Dil-liposomes (~100 nm) before (first panel) and after incubation (second panel) with 1 μM His-Wag31-GFP. Membrane and protein fluorescence are rendered in red and green, respectively. The experiment was performed independently twice. (f) Representative micrographs from tethering experiments performed with His-Wag31, His-Wag31K20A, or His-Wag31ΔN proteins. The left panels indicate phosphatidylethanolamine (PE) liposomes only (upper panel) and PE liposomes incubated with 1 μM Wag31 (lower panel), the middle panels indicate CL liposomes (upper) or CL liposomes incubated with 1 μM Wag31 (lower panel), the right panel indicates CL liposomes either incubated with His-Wag31K20A (upper) and His-Wag31ΔN (lower). For visualization, PE- and CL-containing liposomes were doped with trace amounts of 3,3'-dilinoleyloxacarbocyanine perchlorate (FAST DiO) and 4-chlorobenzenesulfonate (FAST DiI), respectively. (g) Data from particle analysis showing the maximum intensity of liposomes for all the reactions from two independent experiments.
-
Figure 4—source data 1
Source data used for making Figure 4b, c.
Areas used for making the figure are marked.
- https://cdn.elifesciences.org/articles/104268/elife-104268-fig4-data1-v1.zip
-
Figure 4—source data 2
Unmarked and uncropped source data used for making Figure 4b, c.
- https://cdn.elifesciences.org/articles/104268/elife-104268-fig4-data2-v1.zip
-
Figure 4—source data 3
Source data used for generating the plots Figure 4d, g.
The values used for arriving at the values shown in Figure 4d are also shown.
- https://cdn.elifesciences.org/articles/104268/elife-104268-fig4-data3-v1.zip
-
Figure 4—source data 4
Source data, a avi movie used for generating Figure 4e.
The frames used for making the figure were selected using ImageJ software.
- https://cdn.elifesciences.org/articles/104268/elife-104268-fig4-data4-v1.zip
-
Figure 4—source data 5
Source data, a zip file containing multiple avi movie files used for generating Figure 4f.
The frames used for making the figures were selected using ImageJ software.
- https://cdn.elifesciences.org/articles/104268/elife-104268-fig4-data5-v1.zip
Figure 5
Tethering is crucial for the survival of mycobacteria.
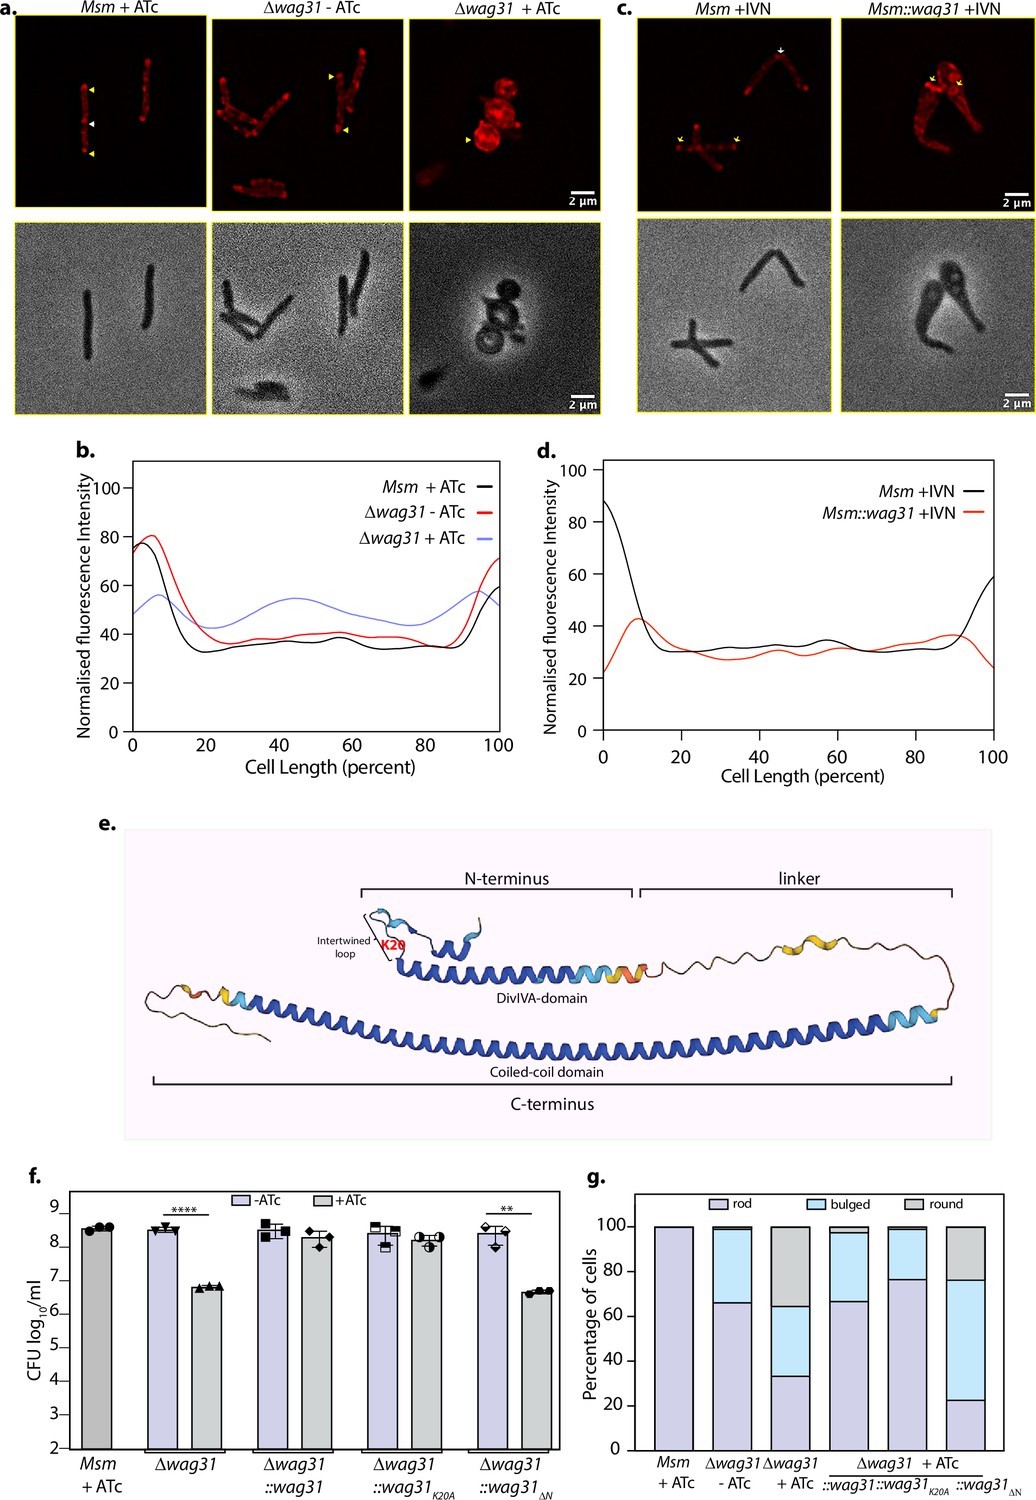
(a) Top panel: Representative fluorescent micrographs showing 10-N-Nonyl-acridine orange (NAO) intensity across Msm+ATc, Δwag31-ATc, and Δwag31+ATc samples imaged at 12 hr post-ATc treatment. Bright red foci of polar CL are indicated with yellow arrowheads and septal CL foci with white arrowheads. Bottom panel: Respective phase images. (b) Line plot depicting CL distribution along the length of the cells across Msm+ATc, Δwag31-ATc, and Δwag31+ATc. N = 100 cells across two independent biological replicates were analysed using Fiji and their normalized fluorescence intensities were plotted against cell length; fluorescence emitted from 0–20% to 80–100% of cell length was considered polar. (c) Representative fluorescent micrographs showing NAO staining in Msm+IVN, Msm::wag31+IVN samples imaged at 12 hr post 5 μM IVN treatment. Bright red foci of polar CL are indicated with yellow arrowheads, and septal CL foci with white arrowheads. The panels below show corresponding phase images. (d) Line plot depicting CL distribution along the length of the cells in Msm+IVN, Msm::wag31+IVN. N = 100 cells across two independent biological replicates were analysed using Fiji. The y-axis represents the normalized fluorescence intensities, and the x-axis represents cell length expressed as a percentage of total cell length. Fluorescence peaks in 0–20% and 80–100% of cell length were considered polar. (e) Structure of Wag31 (MSMEG_4217) from AlphaFold protein structure database (Tunyasuvunakool et al., 2021). The structure represents the N-terminal, linker, and C-terminal domains in Wag31. The N-terminal contains a short helix, followed by an intertwined loop harbouring positively charged amino acid K20 (highlighted in red) and the DivIVA-domain. The N-terminus is linked to the C-terminus via a linker. (f) Msm+ATc, Δwag31, Δwag31::wag31, Δwag31::wag31K20A, and Δwag31::wag31ΔN either untreated or treated with ATc were scored for bacillary survival post 12 hr ATc addition by enumerating CFUs. Appropriate serial dilutions were plated on 7H11 plates (without antibiotic or ATc), and bar graphs demonstrating bacillary survival CFU log10/ml ± standard deviations (SD, represented by error bars) were plotted and statistical significance was calculated using two-way RM ANOVA followed by Tukey’s multiple comparison test, α = 0.01, GP: 0.1234 (ns), 0.0332 (*), 0.0021 (**), 0.0002 (***),<0.0001 (****). The experiment was performed twice independently, each with triplicates. (g) Strains described in (f) were scored for their morphology-rod, bulged or round at 12 hr post ATc treatment. 308 cells of each strain across two independent experiments were analysed.
-
Figure 5—source data 1
Source data used for making Figure 5a, b.
Areas used for making the figure are marked.
- https://cdn.elifesciences.org/articles/104268/elife-104268-fig5-data1-v1.zip
-
Figure 5—source data 2
Unmarked and uncropped source data used for making Figure 5a, b..
- https://cdn.elifesciences.org/articles/104268/elife-104268-fig5-data2-v1.zip
-
Figure 5—source data 3
Source data used for making Figure 5b, d, f, g.
All the graphs were plotted using GraphPad Prism.
- https://cdn.elifesciences.org/articles/104268/elife-104268-fig5-data3-v1.zip
Figure 6
Tethering is correlated with lipid levels and CL localization in mycobacteria.
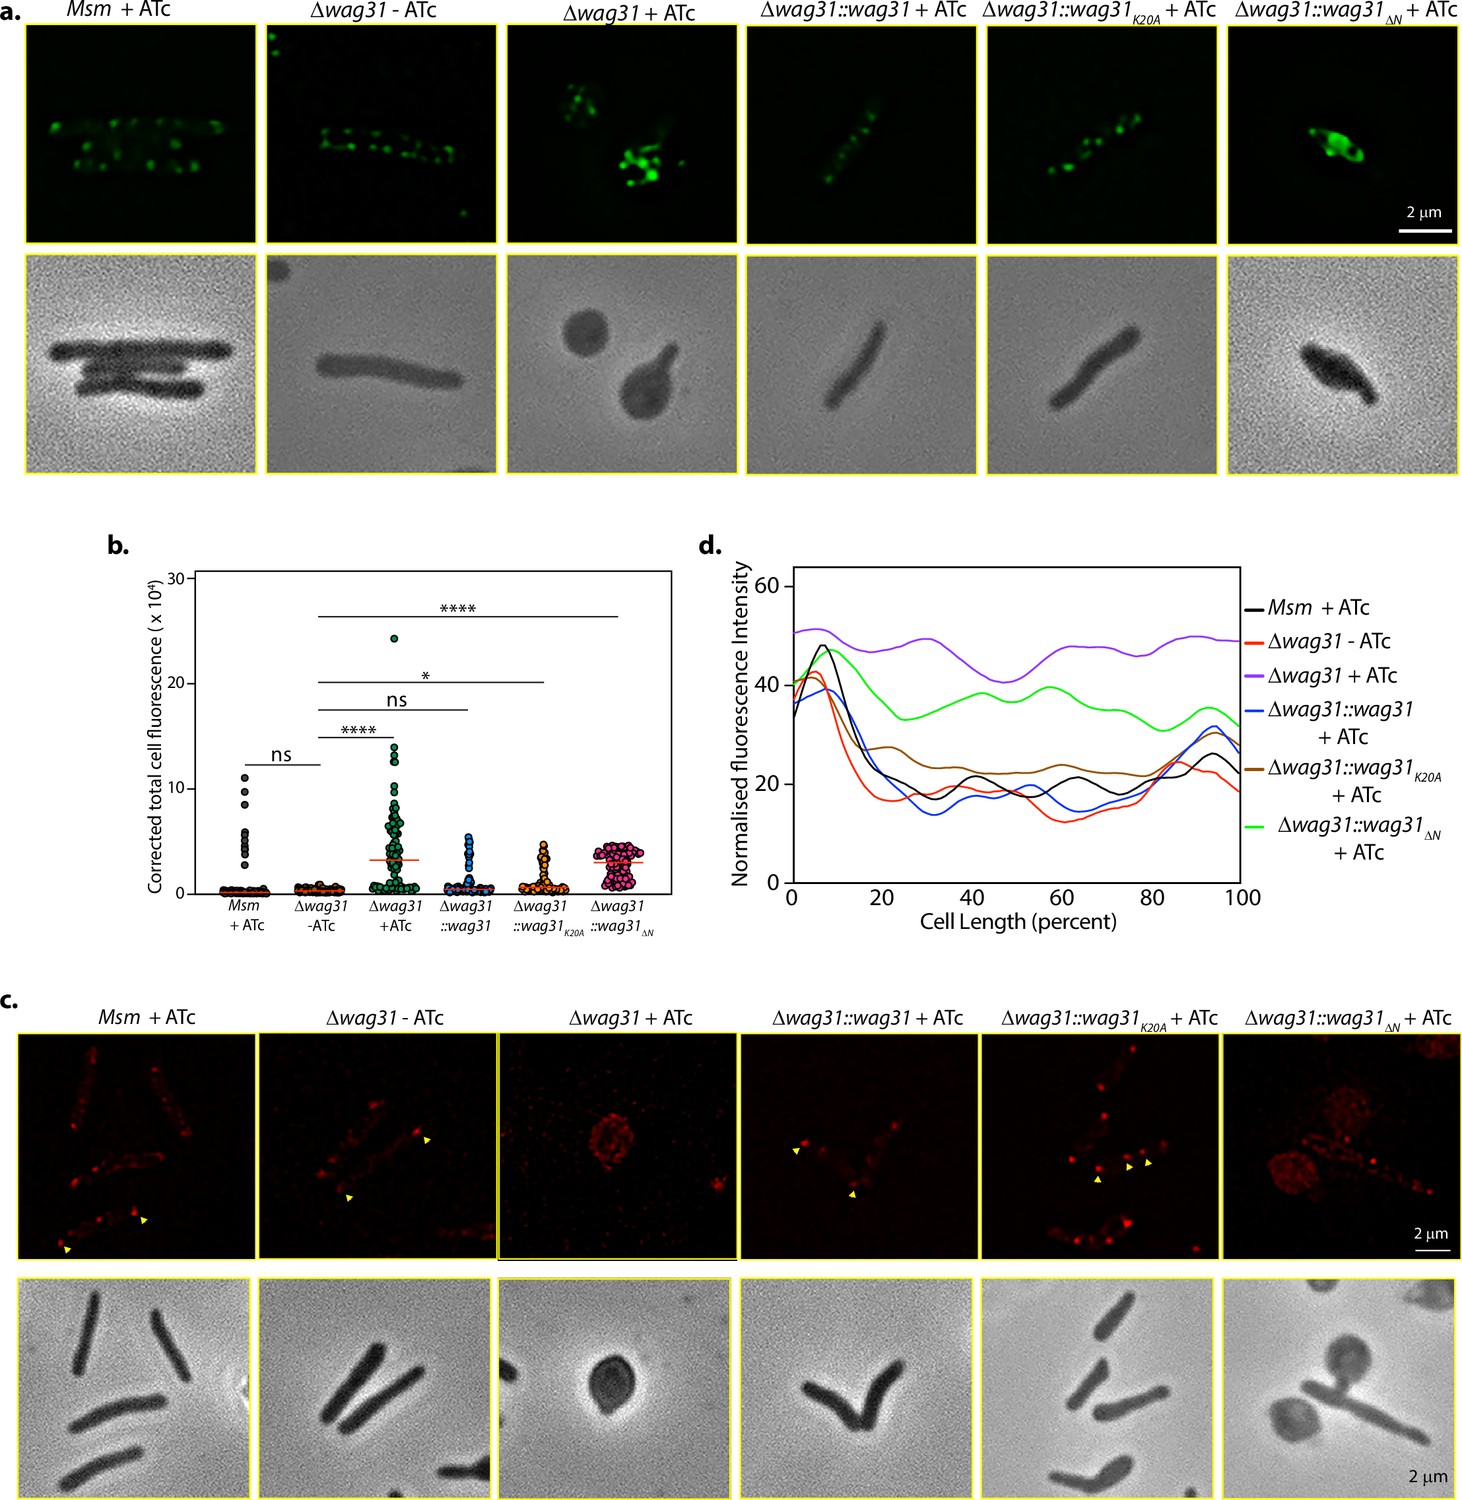
(a) Top panel: Representative fluorescent micrographs showing BODIPY staining across Δwag31-ATc and Msm, Δwag31, Δwag31::wag31, Δwag31::wag31K20A, Δwag31::wag31ΔN imaged at 12 hr post ATc addition. Bottom panel: Corresponding phase images. (b) Corrected total cell fluorescence (CTCF) of BODIPY-stained cells was calculated from N = 100 cells across two independent experiments and analysed using Fiji and plotted in a graph. The horizontal bar represents the median CTCF (statistical analysis was performed using one-way ANOVA followed by Brown–Forsythe test (Tukey’s multiple comparison test; 0.1234 (ns), 0.0332 (*),<0.0001 (****))). (c) Fluorescent micrographs showing 10-N-Nonyl-acridine orange (NAO) intensity of strains as mentioned above. Bottom panel: Corresponding phase images. (d) Line plot analysis of strains described in (c) depicting CL localization. N = 100 cells across two independent experiments were analysed using Fiji and their normalized fluorescence intensities were plotted against cell length.
-
Figure 6—source data 1
Source data used for generating Figure 6a, c.
The areas used for making the figure panels are marked.
- https://cdn.elifesciences.org/articles/104268/elife-104268-fig6-data1-v1.zip
-
Figure 6—source data 2
Unmarked and uncropped source data used for generating Figure 6a, c.
- https://cdn.elifesciences.org/articles/104268/elife-104268-fig6-data2-v1.zip
-
Figure 6—source data 3
Source data used for generating Figure 6b, d.
Graphs were generated using GraphPad Prism.
- https://cdn.elifesciences.org/articles/104268/elife-104268-fig6-data3-v1.zip
Figure 7
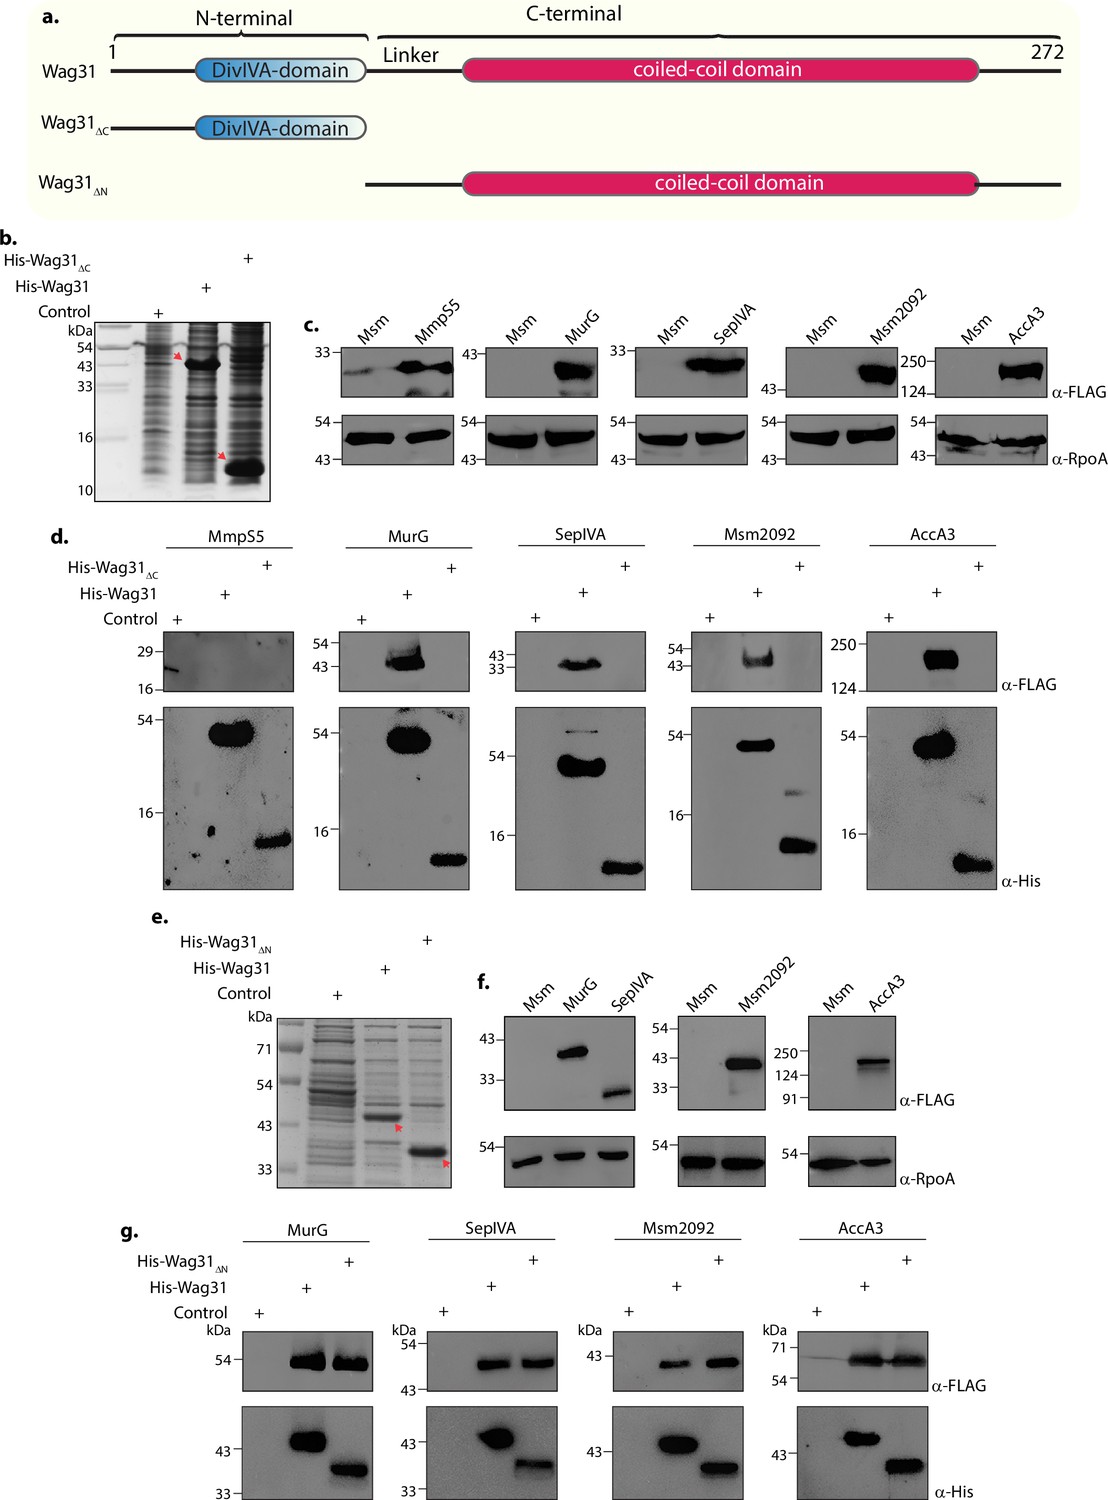
The N- and C-terminal domains of Wag31 have distinct functions.
(a) Illustration depicting the domain architecture of Wag31, Wag31ΔN, and Wag31ΔC. (b) Coomassie Brilliant blue (CBB) staining of plain E. coli lysate and E. coli lysate expressing His-Wag31ΔC. E. coli lysate prepared from BL21-DE3 strain was used as the control. (c) Representative western blots demonstrating expression of 3XFLAG tagged-MmpS5, -MurG, -SepIVA, -Msm2092, and -AccA3. Whole-cell lysates (WCLs) were prepared from 0.5 μM IVN induced Msm::mmpS5, Msm::murG, Msm::sepIVA, Msm::msm2092, Msm::accA3 and 40 μg of each was resolved a 10% SDS–PAGE, transferred onto a nitrocellulose membrane and probed with α-FLAG and α-RpoA (loading control). (d) Representative western blots showing interaction of MurG, SepIVA, Msm2092, and Acca3 with Wag31 and Wag31Δc. The non-interactor MmpS5 was used as a negative control. E. coli and Msm lysates represented in (b, c) incubated together and pulled down with Cobalt beads were resolved on Tris Tricine gel as described elsewhere (Schägger, 2006), transferred onto nitrocellulose membrane and probed with α-His to detect the pulldown and α-FLAG to detect the interaction. The experiment was performed independently twice. (e) Coomassie Brilliant blue (CBB) staining of E. coli lysates expressing His-Wag31ΔN. E. coli lysate prepared from BL21-DE3 strain was used as the control. (f) Representative western blots demonstrating expression of 3XFLAG tagged-MurG, -SepIVA, -Msm2092, and -AccA3. WCLs were prepared from 0.5 μM IVN induced Msm::murG, Msm::sepIVA, Msm::msm2092, Msm::accA3 and 40 μg of each was resolved a 10% SDS–PAGE, transferred onto a nitrocellulose membrane and probed with α-FLAG and α-RpoA (loading control). (g) Representative western blots showing interaction of MurG, SepIVA, Msm2092, and Acca3 with Wag31 and Wag31ΔN. E. coli and Msm lysates represented in (e, f) incubated together and pulled down with Cobalt beads were resolved on 10% SDS–PAGE, transferred onto nitrocellulose membrane and probed with α-His to detect the pulldown and α-FLAG to detect the interaction. The experiment was performed independently twice.
-
Figure 7—source data 1
Source data used for generating Figure 7b–g.
The lanes used to make the panels are marked.
- https://cdn.elifesciences.org/articles/104268/elife-104268-fig7-data1-v1.zip
-
Figure 7—source data 2
Unmarked and uncropped source data used for generating Figure 7b–g.
- https://cdn.elifesciences.org/articles/104268/elife-104268-fig7-data2-v1.zip
Figure 8
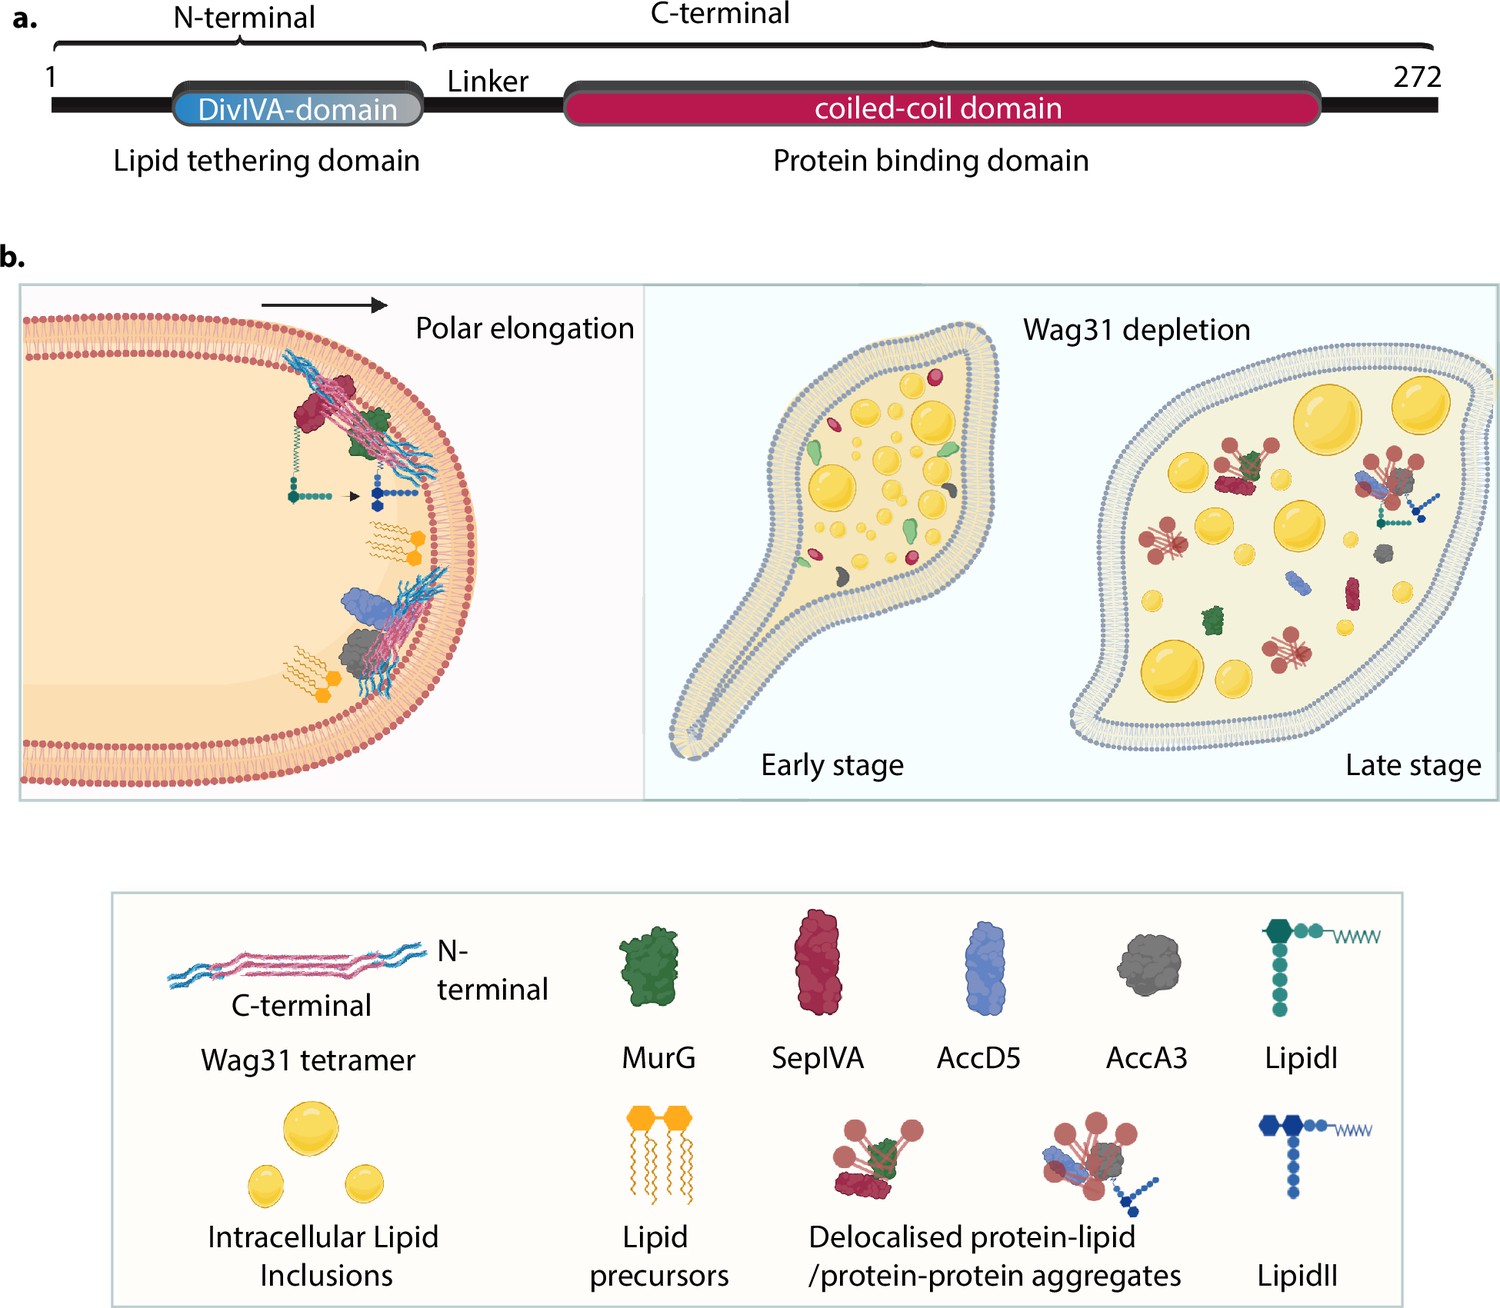
Model for Wag31-mediated tethering of the membrane.
(a) Model of Wag31 showing the N- and C-terminals. N-terminal houses the DivIVA-domain that is involved in membrane tethering and the C-terminal is the protein-binding domain that facilitates interactions of Wag31 with other proteins. (b) Left: Illustration showing Wag31 scaffolds bound to cardiolipin in the membrane via N-terminal, tethering it and creating CL microdomains at the poles. The C-terminal of Wag31 bound to protein partners, localize them to the membrane, facilitating several membrane-centric processes such as PG and lipid synthesis, that ensure mycobacterial survival. The right panel shows the time-dependent consequences of Wag31 depletion that is early and late stage. The cells are bulged at one pole and start accumulating intracellular lipid inclusions (ILIs) in the early stage and as the time progresses, the effect of Wag31 depletion becomes severe, rendering the cells round and full of ILIs. In the absence of Wag31, CL microdomains become delocalized due to the loss of tethering, pulling away several membrane-associated proteins causing non-polar growth and loss of curvature. Created in BioRender.com (left, bottom panel). Created in BioRender.com (right panel).
Tables
Key resources table
| Reagent type (species) or resource | Designation | Source or reference | Identifiers | Additional information |
|---|---|---|---|---|
| Genetic reagent | pJV53 | van Kessel and Hatfull, 2007 | pJV53 plasmid from Dr. Hatfull’s lab wherein the kanr antibiotic cassette was swapped with aprar cassette. | aprares |
| Genetic reagent | pSTKiToff | Soni et al., 2015 | L5 integrative pST-KiT plasmid harboring reverse tetR gene. | kanres |
| Genetic reagent | pST-wag31 | pST-KiToff construct harboring wag31 between NdeI-HindIII sites. | kanres | |
| Genetic reagent | pST-gfp | pST-KiToff construct harboring gfp between NdeI-HindIII sites. | kanres | |
| Genetic reagent | pET-wag31 | pET28b harboring His-wag31-His | kanres | |
| Genetic reagent | pET-wag31K20A | pET28b harboring His-wag31K20A-His | kanres | |
| Genetic reagent | pET-wag31∆N | pET28b harboring His-wag31Δ1-60-His | kanres | |
| Genetic reagent | pET-wag31-gfp | pET28b harboring His-wag31-gfp-His | kanres | |
| Genetic reagent | pSCG-wag31 | Giles integrative plasmid harboring His-wag31-His under the control of wag31 native promoter | aprares | |
| Genetic reagent | pSCG-wag31K20A | Giles integrative plasmid harboring His-wag31K20A-His under the control of wag31 native promoter | aprares | |
| Genetic reagent | pSCG-wag31∆N | Giles integrative plasmid harboring His- wag31ΔN-His under the control of wag31 native promoter | aprares | |
| Genetic reagent | pNit-wag31 | IVN inducible plasmid harboring 3X-FLAG-wag31 | kanres | |
| Genetic reagent | pNit-murG | IVN inducible plasmid harboring 3X-FLAG-murG | kanres | |
| Genetic reagent | pNit-sepIVA | IVN inducible plasmid harboring 3X-FLAG-sepIVA | kanres | |
| Genetic reagent | pNit-msm2092 | IVN inducible plasmid harboring 3X-FLAG-msm2092 | kanres | |
| Genetic reagent | pNit-accA3 | IVN inducible plasmid harboring 3X-FLAG-accA3 | kanres | |
| Genetic reagent | pNit-mmpS5 | IVN inducible plasmid harboring 3X-FLAG-mmpS5 | kanres | |
| Genetic reagent | pNit-mmpL4 | IVN inducible plasmid harboring 3X-FLAG-mmpL4 | kanres | |
| Gene (Mycobacterium smegmatis) | wag31 | Mycobrowser | Uniprot A0R006 | |
| Gene (M. smegmatis) | murG | Mycobrowser | Uniprot A0R016 | |
| Gene (M. smegmatis) | sepIVA | Mycobrowser | Uniprot A0QV18 | |
| Gene (M. smegmatis) | Msm2092 | Mycobrowser | Uniprot A0QU64 | |
| Gene (M. smegmatis) | accA3 | Mycobrowser | Uniprot A0QTE1 | |
| Gene (M. smegmatis) | mmpS5 | Mycobrowser | Uniprot A0QP03 | |
| Gene (M. smegmatis) | mmpL4 | Mycobrowser | Uniprot A0QY12 | |
| strain, strain background (M. smegmatis) | Δwag31 | This study | Hygres, kanres, | |
| Strain, strain background (M. smegmatis) | Msm::gfp | This study | kanres, | |
| Strain, strain background (M. smegmatis) | Δwag31::wag31 | This study | Hygres, kanres, apramycinres | |
| Strain, strain background (M. smegmatis) | Δwag31::wag31K20A | This study | Hygres, kanres, apramycinres | |
| Strain, strain background (M. smegmatis) | Δwag31::wag31ΔN | This study | Hygres, kanres, apramycinres | |
| Strain, strain background (M. smegmatis) | Δwag31::wag31ΔC | This study | Hygres, kanres, apramycinres | |
| Strain, strain background (M. smegmatis) | Msm::wag31 | This study | Kanres | |
| Strain, strain background (M. smegmatis) | Msm::murG | This study | Kanres | |
| Strain, strain background (M. smegmatis) | Msm::sepIVA | This study | Kanres | |
| Strain, strain background (M. smegmatis) | Msm::msm2092 | This study | Kanres | |
| Strain, strain background (M. smegmatis) | Msm::accA3 | This study | Kanres | |
| Strain, strain background (M. smegmatis) | Msm::mmpS5 | This study | Kanres | |
| Strain, strain background (M. smegmatis) | Msm::mmpL4 | This study | Kanres | |
| Genetic reagent (E. coli) | E. coli DH5α | Invitrogen | Used for clonings | |
| Genetic reagent (E. coli) | E. coli BL21 DE3 | Novagen | Used for protein expression | |
| Chemical compound | BODIPY | Invitrogen | D3922 | Fluorescent stain |
| Chemical compound | Acridine orange 10-Nonyl bromide (NAO) | Invitrogen | A1372 | Fluorescent stain |
| Chemical compound | 2-dioleoyl-sn-glycero-3-phosphocholine (DOPC) | Avanti polar lipids | 850375 C | Lipid used for PLiMAP |
| Chemical compound | 2-dioleoyl-sn-glycero-3-phosphoethanolamine (DOPE) | Avanti polar lipids | 850725 C | Lipid used for PLiMAP |
| Chemical compound | 1’,3’-bis(1,2-dioleoyl-sn-glycero-3-phospho)-glycerol (DOPG) | Avanti polar lipids | 840475 C | Lipid used for PLiMAP |
| Chemical compound | FAST Dil | Invitrogen | D7756 | Lipid used for tethering assay |
| Chemical compound | FAST DiO | Invitrogen | D3898 | Lipid used for tethering assay |
| Chemical compound | Cardiolipin | Avanti polar lipids | 841199 C | Lipid used for PLiMAP |
| Chemical compound | Cobalt agarose beads | GoldBio | H-310–5 | Resin used for His-Pull down assays |
| Chemical compound | FLAG M2 Magnetic beads | Sigma | M8823 | Resin used for Immunoprecipitation |
| Chemical compound | TALON Metal affinity resin | Takara Bio | 635653 | Resin used for Protein purification |
| Chemical compound | Ni-NTA Agarose beads | Qiagen | 30210 | Resin used for Protein purification |
Additional files
Download links
A two-part list of links to download the article, or parts of the article, in various formats.
Downloads (link to download the article as PDF)
Open citations (links to open the citations from this article in various online reference manager services)
Cite this article (links to download the citations from this article in formats compatible with various reference manager tools)
Wag31, a membrane tether, is crucial for lipid homeostasis in mycobacteria
eLife 14:RP104268.
https://doi.org/10.7554/eLife.104268.3


