Opposing regulation of TNF responses by IFN-γ and a PGE2-cAMP axis that is apparent in rheumatoid and immune checkpoint inhibitor-induced arthritis human IL-1β+ macrophages
- HSS Research Institute and David Z. Rosensweig Genomics Research Center, Hospital for Special Surgery, United States
- Computational Biology Core, David Z. Rosensweig Genomics Research Center, Hospital for Special Surgery, United States
- Immunology and Microbial Pathogenesis Program, Weill Cornell Medicine, United States
- Division of Rheumatology, Department of Medicine, Hospital for Special Surgery, United States
- Department of Medicine, Weill Cornell Medicine, United States
Figures
Figure 1 with 2 supplements
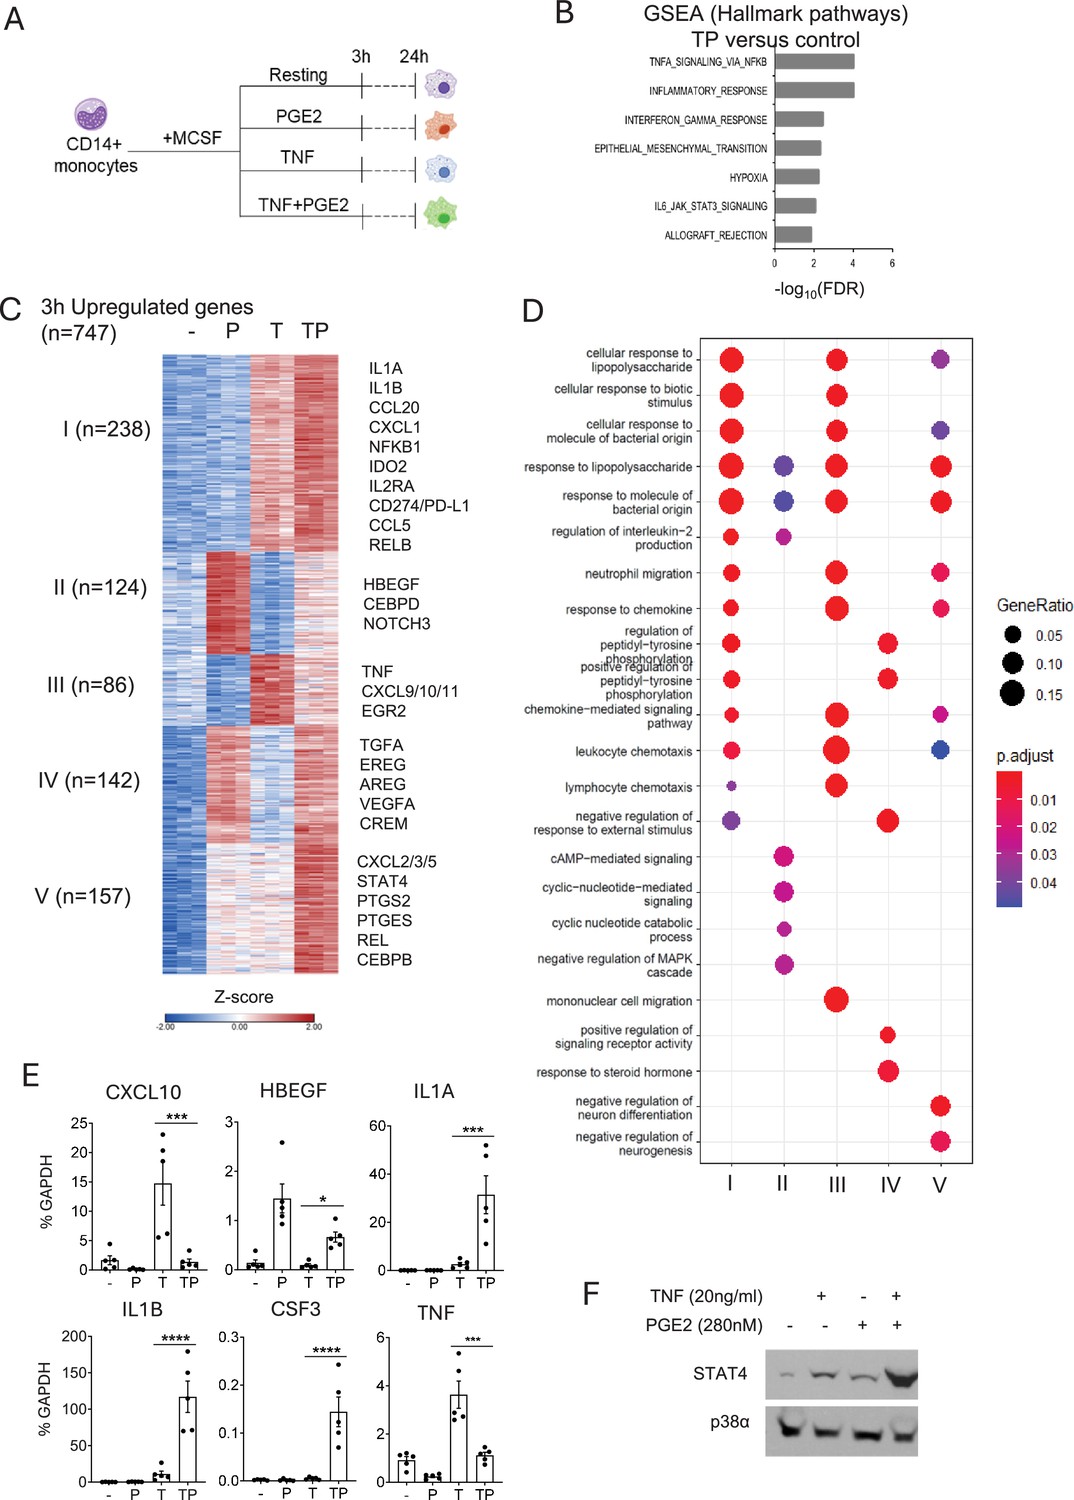
Cooperative induction of a distinct subset of inflammatory genes by PGE2 and TNF.
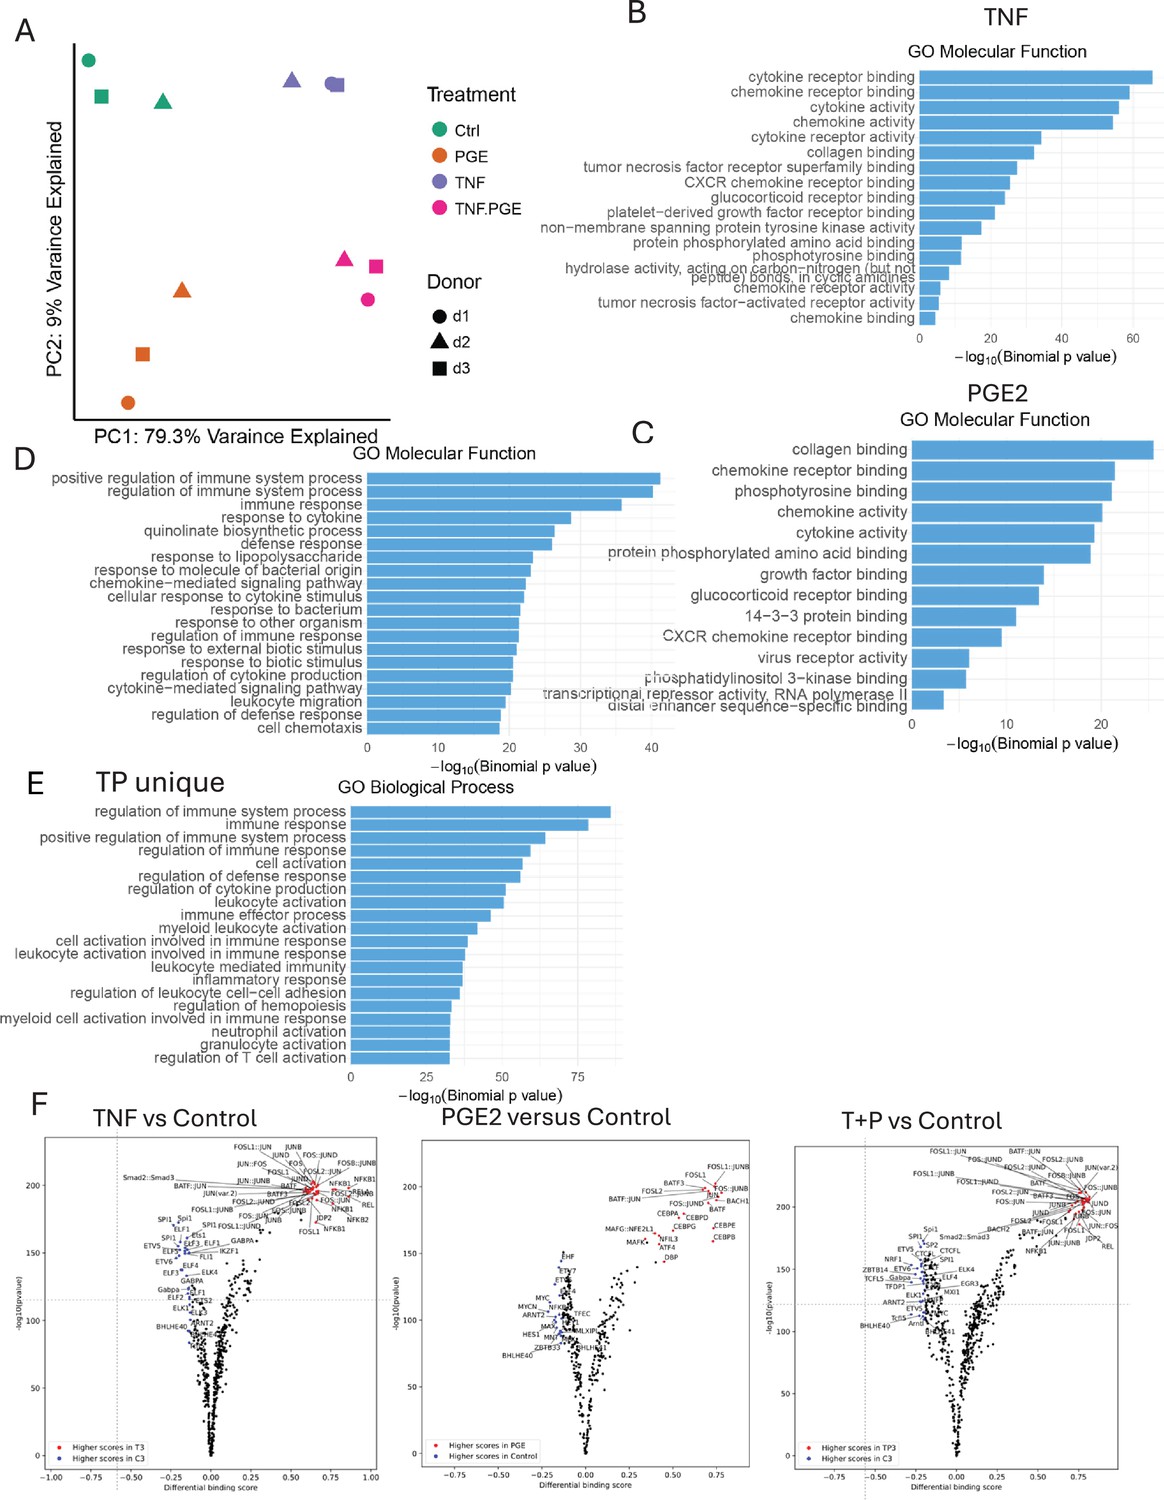
(A) Experimental design. Primary human monocytes were stimulated with PGE2 (280 nM) and/or TNF (20 ng/ml) and harvested 3 or 24 hr after stimulation for RNAseq analysis. n=3 independent blood donors. (B) Gene set enrichment analysis of genes induced >2-fold by PGE2+TNF (TP) (false discovery rate [FDR] < 0.05). (C) K-means clustering of differentially upregulated genes in any pairwise comparison relative to resting control (>2-fold induction, FDR < 0.05). 3 hr time point. k=5. (D) Pathway analysis of gene clusters in panel (C). (E) qPCR analysis of gene expression in an additional five blood donors. Mean ± SEM. Statistical significance was assessed using one-way ANOVA and Sidak’s test for multiple comparisons (*p<0.05, **p<0.01, ***p<0.001, ****p<0.0001). (F). Western blot analysis. Representative blot out of four independent experiments.
-
Figure 1—source data 1
Original western blot images.
- https://cdn.elifesciences.org/articles/104367/elife-104367-fig1-data1-v1.zip
-
Figure 1—source data 2
PDF of original western blot images with relevant bands and treatments indicated.
- https://cdn.elifesciences.org/articles/104367/elife-104367-fig1-data2-v1.zip
Figure 1—figure supplement 1
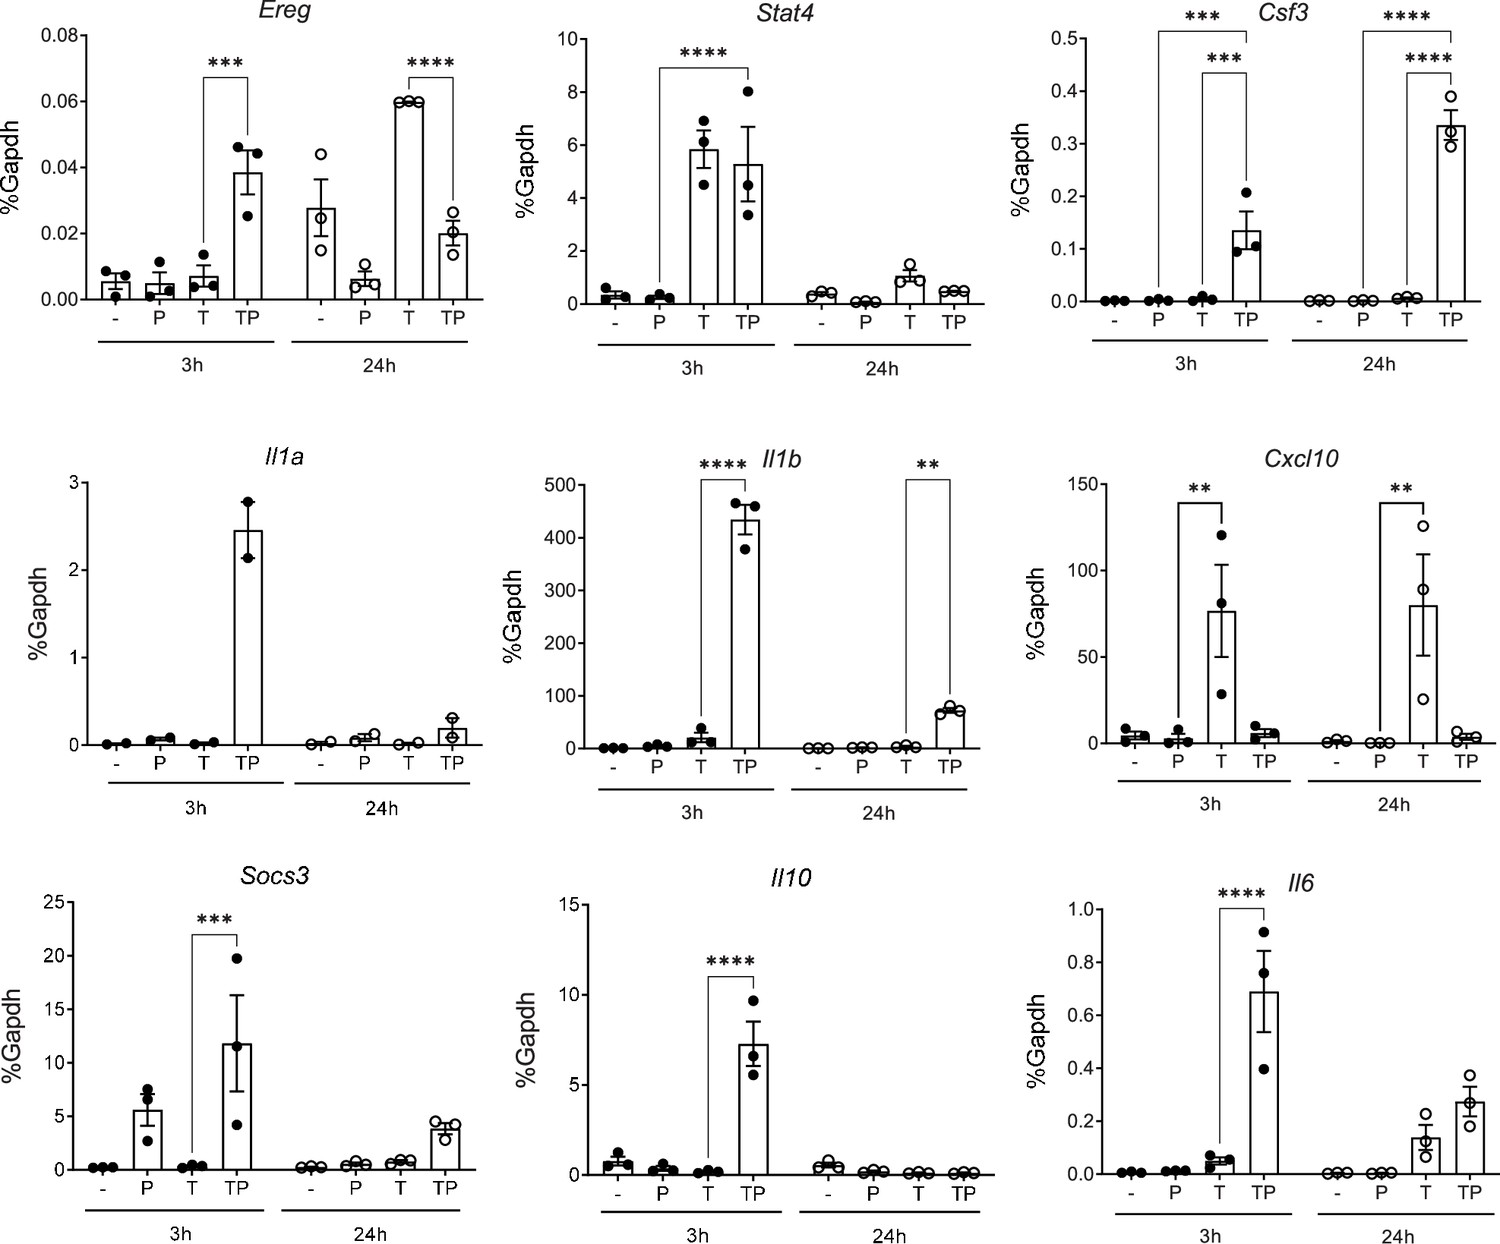
Regulation of gene expression by PGE2 and TNF in mouse bone marrow-derived macrophages.
BMDMs were stimulated with PGE2 (280 nM) and/or mTNF (20 ng/ml) and harvested 3 or 24 hr after stimulation for qPCR analysis of gene expression, n=3. Mean ± SEM. Statistical significance was assessed using two-way ANOVA and Tukey’s test for multiple comparisons (*p<0.05, **p<0.01, ***p<0.001, ****p<0.0001).
Figure 1—figure supplement 2
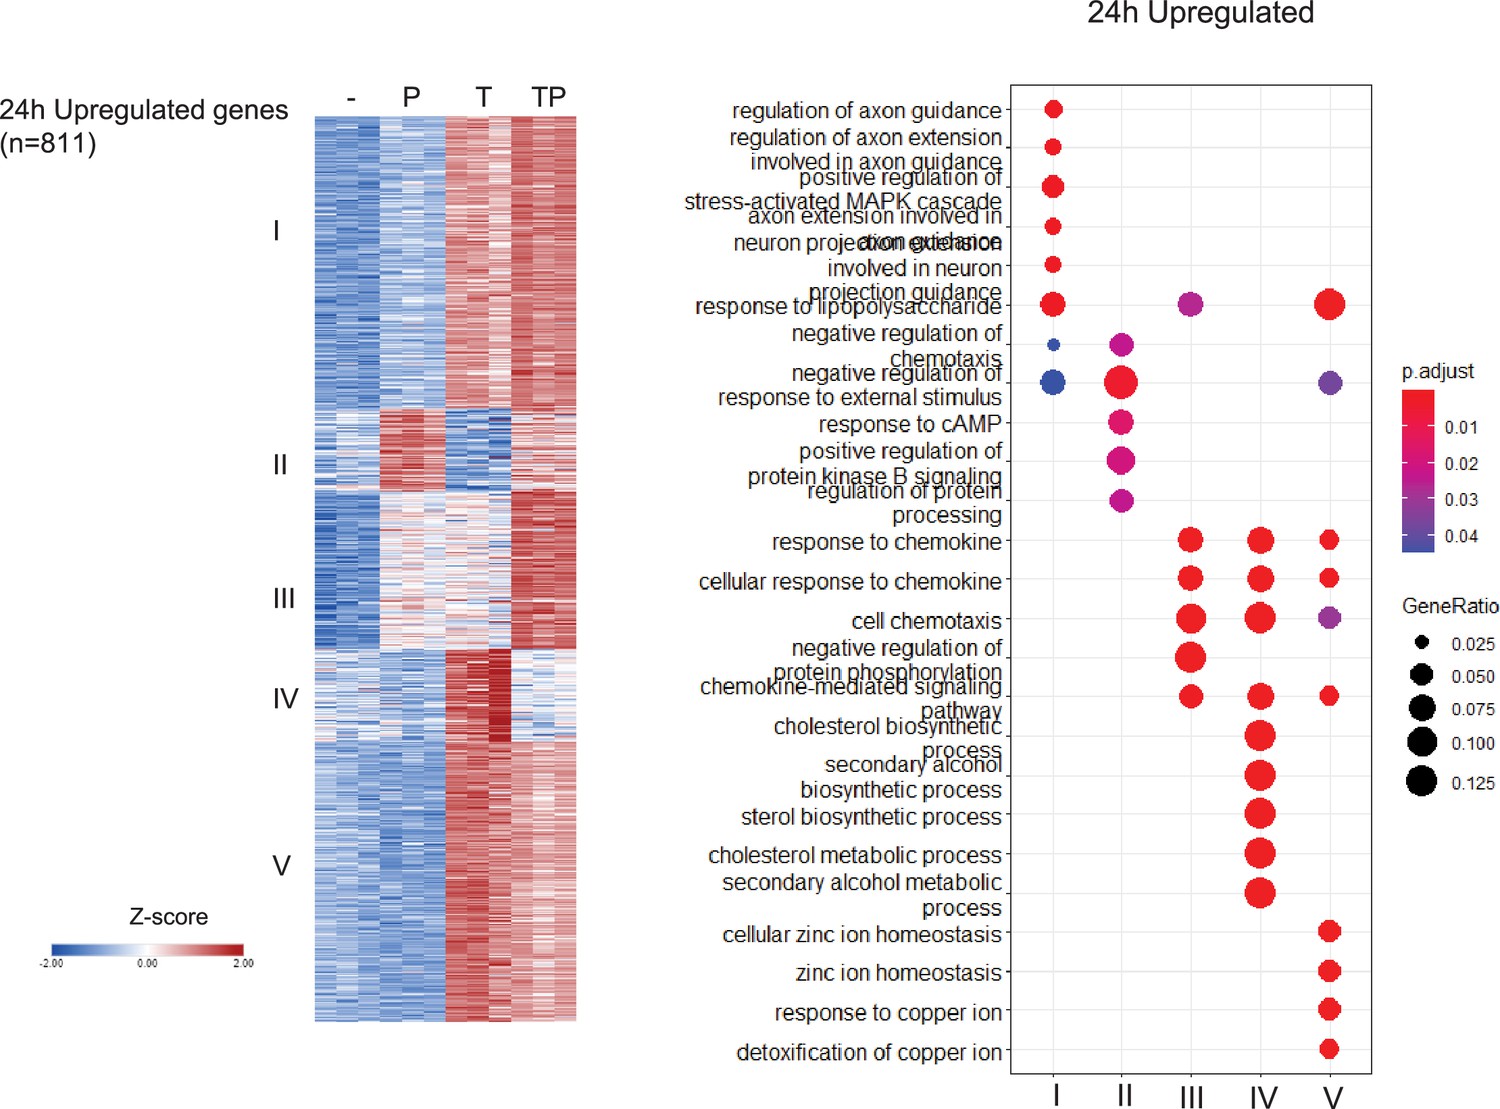
Analysis of differentially regulated genes at the 24 hr time point.
Monocytes were stimulated for 24 hr as described in the legend to Figure 1A. K-means clustering (k=5, genes with >2-fold induction, false discovery rate [FDR] < 0.05) (left panel). Pathway analysis of gene clusters (right panel). n=3.
Figure 2

PGE2 and TNF costimulation model aspects of the RA and ICI-arthritis synovial macrophage phenotype.
(A) TP costimulation recapitulates expression of 61% of the genes whose induction by TNF was augmented by coculture with synovial fibroblasts (also termed fibroblast-like synoviocytes, FLS). FLS-augmented TNF-inducible genes from data in Donlin et al., 2014; Kuo et al., 2019 were compared to the TP-induced genes at the 24 hr time point in Figure 1—figure supplement 2, fold-change > 2, false discovery rate [FDR] < 0.05. The green area indicates the extent of overlap, hypergeometric p=8.36e-128. (B) Recapitulation of the RA synovial macrophage cluster 1 phenotype by TP-costimulated genes. The defining 128 genes of the C1 phenotype were overlapped with TP-costimulated genes and TNF/FLS-costimulated genes. TP-costimulated genes = orange + yellow = 52% of C1 defining genes (p<10e-9 by Monte Carlo simulation). TNF/FLS-costimulated genes = orange + red=34% of C1 defining genes. (C) Heatmaps depicting expression of genes in pathogenic pathways, based on RNAseq data shown in Figure 1. Blue font = genes expressed in C1 RA macrophages. (D) Heatmap depicting regulation of representative genes that are expressed in RA C1 macrophages by P, T, or TP. (E) UMAP visualization of monocyte and macrophage clusters based on scRNAseq of 14,110 macrophages and monocytes from 5 synovial fluids and 2 synovial tissues of ICI-arthritis patients. (F) Heatmap showing expression of key genes for the eight clusters identified in panel (E). TNF+PGE2 signature genes are shown in red.
Figure 3
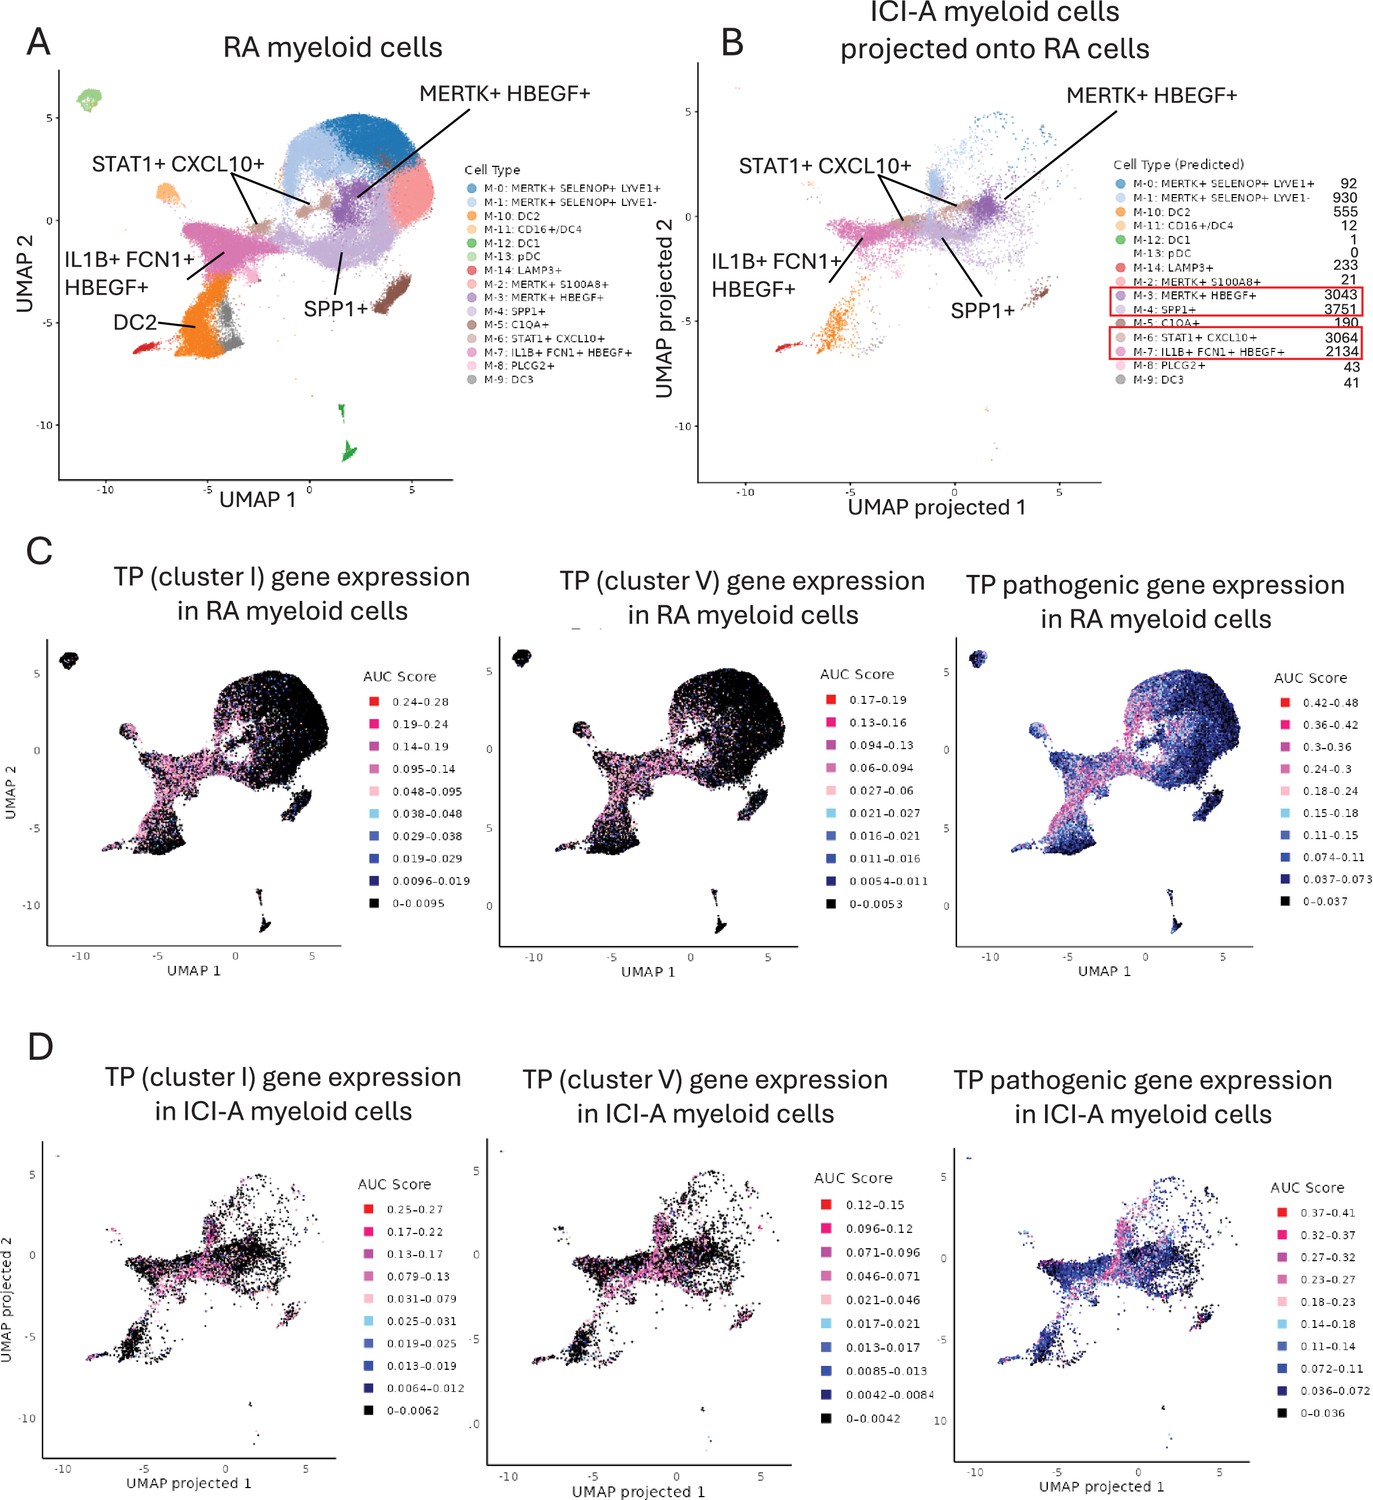
Expression of the TP gene signature in select subsets of RA myeloid cells and in ICI-arthritis myeloid cells that map onto RA cell clusters.
(A) UMAP plot of the myeloid scRNAseq dataset from Zhang et al., 2023 (syn52297840). The dimensionality reduction was successfully recapitulated using the uwot model provided in syn52297840. (B) Reference mapping of ICI-arthritis myeloid cells onto the predefined RA myeloid cell clusters. ICI-arthritis myeloid cells were projected onto the RA reference UMAP space using Seurat’s MapQuery function, based on the same uwot model used in A. (C) Expression of TP gene sets in RA myeloid cells from (A). (D) Expression of TP gene sets in ICI-arthritis myeloid cells that have been mapped onto RA clusters as (B). In (C) and (D) gene set activity scores for individual cells were calculated using the AUCell package and area under the curve (AUC) scores are shown. Pink and red dots represent higher levels of gene expression that passed the threshold set by the AUCell algorithm.
Figure 4

cAMP signaling has dichotomous suppressive and augmenting effects on the TNF-induced inflammatory response.
(A) RT-qPCR analysis of gene expression in primary human monocytes stimulated with TNF and selective agonists of PGE2 receptors EP2 and EP4 that signal predominantly via cAMP. EP2 agonist = butaprost (10 μM); EP4 agonist = CAY10598 (10 μM). n=3. (B) RT-qPCR analysis of gene expression in primary human monocytes stimulated with TNF and increasing concentrations of cAMP analog dibutyryl cAMP (10 and 100 μM; labeled A). n=3. Mean ± SEM. Statistical significance was assessed using two-way ANOVA and Sidak’s test for multiple comparisons (*p<0.05, **p<0.01, ***p<0.001, ****p<0.0001).
Figure 5 with 1 supplement

PGE2 effects on TNF-induced changes in chromatin accessibility.
(A–E). Analysis of ATACseq data obtained using monocytes from 3 independent donors. (A) UPSET plot of differentially upregulated ATACseq peaks in any pairwise comparison relative to resting control (>2-fold induction, false discovery rate [FDR] < 0.05). (B) De novo motif analysis using HOMER of ATACseq peaks induced by TNF (left panel), PGE2 (middle panel), or uniquely induced only under conditions of TP costimulation (right panel). (C) Upper. Violin plots showing normalized counts of ATACseq peaks induced by both PGE2 and TNF. ****p<0.0001 by Wilcoxon rank sum test with Holm’s correction for multiple comparisons. Lower. HOMER de novo motif analysis of the peaks in the upper panel. (D) Heatmap of the differential TF activity scores derived from ChromVAR analysis of ATACseq data for P, T, or TP-treated monocytes compared to resting control. (E) Volcano plot of differential binding analysis of ATACseq peaks between the TP and T conditions using TOBIAS.
Figure 5—figure supplement 1
ATACseq analysis of PGE2 and TNF-stimulated monocytes.
(A–F) Additional analysis of the ATACseq data obtained using monocytes from three independent donors. (A) Principal component analysis (PCA) plot. (B–E) Pathway analysis of genes associated with ATACseq peaks induced by TNF (B), PGE2 (C), co-induced by TP (D), or uniquely induced by TP (E). (F) Volcano plots of differential binding analysis of ATACseq peaks using TOBIAS.
Figure 6 with 1 supplement
IFN-γ opposes the effects of PGE2 on TNF-induced gene expression.
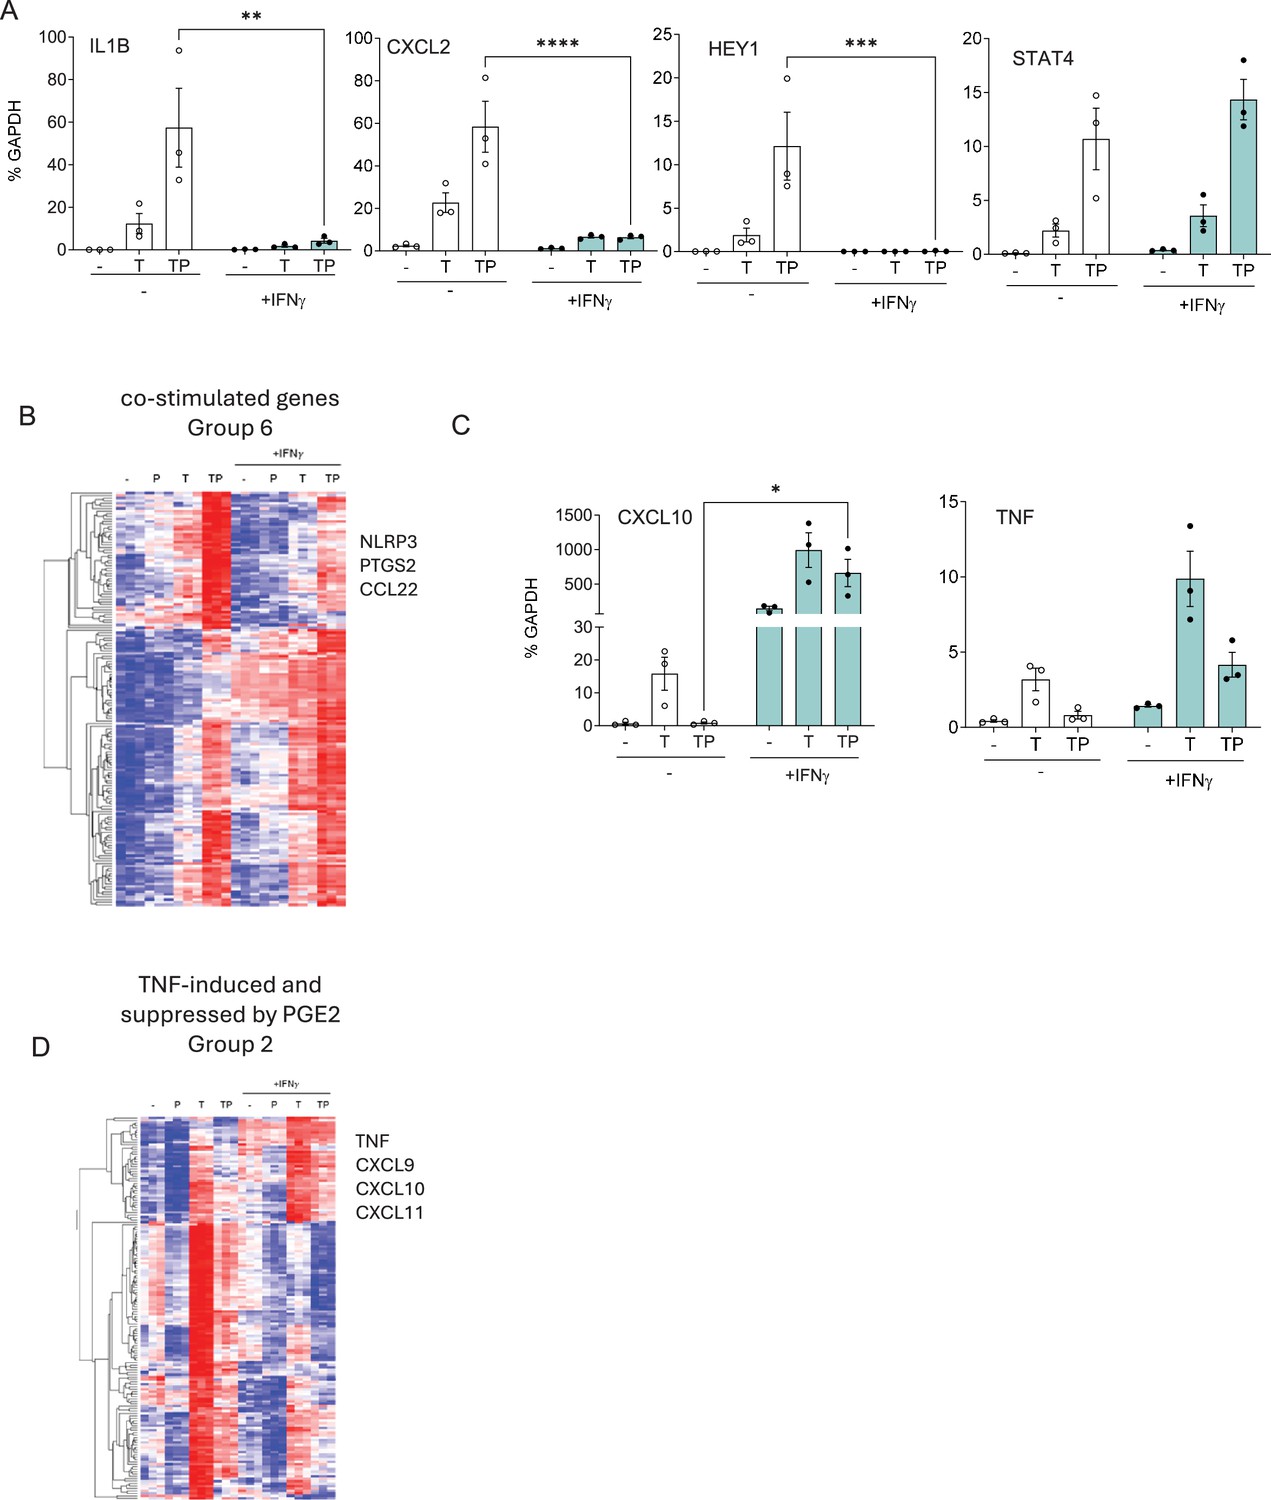
(A, C) RT-qPCR analysis of gene expression in primary human monocytes that were primed overnight with IFN-γ (100 U/ml) and then stimulated for 3 hr with P, T, or TP as in Figure 1. n=3. Mean ± SEM. Statistical significance was assessed using two-way ANOVA with Sidak’s test for multiple comparisons (*p<0.05, **p<0.01, ***p<0.001, ****p<0.0001). (B, D) Gene groups defined in Figure 6—figure supplement 1 based on pattern of expression in RNAseq data (n=3) were subjected to hierarchical clustering.
Figure 6—figure supplement 1
IFN-γ opposes the effects of PGE2 on TNF-induced gene expression.
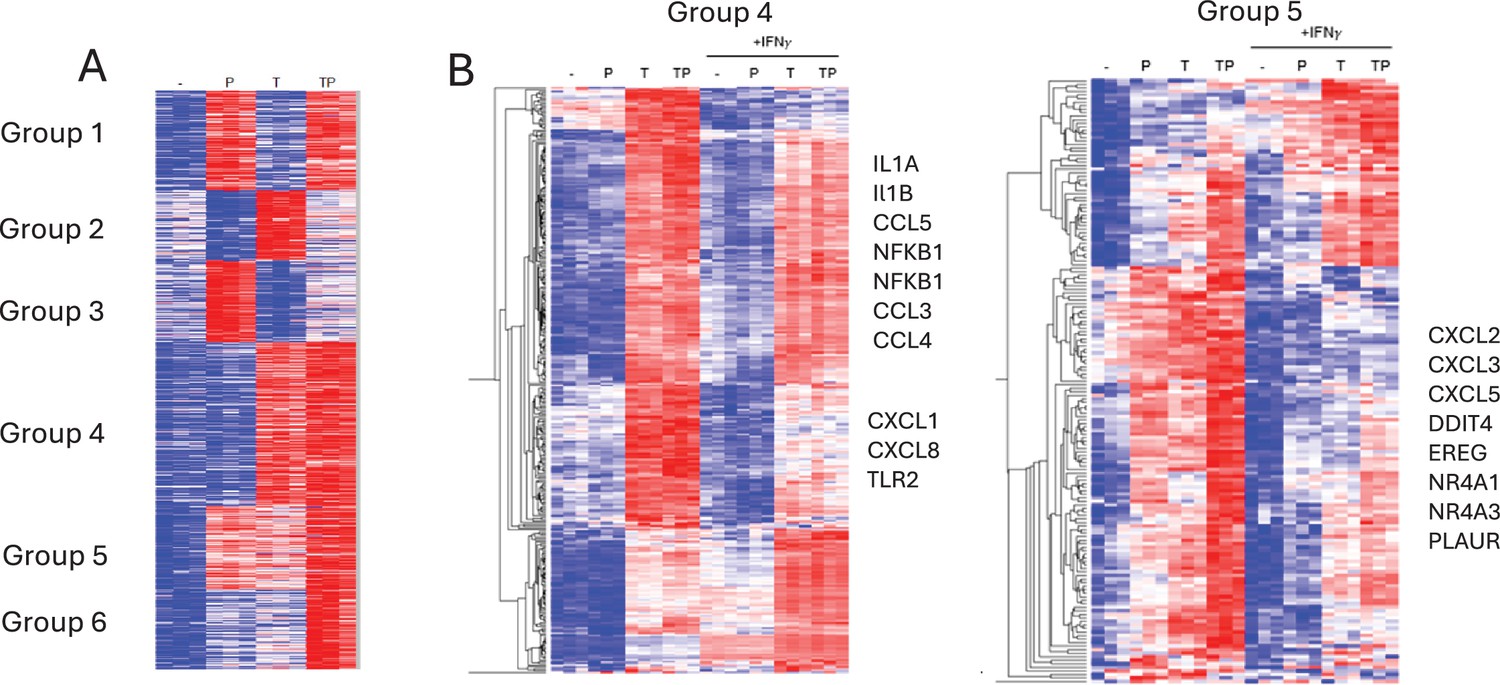
(A) RNAseq data, n=3. K-means clustering of differentially upregulated genes in any pairwise comparison relative to resting control (>1.25-fold induction, false discovery rate [FDR] <0.01). 3 hr time point. k=6; three gene sets (groups 4–6) that are costimulated by T and P are apparent. (B) Gene groups 4 and 5 defined in panel (A) were subjected to hierarchical clustering.
Figure 7
Interaction analysis of IFN-γ and the TP response.
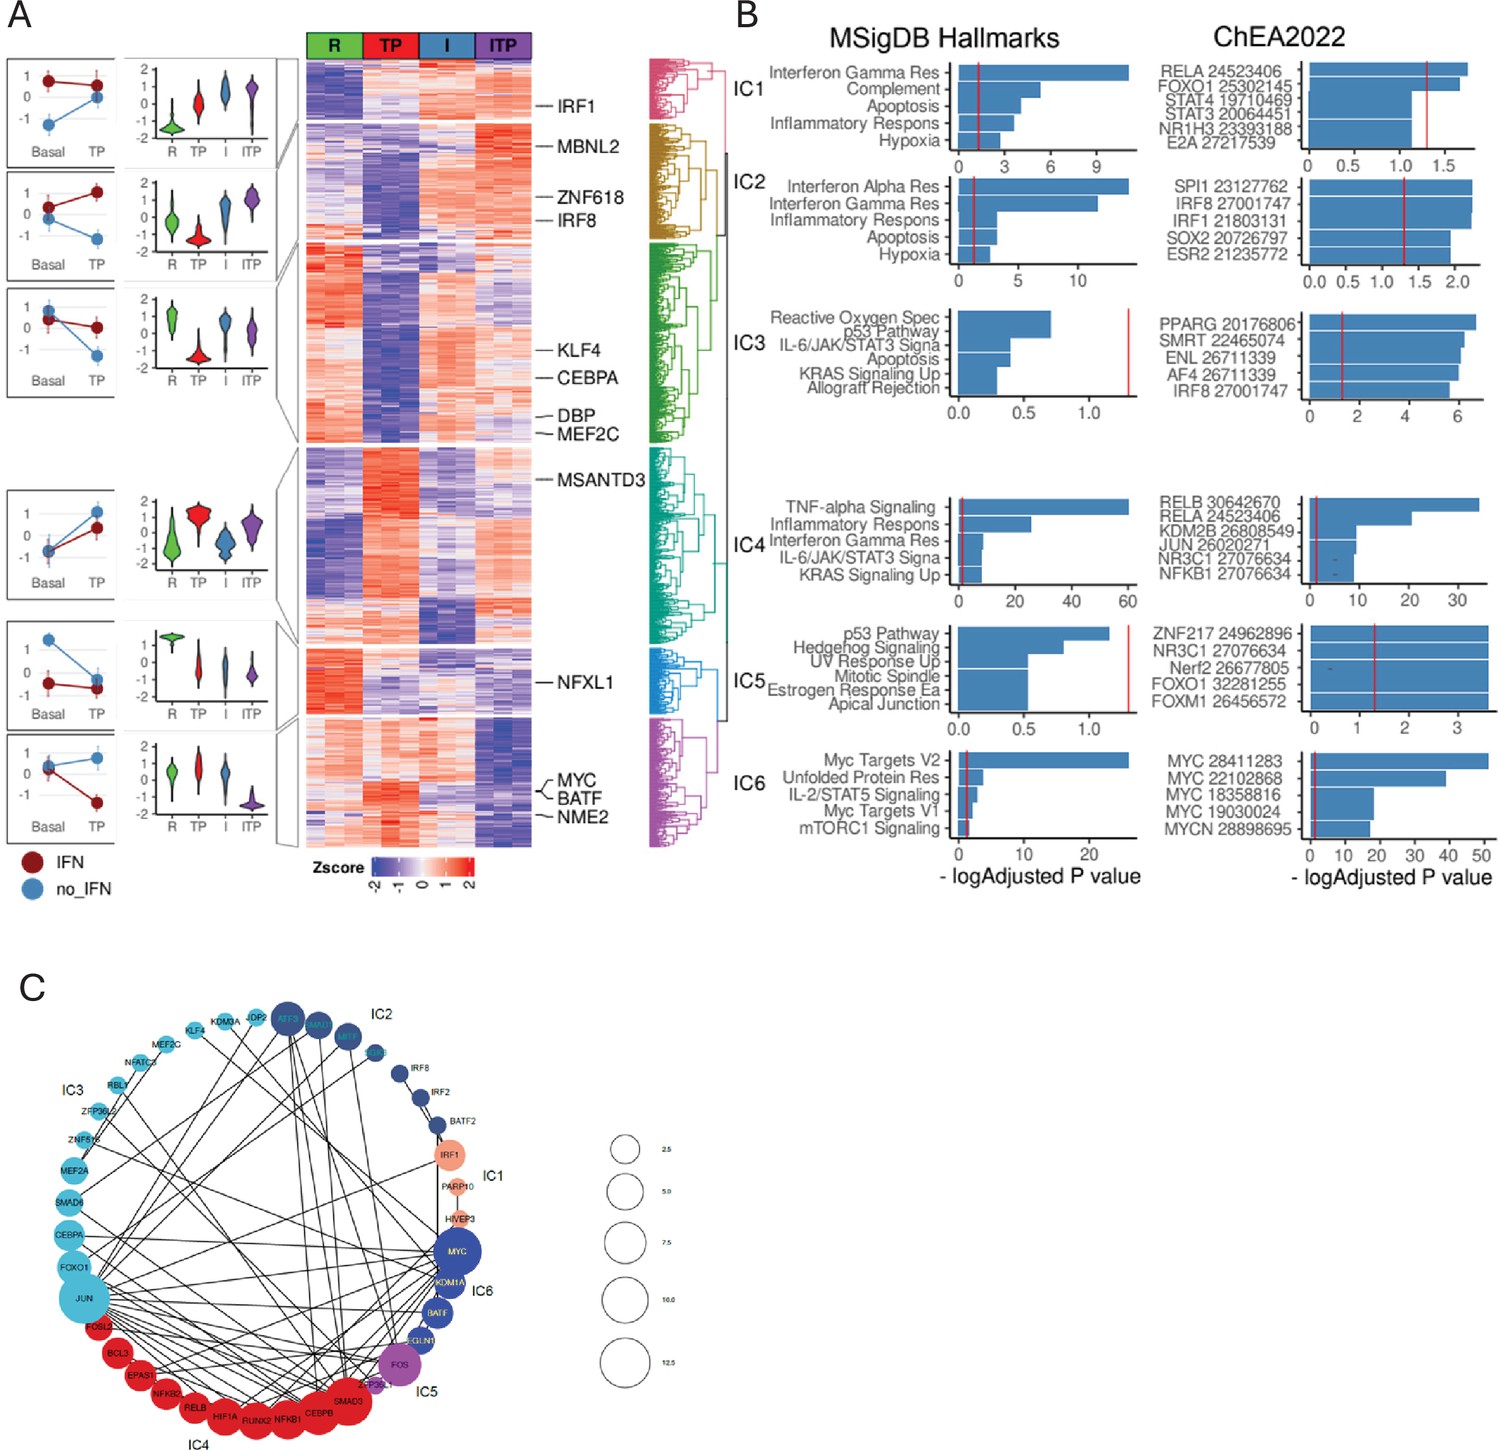
(A) Differentially expressed genes in ((IFN-γ+TP) – IFN-γ) – (IFN-γ – Resting) contrast define statistical interactions between IFN-γ and TP treatments using the RNAseq data, n=3, false discovery rate [FDR] < 0.05, fold change >2. Hierarchical clustering of z-transformed gene expression values (cpm) reveals six interaction clusters (right). Violin plots showing relative gene expression between resting (R), TP, IFN-γ alone (I), and IFN-γ+TP (ITP) conditions (second from left). Interaction plot (left). (B) Pathway analysis of the genes in the interaction clusters defined in panel (A). (C) STRING functional protein association network of transcription factors from each cluster (fold change >4, FDR <0.05). Lines designate functional interactions between individual TFs. The size of nodes is proportional to the number of STRINGDB interactions.
Figure 8 with 1 supplement
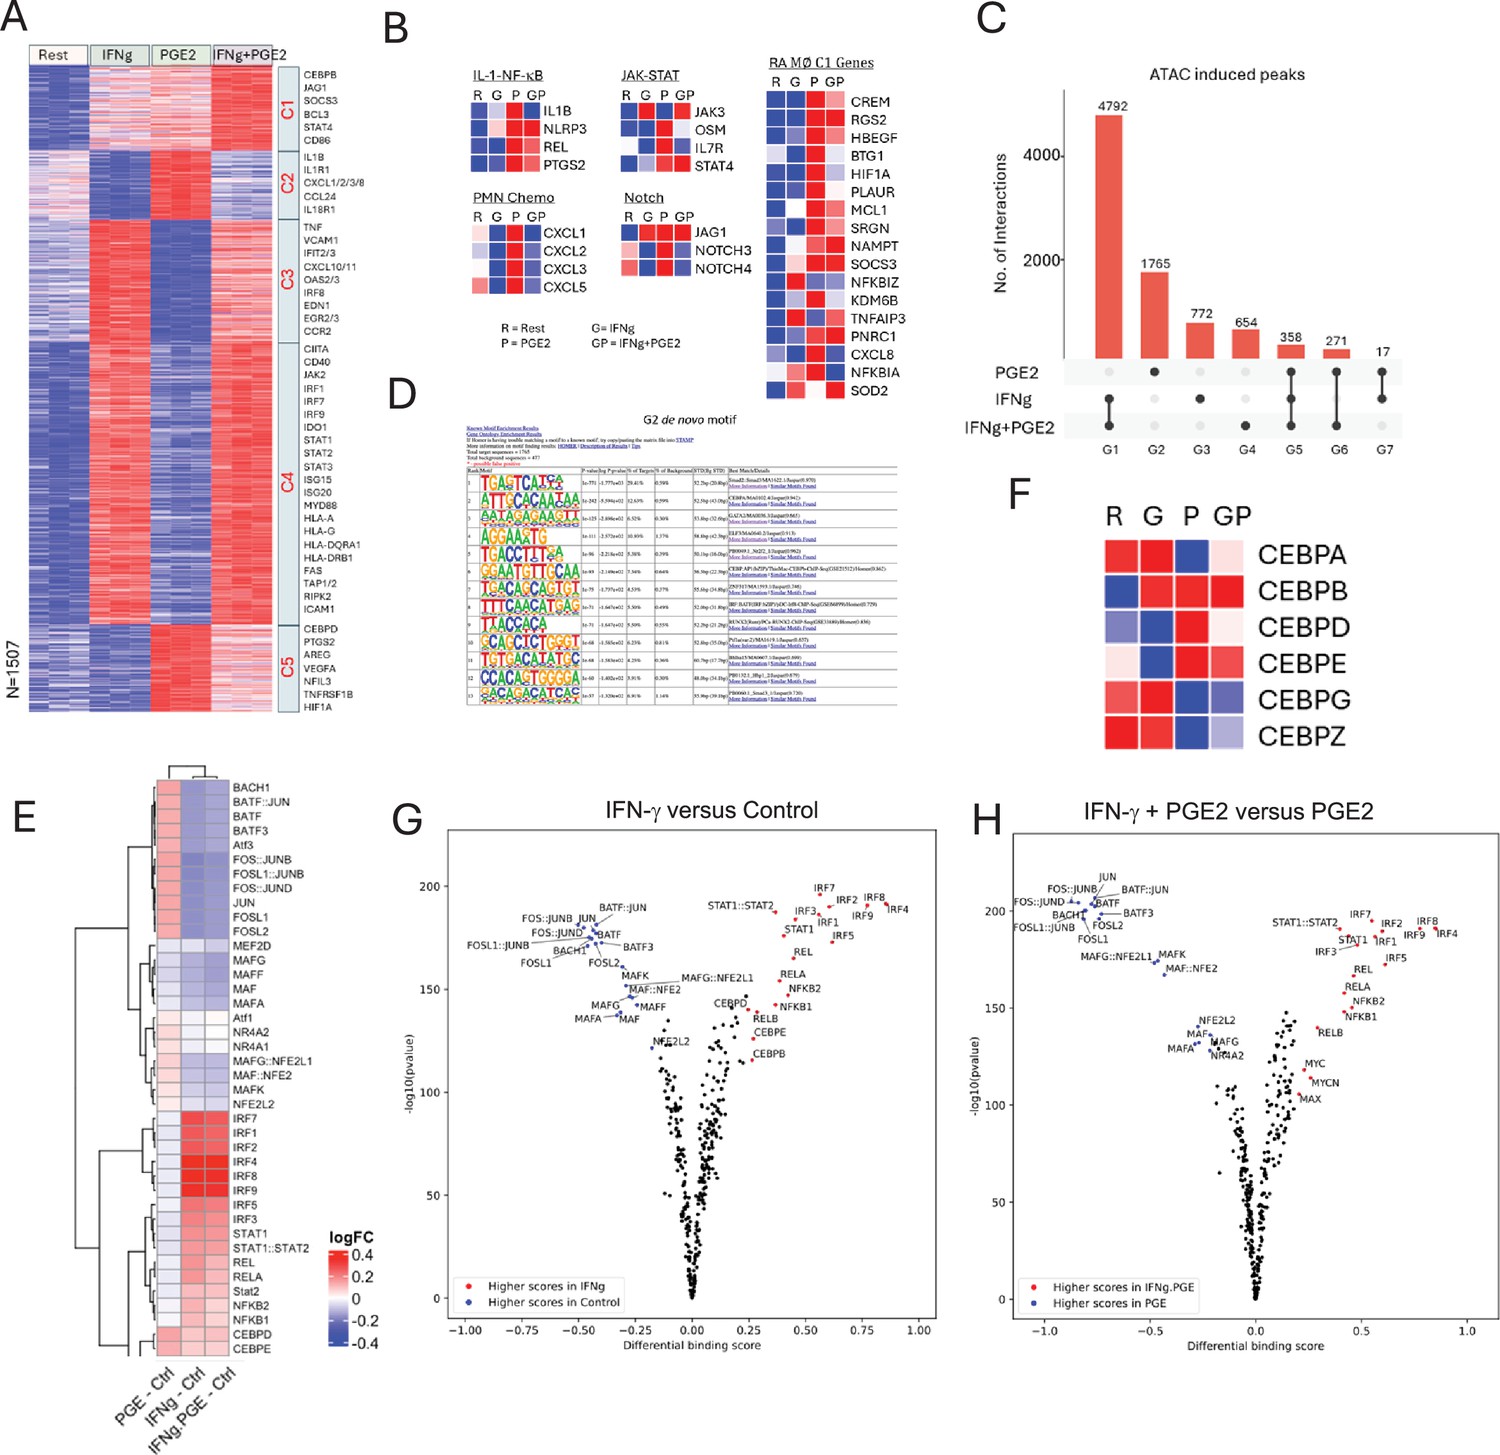
IFN-γ inhibits PGE2-induced gene expression and chromatin accessibility.
(A–B, F) Analysis of RNAseq data obtained using monocytes from three independent donors. (A) K-means clustering of differentially upregulated genes in any pairwise comparison relative to resting control (>2-fold induction, false discovery rate [FDR] < 0.05). k=5. (B) Heatmaps depicting expression of genes in pathogenic pathways and expressed in C1 RA macrophages as defined in Figure 2C and D. (C–E, G, H). Analysis of ATACseq data obtained using monocytes from three independent donors. (C) UPSET plot of differentially upregulated ATACseq peaks in any pairwise comparison relative to resting control (>2-fold induction, FDR < 0.05). (D) De novo motif analysis using HOMER of ATACseq peaks induced uniquely by PGE2 (corresponding to G2 in panel C). (E) Heatmap of the differential TF activity scores derived from ChromVAR analysis of ATACseq data for P, IFN-γ, or IFN-γ+PGE2 treated monocytes, compared to resting control. (F) Heatmap depicting expression of CEBP genes in RNAseq data. (G, H) Volcano plots of differential binding analysis of ATACseq peaks of IFN-γ versus resting control (G) and IFN-γ+PGE2 versus PGE2 (H) conditions using TOBIAS. The IFN-γ versus resting results (G) reproduce results in Mishra and Ivashkiv, 2024 that were obtained in independent experiments with different blood donors.
Figure 8—figure supplement 1
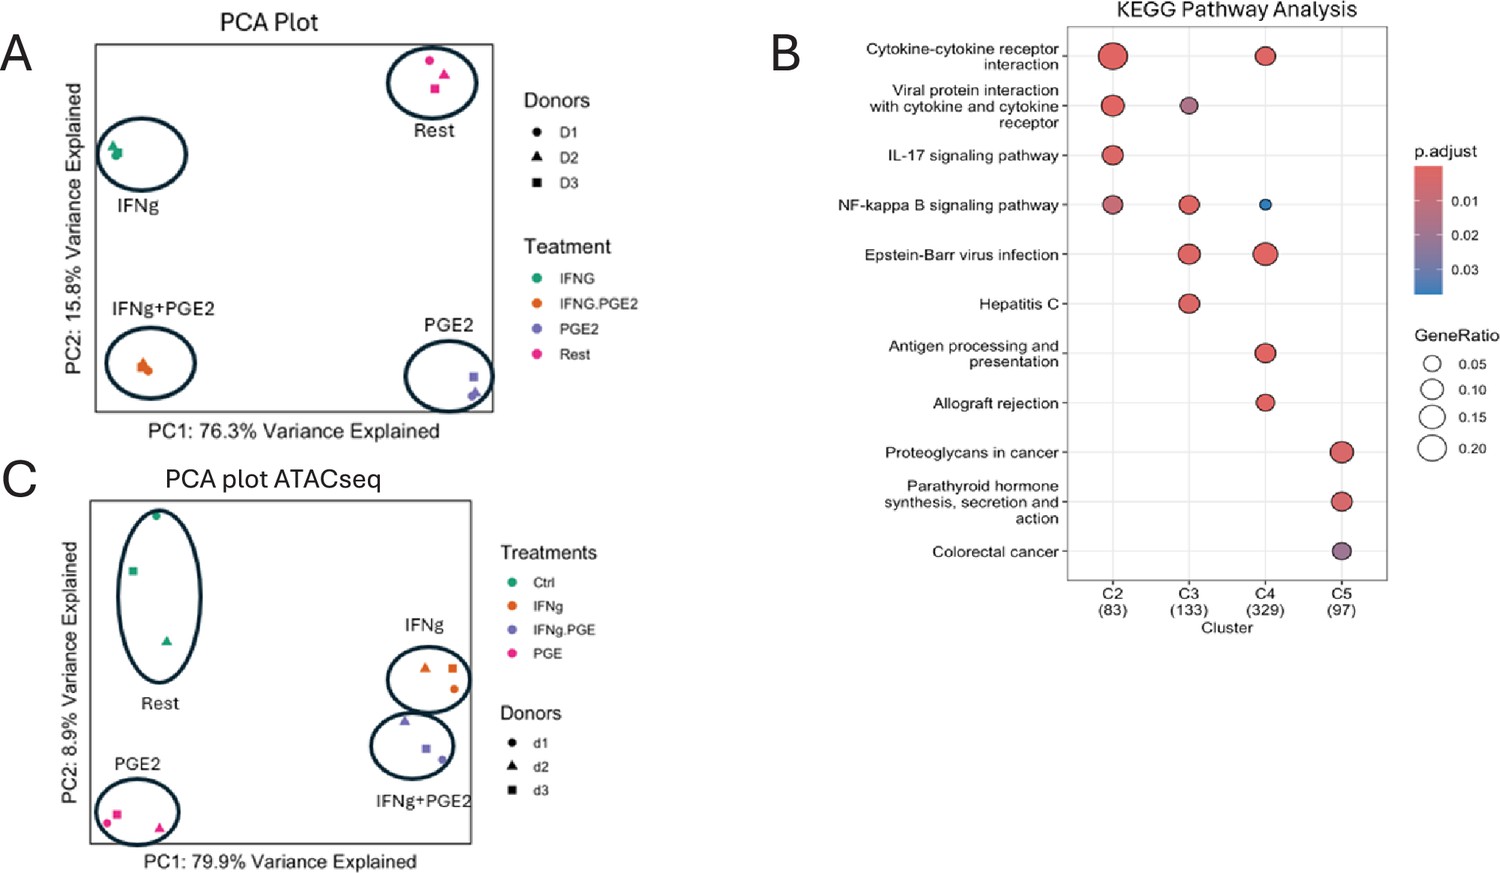
IFN-γ inhibits PGE2-induced gene expression and chromatin accessibility.
Figure 9
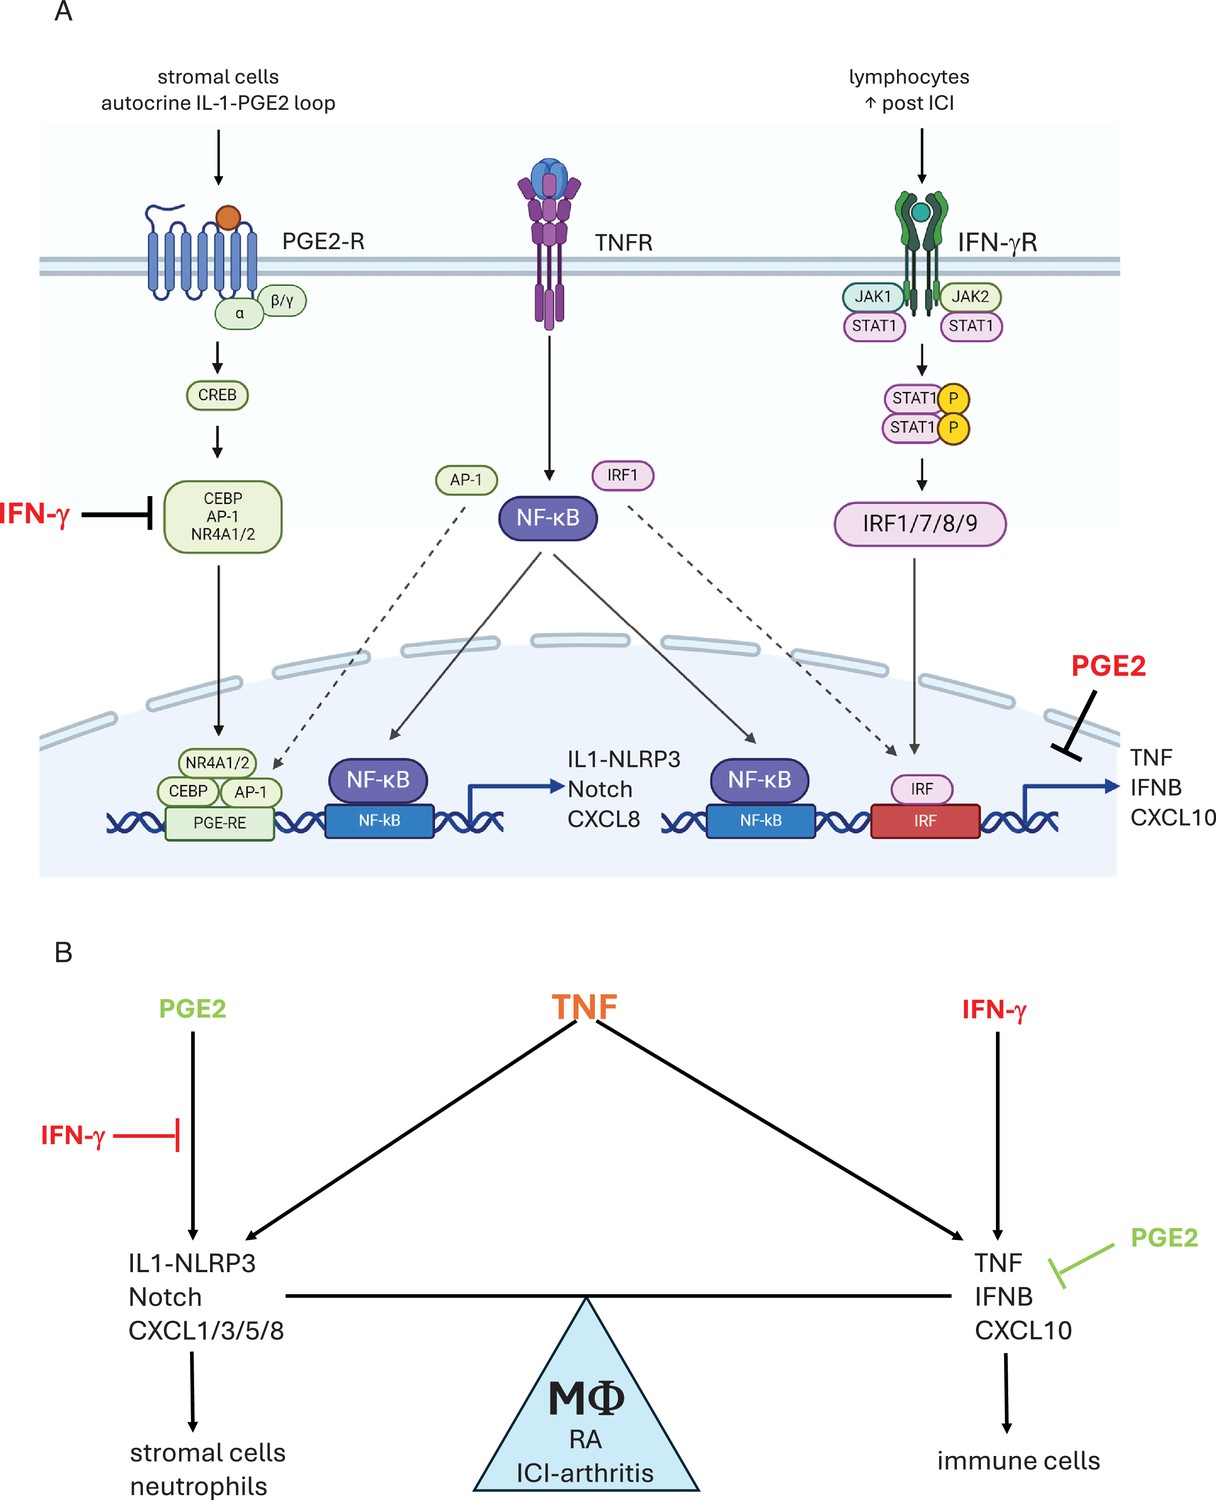
Crosstalk between PGE2 and TNF signaling and its regulation by IFN-γ.
(A) PGE2 costimulates TNF-induced expression of select inflammatory genes such as IL-1 and Notch pathway genes and neutrophil chemokines by inducing transcription factors including CEBP, AP-1, and NR4A1/2 that cooperate with TNF-activated NF-κB (left). IFN-γ induces IRF transcription factors that cooperate with TNF-activated NF-κB to costimulate distinct inflammatory genes such as TNF and T cell chemokines such as CXCL10, reviewed in Mishra and Ivashkiv, 2024 (right). IFN-γ inhibits induction of TP-costimulated genes by suppressing induction of AP-1 and NR4A1/2, and altering the pattern of expression of CEBP factors. PGE2 suppresses TNF-mediated induction of TNF and ISGs. As PGE2 is produced by stromal cells and IFN-γ is produced by lymphocytes, neighboring cells in inflamed tissues will help determine the macrophage response to TNF. Induction of a subset of CEBP factors by IFN-γ is not depicted. (B) IFN-γ and PGE2 oppose each other to regulate the balance between distinct TNF-induced inflammatory responses. PGE2 signaling promotes a response that activates stromal cells via IL-1, EGFR ligands, and Notch pathways, and promotes recruitment of neutrophils. IFN-γ suppresses these pathways and instead promotes inflammation via TNF and recruitment of T cells.
Additional files
-
Supplementary file 1
Table listing the clinical characteristics of ICI-arthritis patients whose samples were used in the scRNAseq experiments.
- https://cdn.elifesciences.org/articles/104367/elife-104367-supp1-v1.docx
-
MDAR checklist
- https://cdn.elifesciences.org/articles/104367/elife-104367-mdarchecklist1-v1.pdf
Download links
A two-part list of links to download the article, or parts of the article, in various formats.
Downloads (link to download the article as PDF)
Open citations (links to open the citations from this article in various online reference manager services)
Cite this article (links to download the citations from this article in formats compatible with various reference manager tools)
Opposing regulation of TNF responses by IFN-γ and a PGE2-cAMP axis that is apparent in rheumatoid and immune checkpoint inhibitor-induced arthritis human IL-1β+ macrophages
eLife 14:RP104367.
https://doi.org/10.7554/eLife.104367.3


