Phosphoglycerate mutase regulates Treg differentiation through control of serine synthesis and one-carbon metabolism
- Department of Neurology, Johns Hopkins University School of Medicine, United States
- Department of Psychiatry and Behavioral Sciences, Johns Hopkins University School of Medicine, United States
- Advanced Technology Core, Baylor College of Medicine, United States
- Department of Molecular and Cellular Biology, Baylor College of Medicine, United States
Figures
Figure 1 with 5 supplements
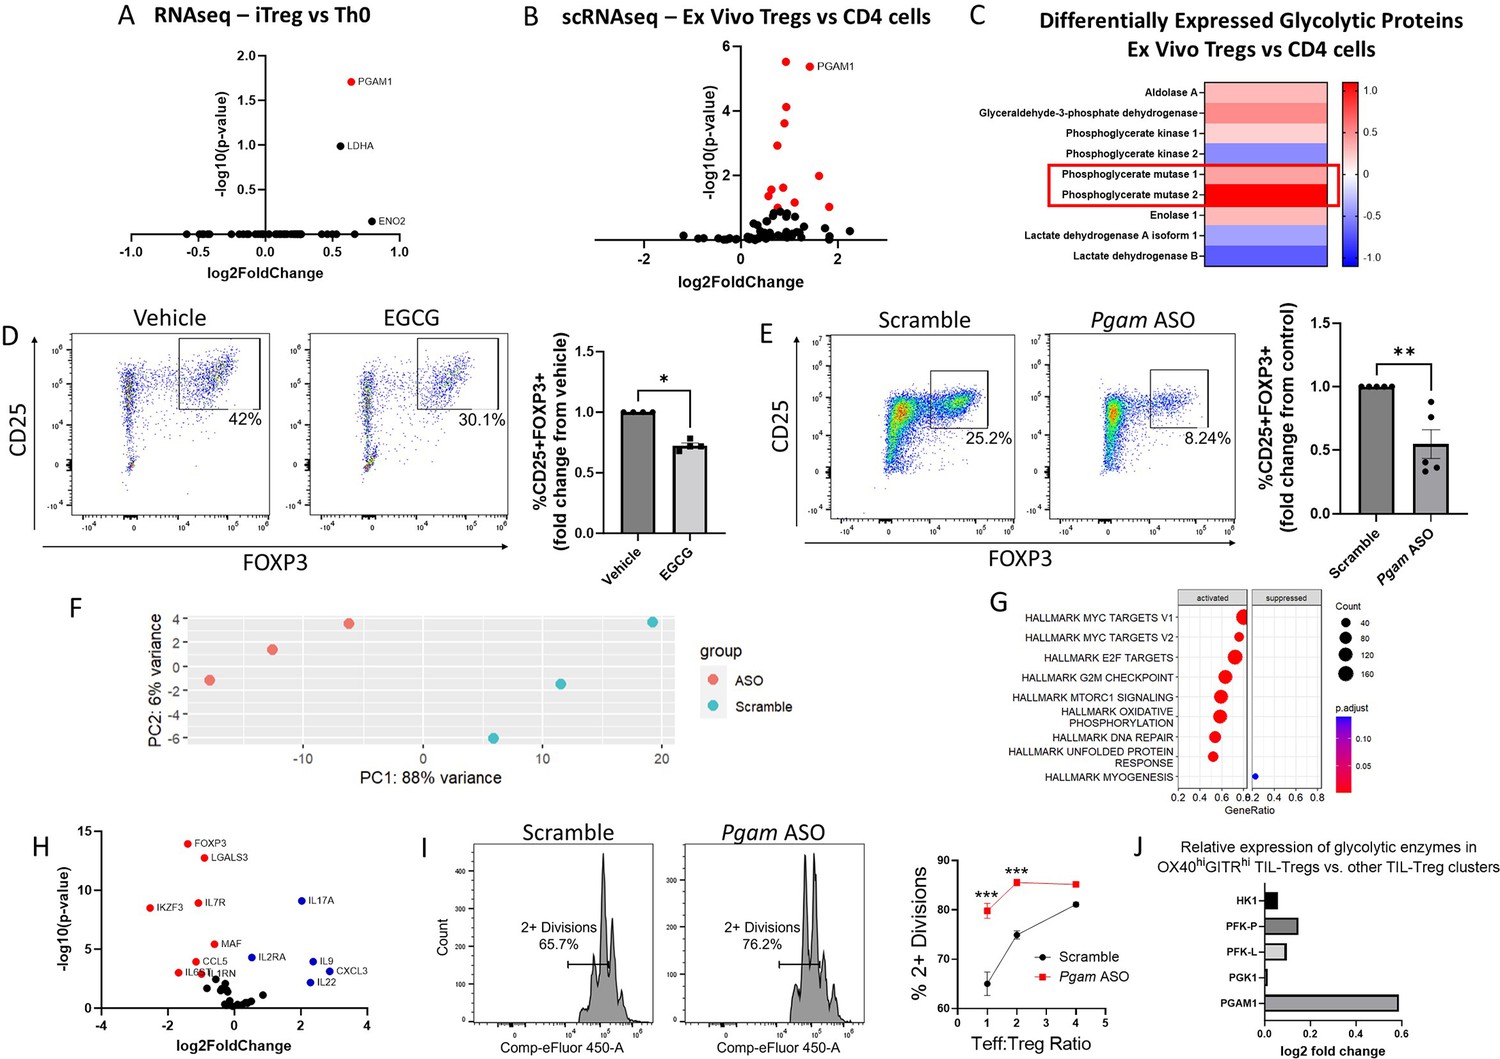
Phosphoglycerate mutase (PGAM) regulates Treg differentiation and suppressive function.
. (A – C) Analysis of publicly available transcriptomics and proteomics data reveals upregulation of PGAM expression in human iTregs and ex vivo Tregs. (A) Publicly available RNA sequencing (RNA-seq) data from human naïve CD4 cells cultured under either Th0 or Treg polarizing conditions for 72 hr (Ullah et al., 2018) was analyzed, and genes belonging to the Gene Ontology (GO) term ‘Glycolysis and Gluconeogenesis’ were plotted. (B) Differential expression of ‘Glycolysis and Gluconeogensis’ GO genes in ex vivo Tregs vs. total CD4 cells derived from healthy donor peripheral blood mononuclear cells (PBMCs) (Schafflick et al., 2020). GAPDH was removed for scaling purposes. (C) Differential expression of cytosolic glycolytic enzymes in ex vivo Tregs vs. conventional CD4 T cells derived from healthy donor PBMCs, analyzed from publicly available proteomics data (Procaccini et al., 2016). (D) Naïve murine CD4 cells were cultured under Treg polarizing conditions for 4 days and treated with either EGCG (20 μM) or vehicle on day 1. Treg polarization based on CD25 and FOXP3 expression was analyzed by flow cytometry. Data represent mean ± SEM from four independent experiments, with three to four biological replicates per experiment. (E) Naïve murine CD4 cells were treated with either scrambled or Pgam-specific antisense oligonucleotides (ASOs) and cultured under Treg polarizing conditions for 72 hr. CD25 and FOXP3 expression were analyzed by flow cytometry. Data represent mean ± SEM from five independent experiments, with three to four biological replicates per experiment. (F – H) Naïve murine CD4 cells were cultured with either scrambled or anti-Pgam ASOs for 72 hr under Treg polarizing conditions. RNA was isolated from unsorted cells for RNA-seq, followed by library size normalization and differential expression analysis. Shown for scrambled versus anti-Pgam ASO-treated cells are (F) PCA plot, (G) Gene Set Enrichment Analysis (GSEA) using MSigDB Hallmark gene sets, and (H) volcano plot of genes associated with T cell function. Data from 3 biological replicates. (I) Naïve murine CD4 cells were cultured under Treg polarizing conditions with either scrambled or anti-Pgam ASOs for 72 hr. To assess Treg suppressive function, the polarized Tregs were cultured with naïve CD4 cells stimulated with CD3/CD28 stimulating antibodies for an additional 72 hr at the indicated ratios. Cell proliferation was measured by dilution of a cell proliferation dye. Data represent mean ± SEM from four biological replicates. (J) Analysis of a published scRNA-seq dataset of tumor-infiltrating Tregs (TIL-Tregs) (Dykema et al., 2023) shows that PGAM1 is overexpressed in the most highly suppressive subpopulation, out of proportion to proximal rate-limiting glycolytic enzymes. *p<0.05, **p<0.01, ***p<0.0001 by Mann-Whitney U Test (D, E) or two-way ANOVA with multiple comparisons testing (I). P-values in (A), (B), and (F – H) were derived from Wald’s test after False Discovery Rate correction and median-of-ratios normalization via DESeq2.
Figure 1—figure supplement 1

Epigallocatechin gallate (EGCG) has no effect on Treg viability or proliferation.
Naïve murine CD4 cells were cultured under Treg polarizing conditions with either vehicle or EGCG (20 μM). (A) Viability was assayed with Zombie NIR dye. (B) Cell proliferation was assayed via cell proliferation dye, with proliferation index calculated as the total number of divisions divided by the number of cells that went into division. Data derived from three biological replicates. ns = not significant by Student’s t-test.
Figure 1—figure supplement 2

Efficient uptake of antisense oligonucleotides (ASOs) by cultured CD4 cells.
Naïve murine CD4 cells were cultured under Treg polarizing conditions for 24 hr with scrambled ASOs that were either unlabeled or labeled with a fluorescein (FAM) tag (detected in the FITC channel). Uptake of ASOs was assessed by measuring FITC signal within cells via flow cytometry.
Figure 1—figure supplement 3

Pgam antisense oligonucleotides (ASOs) reduce PGAM1 expression without impacting viability.
Naïve murine CD4 cells were cultured under Treg polarizing conditions for 72 hr with either scrambled or anti-Pgam ASOs. (A) PGAM1 expression and (B) cell viability were assayed by flow cytometry. Data represent mean ± SEM from three biological replicates. (C) Cell proliferation dye was used to quantify proliferation index, calculated as in Figure 1—figure supplement 1. Data represent mean ± SEM from three biological replicates. *p<0.05, **p<0.01 or ns = not-significant by Student’s t-test.
Figure 1—figure supplement 4

Glyceraldehyde-3-phosphate dehydrogenase (GAPDH) inhibition promotes Treg polarization.
Naïve murine CD4 cells were cultured under Treg polarizing conditions with vehicle or koningic acid (KA, 0.1 μM) for 96 hrs. Treg polarization was assayed by flow cytometry. Data represent mean ± SEM from five independent experiments performed in triplicate. *p<0.05 by Mann-Whitney U test.
Figure 1—figure supplement 5

Increased Phosphoglycerate mutase (PGAM) to glyceraldehyde-3-phosphate dehydrogenase (GAPDH) expression ratio in regulatory T cells.
(A) Analysis of a publicly available RNA sequencing (RNA-seq) dataset from human naïve CD4 cells cultured under either Th0 or Treg polarizing conditions for 72 hr (Ullah et al., 2018) shows log2 fold change of PGAM1 expression versus GAPDH expression in iTreg cells. (B) Data from the ImmPres immunological proteome resource (Brenes et al., 2023) showing protein copy number of PGAM1 (left) and GAPDH (middle) as well as the ratio of PGAM1 to GAPDH protein copy number (right), derived from murine CD4 cells in the naïve state or polarized under Treg or Th17 conditions.
Figure 2
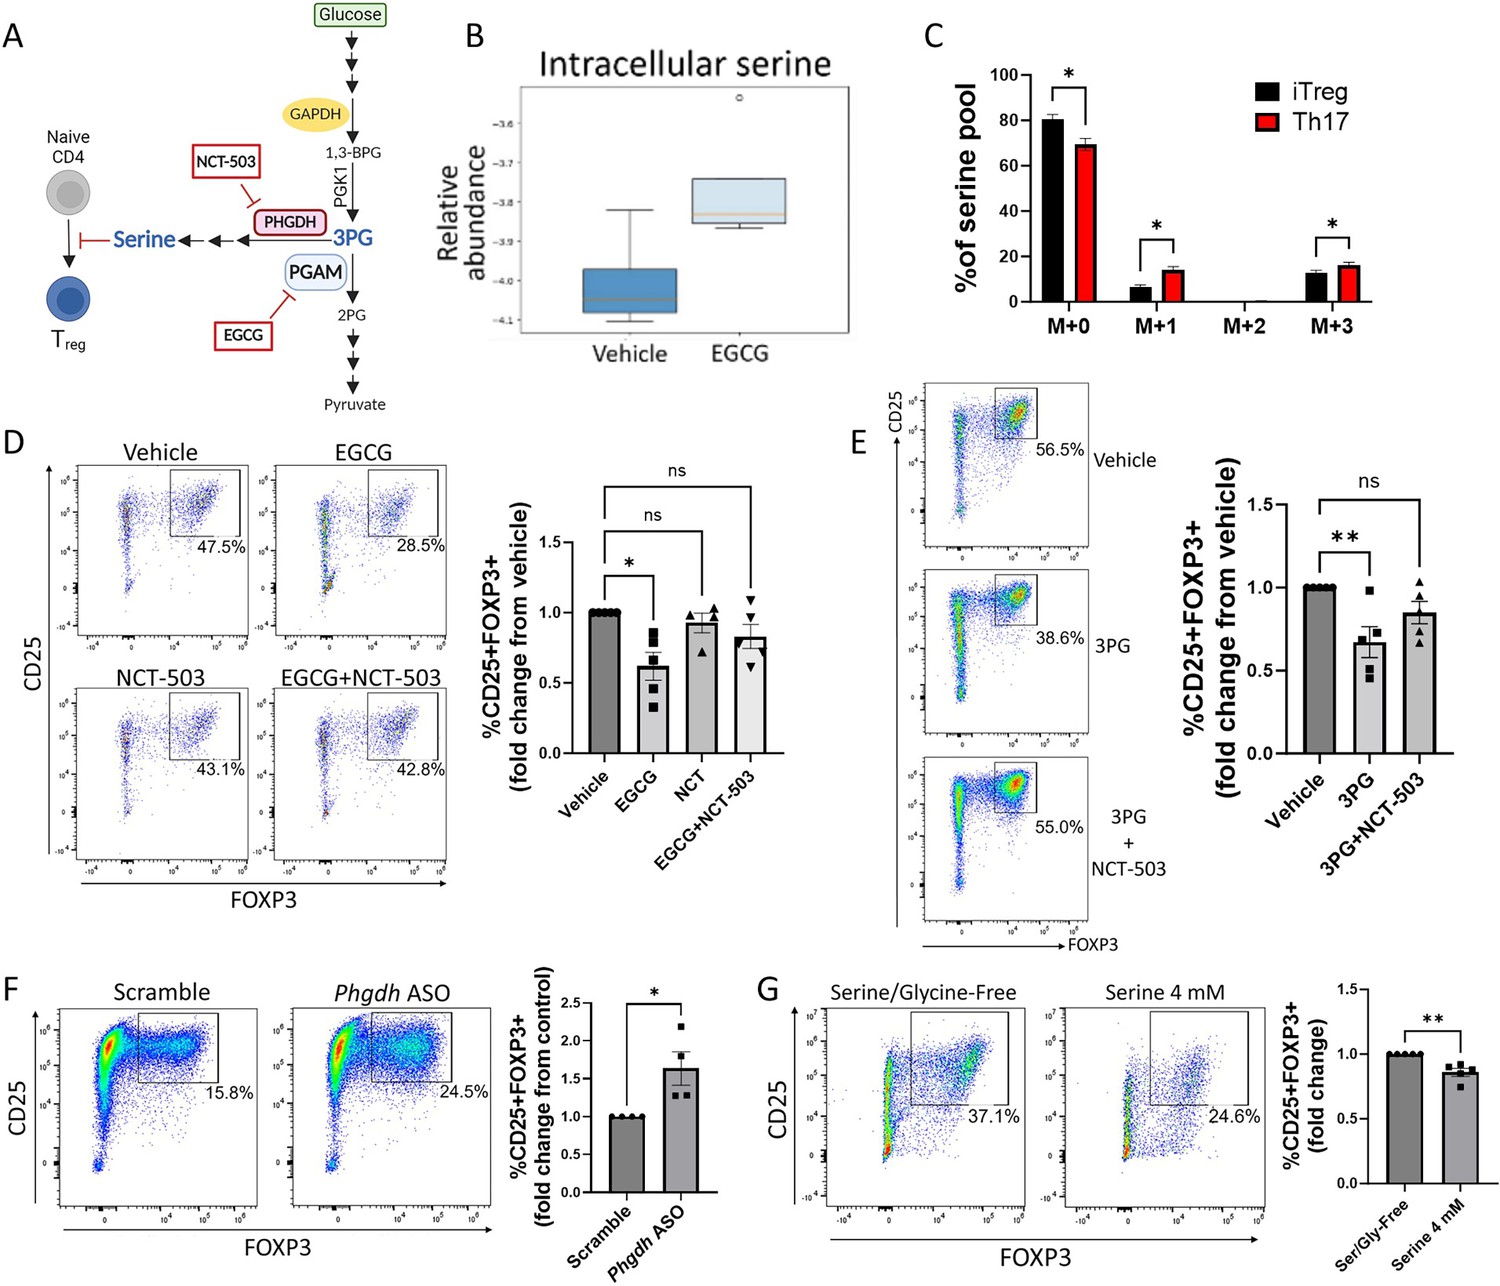
Phosphoglycerate mutase (PGAM) regulates Treg differentiation through control of de novo serine synthesis.
(A) Schematic diagram of the intersection of glycolysis and the de novo serine synthesis pathway via the PGAM substrate 3 PG. Pharmacologic inhibitors are shown in red boxes. This panel was created using BioRender.com. (B) Naïve murine CD4 cells were cultured under Treg polarizing conditions for 4 days and treated with vehicle or epigallocatechin gallate (EGCG) (20 μM) on day 1. Unsorted cells were then lysed and metabolites were extracted and analyzed via LC-MS. Data from four biological replicates. (C) The rate of glucose-derived serine synthesis from polarized murine Tregs or Th17 cells was measured by adding U13C-glucose to the culture media for 6 hr and quantifying the percentage of labeled/unlabeled serine via LC-MS. The mass isotopomer distribution (MID) of U13C-glucose-derived serine and percent contribution to the total serine pool is shown. Data represent mean ± SEM from three biological replicates. (D) Naïve murine CD4 cells were cultured under Treg polarizing conditions for 4 days. On day 1, the cells were treated with vehicle or the indicated combinations of the PGAM inhibitor EGCG (10 μM) and the PHGDH inhibitor NCT-503 (10 μM) (doses optimized for combination treatment). Treg polarization was assayed by flow cytometry. Data represent mean ± SEM from five independent experiments. (E) Naïve murine CD4 cells were polarized under Treg conditions for 4 days. On day 1 of polarization, cells were either sham-electroporated or supplemented with 3 PG (1.5 mM) by electroporation and treated with vehicle or the PHGDH inhibitor NCT-503 (10 μM). Analysis was performed by flow cytometry. Data represent mean ± SEM from five independent experiments. (F) Naïve CD4 cells were cultured under Treg polarizing conditions with either scrambled or anti-Phgdh ASOs, and Treg generation was analyzed by flow cytometry. Data represent mean ± SEM from four independent experiments. (G) Naïve murine CD4 cells were cultured under Treg polarizing conditions for 4 days with either serine/glycine-free media or serine/glycine-free media supplemented with 4 mM serine, followed by flow cytometric analysis. Data represent mean ± SEM from five independent experiments. *p<0.05, **p<0.01 by Mann-Whitney U test (F, G), Kruskal-Wallis test with multiple comparisons testing (D, E), or Student’s t-test with multiple hypothesis correction (C). Each independent experiment shown in (D-E) included three to four biological replicates.
Figure 3
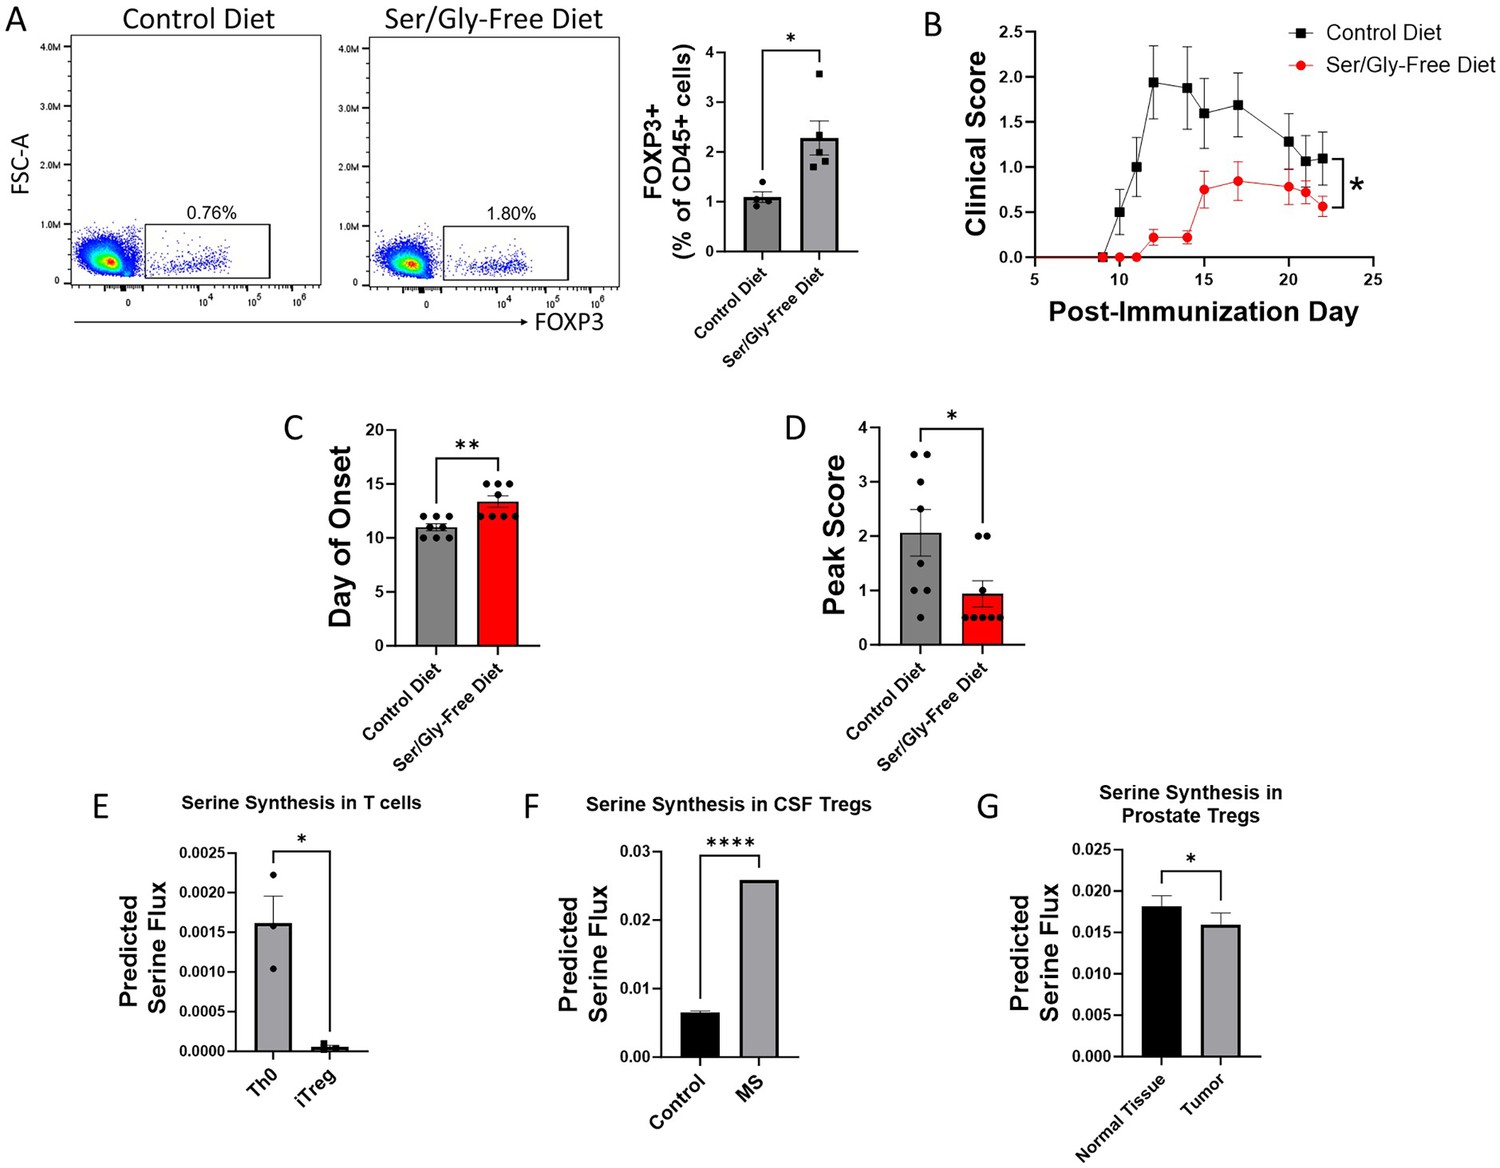
Serine synthesis and dietary availability regulate Tregs in vivo and in disease states.
(A) C57BL/6 mice were fed either serine/glycine-free diet or control diet for 8 weeks, beginning immediately post-weaning. Peripheral Tregs from blood were quantified by flow cytometry as the percentage of CD45+ cells expressing FOXP3. Data represent mean ± SEM from four to five mice per group. (B-D) Mice were fed either serine/glycine-free diet or control diet for 7 days and then subjected to MOG35-55 EAE. Clinical scoring was performed by a blinded observer. Data represent mean ± SEM from eight mice per group. Shown are (B) clinical scores over the course of the experiment, (C) day of neurologic symptom onset, and (D) peak clinical scores. (E-G) Publicly available RNA-seq data from three different datasets were analyzed using single-cell flux estimation analysis (SCFEA) to model serine synthesis rates from mRNA levels of metabolic enzymes. (E) SCFEA from human naïve CD4 cells cultured under either Th0 or Treg polarizing conditions for 72 hr (Ullah et al., 2018) predicts decreased serine synthesis in iTregs. (F) Predicted serine synthesis is increased in Tregs derived from cerebrospinal fluid of patients with treatment-naïve relapsing multiple sclerosis (MS) compared to controls (Schafflick et al., 2020). (G) Predicted serine synthesis is decreased in Tregs derived from prostate cancer versus control prostate (Camps et al., 2023). *p<0.05, **p<0.01, ****p<0.00001 by Student’s t-test (A, E, F, G), Mann-Whitney U test (C, D), and two-way ANOVA with repeated measures (B).
Figure 4 with 2 supplements
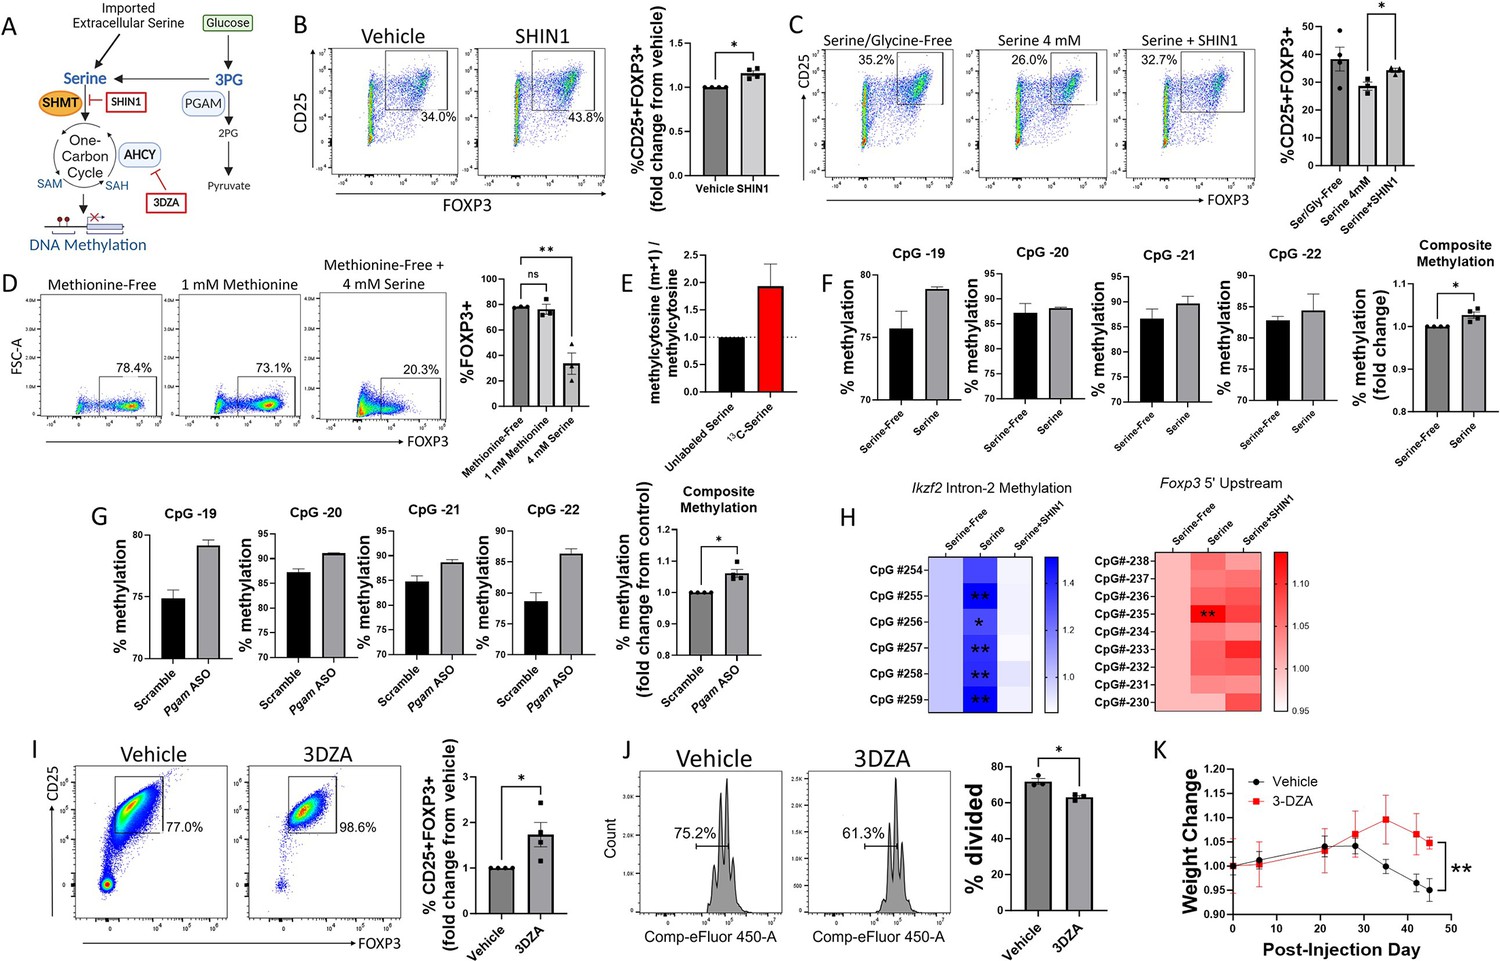
Serine inhibits Treg polarization by contributing to one-carbon metabolism and methylation of Treg-associated genes.
(A) Schematic diagram of serine entry into one-carbon metabolism and the methyl donor cycle. Pharmacologic inhibitors are shown in red boxes. This panel was created using BioRender.com. (B) Naïve murine CD4 cells were cultured under Treg polarizing conditions for 72 hr with either vehicle or SHIN1 (SHMT1/2 inhibitor, 1 μM) added at day 0 of culture. Treg polarization was assayed by flow cytometry. Data represent mean ± SEM from four independent experiments, with 3–4 biological replicates per experiment. (C) Naïve murine CD4 cells were cultured in serine/glycine-free media, media containing 4 mM serine, or media with serine plus SHIN1 (1 μM). Treg polarization was assayed by flow cytometry. Data represent mean ± SEM from three to four biological replicates per condition. (D) Naïve murine CD4 cells were cultured in methionine-free media supplemented with vehicle, 1 mM methionine, or 4 mM serine, and FOXP3 expression was assayed by flow cytometry. Data represent mean ± SEM from three biological replicates. (E) Naïve murine CD4 cells were cultured in serine/glycine-free media for 48 hr under Treg polarizing conditions and then for 12 hr with either unlabeled serine or U13C-serine. The mass isotopomer ratio of carbon-labeled methylcytosine (m+1) / unlabeled methylcytosine from unsorted cells is shown. Data represent mean ± SEM from three biological replicates. (F) Naïve CD4 cells were cultured under Treg polarizing conditions with either serine/glycine-free media or 4 mM serine. Methylation at the Foxp3 TSDR was assayed by pyrosequencing from unsorted cells. The composite methylation was calculated as the percent methylation for each of the 4 CpG sites measured in the assay normalized to the serine/glycine-free condition. Data derived from three biological replicates per condition. (G) Naïve CD4 cells were cultured under Treg polarizing conditions with either scrambled or anti-Pgam ASOs. Methylation at the Foxp3 TSDR was assayed by pyrosequencing from unsorted cells. The composite methylation was calculated as the percent methylation at each of the 4 CpG sites measured in the assay normalized to scrambled control. Data derived from three biological replicates per condition. (H) Naïve murine CD4 cells were cultured in serine/glycine-free media, media containing 4 mM serine, or media with serine plus SHIN1 (1 μM). Bisulfite-treated DNA was sequenced from unsorted cells using a Treg-specific next generation sequencing panel, and percent methylation of key sites was calculated. Data derived from three biological replicates per condition. (I) Naïve CD4 cells were cultured under Treg polarizing conditions with either vehicle or 3-Deazaadenosine (3DZA, AHCY inhibitor, 5 μM). Treg polarization was assayed by flow cytometry. Data represent mean ± SEM from 4 independent experiments, with three to four biological replicates per experiment. (J) Naïve CD4 cells were polarized to Tregs with either vehicle or 3DZA and then cultured with CD4 cells stimulated with CD3/CD28 to evaluate Treg suppressive function. CD4 cell proliferation was measured by flow cytometry. Data represent mean ± SEM from 3 biological replicates. (K) Naïve CD4 cells were cultured under Treg polarizing conditions with either vehicle or 3DZA, and 106 cells were then transferred into RAG -/- mouse recipients along with 107 activated CD4 cells. Mice were weighed at the specified times and weights are shown relative to the weight at the day of injection. Data represent mean ± SEM from five mice per group. *p<0.05, **p<0.01 by Mann-Whitney U test (B, F, G, I), one-way ANOVA with Tukey’s multiple comparisons testing (C, D), two-way ANOVA with Dunnett’s multiple comparison testing (H), Student’s t-test of average final weight (K), or Student’s t-test (J).
Figure 4—figure supplement 1

3DZA does not affect viability.
Naïve murine CD4 cells were cultured under Treg polarizing conditions for 72 hr with either vehicle or 3DZA (5 μM). Cell viability was assayed by flow cytometry. Data represent mean ± SEM from five to six biological replicates. ns = not significant by Student’s t-test.
Figure 4—figure supplement 2

Tregs polarized with 3DZA are more suppressive in the T cell transfer model of autoimmune colitis.
Naïve murine CD4 T cells were cultured under Treg polarizing conditions with either vehicle or 3DZA and 106 cells were transferred into RAG-/- mouse recipients along with 107 activated CD4 T cells. Mice injected with vehicle-treated Tregs showed colonic wall thickening indicative of more severe colitis.
Tables
Key resources table
| Reagent type (species) or resource | Designation | Source or reference | Identifiers | Additional information |
|---|---|---|---|---|
| Gene (Homo sapiens) | PGAM1 | GenBank | Gene ID: 5223 | |
| Gene (Mus musculus) | Pgam1 | GenBank | Gene ID: 18648 | |
| Strain, strain background (Mus musculus, male and female) | C57BL/6 J wild-type | Jackson Laboratory | Cat # 000664, RRID:IMSR_JAX:000664 | |
| Strain, strain background (Mus musculus, male, and female) | B6.129S7-Rag1tm1Mom/J (RAG knockout mice) | Jackson Laboratory | Cat # 002216, RRID:IMSR_JAX:002216 | |
| Antibody | Anti-mouse CD25, BV785 (Rat monoclonal) | Biolegend | Cat # 102051, RRID:AB_2564131 | 1:200 |
| Antibody | Anti-FOXP3, APC (Rat monoclonal) | Thermo Fisher | Cat # 17-5773-80, RRID:AB_469456 | 1:200 |
| Antibody | Anti-PGAM1, Alexa Fluor 405 (Rabbit polyclonal) | Novus Biologicals | Cat # NBP1-49532AF405, RRID:AB_3212871 | 1:200 |
| Antibody | Anti-CD3 (OKT3), Functional Grade, eBioscience (Mouse monoclonal) | Thermo Fisher | Cat # 16-0037-81, RRID:AB_468854 | 2 μg/ml |
| Antibody | Anti-CD28 (37.51), Functional Grade, eBioscience (Syrian hamster monoclonal) | Thermo Fisher | Cat # 16-0281-82, RRID:AB_468921 | 2 μg/ml |
| Antibody | InVivoPlus anti-mouse IFNγ (Rat monoclonal) | BioXcell | Cat # BP0055, RRID:AB_1107694 | 5 μg/ml |
| Antibody | InVivoPlus anti-mouse IL4 (Rat monoclonal) | BioXcell | Cat # BE0045, RRID:AB_1107707 | 5 μg/ml |
| Commercial assay or kit | Zombie NIR fixable viability kit | BioLegend | Cat # 423106 | 1:1000 |
| Commercial assay or kit | Cell Proliferation Dye | eBioscience | Cat # 65-0842-85 | 1:2000 |
| Commercial assay or kit | MojoSort(TM) Mouse CD4 Naive T Cell Isolation Kit | BioLegend | Cat # 480040 | |
| Commercial assay or kit | MojoSort(TM) Mouse CD4 T Cell Isolation Kit | BioLegend | Cat # 480006 | |
| Chemical compound, drug | SHIN1 | MCE | Cat # HY-112066 | |
| Chemical compound, drug | NCT-503 | Sigma | Cat # SML1659-5MG | |
| Chemical compound, drug | EGCG | Millipore Sigma | Cat # E4143-50MG | |
| Chemical compound, drug | 3-DZA | Cayman | Cat # 9000785 | |
| Chemical compound, drug | Heptelidic Acid | Cayman | Cat # 14079 | |
| Chemical compound, drug | D-(-)–3-Phosphoglyceric Acid (Sodium Salt) | Cayman | Cat # 20123 | |
| Chemical compound, drug | D-(+)-Glucose-13C6 | Cayman | Cat # 26707 | |
| Chemical compound, drug | L-Serine-13C3 | Cayman | Cat # 35126 | |
| Sequence-based reagent | Pgam antisense oligonucleotides | Aum Biotech | Custom order | |
| Sequence-based reagent | Phgdh antisense oligonucleotides | Aum Biotech | Custom order | |
| Peptide, recombinant protein | Animal-Free Recombinant Murine IL-2 | Thermo Fisher | Cat # AF-212–12 | |
| Peptide, recombinant protein | Recombinant Human TGF-beta 1 | BioRad | Cat # PHP143B | |
| Peptide, recombinant protein | Murine IL-6 | Peprotech | Cat # 216–16 | |
| Peptide, recombinant protein | Recombinant Mouse IL-23 (carrier-free) | BioLegend | Cat # 589002 | |
| Peptide, recombinant protein | Murine IL-1beta | Peprotech | Cat # 211-11B | |
| Other | Control mouse diet | Animal Specialties and Provisions | Cat # 1817070–209 | |
| Other | Serine/Glycine-Free mouse diet | Animal Specialties and Provisions | Cat # 1812281 |
Additional files
-
Supplementary file 1
List of differentially expressed genes -Pgam ASOs versus Scrambled ASOs.
- https://cdn.elifesciences.org/articles/104423/elife-104423-supp1-v1.xlsx
-
Supplementary file 2
CpG methylation of Treg-specific genes by next generation sequencing.
- https://cdn.elifesciences.org/articles/104423/elife-104423-supp2-v1.xlsx
-
MDAR checklist
- https://cdn.elifesciences.org/articles/104423/elife-104423-mdarchecklist1-v1.docx
Download links
A two-part list of links to download the article, or parts of the article, in various formats.
Downloads (link to download the article as PDF)
Open citations (links to open the citations from this article in various online reference manager services)
Cite this article (links to download the citations from this article in formats compatible with various reference manager tools)
Phosphoglycerate mutase regulates Treg differentiation through control of serine synthesis and one-carbon metabolism
eLife 14:RP104423.
https://doi.org/10.7554/eLife.104423.3


