Evaluation of information flows in the RAS-MAPK system using transfer entropy measurements
- Cellular Informatics Laboratory, RIKEN, Cluster for Pioneering Research, Japan
- Institute for Physics of Intelligence, The University of Tokyo, Japan
- Trans-Scale Quantum Science Institute, The University of Tokyo, Japan
Figures
Figure 1
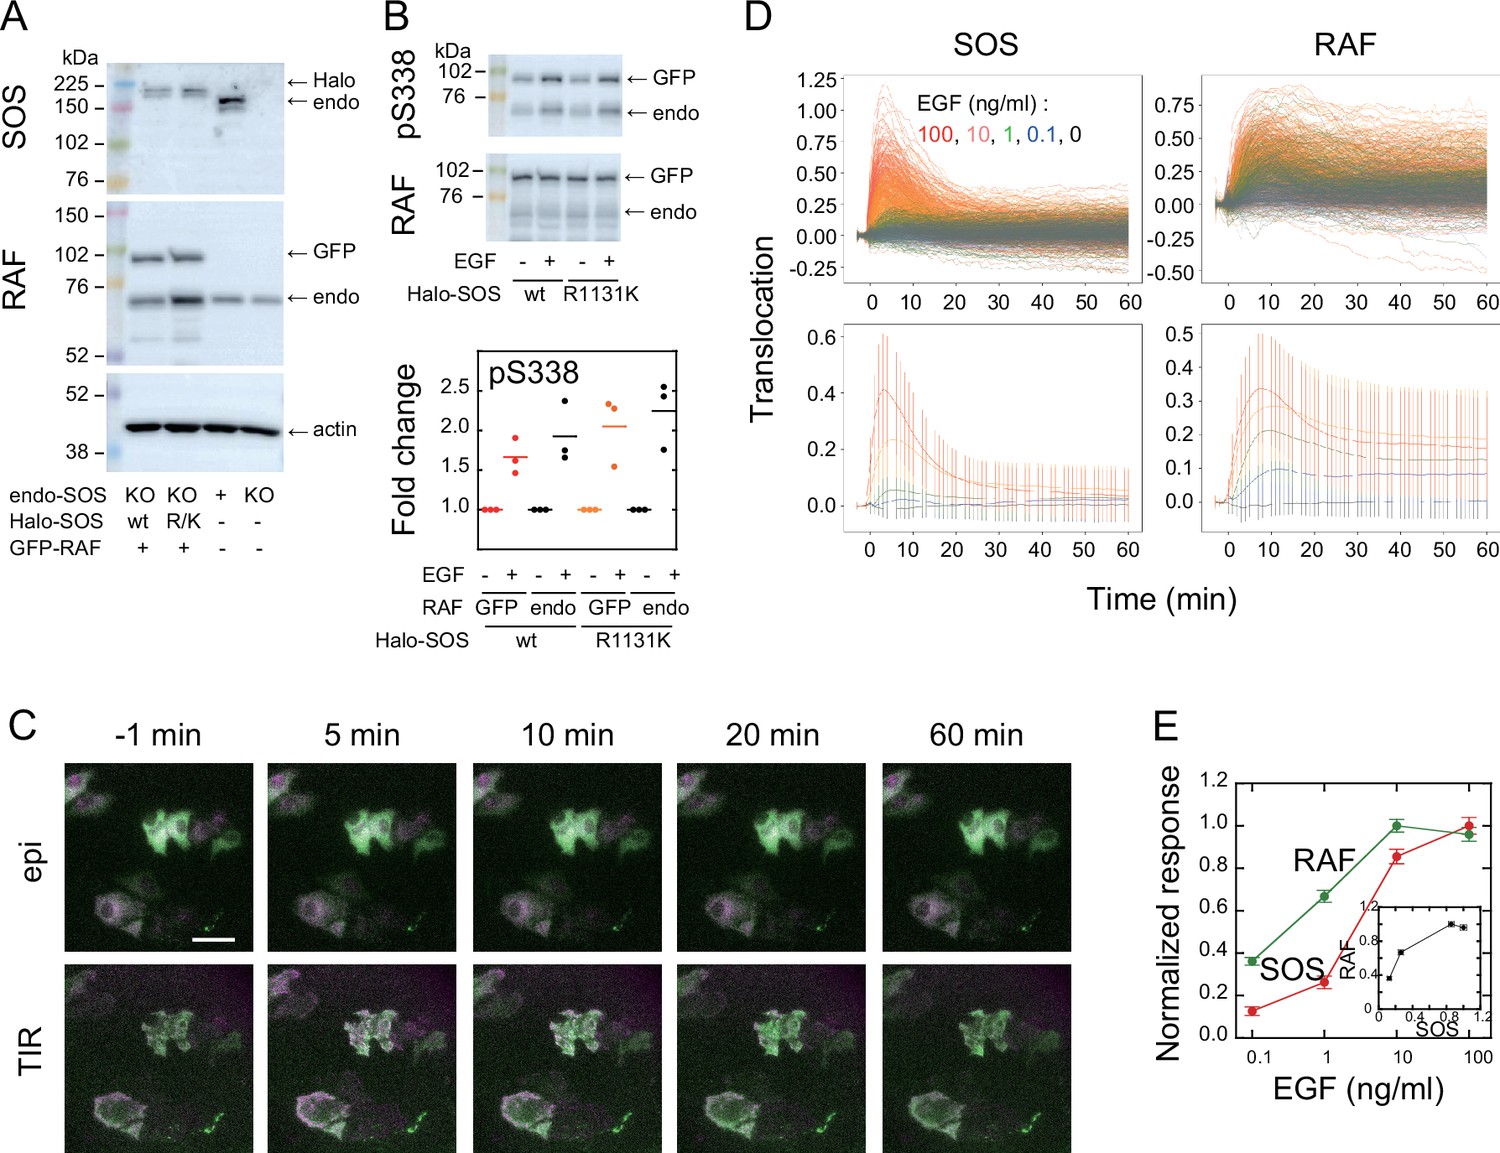
SOS and RAF responses to cell stimulation.
(A) Expression levels of SOS and RAF probes. Halo-SOS (wild type, wt or R1131K mutant, R/K) and GFP-RAF were expressed in SOS knockout HeLa cells. (B) RAF phosphorylation before and after 10 min of 10 ng/ml EGF stimulation of cells. Results of representative Western blotting and quantification of three independent experiments. (C) Translocations of SOS (magenta) and RAF (green). Epi-fluorescence (upper) and TIR-fluorescence (lower) images at the indicated times after 100 ng/ml EGF stimulation. Bar, 50 µm (Appendix 1—Videos 1 and 2). (D) Time course analysis of SOS and RAF translocation observed in the total 1467 cells after vehicle (black: 150 cells) or EGF (blue: 0.1 ng/ml, 300 cells; green: 1 ng/ml, 310 cells; orange: 10 ng/ml, 370 cells; red: 100 ng/ml, 337 cells) stimulation. Changes in the molecular density on the cell surface (TIR) relative to the whole cell signal (epi) are plotted. The lower panels show the average with SD of the single cell data in the upper panels. (E) EGF dose dependence of the SOS (red) and RAF (green) responses. Response intensities were determined as the sum of the molecular translocation during 0–60 min normalized to the maximum. Inset shows the relationship between SOS and RAF responses. Cell-to-cell averages are shown with SE.
-
Figure 1—source data 1
Source data for Figure 1A.
- https://cdn.elifesciences.org/articles/104432/elife-104432-fig1-data1-v1.zip
-
Figure 1—source data 2
Source data for Figure 1B.
- https://cdn.elifesciences.org/articles/104432/elife-104432-fig1-data2-v1.zip
Figure 2
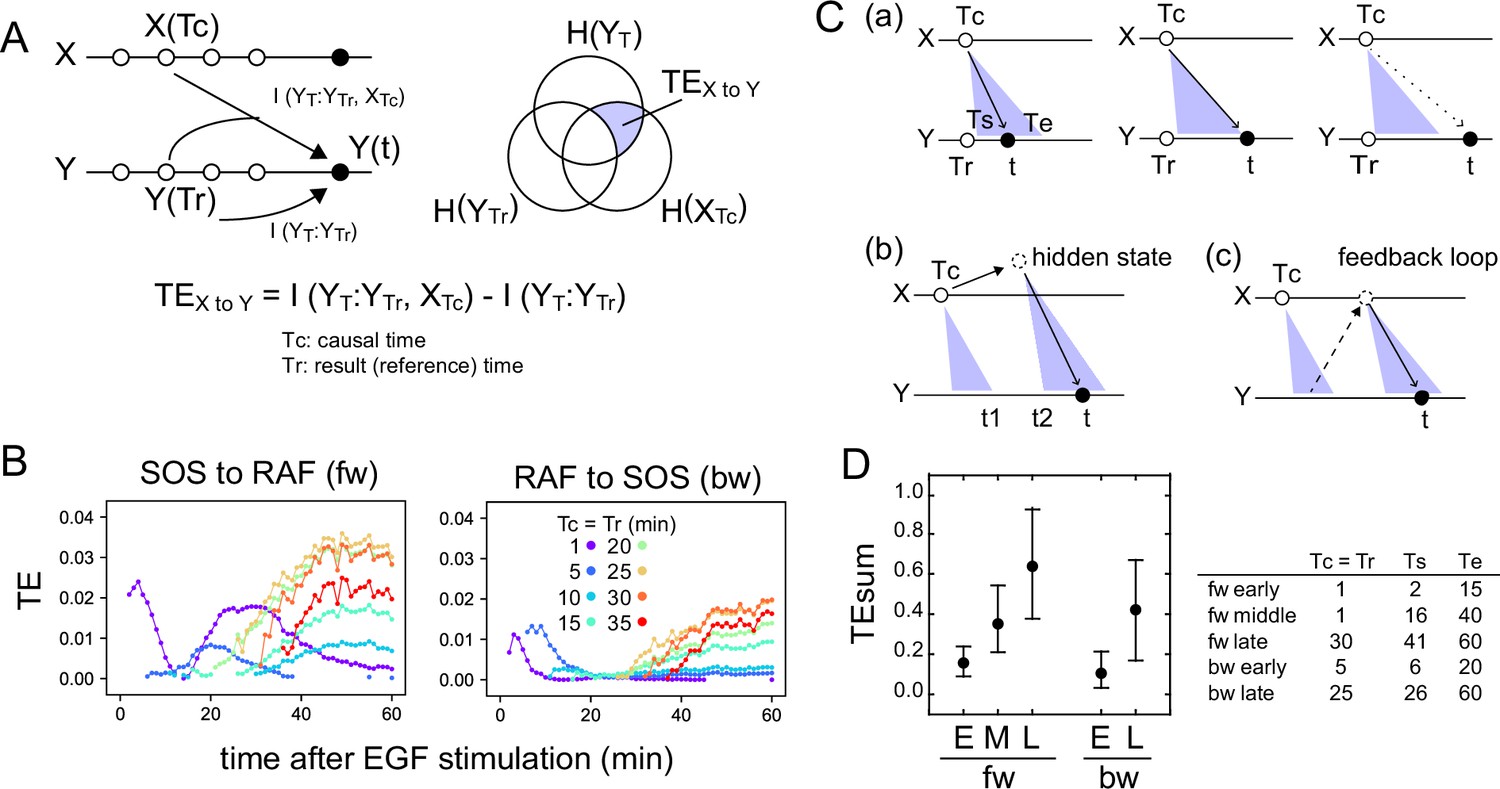
Transfer entropy time course analysis.
(A) Concept of TE between two reaction time courses. TE from X(Tc) to Y(t) was calculated using Y(Tr) as the reference (Tc = Tr < t). (B) TE time courses for the total 1317 pairs of translocation trajectories with 0.1–100 ng/ml of EGF stimulation. Calculations were performed for the indicated Tc = Tr from 1 to 35 min after cell stimulation. Only statistically significant TE values (see Materials and methods) are plotted. (C) Appearance of the separated TE peaks from single Tc. (a) In a single-track reaction pathway, TE from Tc in the X time series appears during a single continuous period (Ts to Te) and disappears after t≥Te. (b) The second TE peak is indirect information flow through a hidden state outside the pathway of the first TE peak. (c) The second TE peak can be caused by a feedback loop. (D) The sum of the significant TE (TEsum) in the TE peaks. Average and 5–95% range in 100-time bootstrapping are shown. TE from Tc (=Tr) was integrated during ts ~ te as TEsum. Tc, ts, and te used in the calculations are shown in the list. E: early, M: middle, L: late.
Figure 3
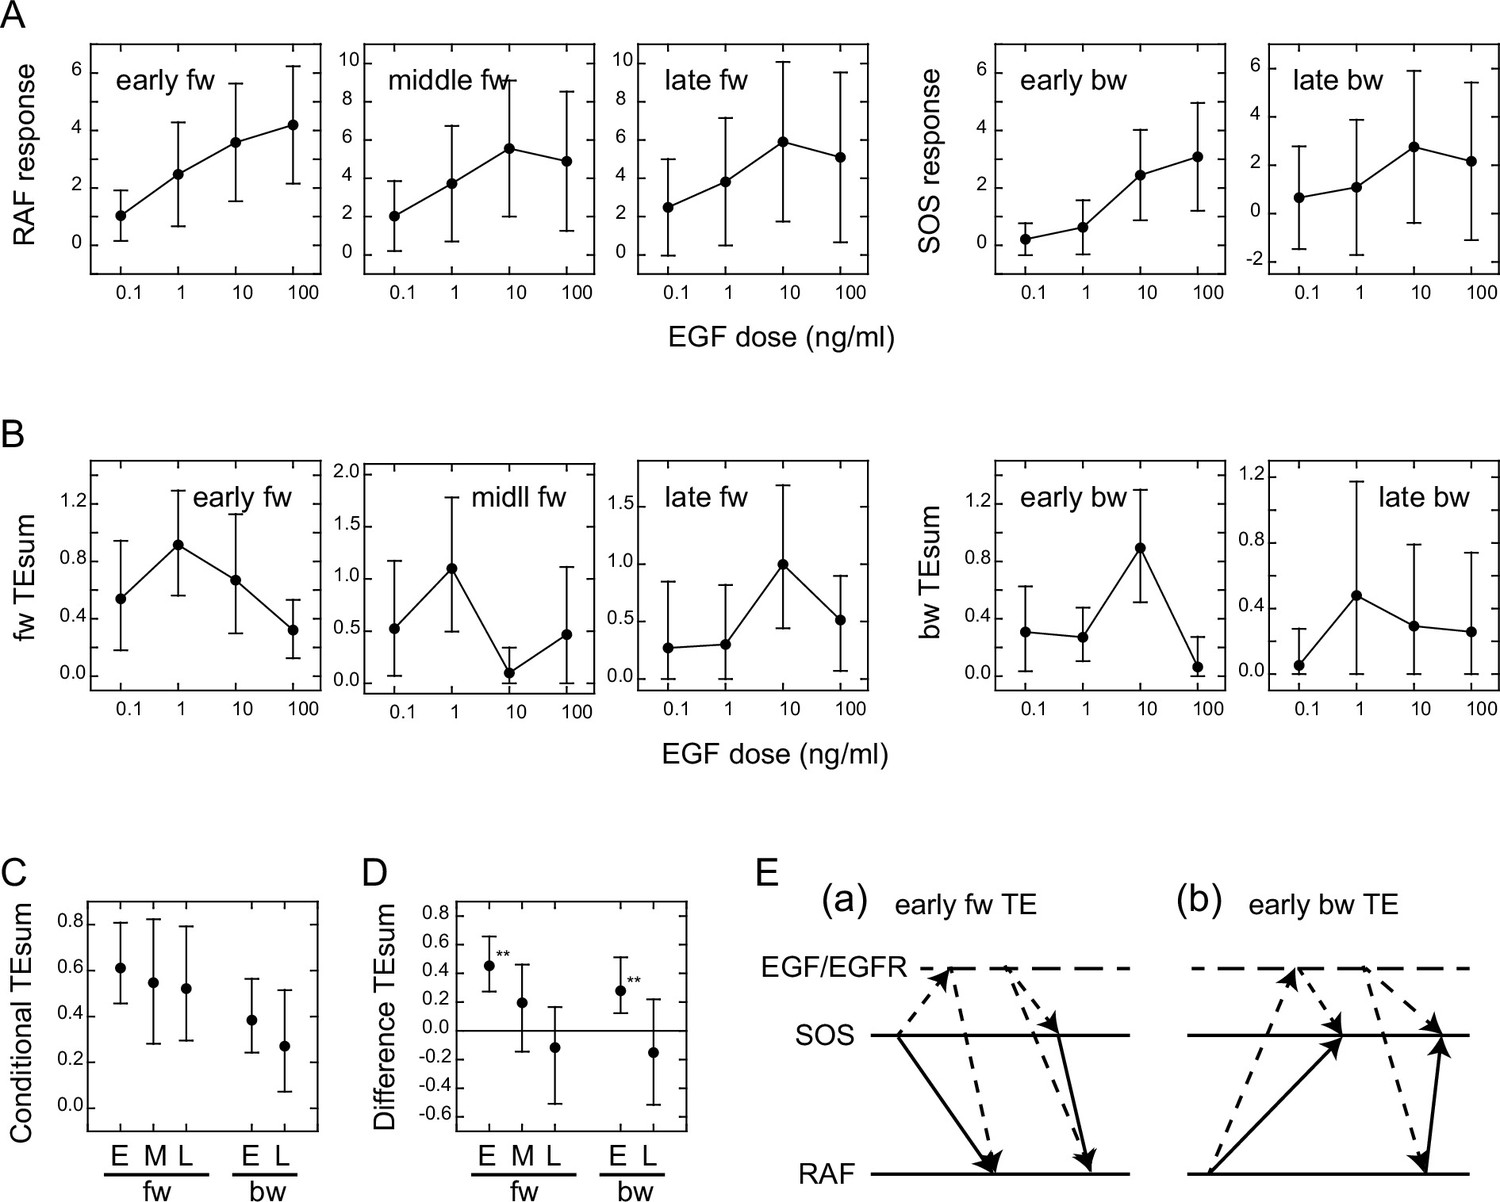
Conditional transfer entropy analysis to the EGF dose.
(A) EGF dose dependency of SOS and RAF responses at the TE peaks. Response time courses (Figure 1D) were integrated during the TE peak periods listed in Figure 2D. The averages for single cells were plotted with SD. (B) EGF dose dependency of TEsum for each TE peak. (C) TEsum conditioned to the EGF dose. (D) Difference between TEsums conditioned (C) and non-conditioned (Figure 2D) to the EGF dose. **bootstrapping p<0.05. (B–D) The averages obtained from 100-time bootstrapping are shown with the 5–95% interval. (E) Multiple TE tracks involving EGF/EGFR complex suggested form (D) (see text for details). Two possible cases are presented for both early fw-TE (a) and early bw-TE (b) peaks.
Figure 4
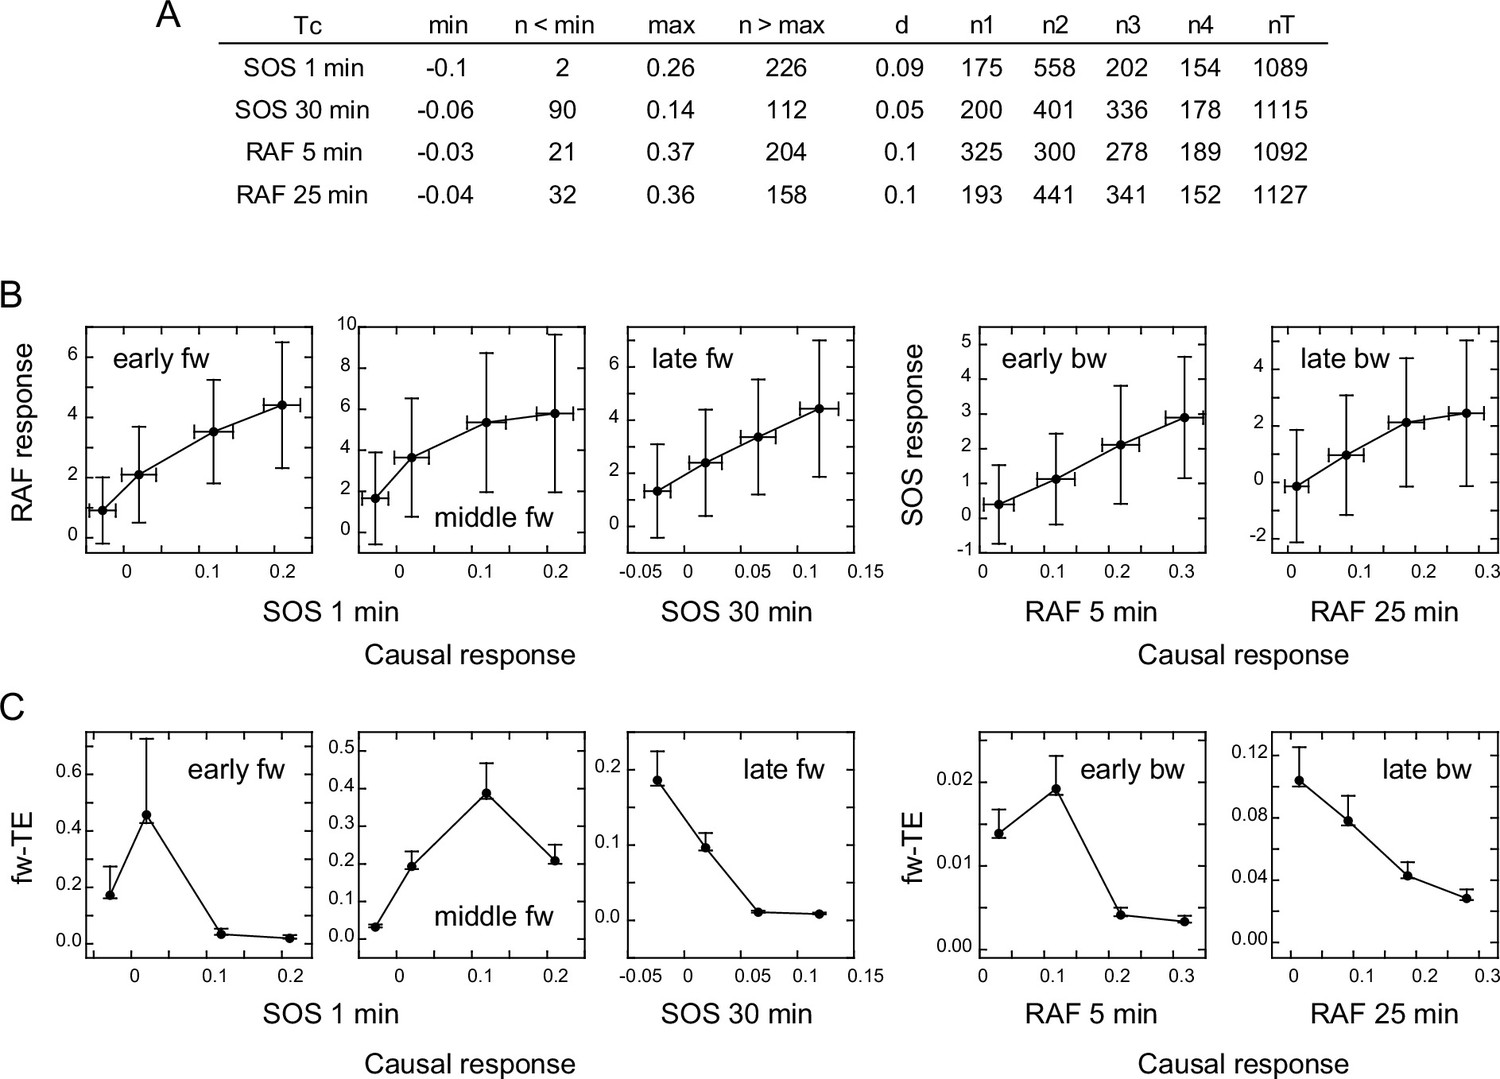
Response/transfer entropy relationships.
Four groups of single-cell response time courses were extracted from the total data sets (Figure 1D) according to the causal response intensity at Tc. (A) Parameter list for data extraction. Each group had fixed bin sizes with >150 data sets. Data in the low and high ends of distributions were not used. min, max: the minimum and maximum response intensities, respectively. n<min, n>max: the excluded data numbers in the low and high end for calculation, respectively. d: bin size. n1–n4: data numbers contained in each bin. nT: the total data number. (B) Relationships between the SOS and RAF responses. The response intensities during the period of TE peaks in the result sequence are plotted as a function of the causal response intensity at Tc. Cell-to-cell averages are plotted with SD. (C) Relationships between the causal response intensity and the corresponding TEsum. Averages from 100-time bootstrapping are plotted. Error bars show the estimated error range for the bootstrap average for n>150 (Appendix 1—figure 2).
Figure 5
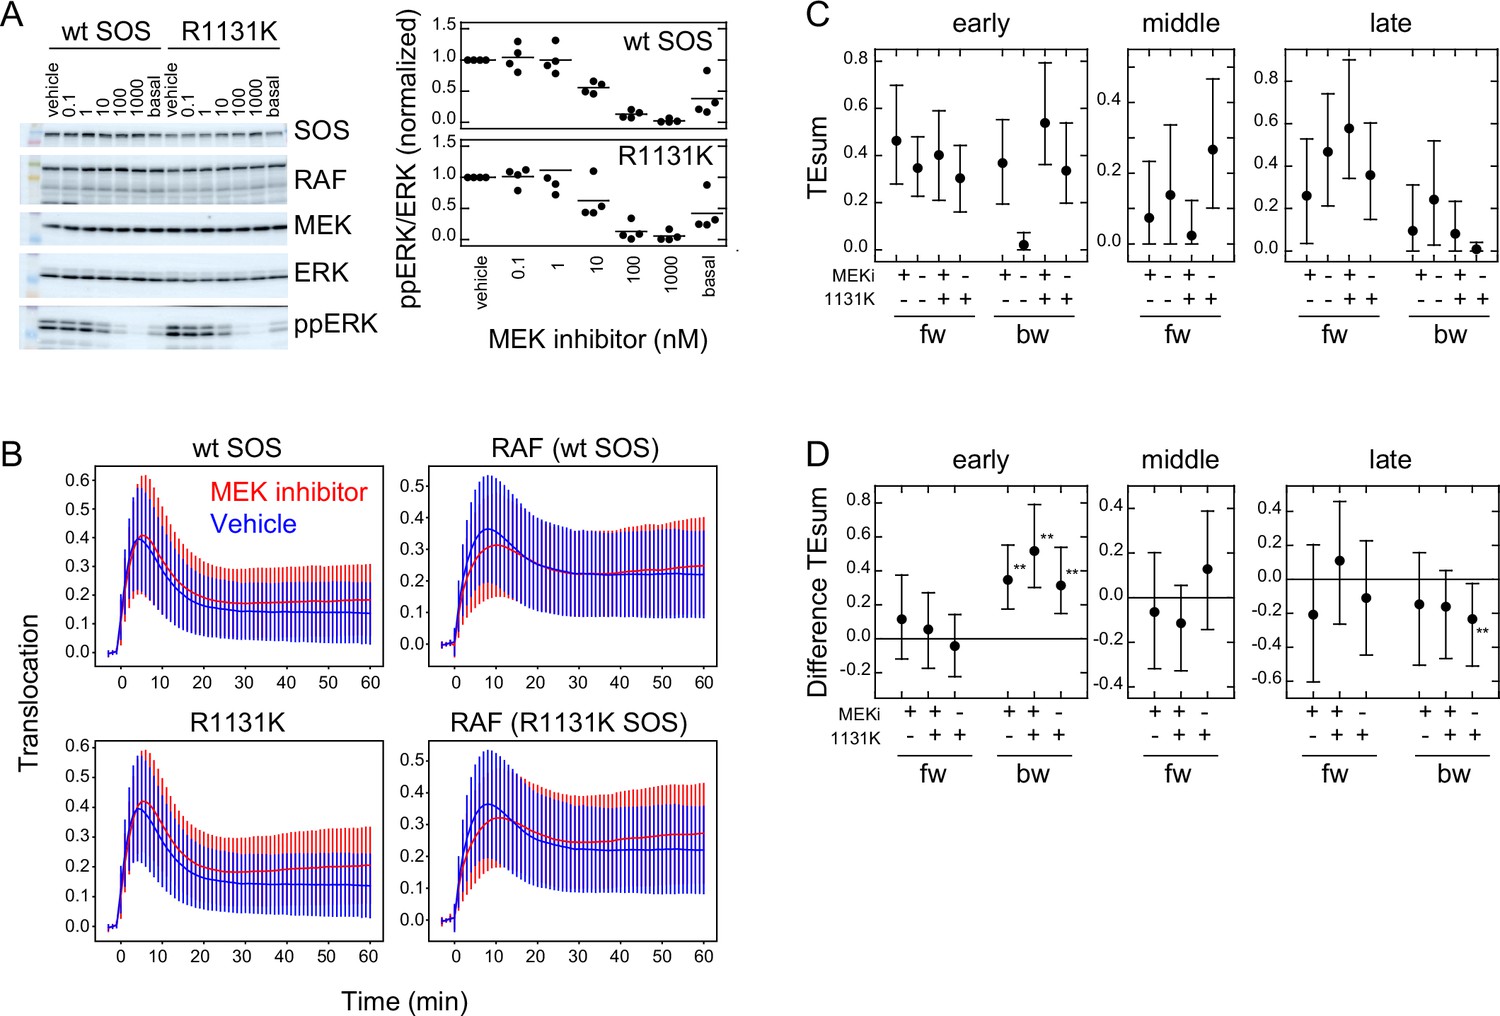
Effects of an MEK inhibitor and a Noonan SOS mutation.
(A) Inhibition of ERK phosphorylation in cells treated with an MEK inhibitor, trametinib. Typical results from western blotting (left) and the inhibitor dose dependency in four independent experiments (right) are shown. Bars indicate the averages. Molecular weight markers indicate 102 (green), 76 (orange), 52 (black), and 38 (blue) kd. (B) SOS and RAS responses in cells stimulated with 10 ng/ml EGF. Cells were expressing wt (upper) or R1131K mutant (lower) of SOS and pretreated with 10 nM MEK inhibitor (red) or vehicle solution (DMSO; blue). The numbers of cells were 704 (wt, MEK inhibitor), 744 (wt, vehicle), 832 (R1131K, MEK inhibitor), and 732 (R1131K, vehicle). Averages of cells are plotted with SD. See Appendix 1—figure 5 for the single-cell time courses. (C) TEsum for each peak in the indicated experimental condition. (D) Difference between TEsum values under indicated condition and control condition (wt cells with vehicle stimulation). Positive values indicate smaller TEsums in the control condition. **bootstrapping p<0.05. (C, D) Averages from 100-time bootstrapping are shown with the 5–95% interval.
-
Figure 5—source data 1
Source data for Figure 5A.
- https://cdn.elifesciences.org/articles/104432/elife-104432-fig5-data1-v1.zip
-
Figure 5—source data 2
Source data for Figure 5A.
- https://cdn.elifesciences.org/articles/104432/elife-104432-fig5-data2-v1.zip
Figure 6
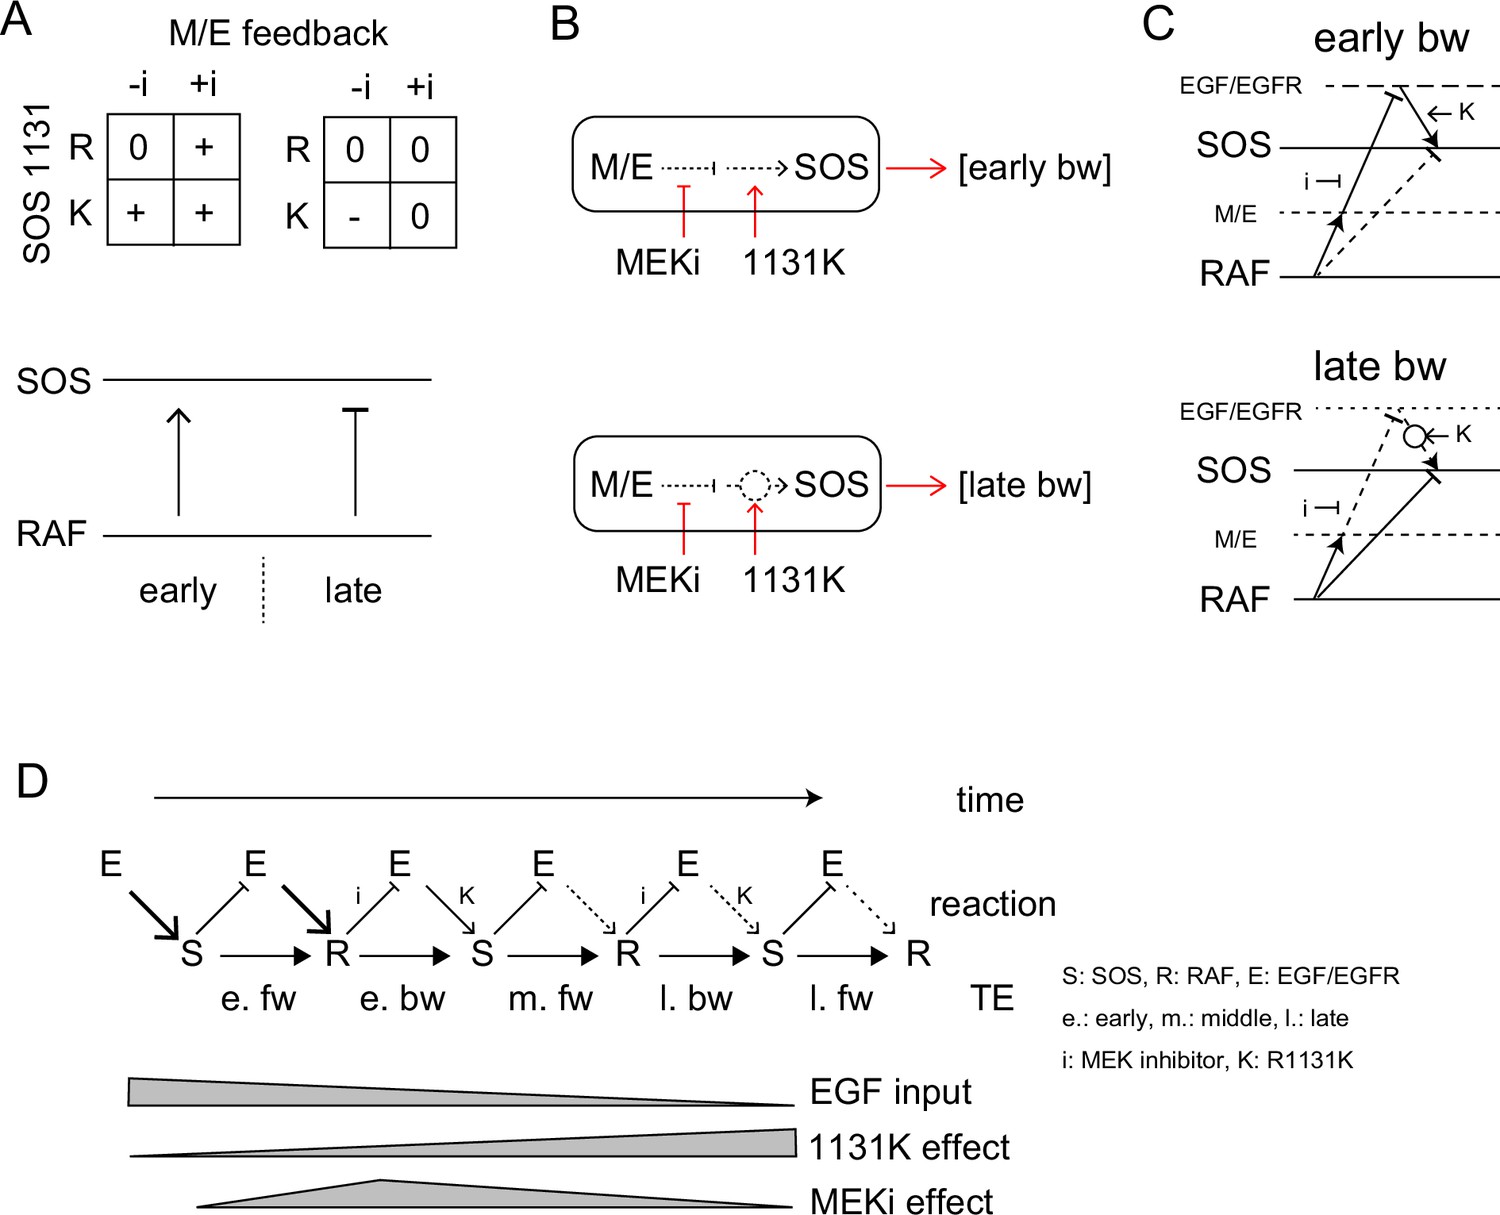
TE Regulation by the feedback loop and SOS function.
(A) 2D matrices showing the effects of the MEK inhibitor and R1131K mutation to the early (left) and late (right) bw-TE. The absence (-i) and presence (+i) of the MEK inhibitor, and the difference in the amino acid residue at SOS 1131 (R or K) caused an increase (+), maintenance (0), or decrease (-) in the TE amount compared to the control condition (-i, R). These 2D regulations increased or decreased bw-TE, respectively. (B) Simple reaction networks to realize NAND and inversed ANDN gates. The black solid, black dotted, and red arrows indicate TE, reaction, and regulation, respectively. M/E: MEK and ERK. (C) Possible reaction networks carrying the bw-TE in the early (upper) and the late (lower) peaks. EGF/EGFR and M/E are the hidden states. These networks are consistent with one of the networks carrying bw-TE suggested in Figure 3E. See text for details. (D) TE exchange between SOS and RAF involving the EGF/EGFR complex. The role of EGF/EGFR decreases with time after the cell stimulation. The action points of the MEK inhibitor and the R1131K SOS mutation were indicated. See text for details.
Appendix 1—figure 1
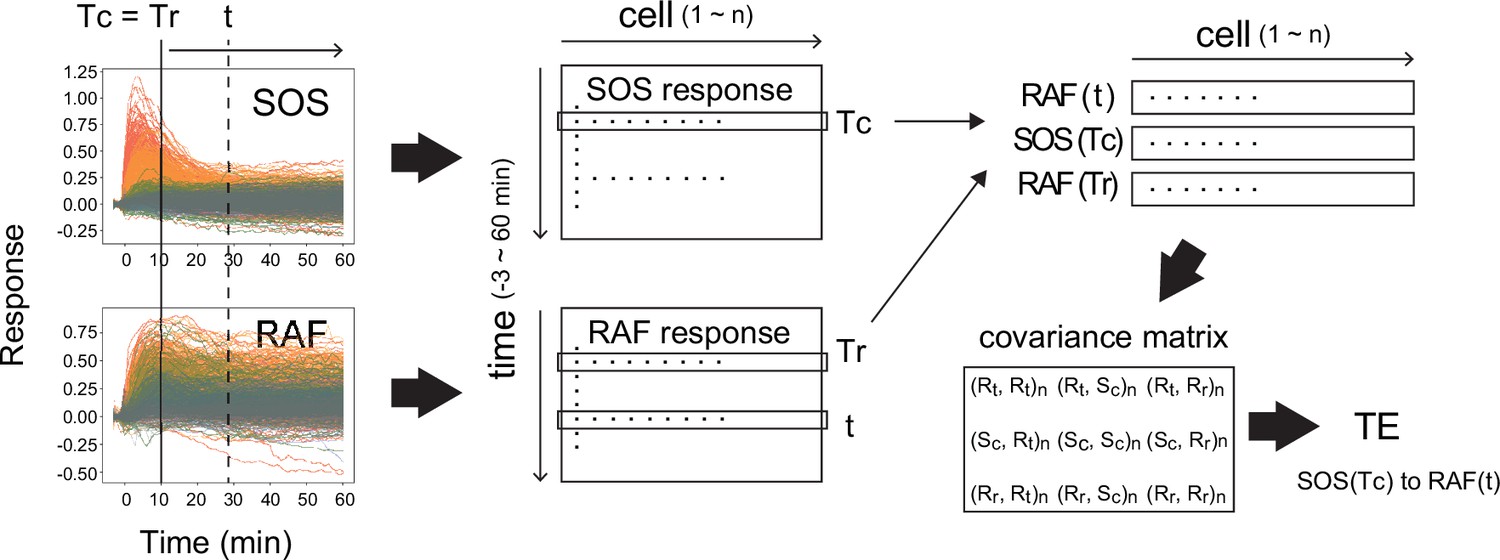
Calculation of transfer entropy.
The procedure for the calculation of TE from SOS(Tc) to RAF(t) with reference to RAF(Tr) is shown. (Here, Tr = Tc.) From the single-cell dynamics of SOS and RAF translocations (left), the single-cell response distributions SOS(Tc), RAF(Tr), and RAF(t) were extracted (middle to upper right; cell number = n). Then, the covariance matrix between the extracted distributions (bottom right) was calucted, from which the TE was calculated according to the formula shown in the ‘Materials and methods’ section. R: RAF, S: SOS, c: TC, r: Tr. (Xi, Yj): covariance beween X(i) and Y(j). (Xi, Xi) is the variance of X(i).
Appendix 1—figure 2
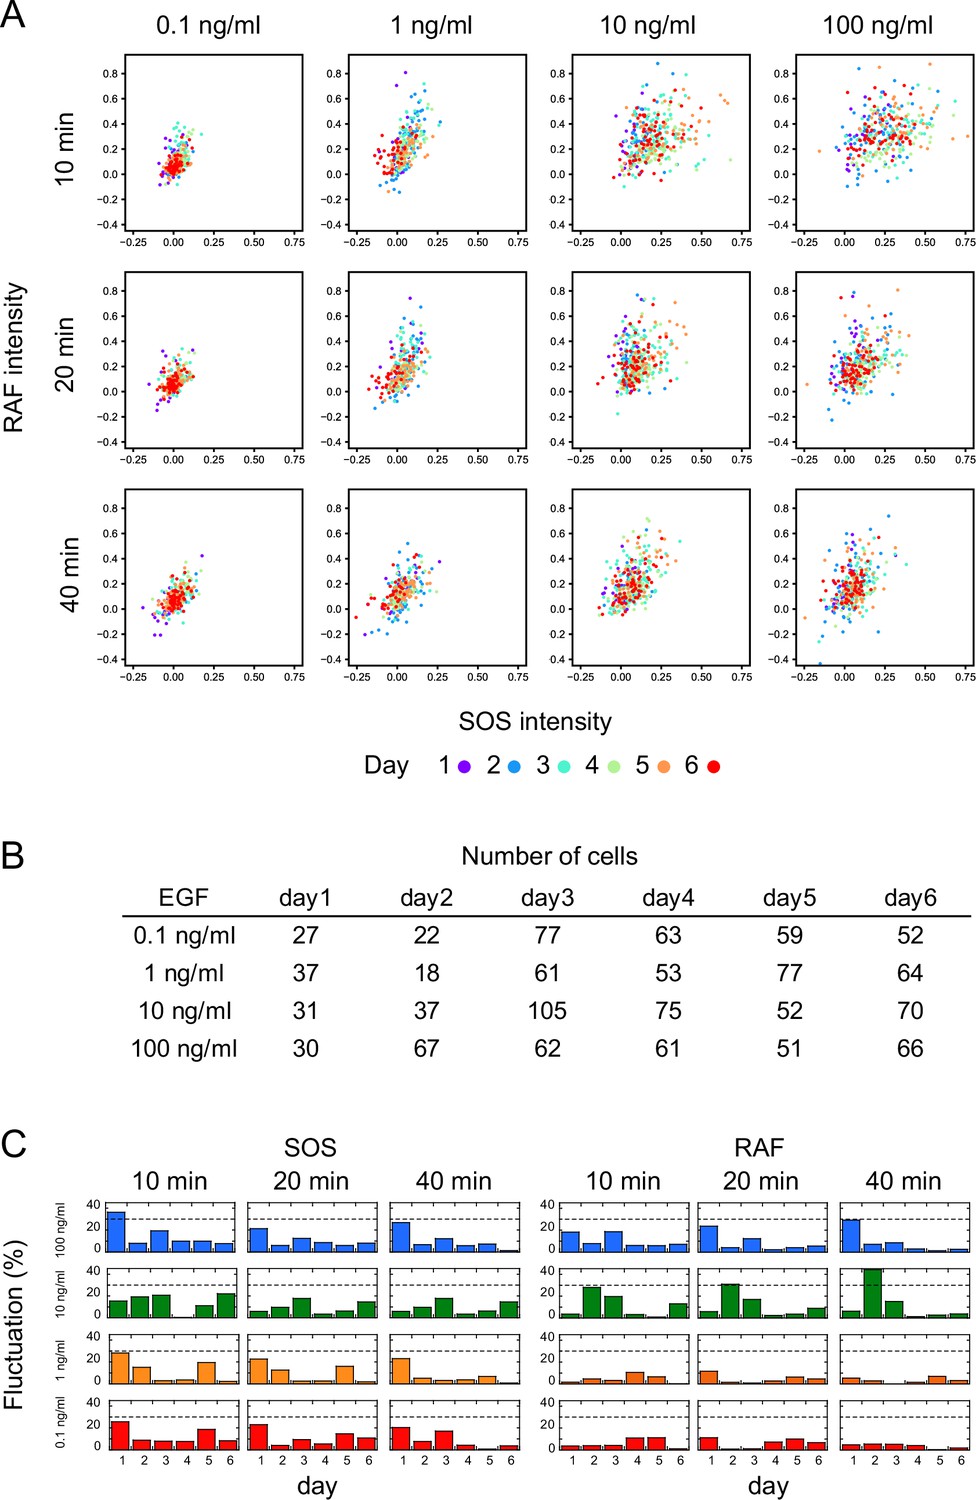
Measurement reproducibility.
(A) Single-cell response intensities of SOS and RAF at three different time points after EGF stimulation, with EGF dose indicated. Different colors represent measurements obtained on different days. Responses on each day overlap with a small bias. (B) Numbers of cells shown in A. (C) Inter-day variation in response mean. Variation was defined as the absolute value of the difference between the daily mean and the overall mean divided by the 5–95% range of the total single-cell response. The dashed line indicates a 30% variation.
Appendix 1—figure 3
Reactions and TEs under vehicle stimulation.
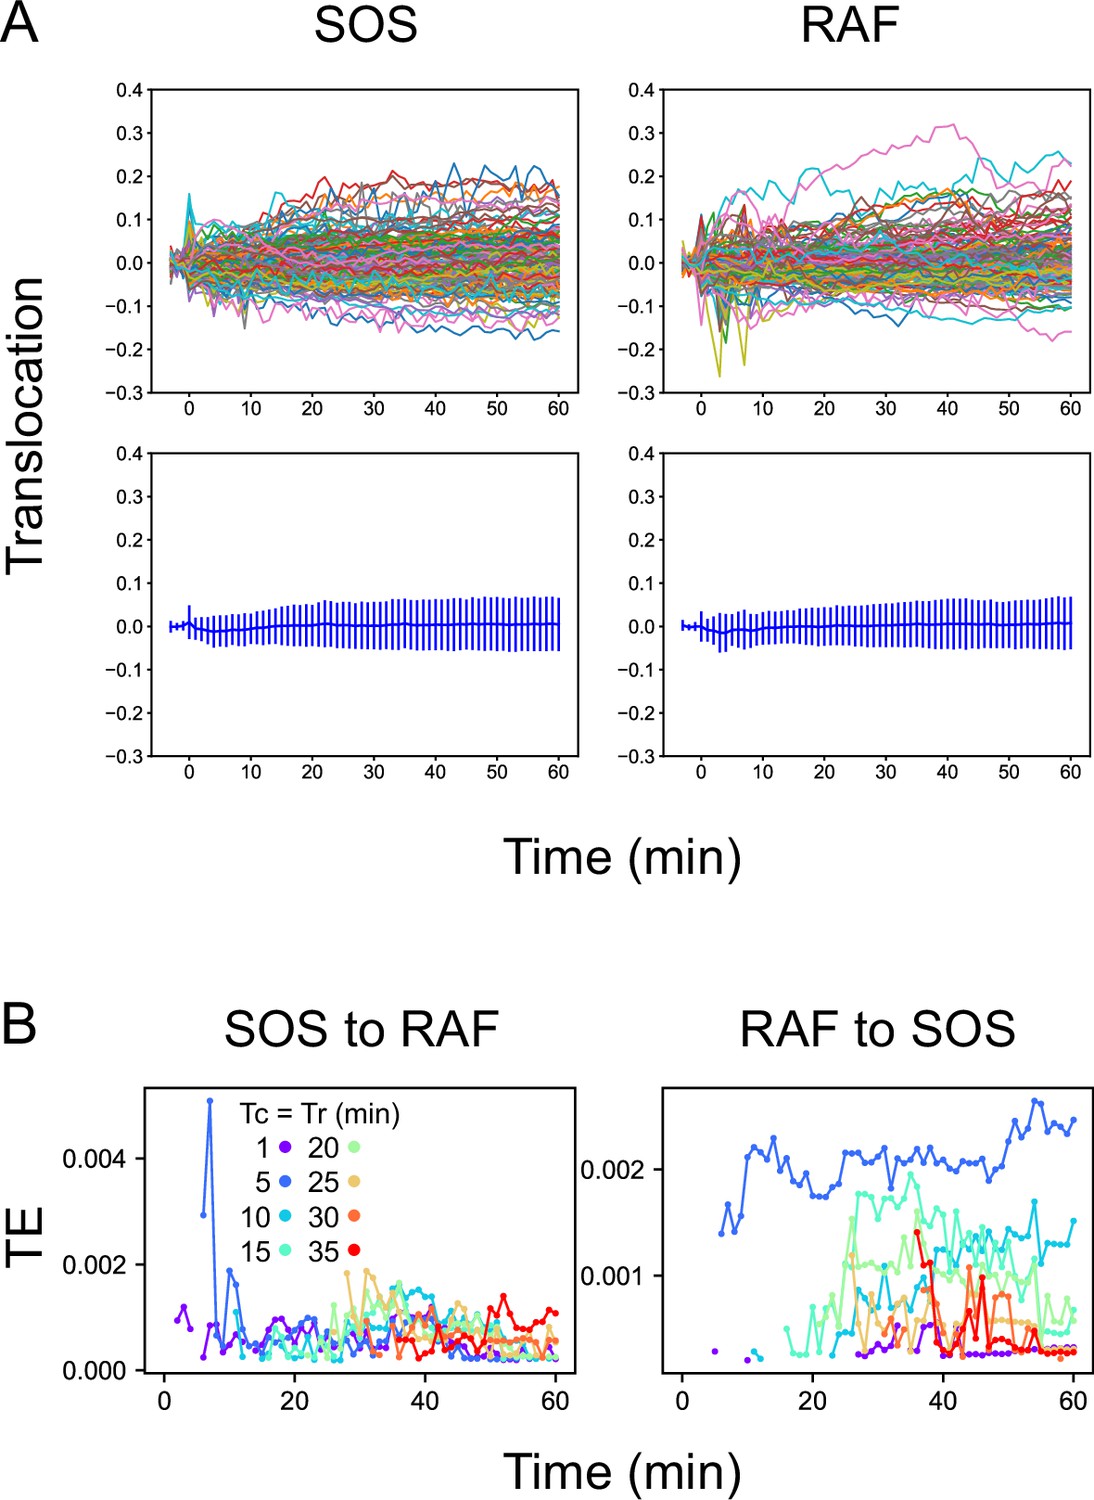
(A) Time courses of SOS and RAF responses after vehicle stimulation. These are the same plots shown as the black lines in Figure 1C. The upper panels show single-cell trajectories (n=150). The bottom panels show the mean with SD. No significant responses were observed. (B) Time courses of TE as the average of 100 times bootstrapping. The TE values are one order of magnitude lower than those observed after EGF stimulation (Figure 2). These values could be noise caused by the positive bias of TE or true information transfer between basal responses in quiescent cells. Since there were no obvious temporal structures, it is less likely that the TEs were caused by the effect of the addition of vehicle solution.
Appendix 1—figure 4

3D response intensity distributions.
Single-cell intensity distributions at the representative Tc, Tr, and t in TE time courses are shown as the 2D-projections. Colors indicate the densities of single-cell data points in a normalized unit.
Appendix 1—figure 5
Mutual information.
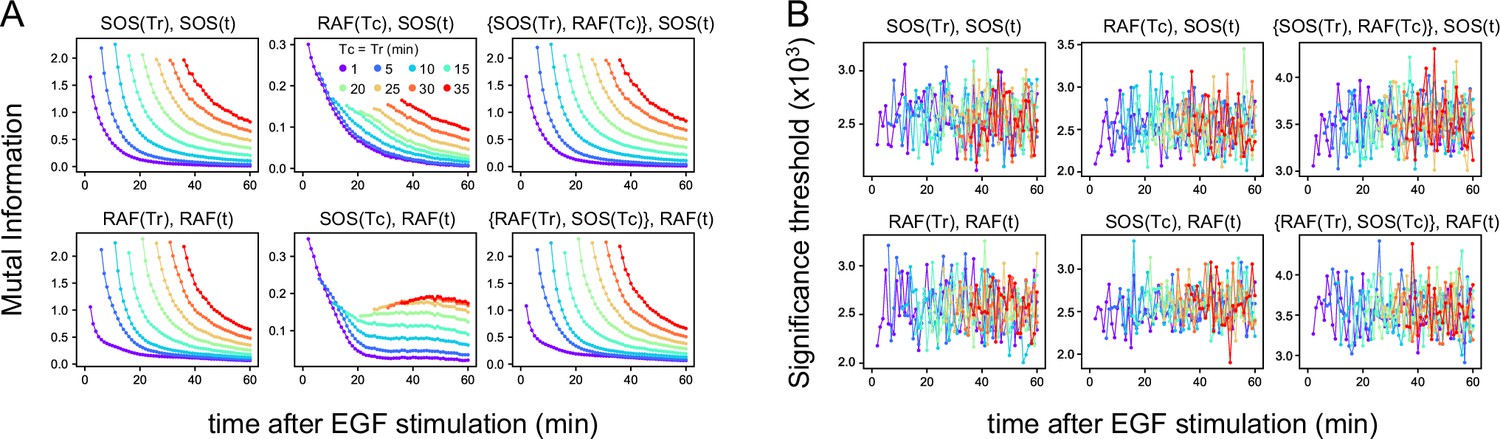
(A) Time courses of the mutual information between the reaction intensities were calculated using the total 1317 data sets (Figure 1D). The mutual information (MI) contents, the values of the two terms of TE (Figure 2A) at the times Tc, Tr, and t used for TE calculation (Figure 2B) are shown. Values higher than the upper 1% values in the 1000 times bootstrapping calculation under the null hypothesis were plotted. (In this criterion, all values were statistically significant in these calculations.) (B) The significance threshold for the calculation in A, which is an indication of the error values in A. The thresholds for MI(X(Tr); X(t)) (~0.001) were significantly smaller than the values of TE(Y(Tc) to X(t)) (~0.01), supporting that the results of TE calculations were meaningful and sufficiently larger than the calculation errors in the subtractions between the two terms of TE.
Appendix 1—figure 6
Effects of the data number on transfer entropy detection.
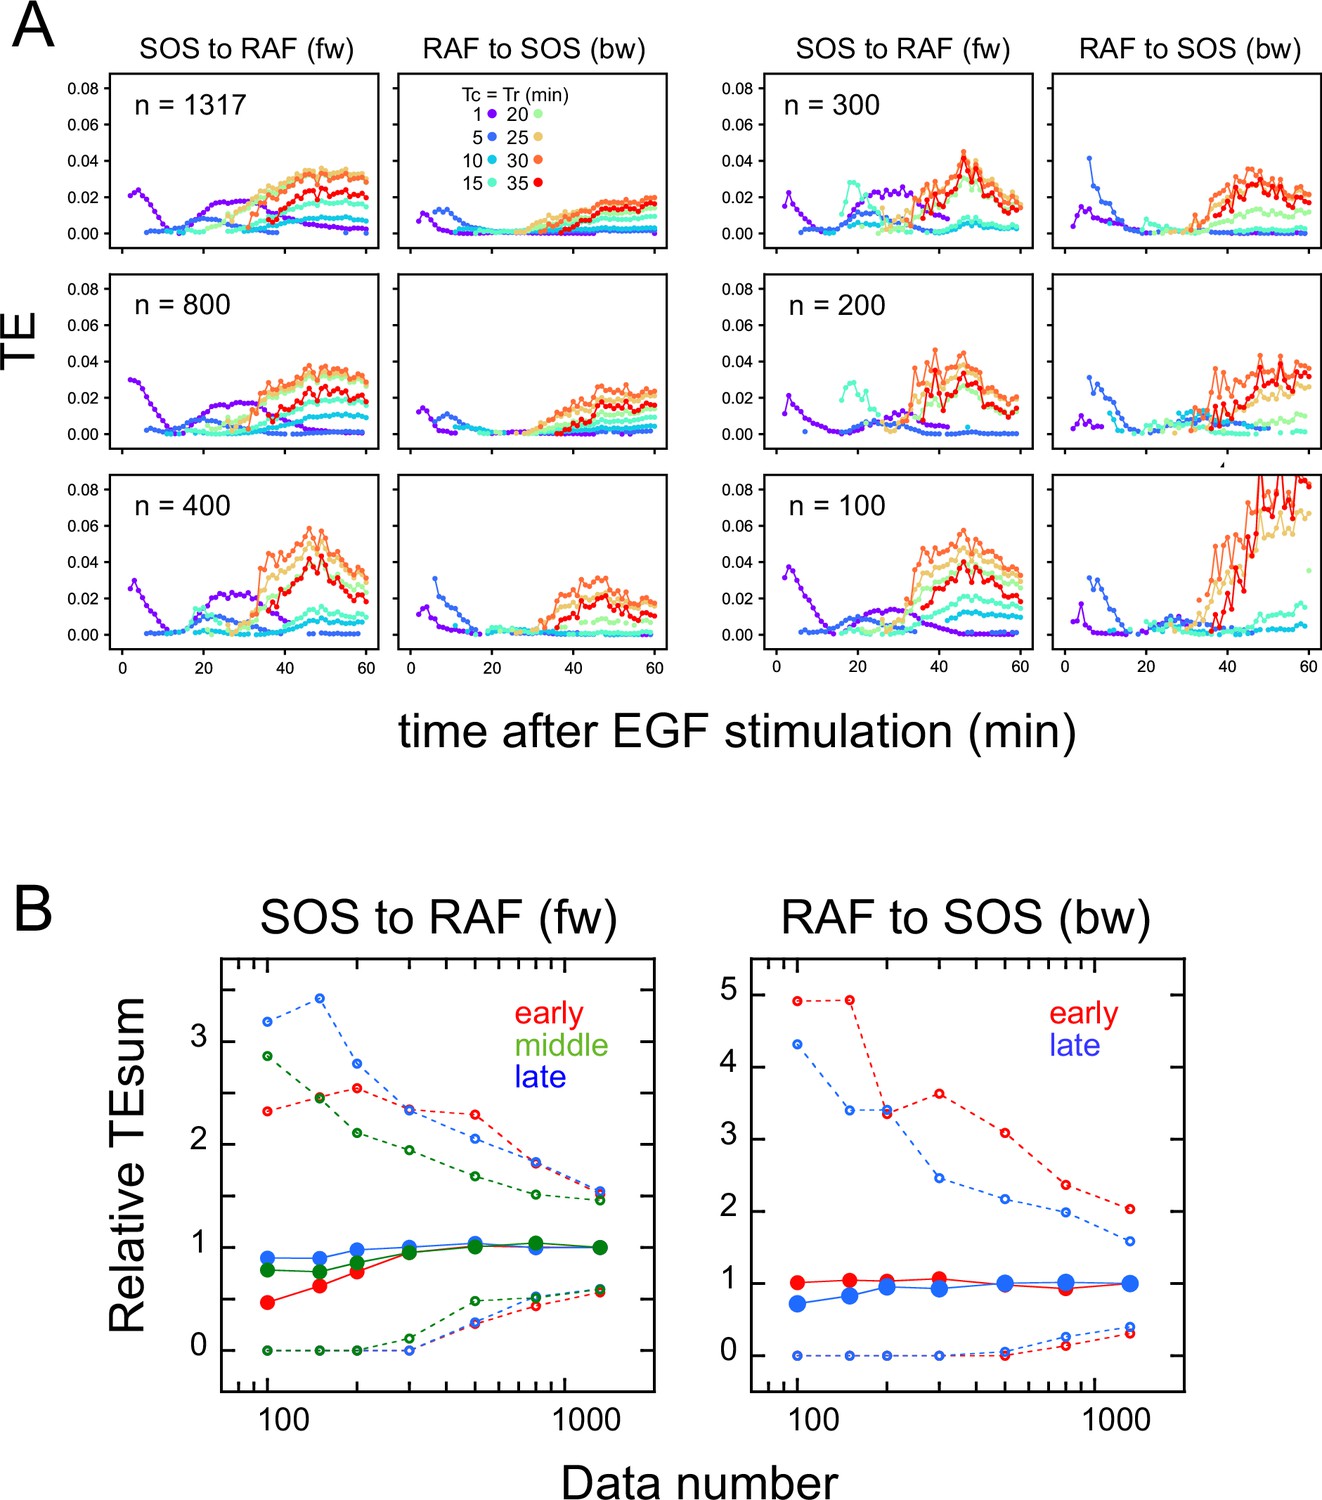
Since the TE takes only non-negative values and the TE time courses are noisy, we checked if the limited data number caused a false detection of significant TE, reducing the number of data sequences used for calculation. Here, 100–800 data sets were randomly selected from the total 1317 data sets (Figure 1D). (A) Examples of TE time courses calculated using different numbers of data sets (n). As the number of data sets decreases, the number of time points where a statistically significant level of TE was detected also decreases. (These plots only show the statistically significant values.) This result means that TE was not detected falsely due to the limited number of data. (B) TEsum values for 100 times of bootstrapping as a function of the data number. Values are normalized to those for 1317 data sets. The average (solid line) and 5 and 95% values (dotted lines) are shown. Even though the decrease in the data number caused the increase in the uncertainty (5–95% range), the averages were still within the 83–104% range of the TE for the total of 1317 data sets (excluding those for the early fw peak), when n≥150. For the early fw peak, the bootstrap averages were within the 63–107% range.
Appendix 1—figure 7
TE exchange between SOS and RAF.
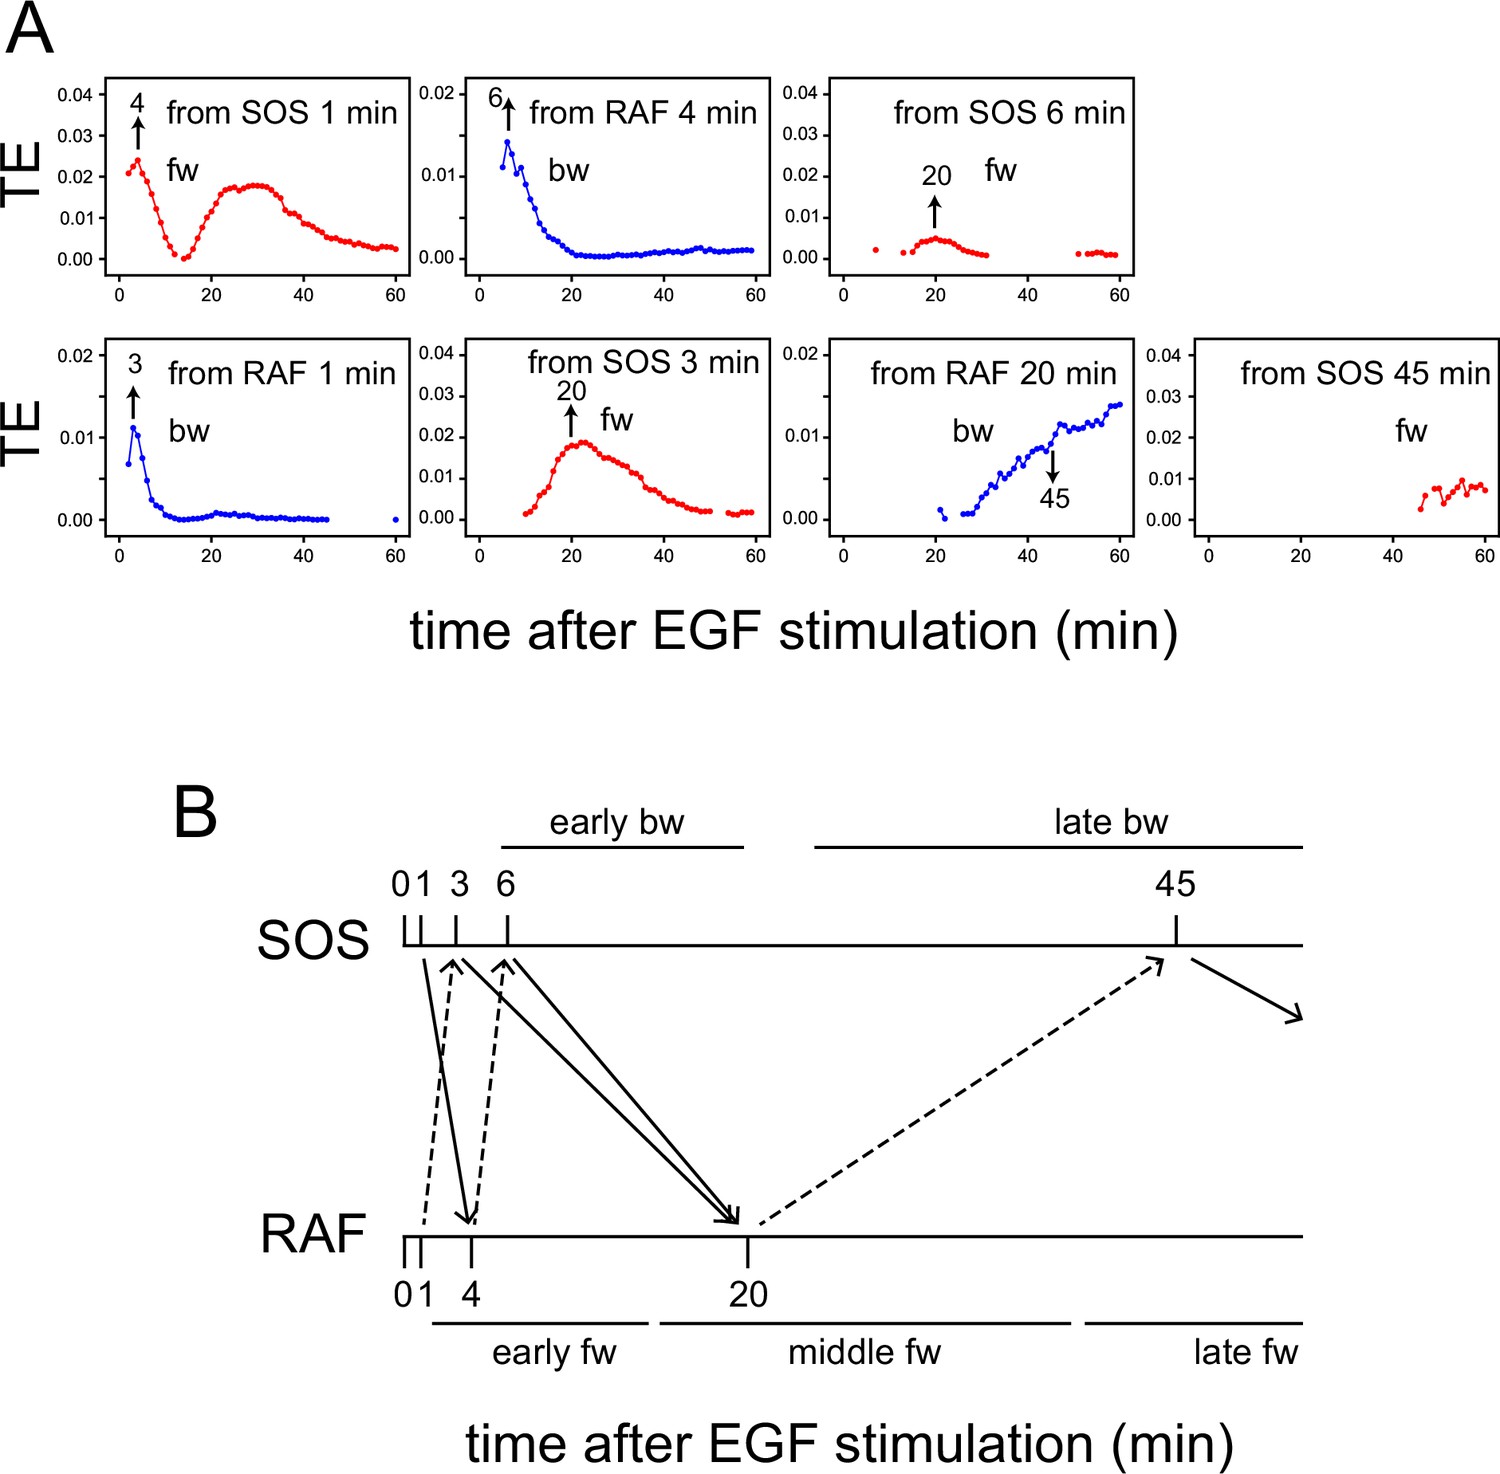
(A) Time courses of TE were calculated for the SOS and RAF response using the total 1317 reaction dynamics data obtained under 0.1–100 ng/ml EGF (Figure 1D). The calculation started from Tc = 1, and the time indicated by the arrows in the obtained TE time courses was used for Tc in the next round of calculation in the reverse direction. (B) Diagram of TE exchange between SOS and RAF. Periods of the typical TE peaks are indicated.
Appendix 1—figure 8
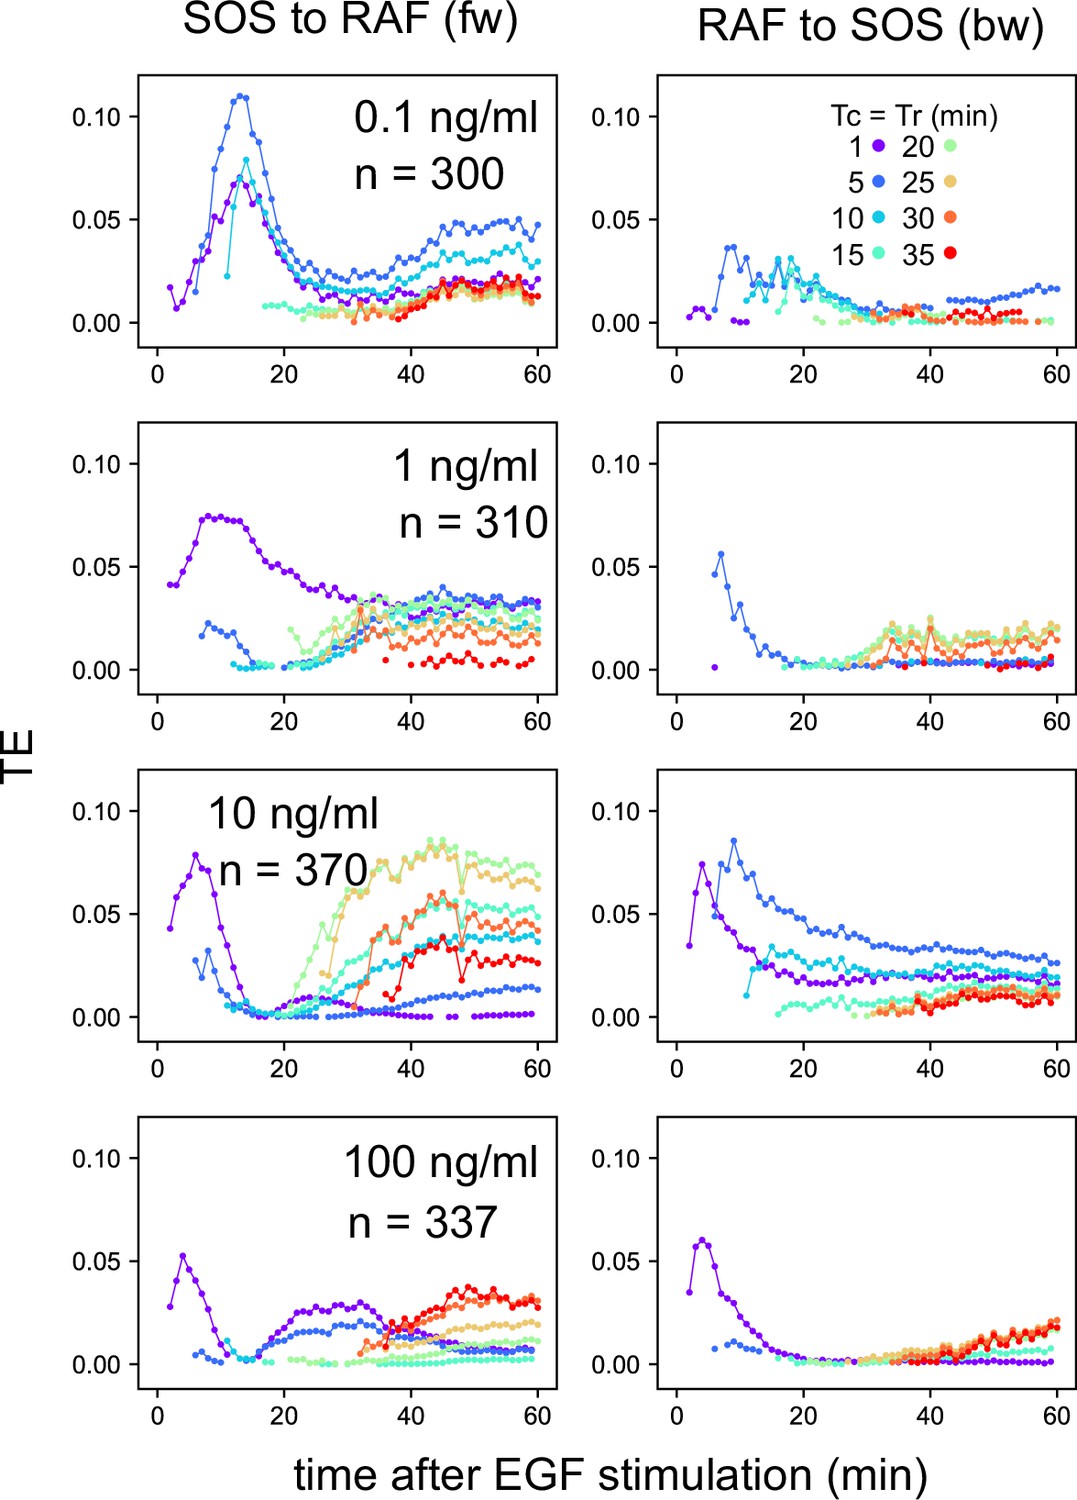
EGF dose dependency in the TE time courses.
TE time courses were calculated for the SOS and RAF response time series at the indicated concentrations of EGF. n: data number. The calculations were performed for the time interval Tc = Tr from 1–35 min after the cell stimulation. Only statistically significant TE values (as defined in the Materials and methods section) are plotted.
Appendix 1—figure 9
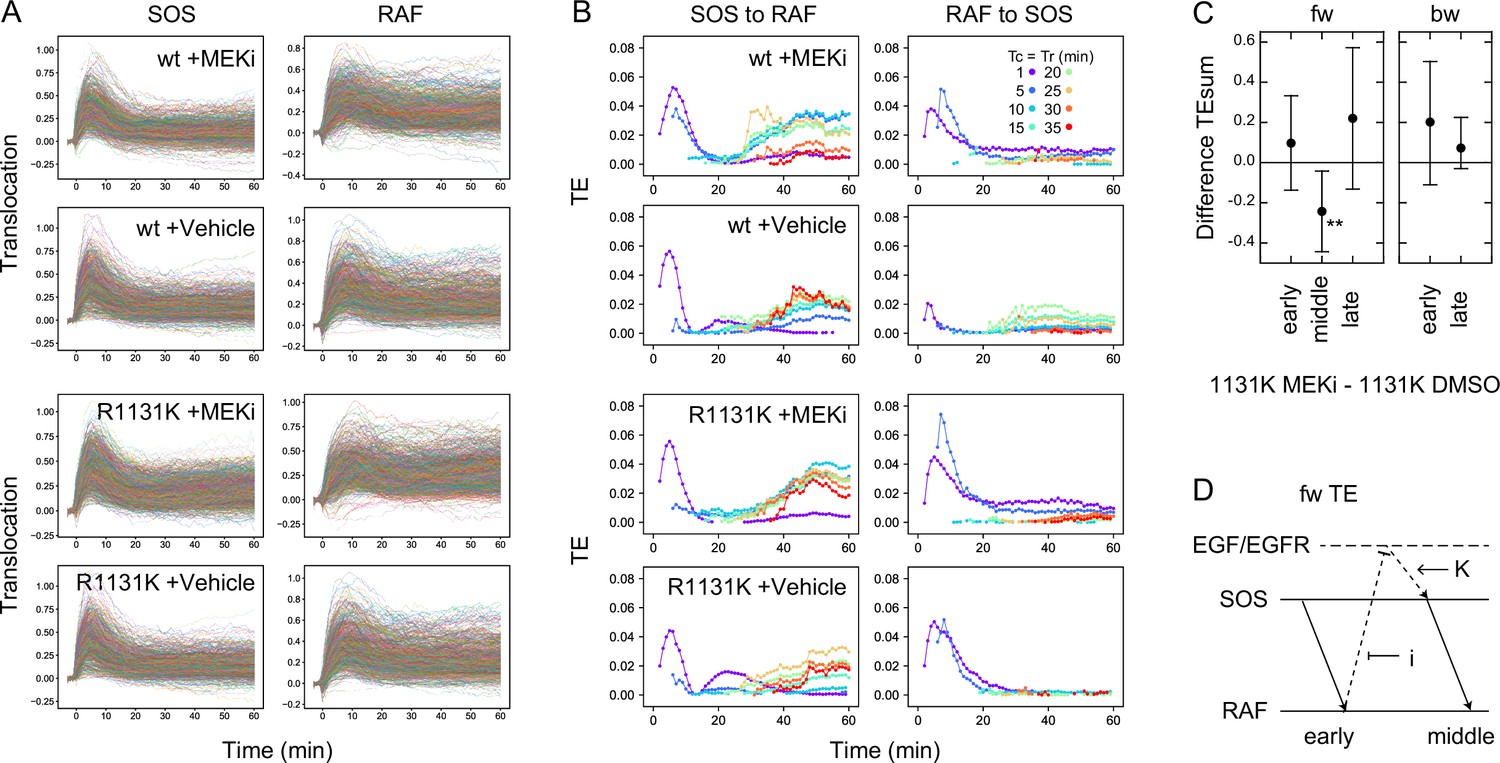
Effects of the MEK inhibitor in cells with a Noonan syndrome SOS.
(A) Single-cell time courses of SOS and RAF responses for Figure 5B. (B) TE time courses for the data shown in (A). Calculations were performed for the indicated Tc = Tr from 1 to 35 min after cell stimulation. Only statistically significant TE values are plotted. (See Materials and methods.) (C) Difference between TEsum values in the presence and absence of the MEK inhibitor in R1131K cells. Positive values mean larger TEsum in the presence of the MEK inhibitor. Averages for 100 times bootstrapping are shown with the 5–95% interval. **bootstrapping p<0.05. (D) A possible pathway carrying middle fw-TE through a feedback loop. Action points of the MEK inhibitor (i) and R1131K mutation (K) are indicated.
Appendix 1—figure 10
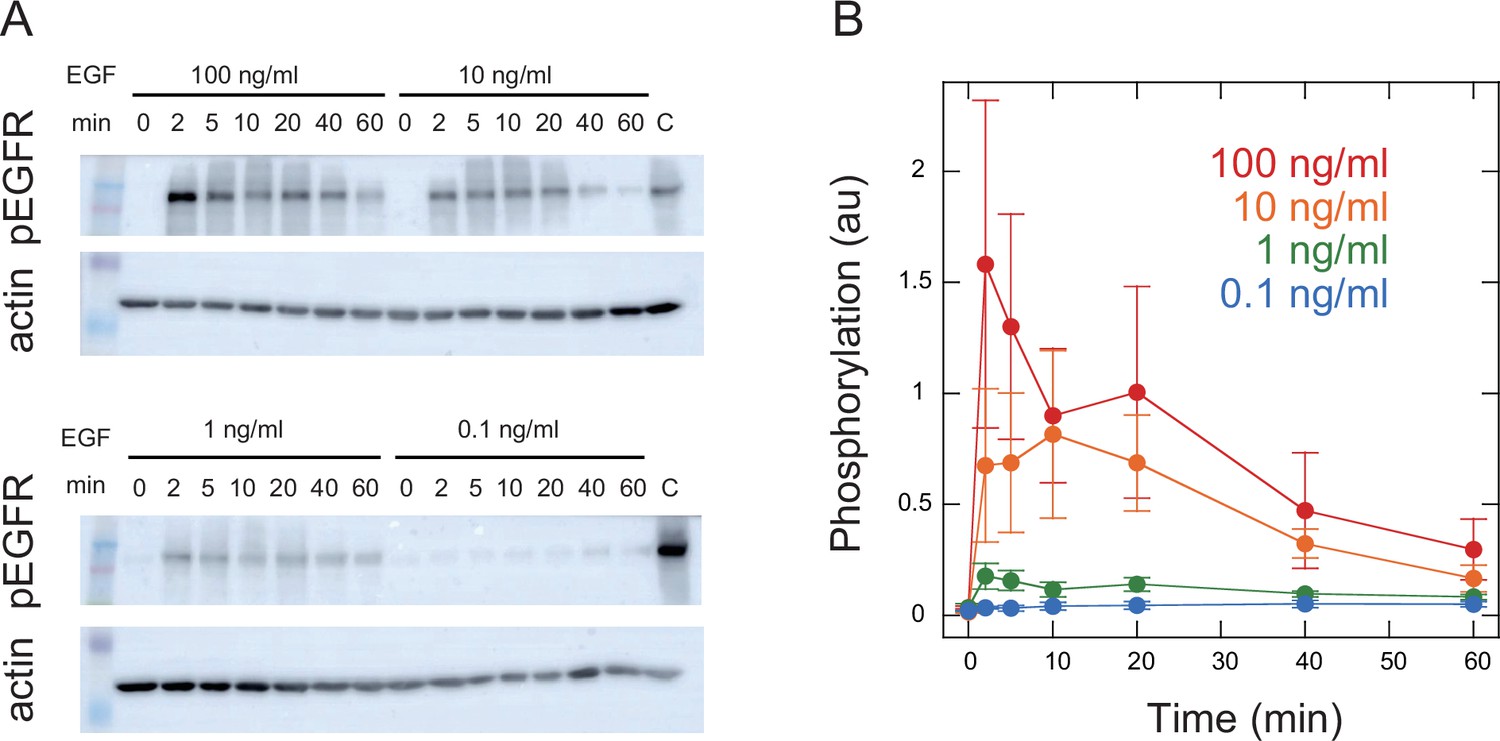
Time course of EGFR phosphorylation.
Phosphorylation levels of Y1068 in EGFR indicating EGFR activity were measured. Representative Western blotting results (A) and quantification of four independent experiments (B) are shown. Cells expressing wt SOS and GFP-RAF were prepared under the same conditions as for SOS and RAF translocation measurements and stimulated with EGF. EGF dose and time after EGF stimulation are shown. Staining intensities were normalized to those for actin in the same sample and further to those of the same control sample of pEGFR (indicated by C). Phosphorylation levels peaked at 2–10 min after the EGF stimulation and decreased thereafter as expected from SOS, RAF response, and TE analysis.
-
Appendix 1—figure 10—source data 1
Source data for Appendix 1—figure 10.
- https://cdn.elifesciences.org/articles/104432/elife-104432-app1-fig10-data1-v1.zip
-
Appendix 1—figure 10—source data 2
Source data for Appendix 1—figure 10.
- https://cdn.elifesciences.org/articles/104432/elife-104432-app1-fig10-data2-v1.zip
Appendix 1—figure 11
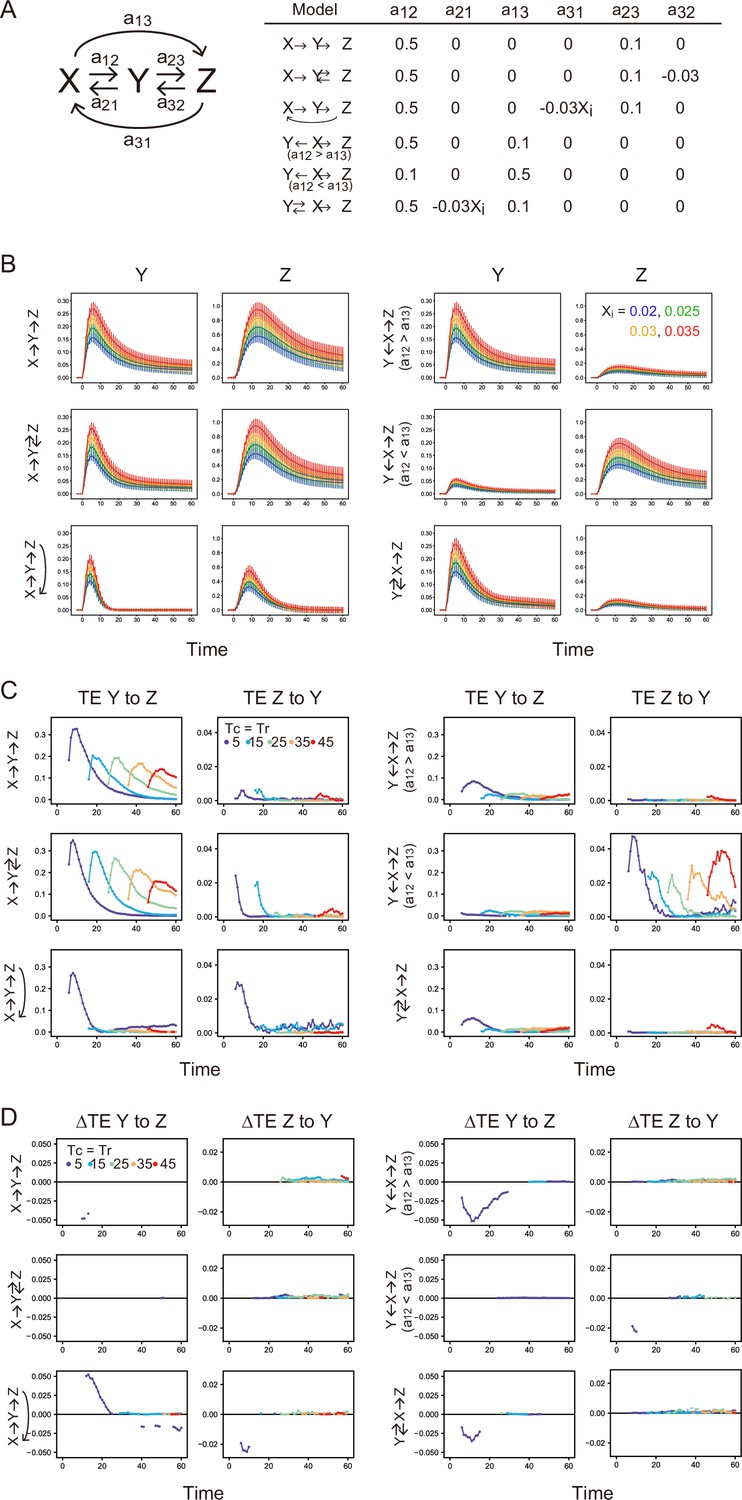
Stochastic simulation and TE calculation for simple reaction networks.
(A) Network structure and reaction parameters. Xi is the initial intensity of X0 and controls the amplitude of X (see Supplement text). (B) Response time courses of X and Y. Averages of 500 simulated trajectories are shown with SD for each Xi value. C. TE time courses for the mixed data under all Xi values. (D) Differences between conditional and non-conditional TE to Xi. (C, D) The averages of 100 times bootstrap runs are shown. Only statistically significant values are plotted.
Videos
Appendix 1—video 1
SOS and RAF in cells stimulated with EGF.
Appendix 1—video 2
SOS and RAF translocation to the basal cell membrane in cells stimulated with EGF.
Time-lapse movies with a 1-min interval for 63 min. These two movies were acquired in the same field of view under epi (Movie S1) or total internal reflection (Movie S2) illumination. The left and right movies show signals from Halo (TMR)-SOS and GFP-RAF, respectively. Just before the 4th frame, 100 ng/ml (final concentration) of EGF was added to the observation medium. The field of view is 222 x 222 μm2.
Additional files
-
MDAR checklist
- https://cdn.elifesciences.org/articles/104432/elife-104432-mdarchecklist1-v1.pdf
-
Appendix 1—figure 10—source data 1
Source data for Appendix 1—figure 10.
- https://cdn.elifesciences.org/articles/104432/elife-104432-app1-fig10-data1-v1.zip
-
Appendix 1—figure 10—source data 2
Source data for Appendix 1—figure 10.
- https://cdn.elifesciences.org/articles/104432/elife-104432-app1-fig10-data2-v1.zip
Download links
A two-part list of links to download the article, or parts of the article, in various formats.
Downloads (link to download the article as PDF)
Open citations (links to open the citations from this article in various online reference manager services)
Cite this article (links to download the citations from this article in formats compatible with various reference manager tools)
Evaluation of information flows in the RAS-MAPK system using transfer entropy measurements
eLife 14:e104432.
https://doi.org/10.7554/eLife.104432


