Cognitive control of behavior and hippocampal information processing without medial prefrontal cortex
- Center for Neural Science, New York University, United States
- Psychiatry, Columbia University Irving Medical Center, New York State Psychiatric Institute, United States
- Tandon School of Engineering, New York University, United States
- Neuroscience Institute at the New York University Langone Medical Center, United States
Figures
Figure 1 with 2 supplements
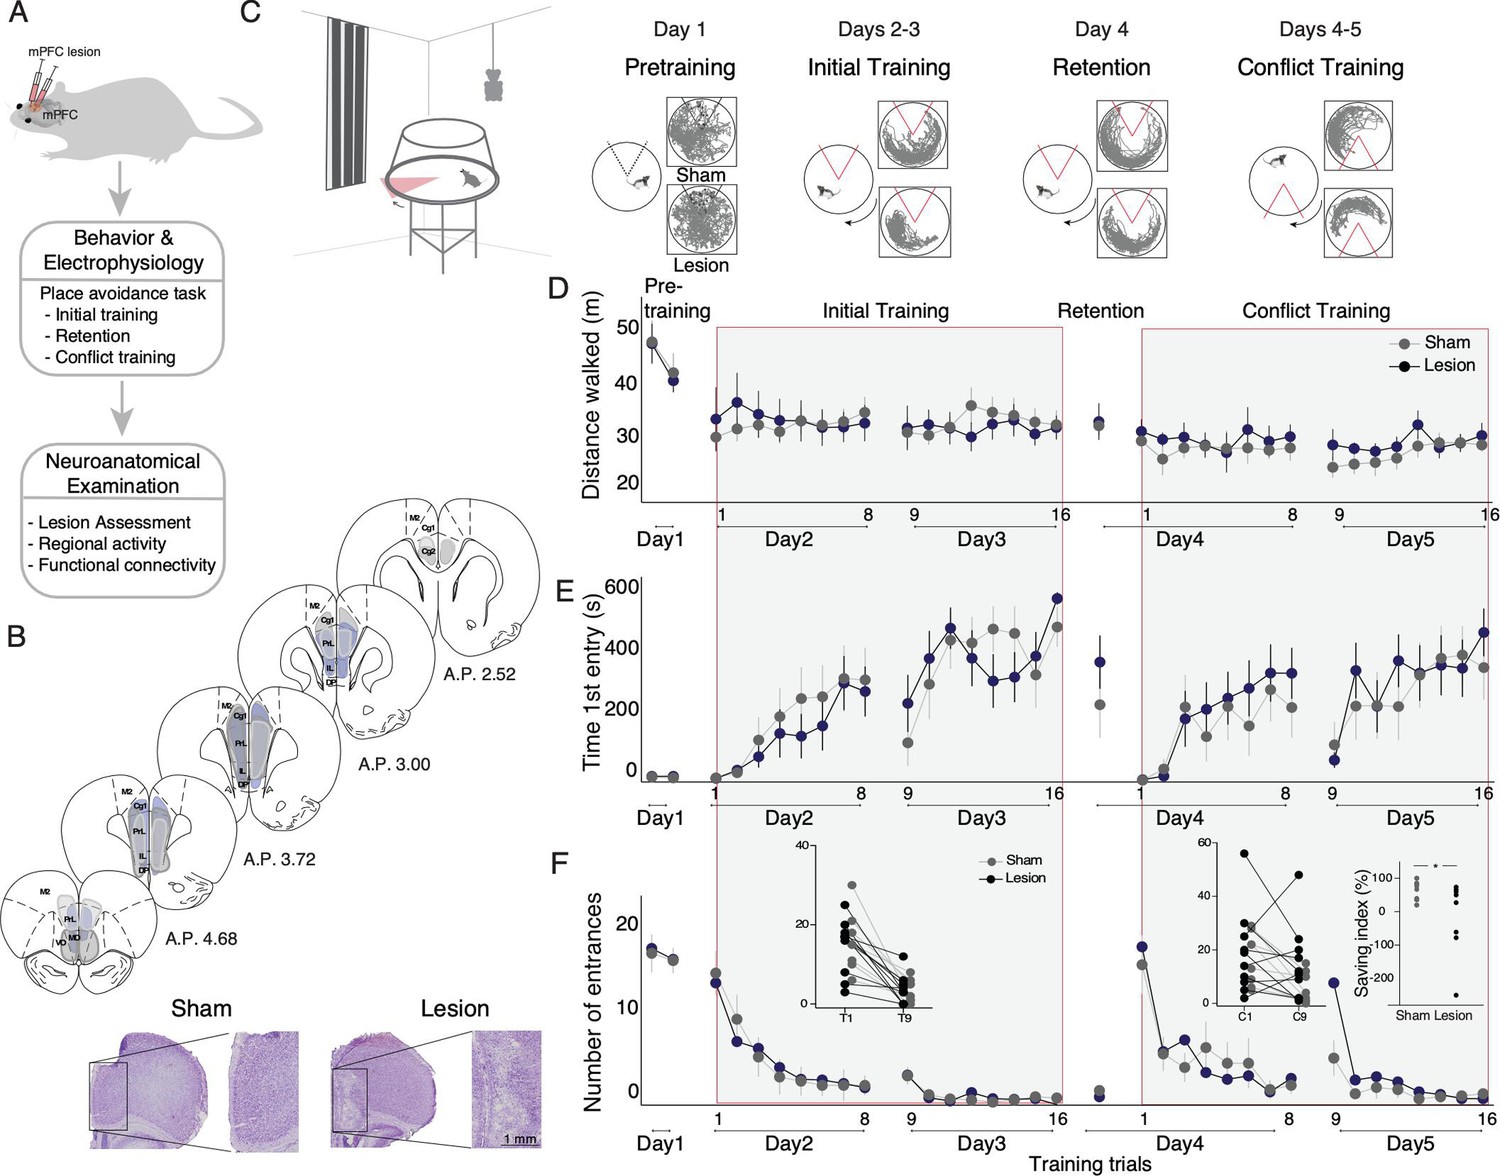
Medial prefrontal cortex (mPFC) lesion does not impair initial active place avoidance learning, but impairs cognitive flexibility in the conflict task variant.
(A) Workflow to assess the impact of mPFC or sham lesions on spatial cognitive control. (B) Assessment and impact of the mPFC lesion in three representative subjects (light gray [intermediate with dorsal anterior lesion], dark gray [intermediate with ventral anterior lesion – includes medial orbital cortex], and purple [largest lesion]). The smallest lesion spanned A-P 3.24–2.52. PrL (prelimbic), IL (infralimbic), Cg (cingulate cortex), M2 (secondary motor cortex). Representative mPFC from a sham and a lesion rat (bottom). (C) Tracked room-frame positions from two example rats across active place avoidance training. The shock zone is indicated as a 60° sector, gray (shock off) and red (shock on), and arena rotation by the curved arrow. Day 1– pretraining: free exploration with shock off; days 2 and 3 – initial training: eight daily trials to avoid the shock zone. Day 4 – retention: one trial with shock on. Days 4 and 5 – conflict training: eight daily trials to avoid the shock zone relocated 180° from the initial location. Sham and mPFC lesion rats did not differ in (D) locomotor activity, (E) avoidance memory, or (F) place learning. (F) The left inset compares the number of entrances during the first 5 min of the first (D2T1) and second days of initial training (D3T9). The right inset compares the first 5 min of the first (D4C1) and second (D5C9) days of conflict trials. The percent difference in number of entrances between D5C9 and D4C1 of conflict training was computed as a savings index. Savings was not related to lesion size r=0.009, p=0.98. *p<0.05. Sham: n=8; lesion: n=10.
Figure 1—figure supplement 1
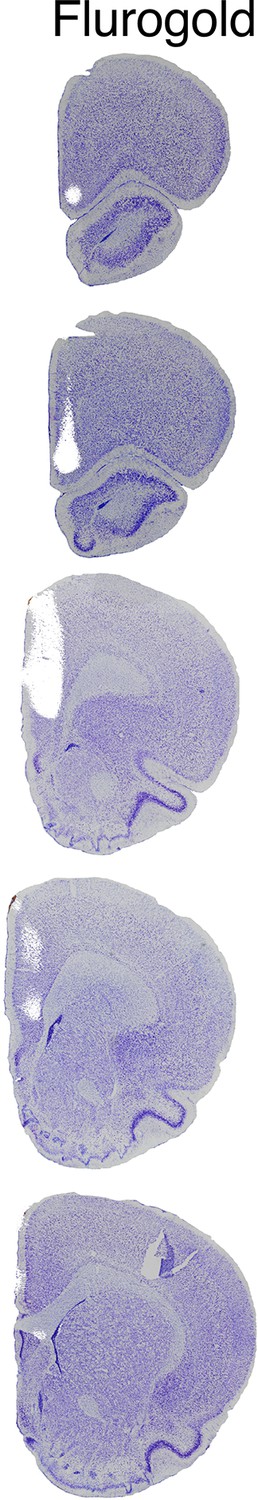
Targeting the medial prefrontal cortex (mPFC) injections.
To determine the appropriate coordinates for injection of ibotenic acid, we first injected fluorogold and immediately examined the extent of fluorescent labeling, followed by Nissl counterstaining. Fluorogold labeling was confirmed in the cingulate, prelimbic, and infralimbic cortices.
Figure 1—figure supplement 2
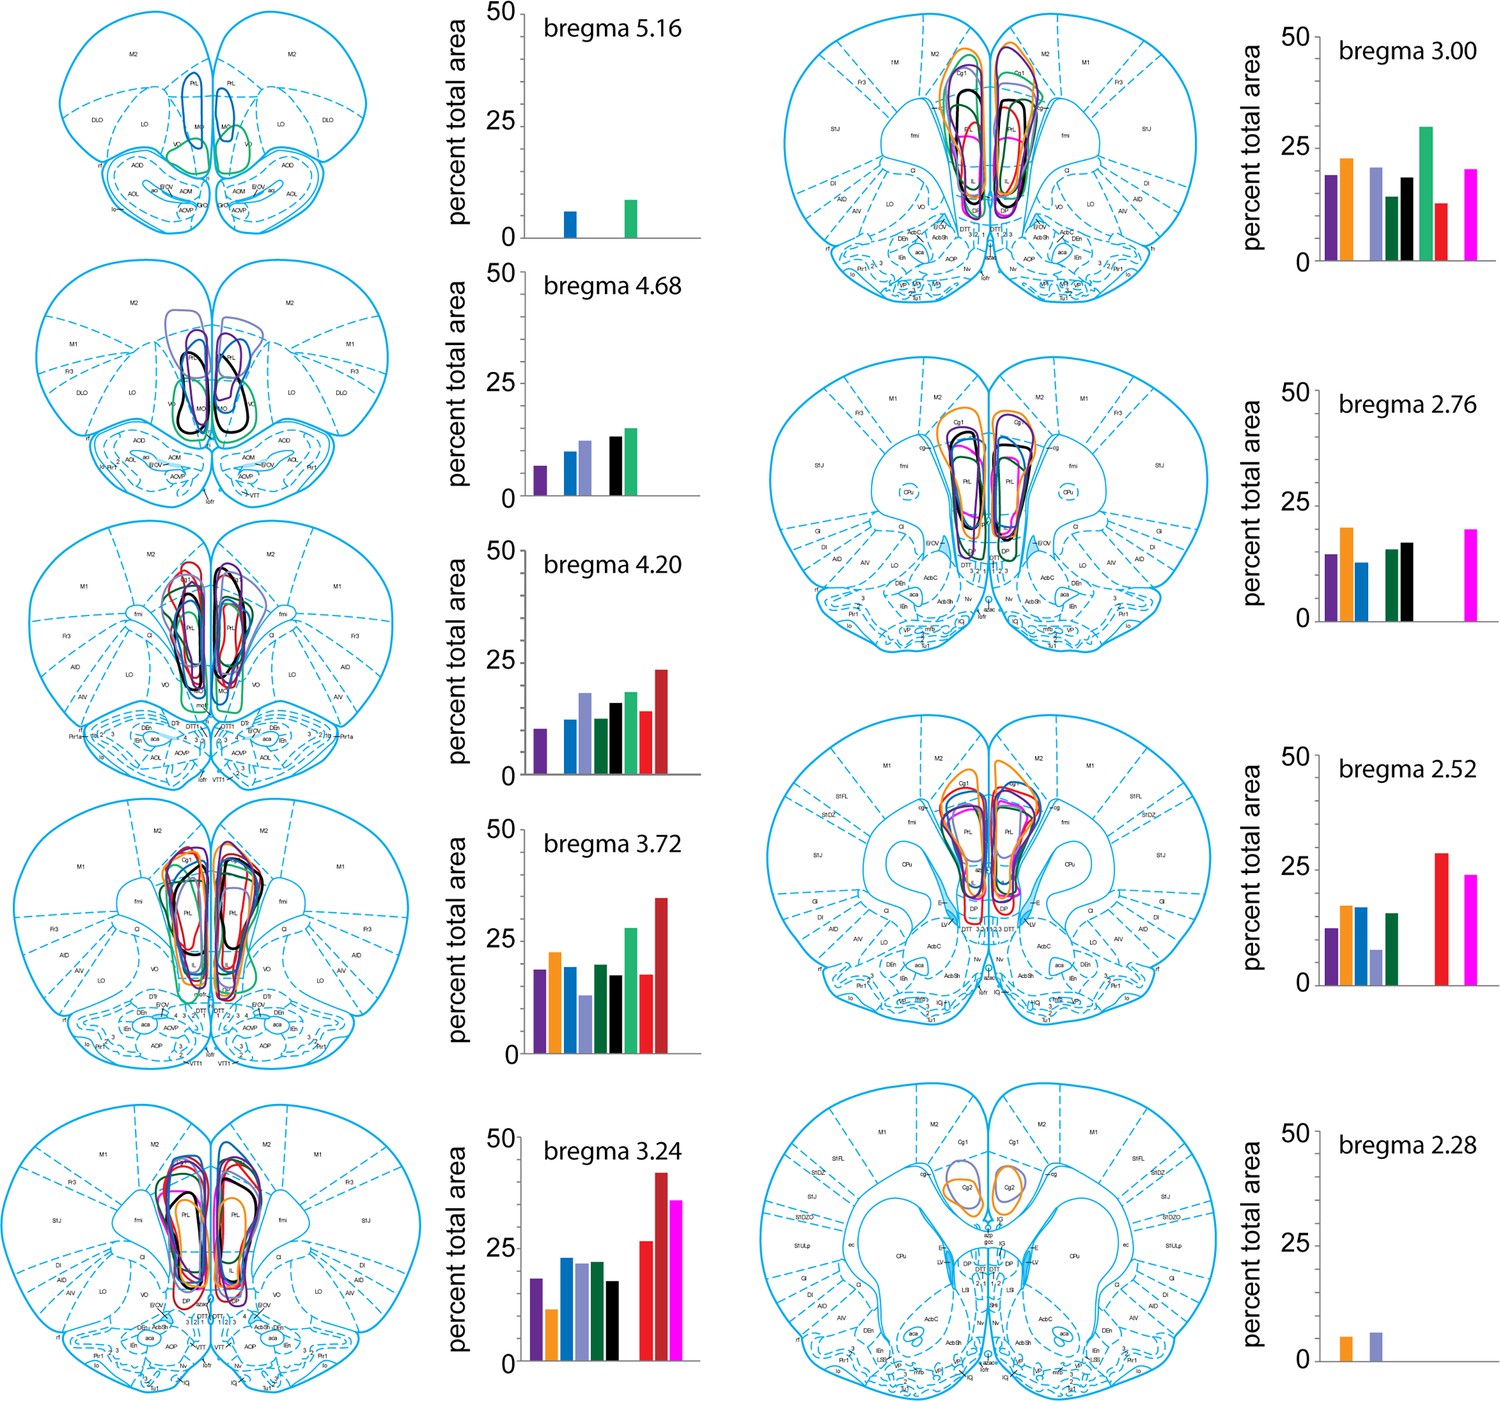
Medial prefrontal cortex (mPFC) lesions.
The extent of each rat’s lesion was traced and quantified as the percentage of the total mPFC at each of nine coronal planes through the A-P extent of the mPFC.
Figure 2 with 1 supplement
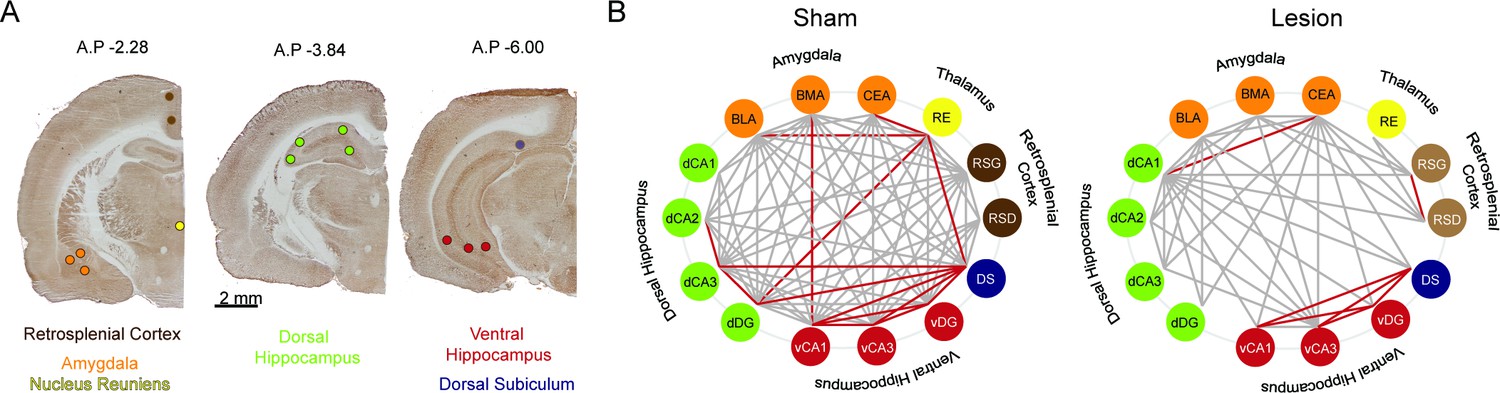
Cytochrome oxidase (CO) analysis demonstrates widespread metabolic consequences of medial prefrontal cortex (mPFC) lesion.
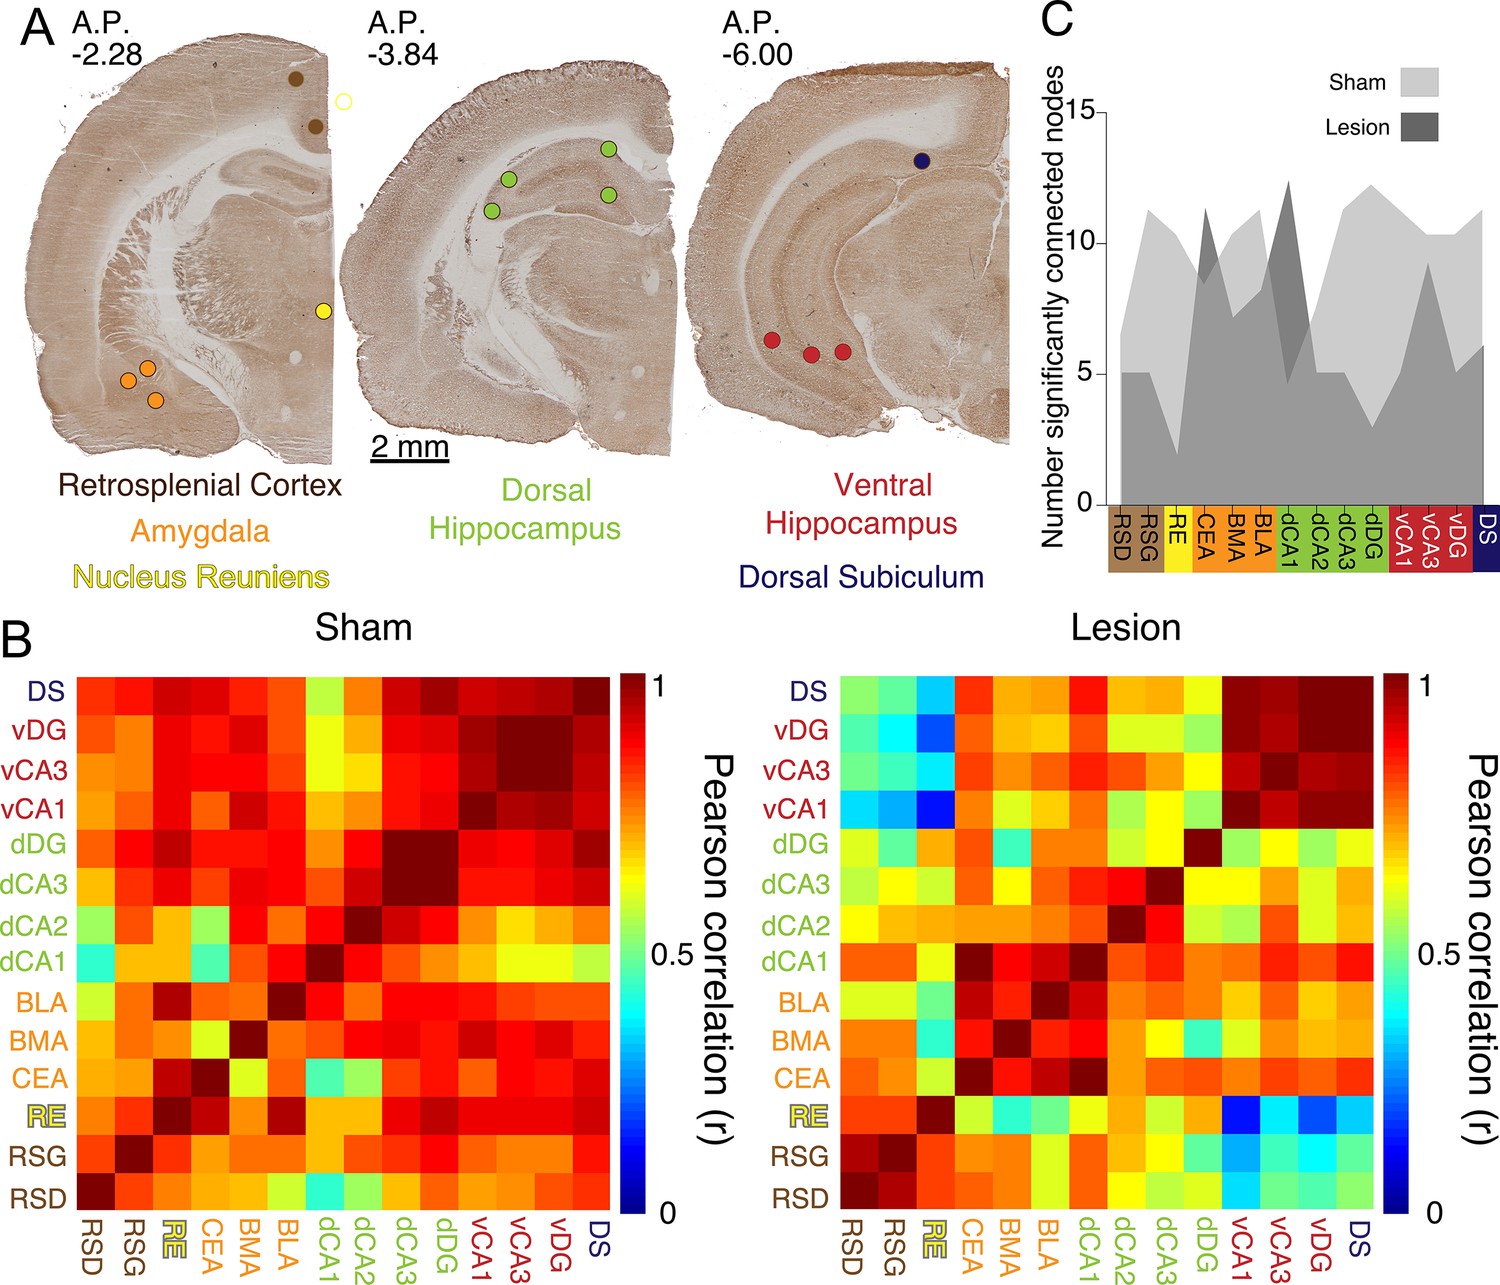
(A) Representative CO staining and locations of the optical density readings. CO activity was measured in the dysgranular and granular retrosplenial cortices (RSD and RSG, respectively), the nucleus reuniens (RE), the central nucleus of the amygdala (CEA), basomedial and basolateral amygdala (BMA and BLA, respectively), the dorsal hippocampus CA1, CA2, CA3 and dentate gyrus areas (dCA1, dCA2, dCA3, dDG, respectively) the ventral hippocampus CA1, CA3 and dentate gyrus areas (vCA1, vCA3, vDG, respectively), and the dorsal subiculum (DS) marked as colored circle areas. (B) Interarea covariations of CO activity by graph theory analysis. Each line indicates a significant correlation (p<0.05) between the two brain regions (‘nodes’) it connects; only the red lines survived false discovery rate (FDR <0.01) correction. Sham: n=8; lesion: n=8.
Figure 2—figure supplement 1
Medial prefrontal cortex (mPFC) lesions change covarying resting-state metabolic activity between the dorsal and ventral hippocampus.
(A) Representative cytochrome oxidase staining and locations of the optical density readings. Cytochrome oxidase activity was measured in the dysgranular and granular retrosplenial cortices (RSD and RSG, respectively), the nucleus reuniens (RE), the central nucleus of the amygdala (CEA), basomedial and basolateral amygdala (BMA and BLA, respectively), the dorsal hippocampus CA1, CA2, CA3, and dentate gyrus areas (dCA1, dCA2, dCA3, dDG, respectively), the ventral hippocampus CA1, CA2, and CA3 areas (vCA1, vCA3, vDG, respectively), and the dorsal subiculum (DS) marked as colored circles. (B) The matrix of interregional cytochrome oxidase activity correlations indicates that mPFC lesions reduce Pearson correlations in the lesion group. Univariate correlations among hippocampus, nucleus reunions, amygdala, and DS decreased after mPFC lesion, but these decreases did not survive the p<0.0005 Bonferroni correction for the 91 comparisons (see Supplementary file 1 for abbreviations: BLA-RE: z=1.91, p=0.05, dCA1-CEA: z=3.12, p=0.001, dDG-dCA3: z=2.79, p=0.005, vCA1-RE: z=1.94, p=0.05, DS-RE: z=1.92, p=0.05, DS-dDG: z=1.9, p=0.05). (C) Number of significantly connected nodes at each site before FDR correction. Sham: n=8; lesion: n=8.
Figure 3

Medial prefrontal cortex (mPFC) lesion does not change basic discharge properties, but decreases hippocampus place cell overdispersion only in the absence of the cognitive control challenge.
(A) Left: representative histology with overlaid recording traces from the Neuropixel probe. Right: recording schedule workflow during the cognitive control task. (B) There is no difference between sham and mPFC lesion rats in firing rate (sham: 3.29±0.27, lesion: 3.68±0.33, t184=0.91, p=0.36) and burst ratio in hippocampal neurons (sham: 1.53±0.25, lesion: 2.02±0.28, t174=1.29, p=0.19). (C) Distribution of standardized place cell discharge (z scores) computed during every 5 s episode in which the rat passed through place cell firing fields in the data set. Different numbers of passes qualified for evaluation during the pretraining (sham = 2777, lesion = 3398), retention (sham = 4039, lesion = 3366), and conflict (sham = 1748, lesion = 2336) recordings. The variance of the histograms characterizes overdispersion, statistically evaluated by their ratio as an F-test (pretraining: F2776,3397 = 2.19, p=5.8 × 10⁻⁴). Sham: n=3; lesion: n=3 rats.
Figure 4
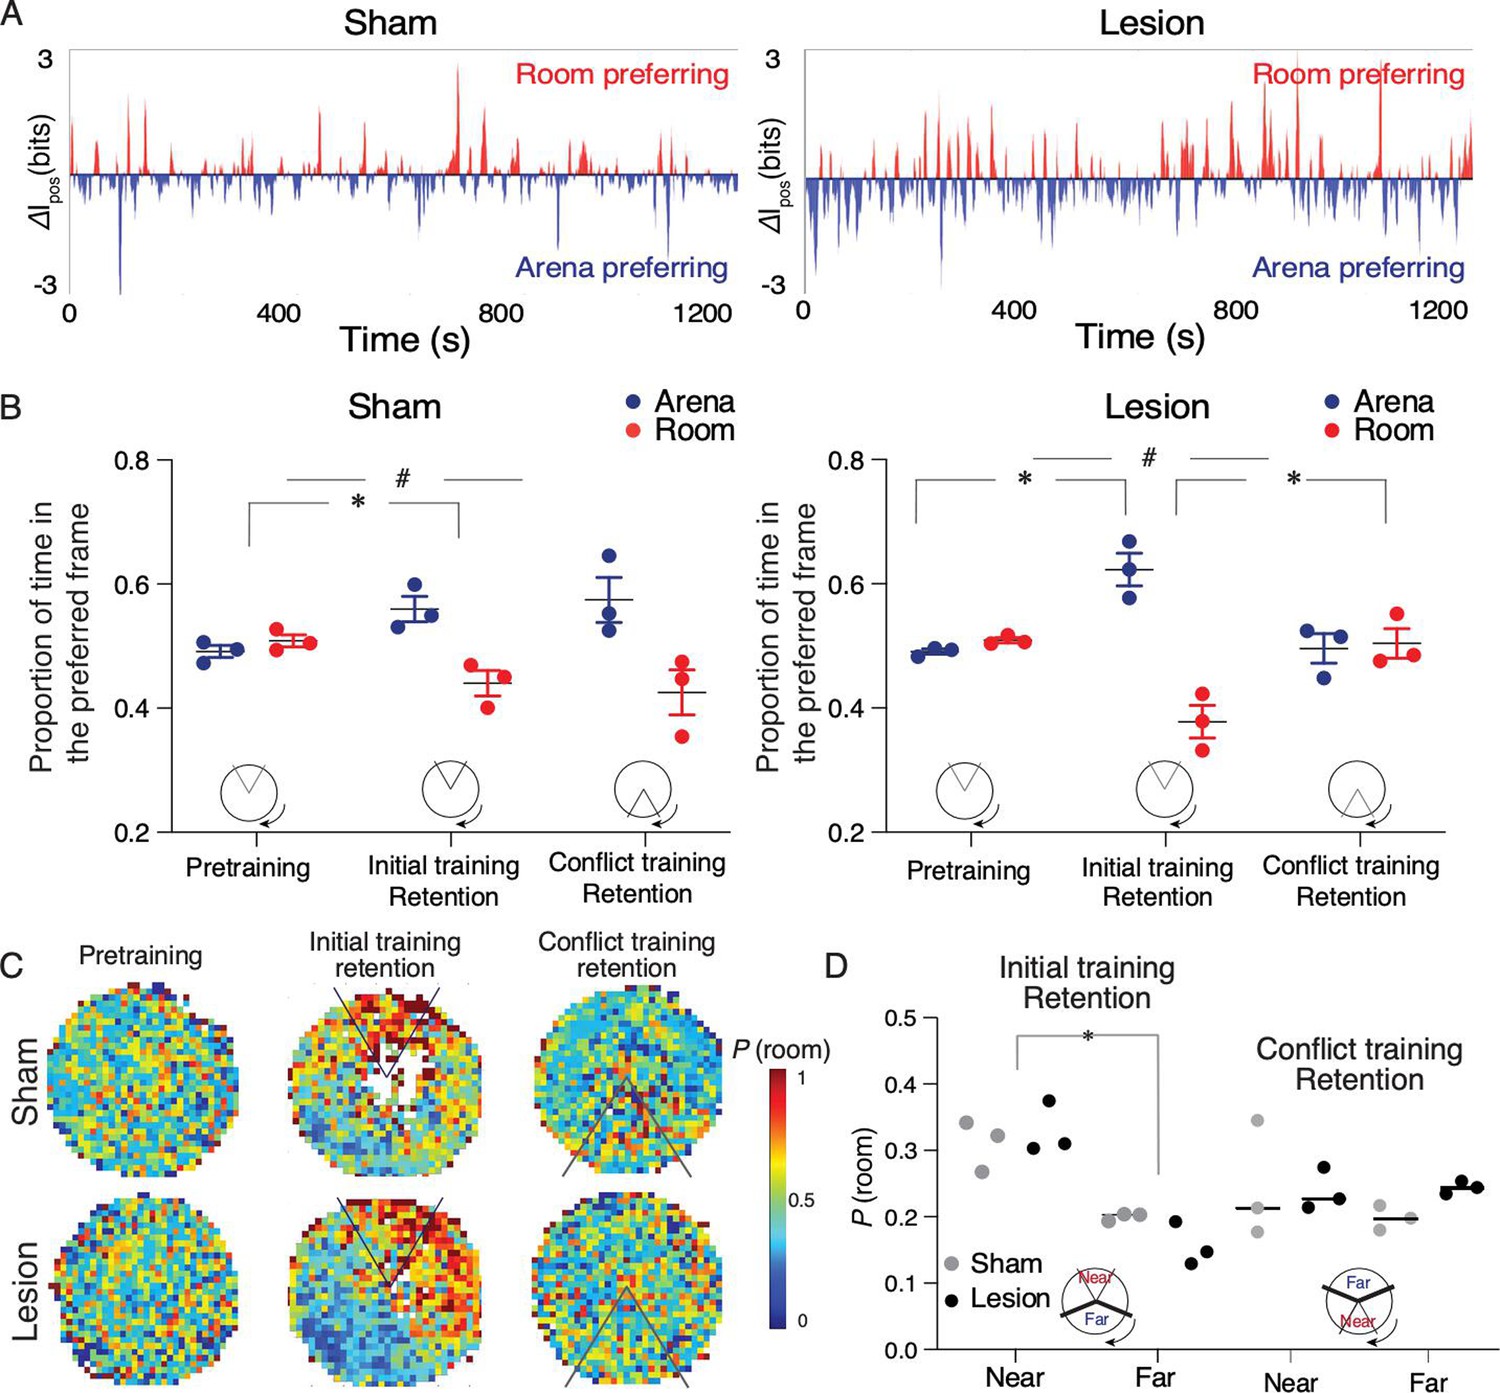
Sham and medial prefrontal cortex (mPFC) lesion rats do not differ in expressing cognitive control of spatial frame-specific representations of location.
(A) Individual ensemble examples during the day 4 retention session and (B) group statistics of spatial frame ensemble preference (SFEP), demonstrating cognitive control in both groups. During retention, SFEP is biased to the arena frame in both the sham (t4=4.16, #p=0.01) and lesion rats (t4=6.62, #p=0.003). *p<0.05 post-hoc differences. (C) Group spatial probability distribution of SFEP for room frame preference during the pretraining, initial, and conflict retention sessions with no shock. (D) Summary of average probability of room-preferring SFEP discharge in half the arena near and far from the shock zone during the initial and conflict retention sessions. Two-way group × location ANOVA (sham: n=3, lesion: n=3) during retention of the initial shock zone location: Group: F1,4 = 0.17, p=0.68, η2=10–3; location: F1,4 = 54.69, p=0.001, η2=0.84; group × location F1,4 = 2.04, p=0.2, η2=10–2; during retention of the conflict shock zone location: group: F1,4 = 0.71, p=0.45, η2=0.05; location: F1,4 = 0.42, p=0.55, η2=0.056; group × location F1,4 = 0.67, p=0.45, η2=0.08. Sham: n=3; lesion: n=3 rats.
Additional files
-
Supplementary file 1
Average cytochrome oxidase activity in sham and lesioned brains.
Relative cytochrome oxidase (CO) activity/μm tissue (× 10–1). RSD, dysgranular retrosplenial cortex; RSG, granular retrosplenial cortex; RE, the nucleus reuniens; CEA, the central nucleus of the amygdala; BMA, basomedial amygdala; BLA, basolateral amygdala; dCA1, dorsal CA1; dCA2, dorsal CA2; dCA3, dorsal CA3; dDG, dorsal dentate gyrus; vCA1, ventral CA1; vCA3, ventral CA3; vDG, ventral dentate gyrus; DS, dorsal subiculum (sham; n=8, lesion; n=8).
- https://cdn.elifesciences.org/articles/104475/elife-104475-supp1-v1.docx
-
Supplementary file 2
Place cell counts and behavioral measures of the recorded rats.
- https://cdn.elifesciences.org/articles/104475/elife-104475-supp2-v1.docx
-
Supplementary file 3
Electrophysiological properties of thalamic cells.
- https://cdn.elifesciences.org/articles/104475/elife-104475-supp3-v1.docx
-
MDAR checklist
- https://cdn.elifesciences.org/articles/104475/elife-104475-mdarchecklist1-v1.pdf
Download links
A two-part list of links to download the article, or parts of the article, in various formats.
Downloads (link to download the article as PDF)
Open citations (links to open the citations from this article in various online reference manager services)
Cite this article (links to download the citations from this article in formats compatible with various reference manager tools)
Cognitive control of behavior and hippocampal information processing without medial prefrontal cortex
eLife 13:RP104475.
https://doi.org/10.7554/eLife.104475.3


