Synaptic connectivity of sensorimotor circuits for vocal imitation in the songbird
- Department of Neuroscience, UT Southwestern Medical Center, United States
Figures
Figure 1
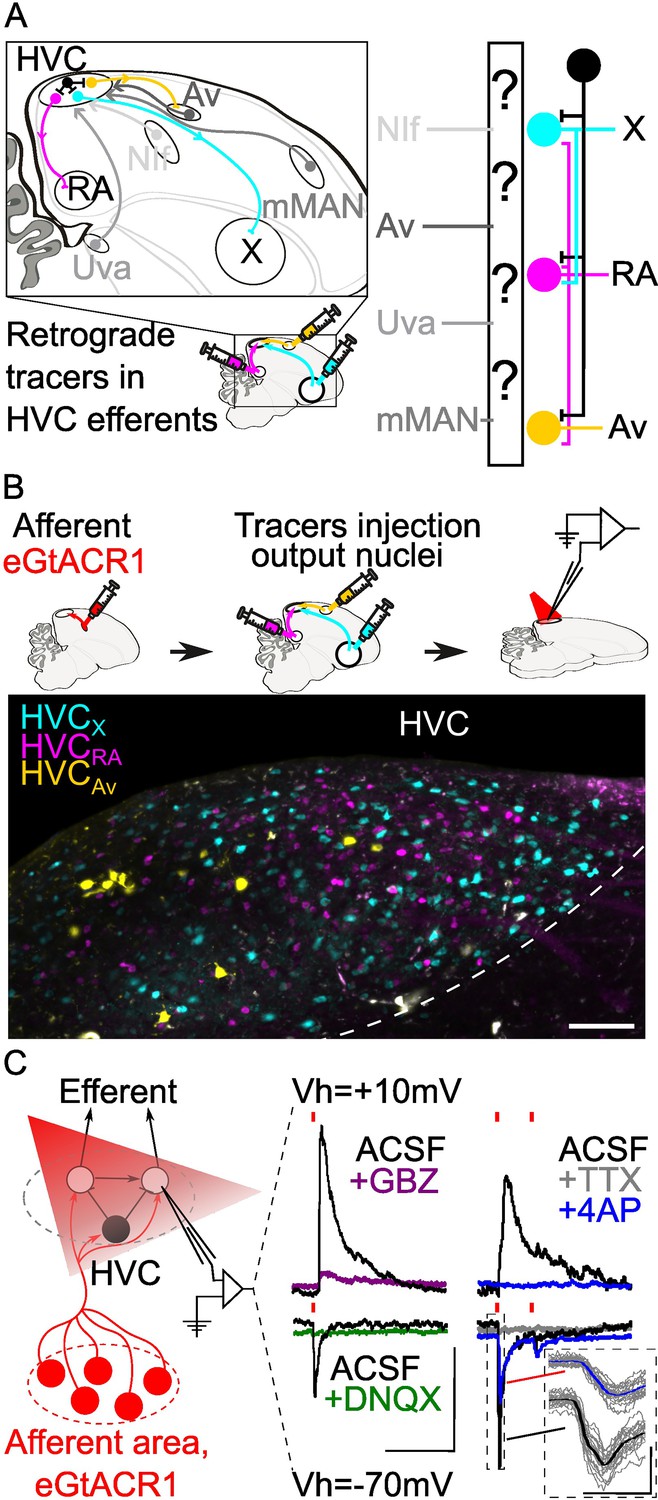
Strategy for opsin-assisted HVC circuit mapping.
(A) (left) Parasagittal schematic of the zebra finch brain illustrating HVC afferents (grey) from nucleus interface of the nidopallium (NIf), nucleus avalanche (Av), medial magnocellular nucleus of the anterior nidopallium (mMAN) and nucleus Uvaeformis (Uva), and the three classes of HVC-PNs: HVCX (projecting to Area X, cyan), HVCRA (projecting to RA, magenta), and HVCAv (projecting to Av, yellow). (right) Schematic illustrating the known synaptic connectivity of HVC’s input and output pathways (interneurons schematized in black). (B) (top) Schematic of the workflow including opsin expression in afferent areas, retrograde tracer injection in afferent areas and ,whole cell patch-clamp recording of light-evoked currents in acute brain slices. (bottom) Sample image of retrogradely labeled HVC-PN classes in a brain slice used for patch-clamp recordings (scalebar 100 µm). (C) Schematic of whole-cell recording of light-evoked synaptic currents in HVC-PNs receiving monosynaptic inputs from one of the afferent areas expressing eGTACR1 (red), as well as polysynaptic inputs from local HVC-PNs (white circle) and interneurons (black circle). Recordings are performed at holding potential (Vh)=+10 mV and –70 mV. Sample traces report the effect of bath application of DNQX (green) and gabazine (GBZ, purple), which suppress oEPSC and oIPSC, respectively. Glutamatergic monosynaptic currents are pharmacologically isolated by bath application of TTX +4AP: sample traces (average of 20 sweeps) portray a typical case of a cell displaying oEPSC with a monosynaptic component (inset shows 20 oEPSCs sweeps in grey, averaged in the thick traces in black and blue), and polysynaptic oIPSC, as 4AP (blue) application results in a partial restoration of oEPSC, but not of oIPSC (red lines represent light stimuli, 1ms; scalebar: 100ms, 100 pA).
Figure 2 with 1 supplement
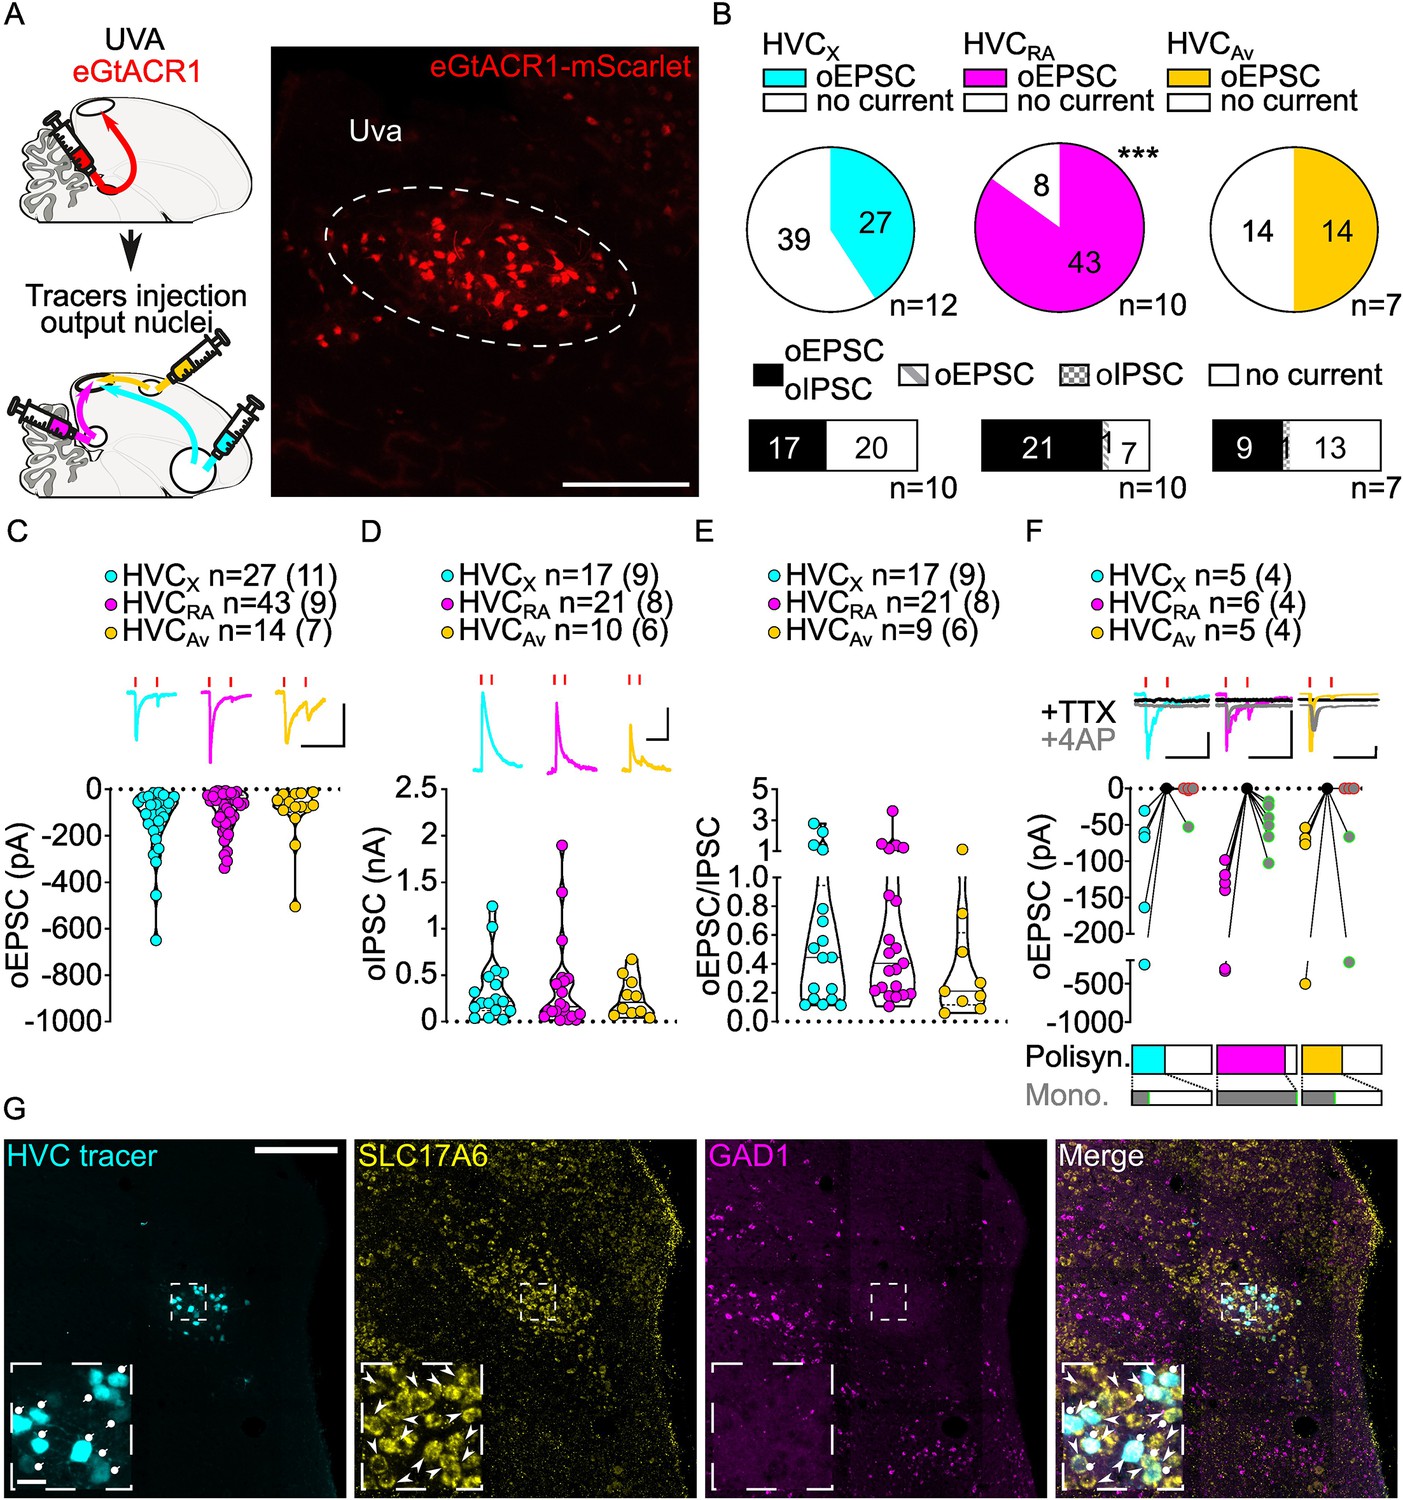
Uva afferents reliably elicit polysynaptic oIPSCs and oEPSCs in all three HVC-PN classes and have monosynaptic inputs onto HVCRA neurons.
(A) (left) Schematic of the experimental timeline, illustrating injection of AAV-eGtACR1 in Uva, followed by retrograde tracer injections in HVC efferent areas and whole-cell patch-clamp recording in acute brain slices; (right) sample image of eGtACR1-mScarlet expression in Uva (scalebar 200 µm). (B) (top) pie charts representing the likelihood of observing oEPSCs in HVCX (cyan), HVCRA (magenta), or HVCAv (yellow) (Fisher’s exact test, p<0.001). Numbers in the pie fragments represent the number of cells in which current (colored) or no current (white) was found. Numbers next to the pie charts represent the number of animals from which the data is obtained. (bottom) bar chart representing the number of cells where both oEPSCs and oIPSCs could be elicited (black), only oEPSCs but no oIPSCs (grey lines), only oIPSCs but no oEPSCs (grey checkers), or neither (white), for subsets of cells from the HVC-PN classes’ pie charts aligned above (Fisher’s exact test, p=0.0244). (C) Violin and scatter plot and sample traces reporting average measured oEPSC amplitude of each cell, by cell class (Kruskal-Wallis test H(2)=2.241, p=0.3262; n=cells (animals); red lines represent light stimuli, 1ms; scalebars, 100ms, 100 pA). (D) Violin and scatter plot and sample traces of average measured oIPSC amplitude of each cell, by cell class (H(2)=0.5946, p=0.7428; scalebars, 100ms, 100 pA). (E) Violin and scatter plot of the ratio of oEPSC and oIPSC peak amplitude of each cell where both are measured and ≠0, per cell class (H(2)=0.2716, p=0.2572). (F) (top) sample traces and plot representing the amplitude of post-synaptic currents evoked by lightly-driven release of neurotransmitter from Uva axonal terminals in HVC; oEPSCs amplitudes are reported before (HVCX cyan, HVCRA magenta, HVCAv yellow) and after bath application of TTX (black) and 4AP (grey, green outline indicates polysynaptic oEPSC, see methods), (n=cells (animals); red lines represent light stimuli, 1ms; scalebars, 100ms, 100 pA) (bottom) bar charts representing the likelihood of observing polysynaptic oEPSCs in HVCX (cyan), HVCRA (magenta), or HVCAv (yellow) (data from panel B), and (grey) likelihood of a subset of the corresponding oEPSCs to be monosynaptic. (G) Sample images reporting retrogradely labeled HVC-projecting neurons in UVA (cyan, white circles) together with in situ labeling of glutamatergic (SLC17A6, yellow, white arrowheads) and GABAergic (GAD1, magenta, gray arrowheads) markers transcripts (scalebar 200 µm, inset 20 µm).
Figure 2—figure supplement 1
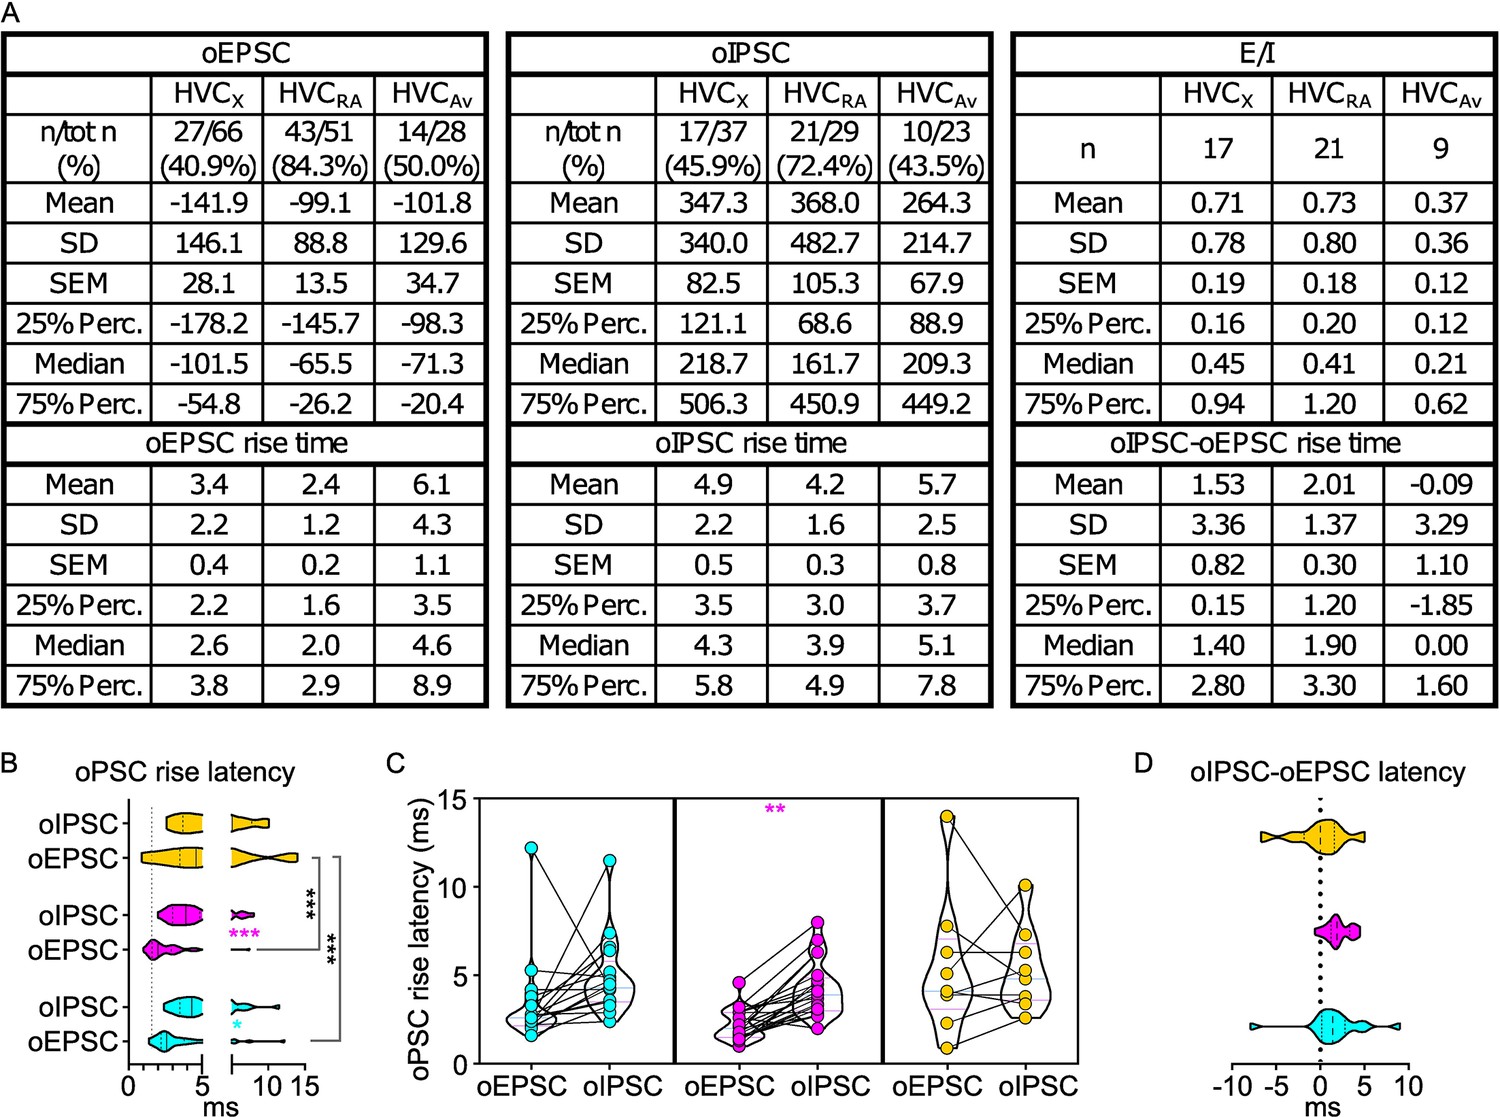
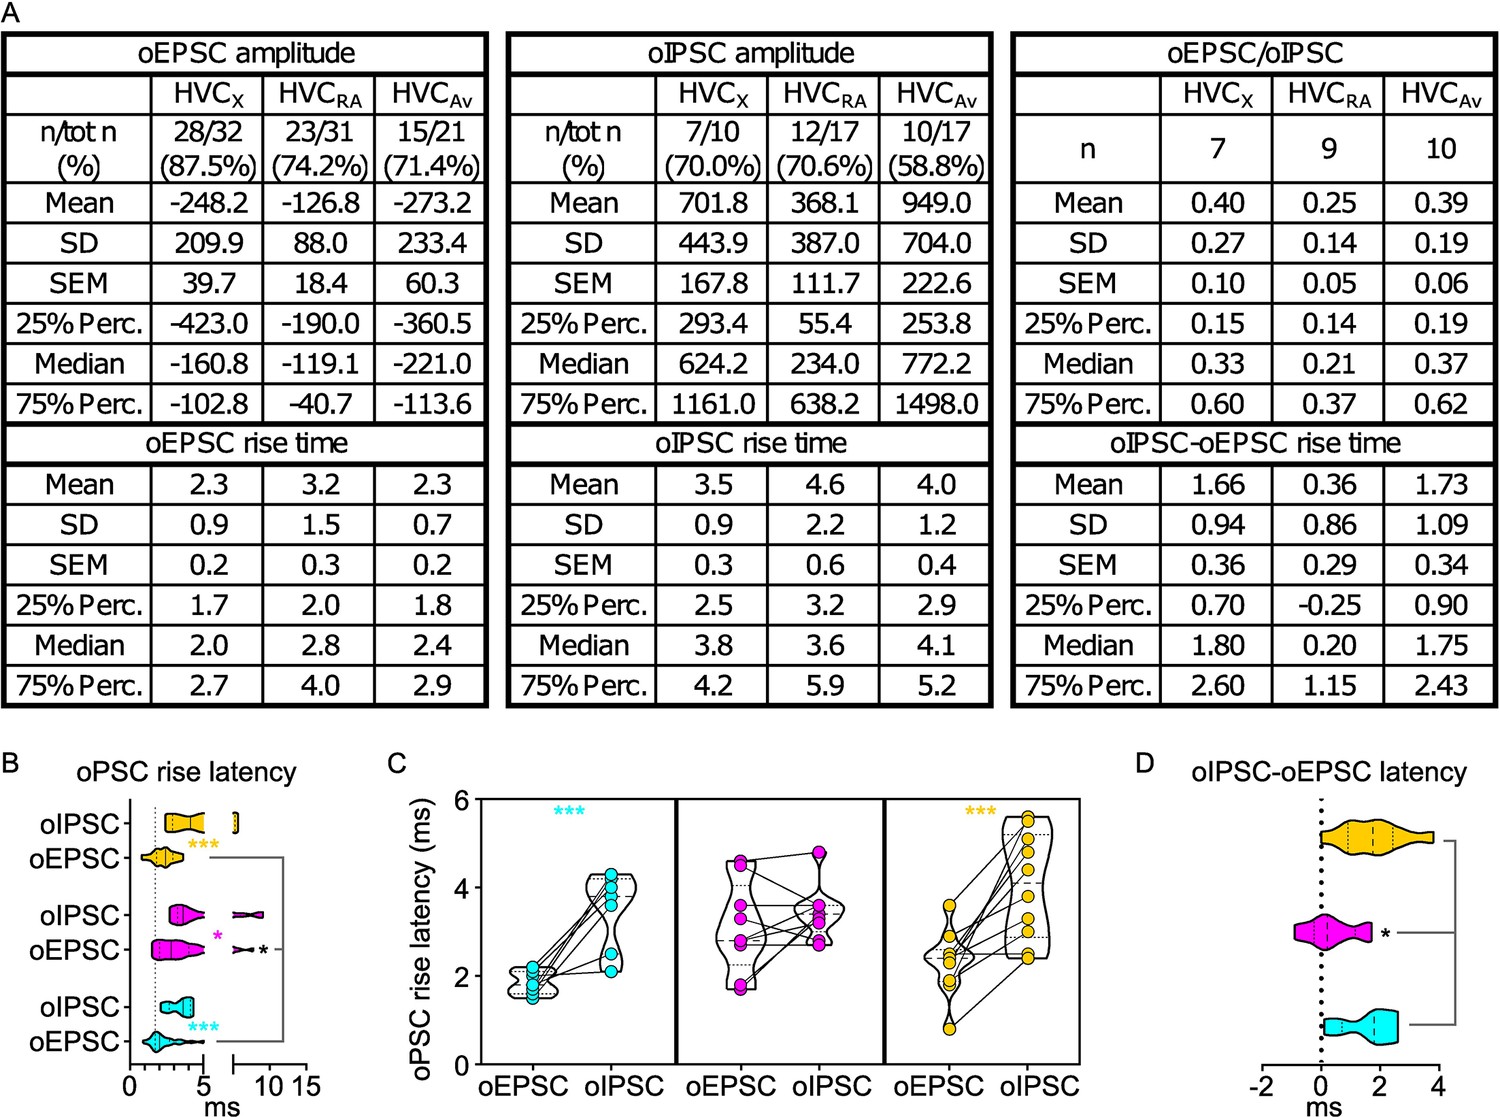
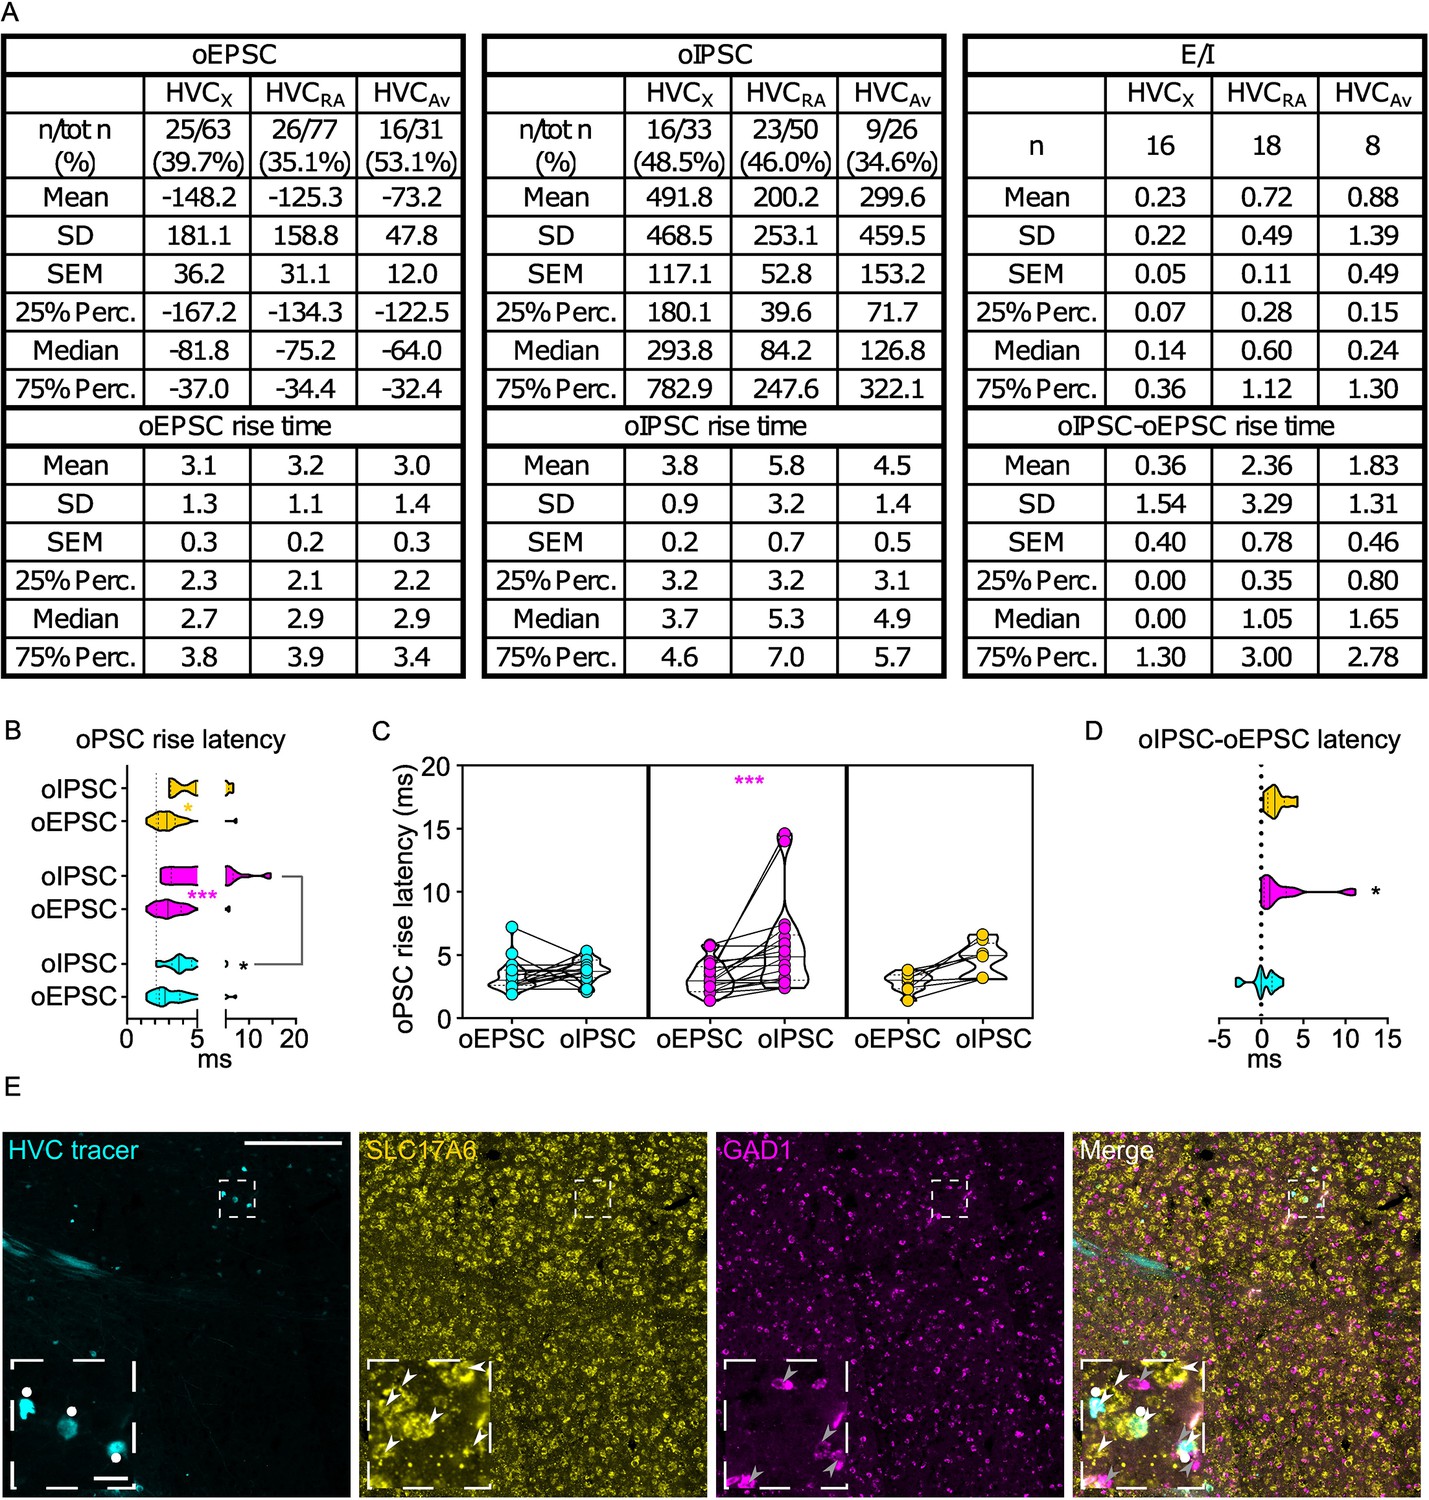
oPSCs amplitude and rise latency in each HVCPN class upon optogenetic stimulation of UVA afferents.
(A) Table reporting descriptive statistics relative to oEPSCs and oIPSCs as reported in Figure 2. (B) Violin and scatter plots representing oPSC rise latencies reported in Figure 2 (gray line marks the minimal latency (1st quartile) to oPSC rise across the cell types, for ease of comparison Mixed-effects analysis, oEPSC vs. oIPSC F(1,44)=7.143, p=0.0105 HVCX p=0.0164, HVCRA p<0.001; HVCPN F(2,82)=10.24, p<0.001, oEPSCs: HVCX vs HVCAv p<0.001, HVCRA vs HVCAv p<0.001); (C) oPSCs rise latency for cells where both oEPSC and oIPSC were measured (2 W ANOVA, oEPSC vs. oIPSC F(1,44)=7.923, HVCRA p=0.0032); (D) relative delay of oIPSC compared to oEPSC across the cells reported in (C) (Kruskal-Wallis test, H=4.587, p=0.1009).
Figure 3 with 1 supplement
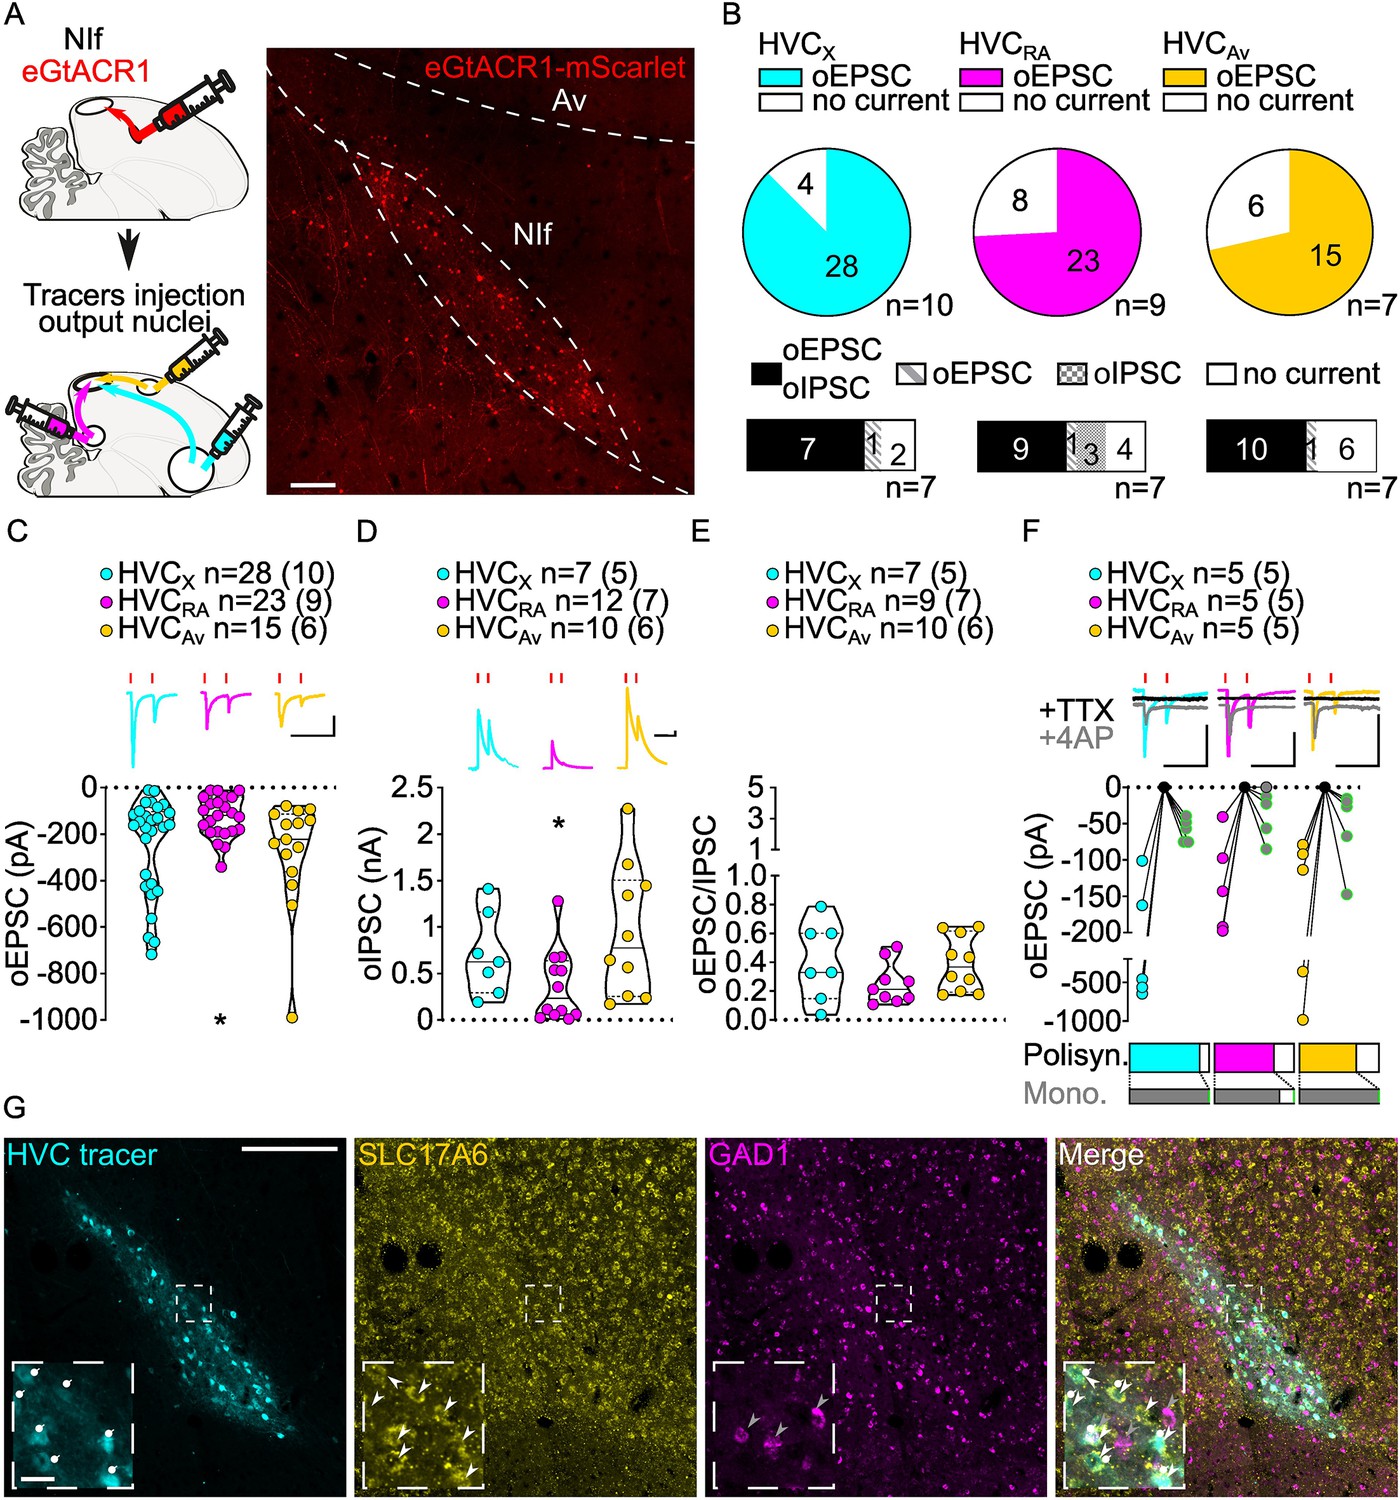
Stimulation of NIf inputs to HVC reliably elicits polysynaptic oIPSCs and oEPSCs, and monosynaptic oEPSCs, in all three HVC-PN classes.
(A) (left) Schematic of the experimental timeline, illustrating injection of AAV-eGtACR1 in NIf, followed by retrograde tracer injections in HVC efferent areas and whole-cell patch-clamp recording in acute brain slices; (right) sample image of eGtACR1-mScarlet expression in NIf (scalebar 200 µm). (B) (top) pie charts representing the likelihood of observing oEPSCs in HVCX (cyan), HVCRA (magenta) or HVCAv (yellow) (Fisher’s exact test, p=0.2783). Numbers in the pie fragments represent the number of cells in which current (colored) or no current (white) was found. Numbers next to the pie charts represent the number of animals from which the data is obtained. (bottom) bar chart representing the number of cells where both oEPSCs and oIPSCs could be elicited (black), only oEPSCs but no oIPSCs (grey lines), only oIPSCs but no oEPSCs (grey checkers), or neither (white), for subsets of cells from the HVC-PN classes’ pie charts aligned above (Fisher’s exact test, p=0.5841). (C) Violin and scatter plot and sample traces reporting average measured oEPSC amplitude of each cell, by cell class (Kruskal-Wallis test, H(2)=6.135, p=0.0465; n=cells (animals); red lines represent light stimuli, 1ms; scalebars, 100ms, 100 pA). (D) Violin and scatter plot and sample traces of average measured oIPSC amplitude of each cell, by cell class (H(2)=6.182, p=0.0455; scalebars, 100ms, 100 pA). (E) Violin and scatter plot of the ratio of oEPSC and oIPSC peak amplitude of each cell where both are measured and ≠0, per cell class (H(2)=3.305, p=0.1916). (F) (top) sample traces and plot representing the amplitude of post-synaptic currents evoked by lightly-driven release of neurotransmitter from NIf axonal terminals in HVC; oEPSCs amplitudes are reported before (HVCX cyan, HVCRA magenta, HVCAv yellow) and after bath application of TTX (black) and 4AP (grey, green outline indicates polysynaptic oEPSC, see Materials and methods), (n=cells (animals); blue lines represent light stimuli, 1ms; scalebbars, 100ms, 100 pA) (bottom) bar charts representing the likelihood of observing polysynaptic oEPSCs in HVCX (cyan), HVCRA (magenta) or HVCAv (yellow) (data from panel B), and (grey) likelihood of a subset of the corresponding oEPSCs to be monosynaptic. (G) Sample images reporting retrogradely labeled HVC-projecting neurons in NIf (cyan, white circles) together with in situ labeling of glutamatergic (SLC17A6, yellow, white arrowheads) and GABAergic (GAD1, magenta, gray arrowheads) markers transcripts (scale bar 200 µm, inset 20 µm).
Figure 3—figure supplement 1
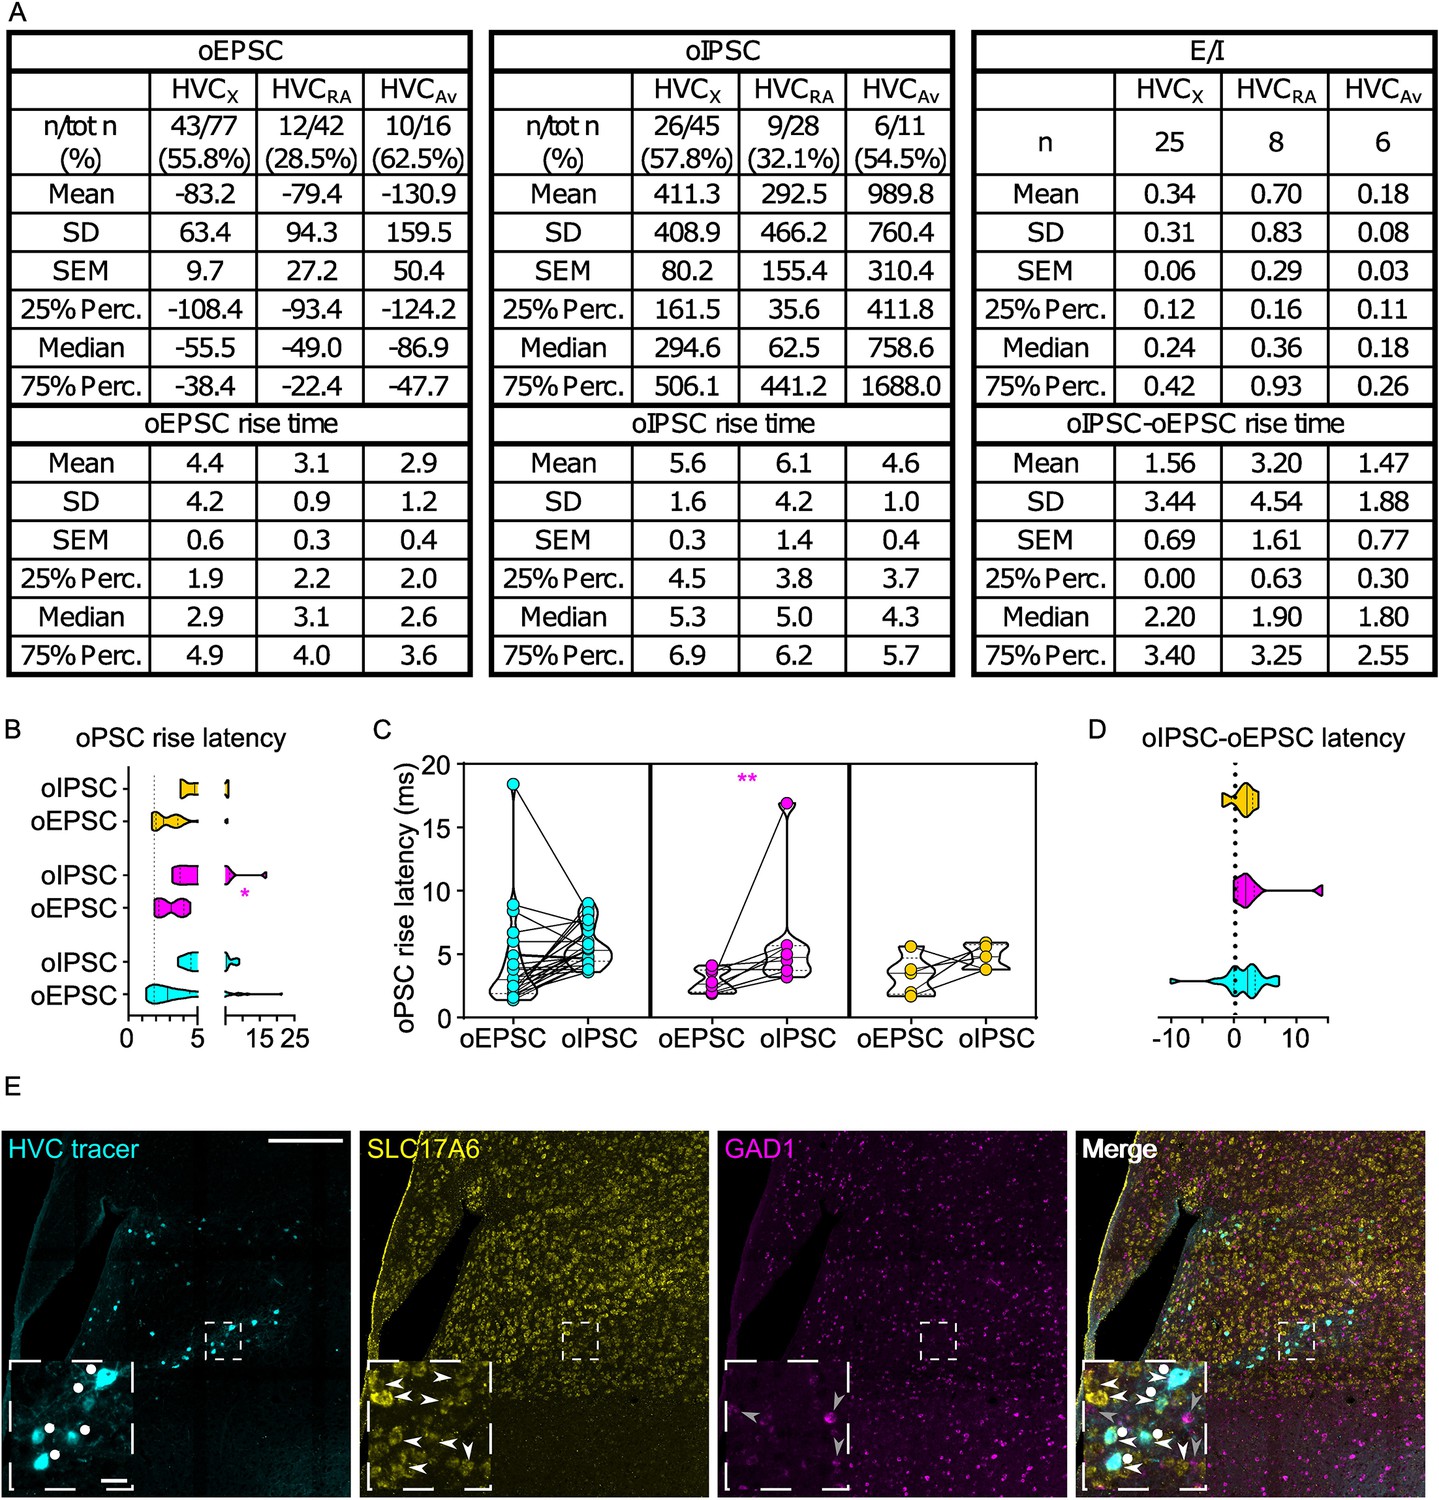
oPSCs amplitude and rise latency in each HVCPN class upon optogenetic stimulation of NIf afferents.
(A) Table reporting descriptive statistics relative to oEPSCs and oIPSCs as reported in Figure 3. (B) Violin and scatter plots representing oPSC rise latencies reported in Figure 3 (gray line marks the minimal latency (1st quartile) to oPSC rise across the cell types, for ease of comparison (Mixed-effects analysis, oEPSC vs. oIPSC F(1,23)=46.55, p<0.001 HVCX p<0.001, HVCRA p=0.0167. HVCAv p<0.001; HVCPN F(2,66)=3.358, p=0.0408, oEPSCs:HVCRA vs HVCX p=0.0029, HVCRA vs HVCAv p=0.0157); (C) oPSCs rise latency for cells where both oEPSC and oIPSC were measured (2 W ANOVA, oEPSC vs. oIPSC F(1,23)=41.60, p<0.001, HVCX p<0.001, HVCAv p<0.001); D) relative delay of oIPSC compared to oEPSC across the cells reported in (C) (Kruskal-Wallis test, H=8.809, p=0.0122).
Figure 4
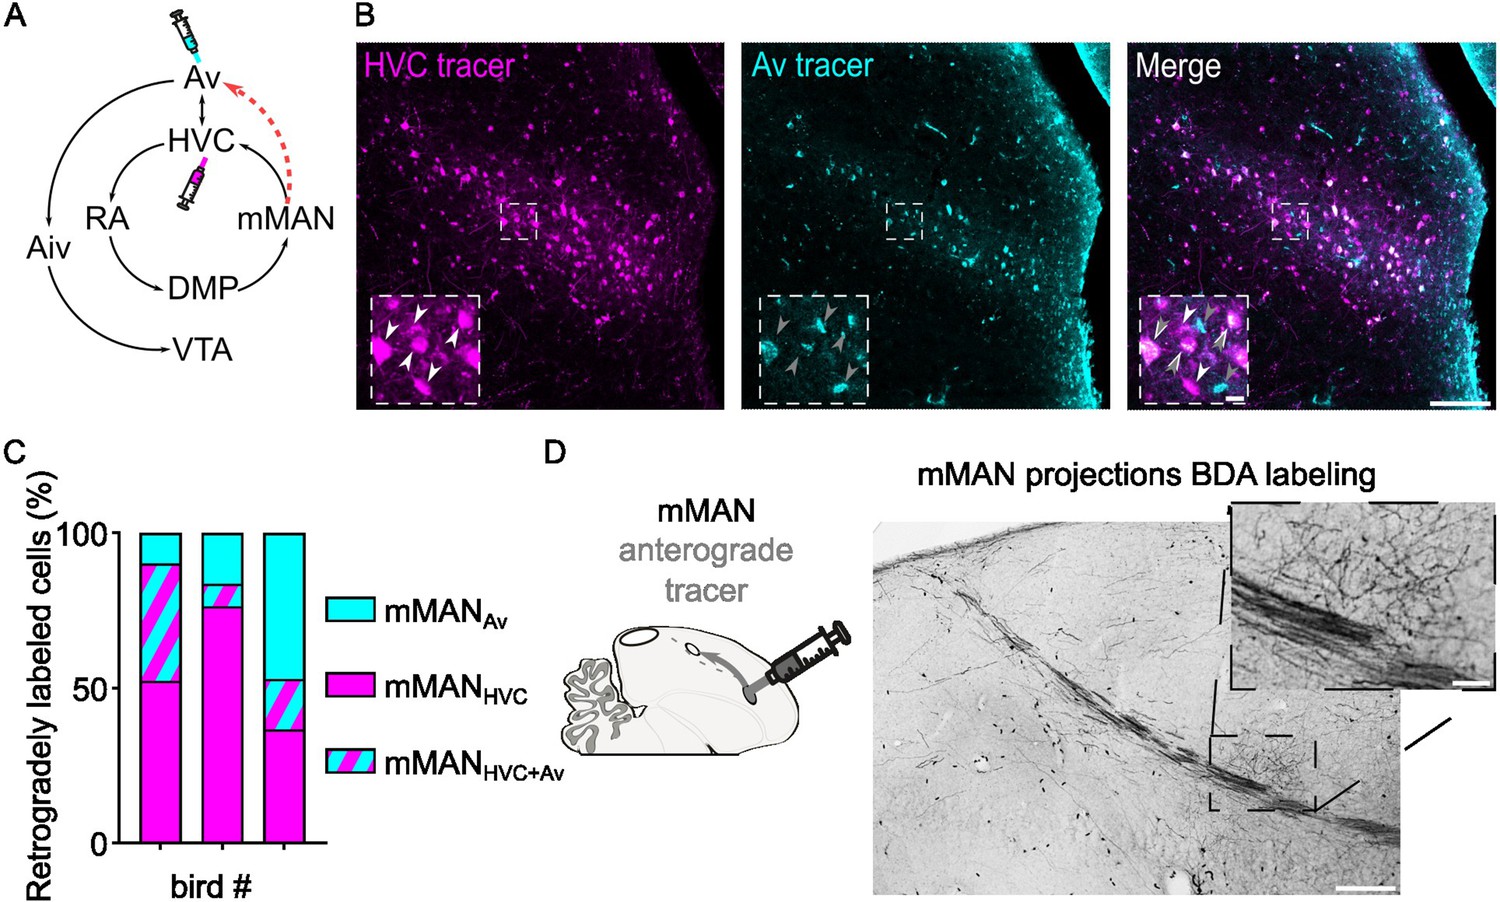
Identification of mMAN neuronal subpopulations projecting to Av and to HVC.
(A) Schematic of the known mMAN afferent and efferent circuitry, together with the proposed new connection towards Av (red dashed arrow), and schematized injection of retrograde tracers in HVC and Av. (B) Sample images of retrogradely labeled mMAN cells projecting to HVC (magenta) or to Av (cyan), and merged image. Insets report magnified selection (dashed square box in the images) illustrating the potential three subpopulations identified: mMANHVC (white arrowheads), mMANAv (grey arrowheads) and mMANHVC+Av (overimposed white and grey arrowheads) (scalebars: 100 µm, inset: 10 µm). (C) Bar chart displaying the number of retrogradely mMANHVC, mMANAv, and mMANHVC+Av labeled cells, in three birds (averaged across hemispheres, 2–6 slices/bird). (D) BDA labeling of anterograde projection to Av from mMAN, inset magnifies the terminal field in Av (scale bars: 200 µm, inset: 50 µm).
Figure 5 with 1 supplement

mMAN inputs elicit polysynaptic oIPSCs and oEPSCs in all three HVC-PN classes and monosynaptically excite HVCX and HVCAv neurons.
(A) (left) Schematic of the experimental timeline, illustrating injection of AAV-eGtACR1 in MMAN, followed by retrograde tracer injections in HVC efferent areas and whole-cell patch-clamp recording in acute brain slices; (right) sample image of eGtACR1-mScarlet expression in MMAN (scale bar 200 µm). (B) (top) pie charts representing the likelihood of observing oEPSCs in HVCX (cyan), HVCRA (magenta), or HVCAv (yellow) (Fisher’s exact test, p=0.0088). Numbers in the pie fragments represent the number of cells in which current (colored) or no current (white) was found. Numbers next to the pie charts represent the number of animals from which the data is obtained. (bottom) bar chart representing the number of cells where both oEPSCs and oIPSCs could be elicited (black), only oEPSCs but no oIPSCs (grey lines), only oIPSCs but no oEPSCs (grey checkers), or neither (white), for subsets of cells from the HVC-PN classes’ pie charts aligned above (Fisher’s exact test, p=0.1054). (C) Violin and scatter plot and sample traces reporting average measured oEPSC amplitude of each cell, by cell class (Kruskal-Wallis test H(2)=2.659, p=0.2646; n=cells (animals); red lines represent light stimuli, 1ms; scale bars, 100ms, 100 pA). (D) Violin and scatter plot and sample traces of average measured oIPSC amplitude of each cell, by cell class (H(2)=8.598, p=0.0136, HVCRA vs. HVCAv p=0.0102; scalebars, 100ms, 100 pA). (E) Violin and scatter plot of the ratio of oEPSC and oIPSC peak amplitude of each cell where both are measured and ≠0, per cell class (H(2)=2.443, p=0.2759). (F) (top) sample traces and plot representing the amplitude of post-synaptic currents evoked by lightly-driven release of neurotransmitter from MMAN axonal terminals in HVC; oEPSCs amplitudes are reported before (HVCX cyan, HVCRA magenta, HVCAv yellow) and after bath application of TTX (black) and 4AP (grey, green outline indicates polysynaptic oEPSC, see Materials and methods), (n=cells (animals); blue lines represent light stimuli, 1ms; scalebars, 100ms, 100 pA) (bottom) bar charts representing the likelihood of observing polysynaptic oEPSCs in HVCX (cyan), HVCRA (magenta) or HVCAv (yellow) (data from panel B), and (grey) likelihood of a subset of the corresponding oEPSCs to be monosynaptic.
Figure 5—figure supplement 1
oPSCs amplitude and rise latency in each HVCPN class upon optogenetic stimulation of mMAN afferents.
(A) Table reporting descriptive statistics relative to oEPSCs and oIPSCs as reported in Figure 5. (B) Violin and scatter plots representing oPSC rise latencies reported in Figure 5 gray line marks the minimal latency (1st quartile) to oPSC rise across the cell types, for ease of comparison (Mixed-effects analysis, oEPSC vs. oIPSC F(1,35)=8.439, p=0.0063, HVCRA p=0.0198; HVCPN F(2,64)=0.7545, p=0.4744); (C) oPSCs rise latency for cells where both oEPSC and oIPSC were measured (2 W ANOVA, oEPSC vs. oIPSC F(1,35)=8.294, p=0.0067, HVCRA p=0.0470); (D) relative delay of oIPSC compared to oEPSC across the cells reported in (C) (Kruskal-Wallis test, H=0.2028, p=0.9036). (E) Sample images reporting retrogradely labeled HVC-projecting neurons in mMAN (cyan, white circles) together with in situ labeling of glutamatergic (SLC17A6, yellow, white arrowheads) and GABAergic (GAD1, magenta, gray arrowheads) markers transcripts (scale bar 200 µm, inset 20 µm).
Figure 6 with 1 supplement
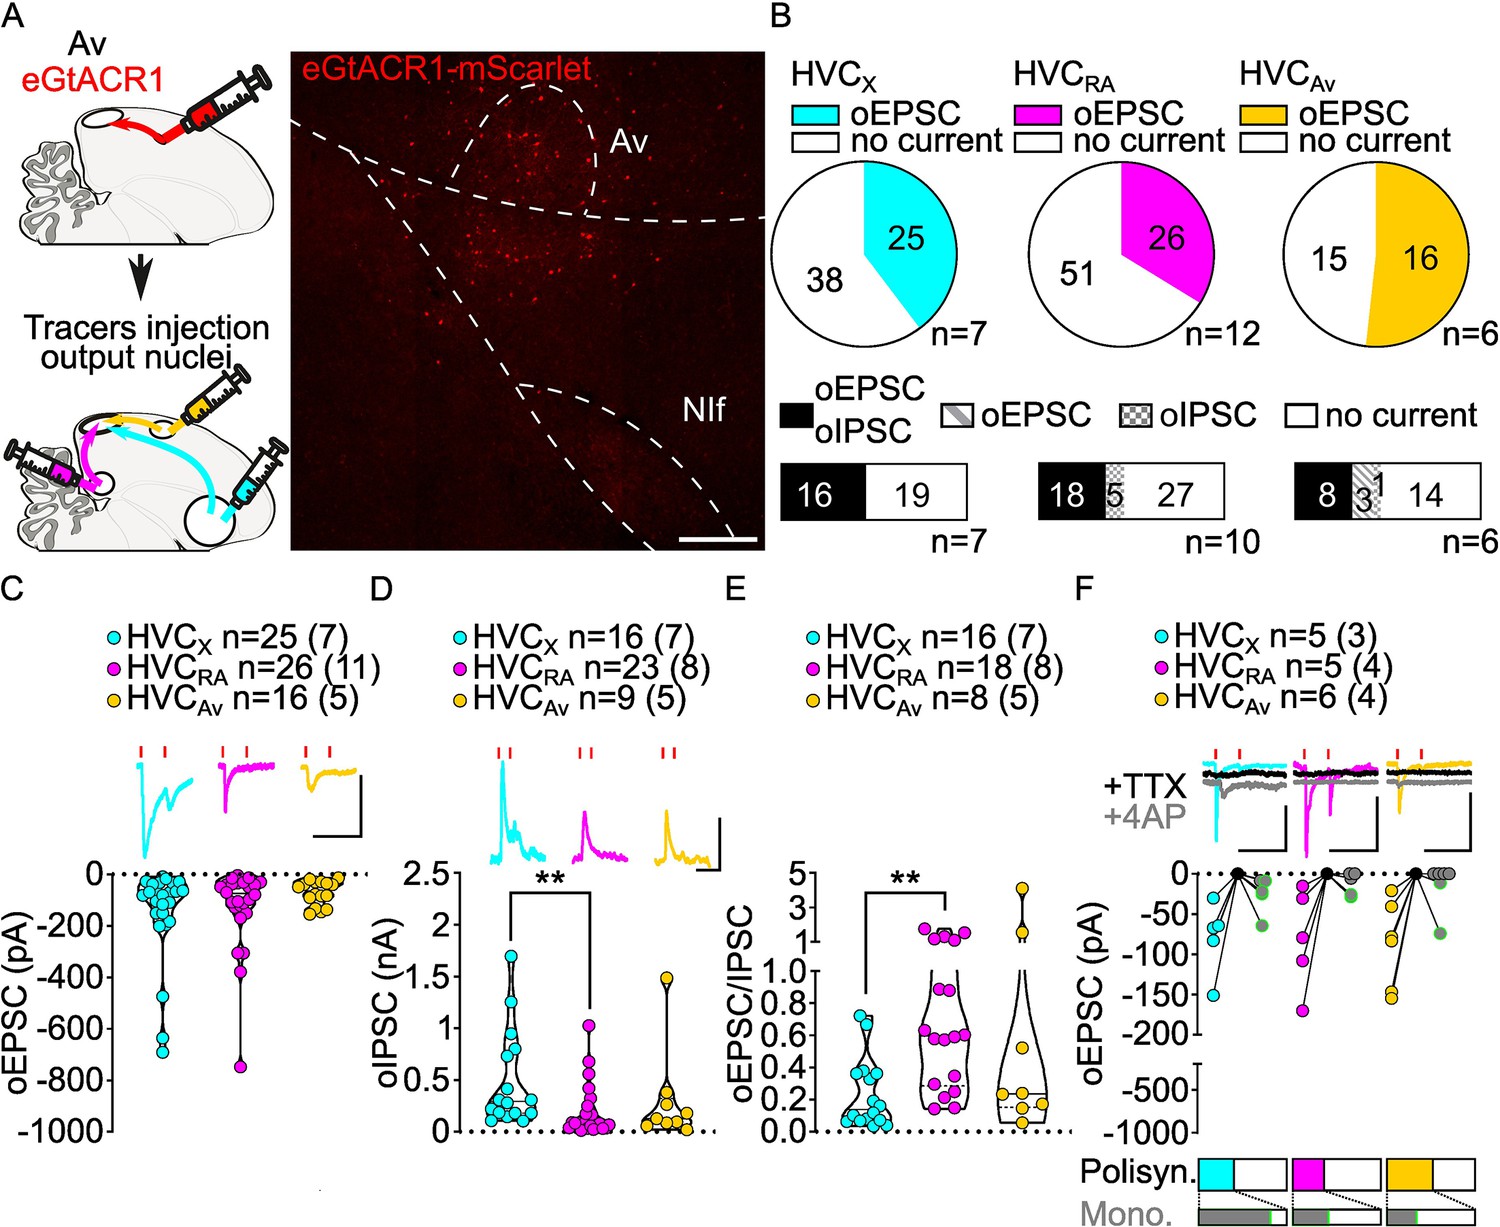
Av inputs elicit polysynaptic oIPSCs and oEPSCs in all three HVC-PN classes and monosynaptically excite mainly HVCX neurons.
(A) (left) Schematic of the experimental timeline, illustrating injection of AAV-eGtACR1 in Av, followed by retrograde tracer injections in HVC efferent areas and whole-cell patch-clamp recording in acute brain slices; (right) sample image of eGtACR1-mScarlet expression in Av (scalebar 200 µm). (B) (top) pie charts representing the likelihood of observing oEPSCs in HVCX (cyan), HVCRA (magenta) or HVCAv (yellow) (Fisher’s exact test, p=0.2243). Numbers in the pie fragments represent the number of cells in which current (colored) or no current (white) was found. Numbers next to the pie charts represent the number of animals from which the data is obtained. (bottom) bar chart representing the number of cells where both oEPSCs and oIPSCs could be elicited (black), only oEPSCs but no oIPSCs (grey lines), only oIPSCs but no oEPSCs (grey checkers), or neither (white), for subsets of cells from the HVC-PN classes’ pie charts aligned above (Fisher’s exact test, p=0.0550). (C) Violin and scatter plot and sample traces reporting average measured oEPSC amplitude of each cell, by cell class (Kruskal-Wallis test H(2)=1.103, p=0.5760; n=cells (animals); red lines represent light stimuli, 1ms; scalebars, 100ms, 100 pA). (D) Violin and scatter plot and sample traces of average measured oIPSC amplitude of each cell, by cell class (H(2)=10.09, p=0.0064, HVCX vs. HVCRA p=0.0047; scalebars, 100ms, 100 pA). (E) Violin and scatter plot of the ratio of oEPSC and oIPSC peak amplitude of each cell where both are measured and ≠0, per cell class (H(2)=10.64, p=0.0049, HVCX vs. HVCRA p=0.0033). (F) (top) sample traces and plot representing the amplitude of post-synaptic currents evoked by lightly-driven release of neurotransmitter from Av axonal terminals in HVC; oEPSCs amplitudes are reported before (HVCX cyan, HVCRA magenta, HVCAv yellow) and after bath application of TTX (black) and 4AP (grey, green outline indicates polysynaptic oEPSC, see Materials and methods), (n=cells (animals); blue lines represent light stimuli, 1ms; scale bars, 100ms, 100 pA) (bottom) bar charts representing the likelihood of observing polysynaptic oEPSCs in HVCX (cyan), HVCRA (magenta), or HVCAv (yellow) (data from panel B), and (grey) likelihood of a subset of the corresponding oEPSCs to be monosynaptic.
Figure 6—figure supplement 1
oPSCs amplitude and rise latency in each HVCPN class upon optogenetic stimulation of Av afferents.
(A) Table reporting descriptive statistics relative to oEPSCs and oIPSCs as reported in Figure 6. (B) Violin and scatter plots representing oPSC rise latencies reported in Figure 6 (gray line marks the minimal latency (1st quartile) to oPSC rise across the cell types, for ease of comparison (Mixed-effects analysis, oEPSC vs. oIPSC F(1,39)=21.78, p<0.001, HVCRA p<0.001, HVCAv p=0.0377; HVCPN F(2,70)=2.764, p=0.0699); (C) oPSCs rise latency for cells where both oEPSC and oIPSC were measured (2 W ANOVA, oEPSC vs. oIPSC F(1,39)=14.26, p<0.001, HVCRA p<0.001); (D) relative delay of oIPSC compared to oEPSC across the cells reported in C) (Kruskal-Wallis test, H=6.403, p=0.0407). (E) Sample images reporting retrogradely labeled HVC-projecting neurons in Av (cyan, white circles) together with in-situ labeling of glutamatergic (SLC17A6, yellow, white arrowheads) and GABAergic (GAD1, magenta, gray arrowheads) markers transcripts (scalebar 200 µm, inset 20 µm).
Figure 7 with 1 supplement
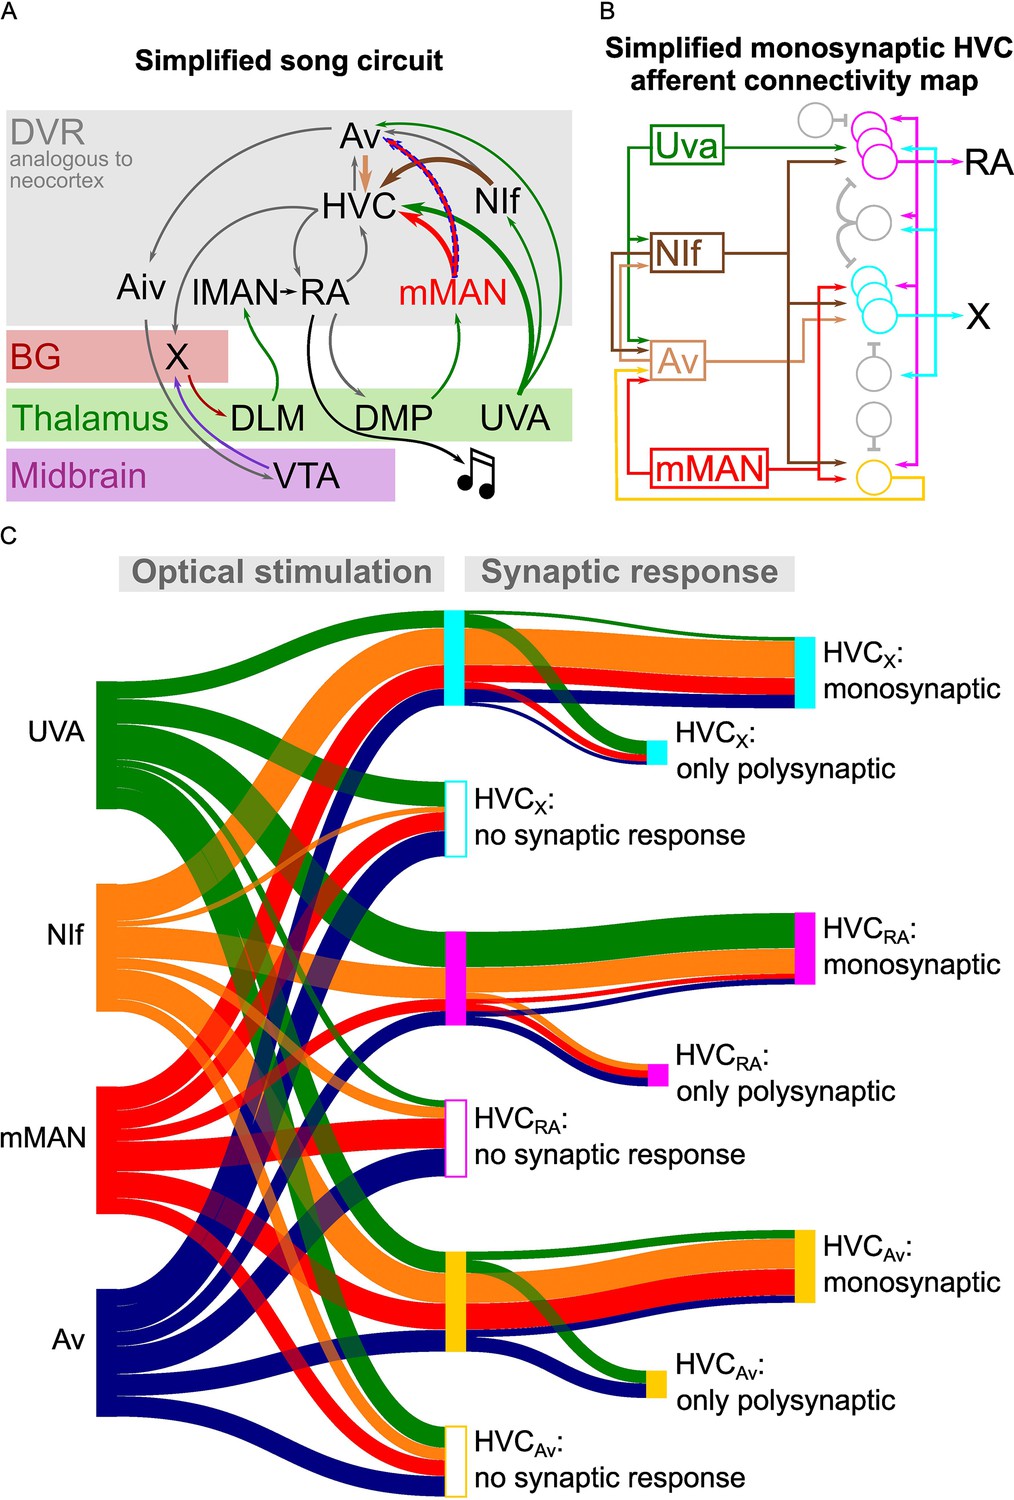
Song circuitry summary and monosynaptic connectivity map of afferents to HVC-PNs.
(A) Schematic representing a simplified version of the long-range connectivity map for song. Colors represent the anatomical location of each projection: gray: DVR, red: basal ganglia, green: thalamus, purple: midbrain. HVC afferents described in this manuscript are highlighted by large arrows. The novel mMAN-Av projection is highlighted by a dashed outline. (B) Schematic of the HVC afferent connectivity map resulting from the present work, complemented with projections between HVC afferent areas (on the left) and between HVC projection neurons as per previous reports (on the right). For conceptualization purposes, afferent connectivity to HVC-PNs is shown only when the rate of monosynaptic connectivity reaches 50% of neurons examined: NIf monosynaptically contacts all three HVC-PNs, while Uva is preferentially monosynaptically connected to HVCRA, mMAN to HVCX and HVCAv, and Av to HVCX. (C) Sankey diagram displaying the prevalence of connectivity for each input and cell subtype combination, based on polysynaptic and monosynaptic connectivity rates described in Figures 2–3 and 5–6.
Figure 7—figure supplement 1
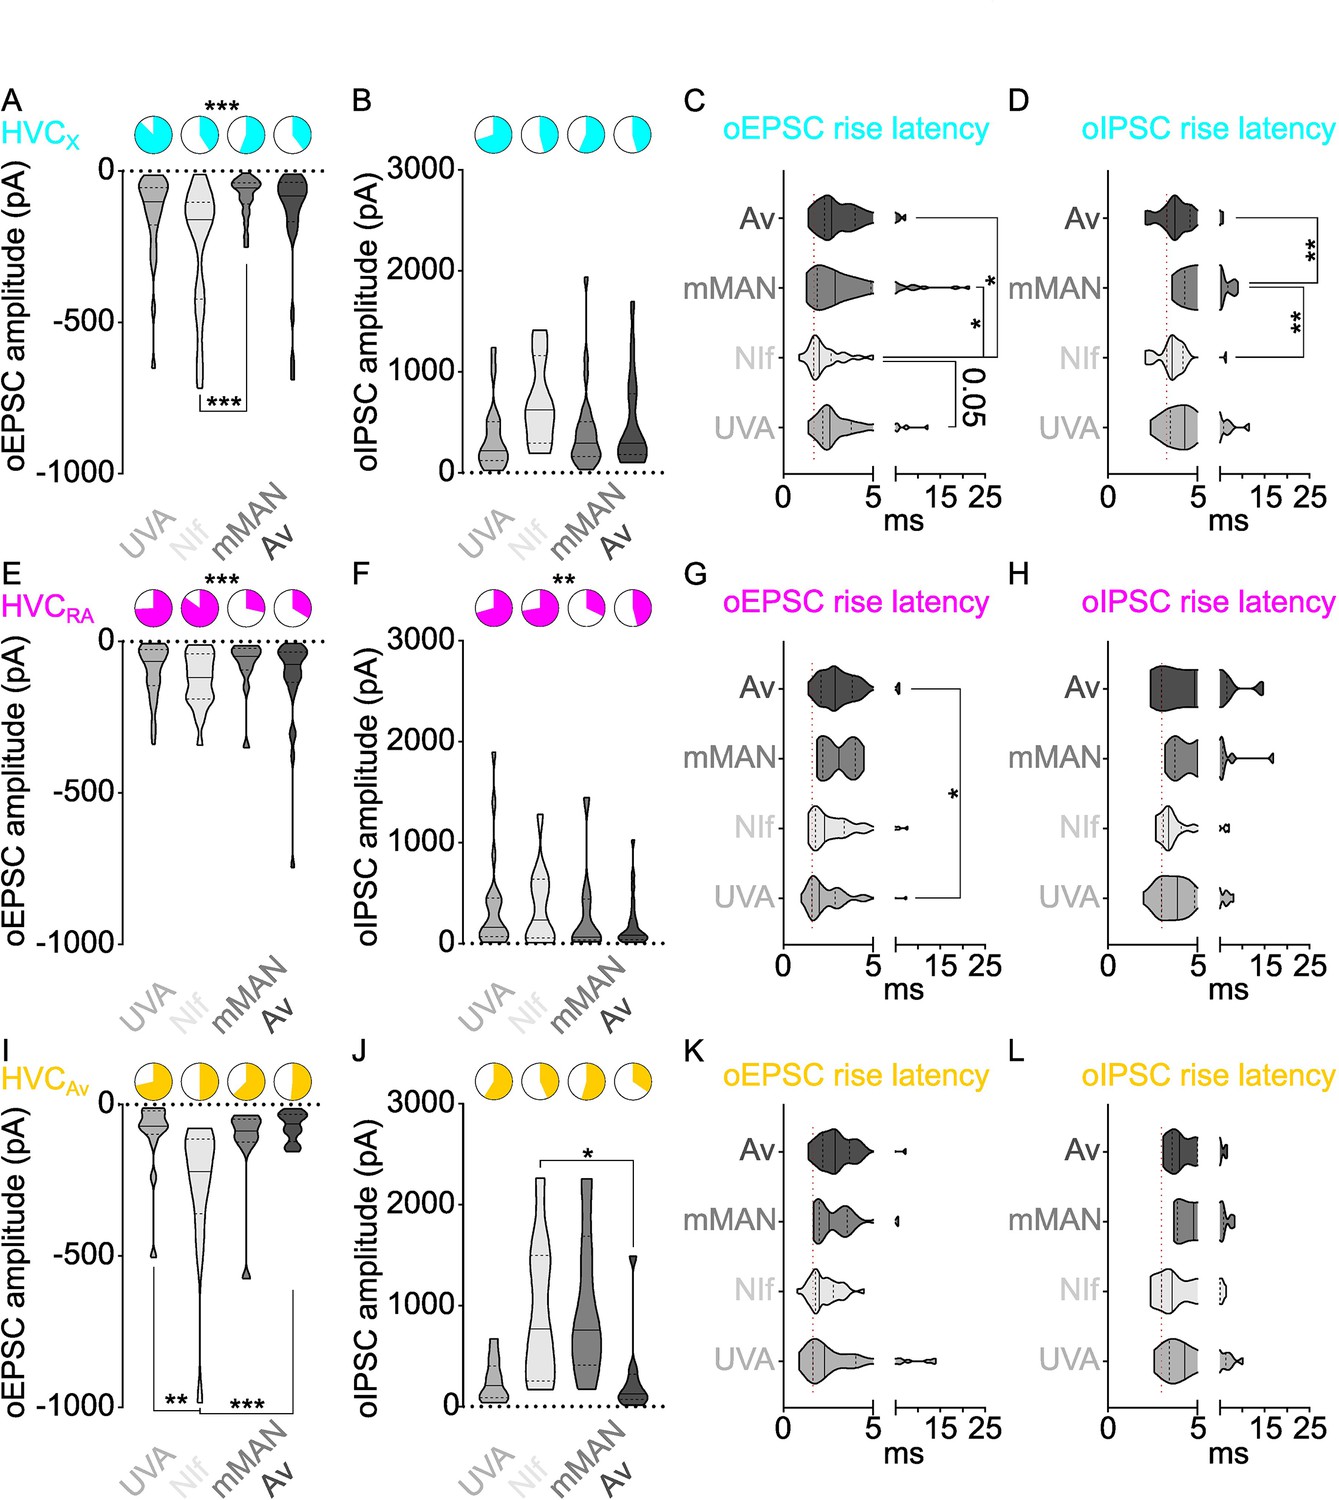
Cross-comparison of afferent polysynaptic connectivity within cell types (data from Figures 2, 3, 5 and 6).
(A) Pie charts representing the likelihood of evoking oEPSCs in HVCX, and violin plots representing the oEPSCs amplitude, when stimulating afferents from NIf, UVA, mMAN or Av (probability: Fisher’s exact test, p<0.001; amplitude: Kruskal-Wallis test, H(3)=17.18, p<0.001, NIf vs. UVA p=0.1695, NIf vs. mMAN, p<0.001, NIf vs. Av p=0.0993). (B) Same as (A) for oIPSCs (probability: Fisher’s exact test, p=0.2828; amplitude: Kruskal-Wallis test, H(3)=5.008, p=0.1712). (C) Violin plots reporting the oEPSC rise latency in HVCX upon stimulation of the four afferents (Kruskal-Wallis test, H(3)=11.91, p=0.0077, NIf vs. UVA p=0.0534, NIf vs. mMAN, p=0.0119, NIf vs. Av p=0.0345). (D) Same as (C) for oIPSCs (Kruskal-Wallis test, H(3)=19.23, p<0.001, NIf vs. UVA p=0.5428, NIf vs. mMAN, p=0.0016, NIf vs. Av p>0.9999, mMAN vs. Av p=0.0028). (E–H) Same as (A-D) but for HVCRA. (E) (probability: Fisher’s exact test, p<0.001; amplitude: Kruskal-Wallis test, H(3)=3.594, p=0.3088). (F) (probability: Fisher’s exact test, p=0.0075; amplitude: Kruskal-Wallis test, H(3)=2.132, p=0.5454). (G) (Kruskal-Wallis test, H(3)=12.44, p=0.0060, NIf vs. UVA p>0.999, NIf vs. mMAN, p=0.6258, NIf vs. Av p=0.3175, UVA vs. Av p=0.0128). (H) (Kruskal-Wallis test, H(3)=6.622, p=0.0850). (I–L) Same as (A-D) but for HVCAv. (I) (probability: Fisher’s exact test, p=0.3150; amplitude: Kruskal-Wallis test, H(3)=18.46, p<0.001, NIf vs. UVA p=0.0016, NIf vs. mMAN, p=0.0929, NIf vs. Av p=0.0010). (J) (probability: Fisher’s exact test, p=0.1869; amplitude: Kruskal-Wallis test, H(3)=12.52, p=0.0058, NIf vs. UVA p=0.1043, NIf vs. mMAN, p>0.999, NIf vs. Av p=0.0405). (K) (Kruskal-Wallis test, H(3)=6.441, p=0.0920). (L) (Kruskal-Wallis test, H(3)=7.653, p=0.0538).
Additional files
Download links
A two-part list of links to download the article, or parts of the article, in various formats.
Downloads (link to download the article as PDF)
Open citations (links to open the citations from this article in various online reference manager services)
Cite this article (links to download the citations from this article in formats compatible with various reference manager tools)
Synaptic connectivity of sensorimotor circuits for vocal imitation in the songbird
eLife 14:RP104609.
https://doi.org/10.7554/eLife.104609.3


