Inhibition of p38-MK2 pathway enhances the efficacy of microtubule inhibitors in breast cancer cells
- McArdle Laboratory for Cancer Research, Department of Oncology, University of Wisconsin-Madison, United States
- Molecular Cellular Pharmacology Graduate Program, University of Wisconsin-Madison, United States
- Department of General Surgery, Graduate School of Medicine, Chiba University, Japan
- Department of Biomedical Science, University of North Dakota School of Medicine and Health Science, United States
- Department of Biochemistry and Molecular Biology, Colorado State University, United States
- Carbone Comprehensive Cancer Center, University of Wisconsin-Madison, United States
Figures
Figure 1
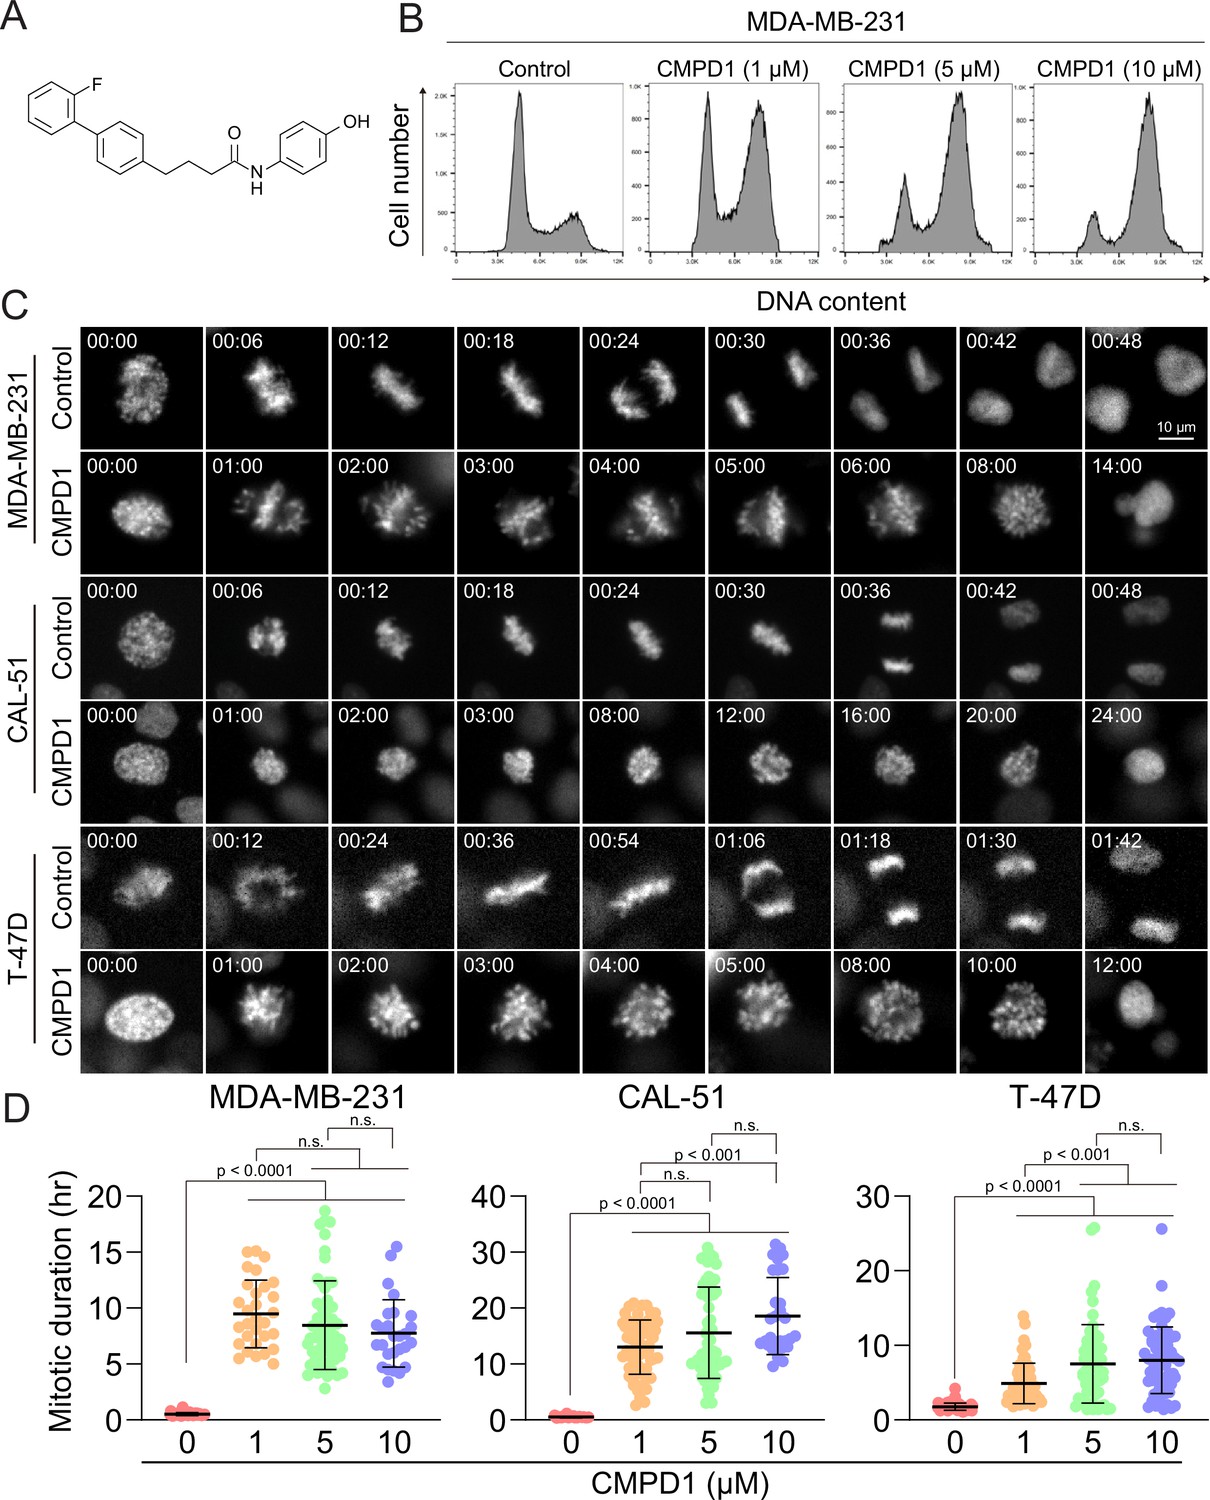
CMPD1 induced severe mitotic arrest in multiple cancer cell lines.
(A) Chemical structure of CMPD1. (B) FACS analysis of MDA-MB-231 cells treated with DMSO or 1, 5, or 10 µM CMPD1 for 24 hr. (C) Representative time-lapse images of MDA-MB-231, CAL-51, and T-47D cells treated with either DMSO or 5 μΜ CMPD1. Time is indicated in minutes post-nuclear envelope breakdown (NEBD). (D) Quantification of mitotic duration of MDA-MB-231, CAL-51, and T-47D treated with DMSO, 1, 5, or 10 μΜ CMPD1. n=30–60 cells pooled from two biological replicates. Results are the mean ± standard deviation (s.d.). The p-value was calculated using Tukey’s multiple comparison test.
Figure 2 with 3 supplements
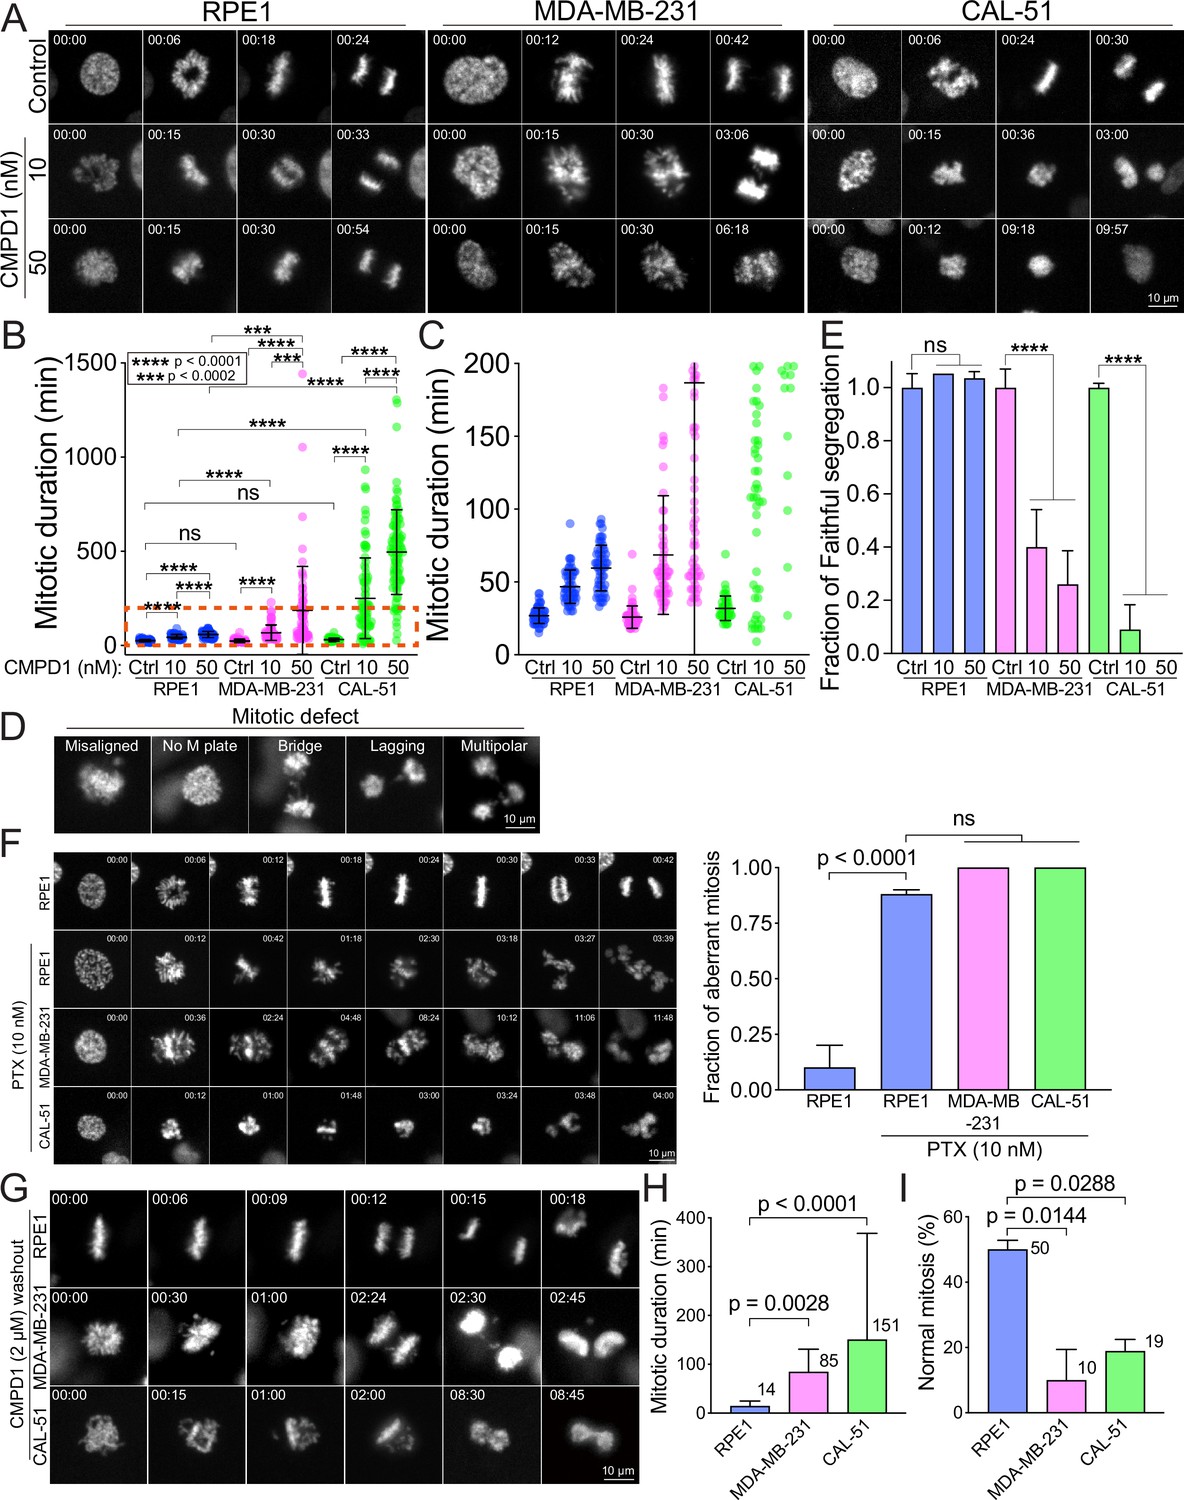
CMPD1 treatment specifically attenuates mitotic fidelity of cancer cells.
(A) Representative time-lapse images (interval: 3 min) of RPE1, MDA-MB-231, and CAL-51 cells treated with DMSO or low dose of CMPD1 (10 and 50 nM). Time is indicated in minutes post-nuclear envelope breakdown (NEBD). (B) Quantification of mitotic duration of cells as shown in (A). n=70, 60, 60, 60, 60, 65, 50, 84, 101 cells from left to right. (C) The enlarged plot of a red box region as shown in (B). (D) Representative images of mitotic defects. Note that ‘misaligned’ and ‘no metaphase (M) plate’ were annotated only when the cells exhibited this phenotype upon anaphase onset. (E) Normalized fraction of mitotic cells exhibiting accurate chromosome segregation in each condition. The data derived from CMPD1-treated cells were normalized to the data derived from DMSO-treated cells for each cell line. (F) Left: representative time-lapse images (interval: 3 min) of untreated RPE1 cells, and RPE1, MDA-MB-231, and CAL-51 cells treated with 10 nM PTX. Right: the quantification of the fraction of mitotic cells showing mitotic errors. The p-value was calculated using Tukey’s multiple comparisons test. Time is indicated in minutes post-washout. (G) Representative images of RPE1, MDA-MB-231, and CAL-51 cells in CMPD1 washout experiments. Briefly, cells were treated with 2 μΜ CMPD1 for 4 hr, followed by a wash with complete media and live-cell imaging. Time is indicated in minutes post-washout. (H) The mitotic duration of mitotic cells that were arrested by CMPD1 in the beginning of the imaging. The mitotic duration was defined as the time from the start of the imaging to anaphase onset or mitotic exit. The mean value was shown at the top right of each condition. n=54, 60, and 37 cells for RPE1, MDA-MB-231, and CAL-51 cells, respectively. The p-value was calculated using Tukey’s multiple comparisons test. (I) Quantification of the percentage of mitotic cells showing normal chromosome segregation. The mean value was shown at the top right of each condition. n=50 cells in each condition pooled from two biological replicates. The p-value was calculated using Tukey’s multiple comparisons test. The results are the mean ± s.d.
Figure 2—figure supplement 1
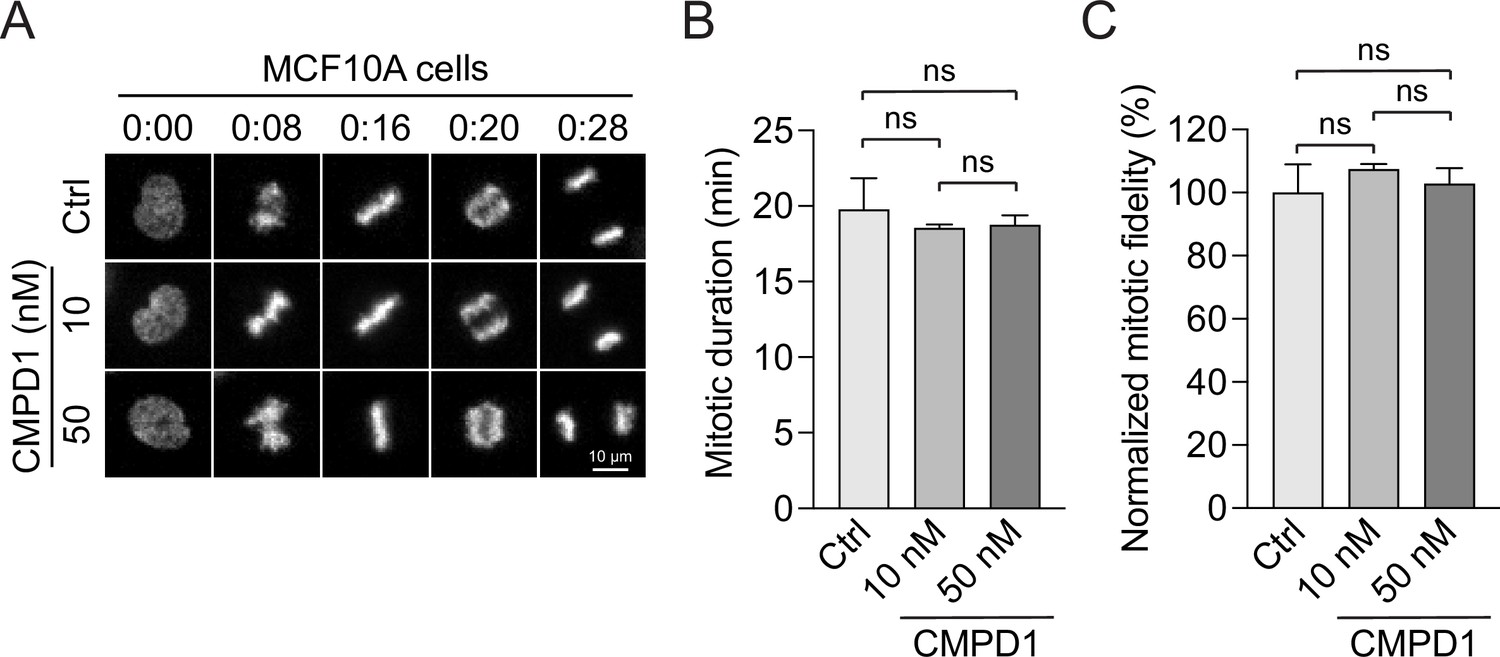
Low-dose CMPD1 does not decrease mitotic fidelity of MCF10A cells.
(A) Representative time-lapse images (interval: 4 min) of MCF10A cells treated with DMSO or low dose of CMPD1 (10 or 50 nM). DNA of MCF10A cells was stained by SiR-DNA. Time is indicated in minutes post-nuclear envelope breakdown (NEBD). (B) Quantification of mitotic duration (from NEBD to anaphase onset) of cells as shown in (A). (C) Quantification of the normalized percentage of mitotic cells showing normal chromosome segregation. Data in each condition are normalized to those in control cells. Results are the mean ± s.d. Two biological replicates were performed for each condition. The statistical comparison was conducted using Tukey’s multiple comparison test.
Figure 2—figure supplement 2
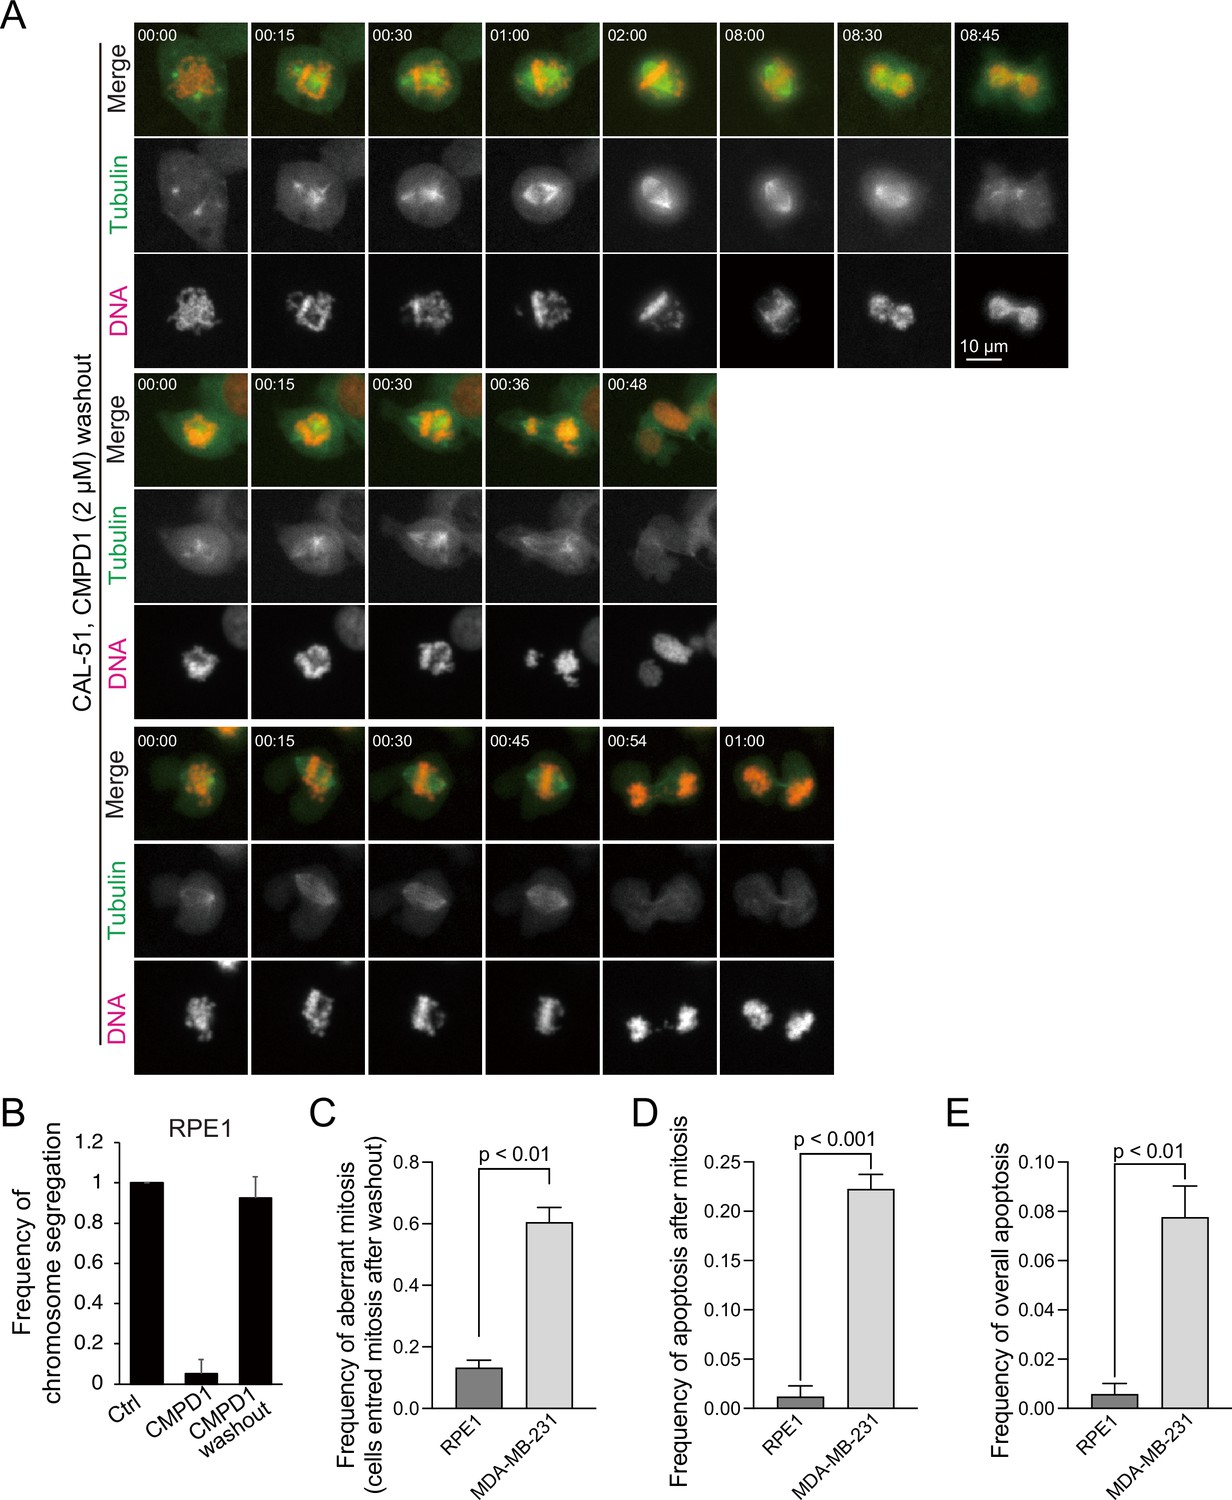
Cancer cells exhibited higher sensitivity to CMPD1.
(A) Representative time-lapse images (interval: 3 min) of tubulin-mNeonGreen and H2B-mScarlet CAL-51 cells after CMPD1 washout. Time is indicated in minutes post-nuclear envelope breakdown (NEBD). (B) The percentage of mitotic RPE1 cells with normal chromosome segregation in the presence of DMSO, 2 μΜ CMPD1, or after washout of 2 μΜ CMPD1. n=at least 100 cells pooled from two biological replicates for each condition. (C) Quantification of the frequency of aberrant mitosis for cells that entered mitosis after CMPD1 washout. n=236 and 209 cells pooled from two biological replicates (from left to right). (D) Quantification of the frequency of apoptosis during interphase followed by mitosis after CMPD1 washout. n=2557 and 824 cells pooled from three to four biological replicates (from left to right). (E) Quantification of the frequency of overall apoptosis (including mitosis and interphase) after CMPD1 washout. n=2557 and 824 cells pooled from two biological replicates (from left to right). The p-values were calculated using two-tailed t-test.
Figure 2—figure supplement 3
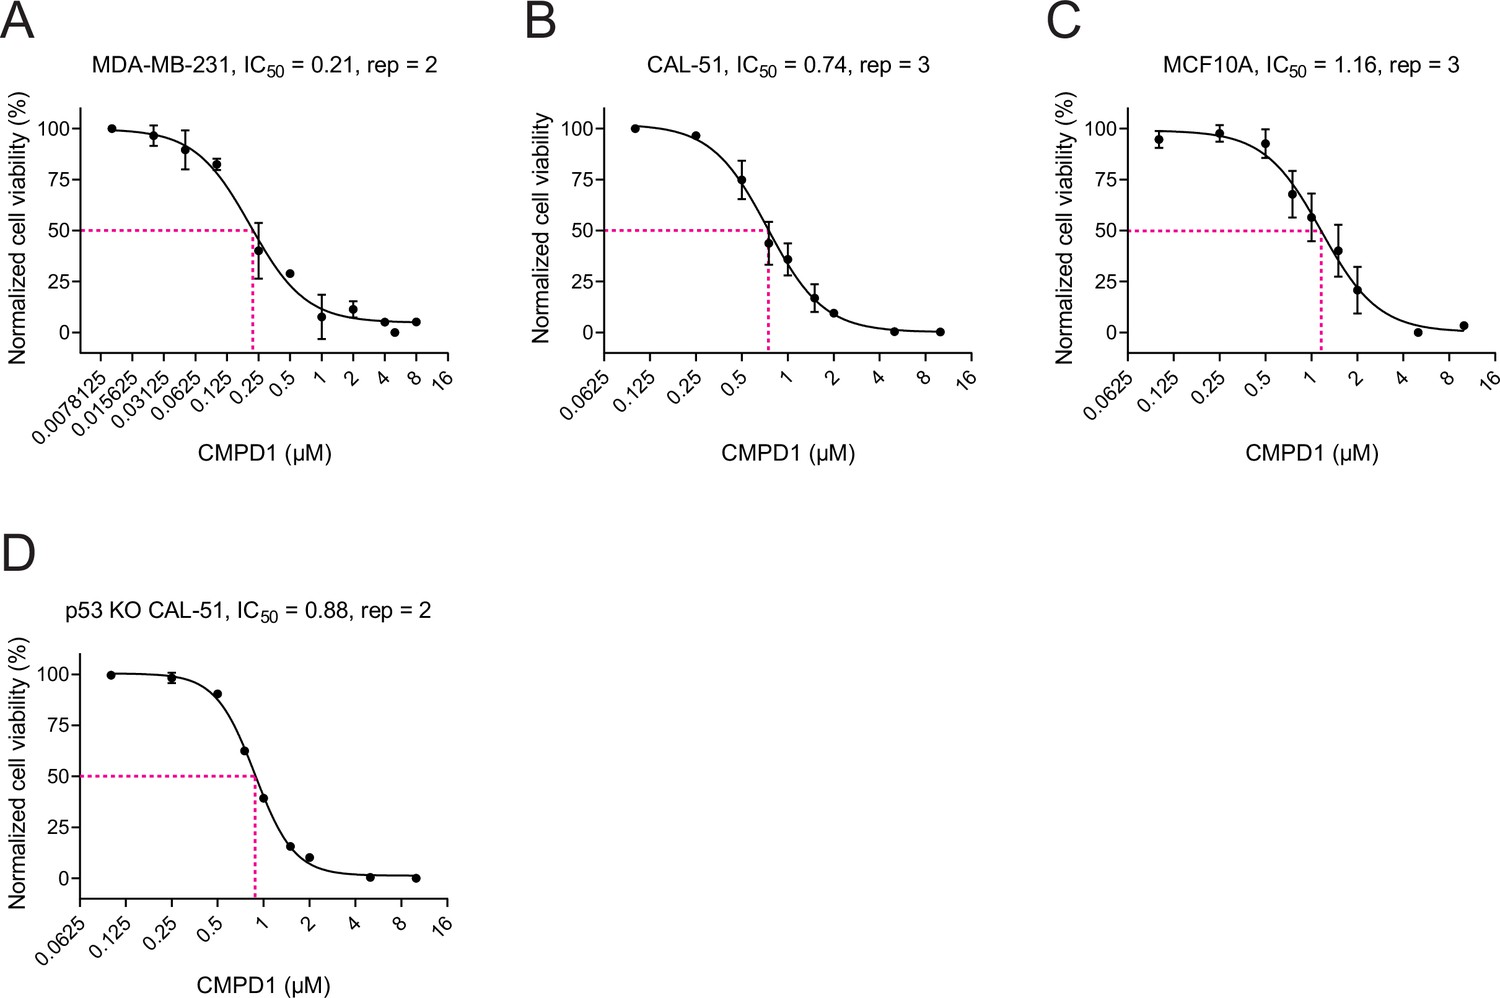
Determination of CMPD1 IC50 in MDA-MB-231, CAL-51, MCF10A, and p53 KO CAL-51 cell lines.
(A–D) The normalized cell viability of MDA-MB-231 cells (A), CAL-51 cells (B), MDA-MB-231 cells (C), and p53 KO CAL-51 cells (D) treated with different concentrations of CMPD1. IC50 and the number of biological replicates are shown above each plot.
Figure 3 with 3 supplements
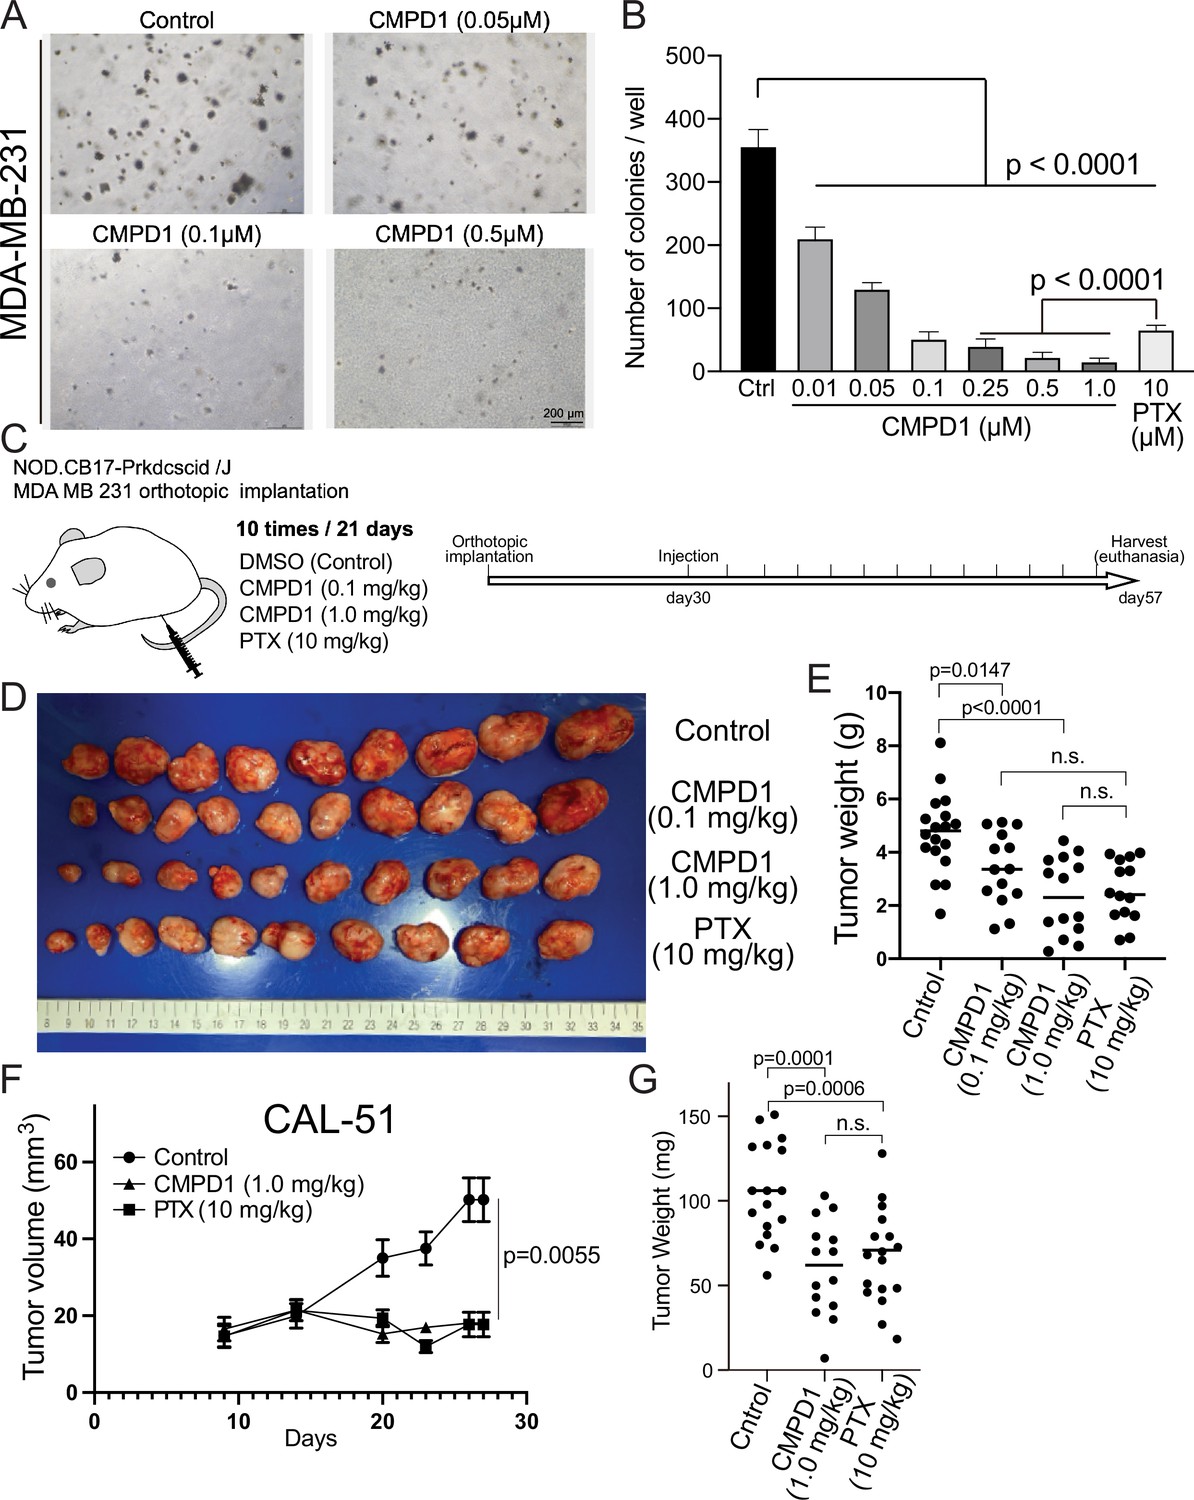
CMPD1 inhibits both anchorage-independent growth and tumor growth in mice.
(A) Representative images of anchorage-independent growth assay using MDA-MB-231 cells treated with DMSO, CMPD1 at different concentrations (0.01, 0.05, 0.1, 0.25, 0.5, and 1 µM), or 10 μΜ paclitaxel (PTX). (B) The normalized number of cell colonies formed in each condition. Results are the mean ± s.d. Three biological replicates were performed for each condition. The p-value was calculated using Tukey’s multiple comparison test. (C) Schematic diagram of the mouse xenograft experiment using MDA-MB-231 and the drug treatment schedule. (D) The photo of tumors in each condition at the time of necropsy. The tumors were arranged in order based on their size. (E) Quantification of the gross weight of tumors in the mouse xenograft experiment using MDA-MB-231 cells at the time of necropsy. The p-value was calculated using Tukey’s multiple comparison test. (F) Quantification of the tumor volume during the treatment regimen in the mouse xenograft experiment using CAL-51 cells. (G) Quantification of the gross weight of tumors in the mouse xenograft experiment using CAL-51 cells at the time of necropsy. The p-value was calculated using Tukey’s multiple comparison test.
Figure 3—figure supplement 1
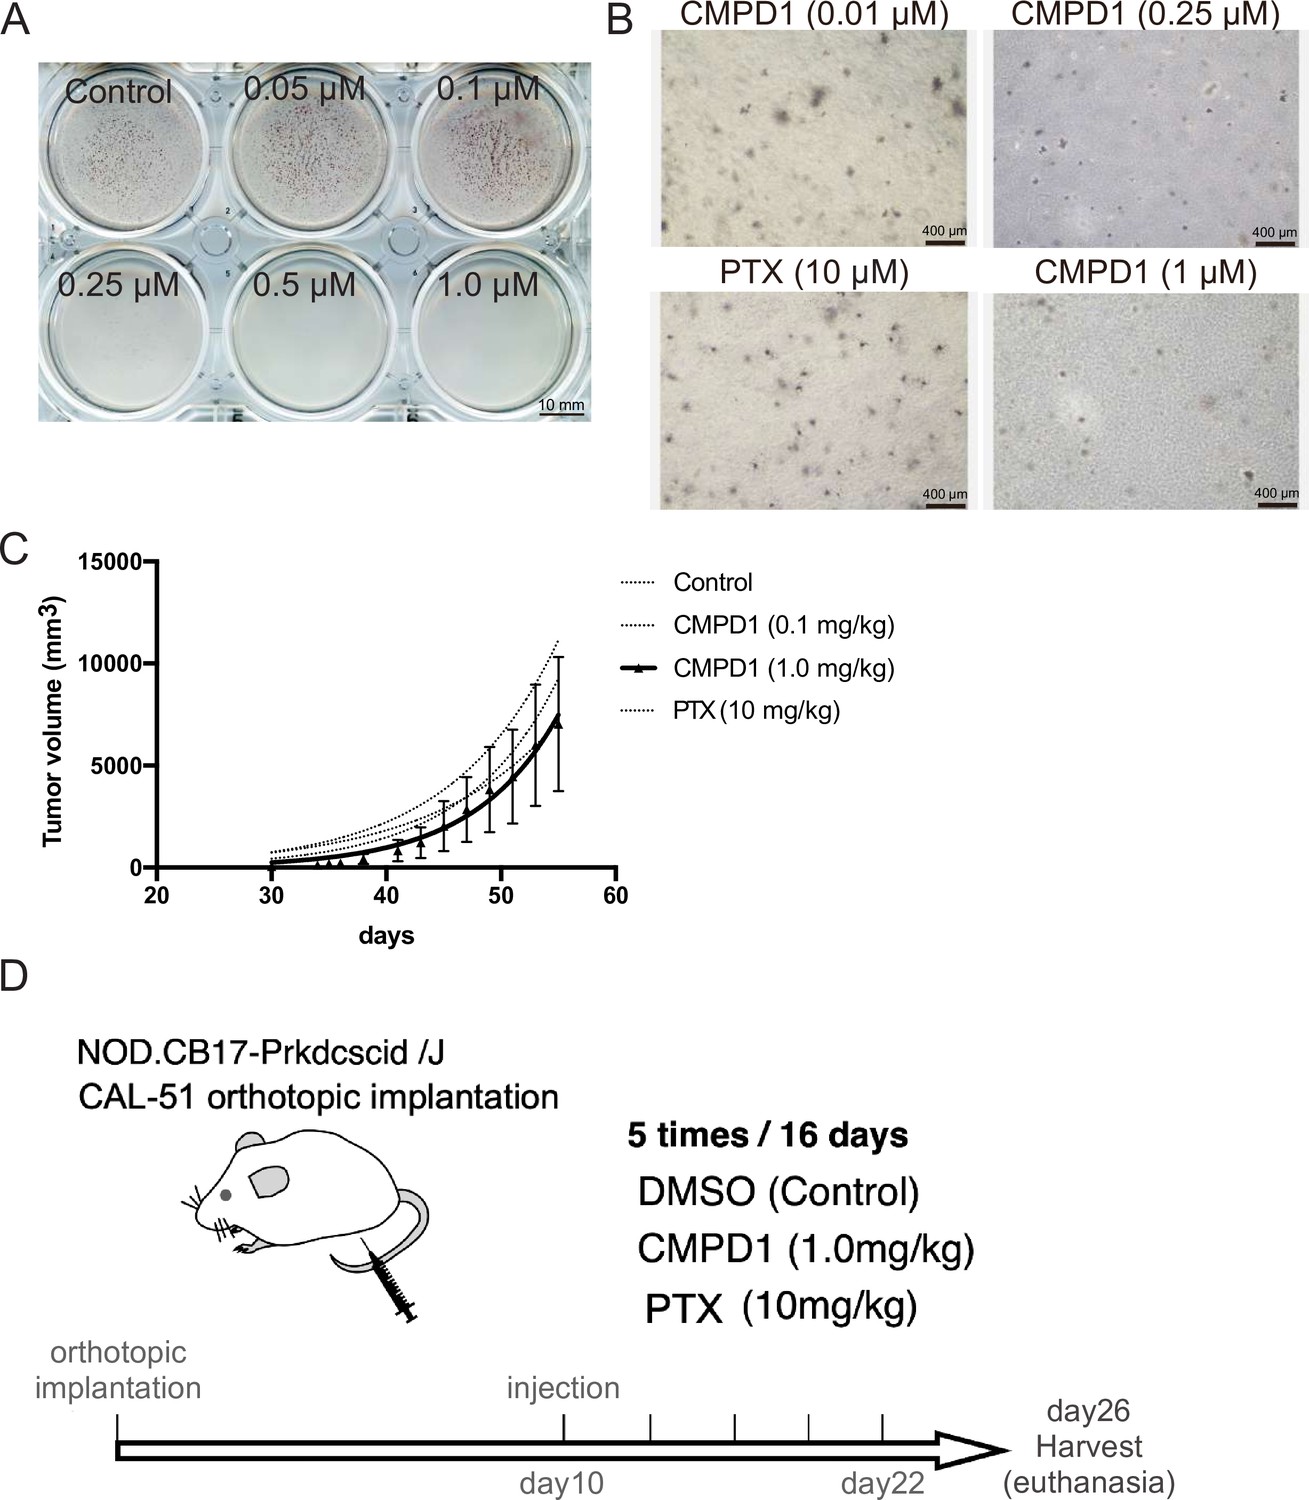
CMPD1 inhibits tumor growth in vitro and in vivo.
(A) The whole image of the anchorage-independent growth assay as shown in Figure 3A. (B) Additional images of 10 μΜ paclitaxel (PTX)-treated or 0.01, 0.25, or 1 μΜ CMPD1-treated MDA-MB-231 cells subjected to anchorage-independent assay which are related to Figure 3A and B. (C) Quantification of the tumor volume in each condition as shown in Figure 3F and G. ** indicates that two PTX-treated mice died on day 48. (D) Schematic diagram of the mouse xenograft experiment using CAL-51 cells and the drug treatment schedule.
Figure 3—figure supplement 2
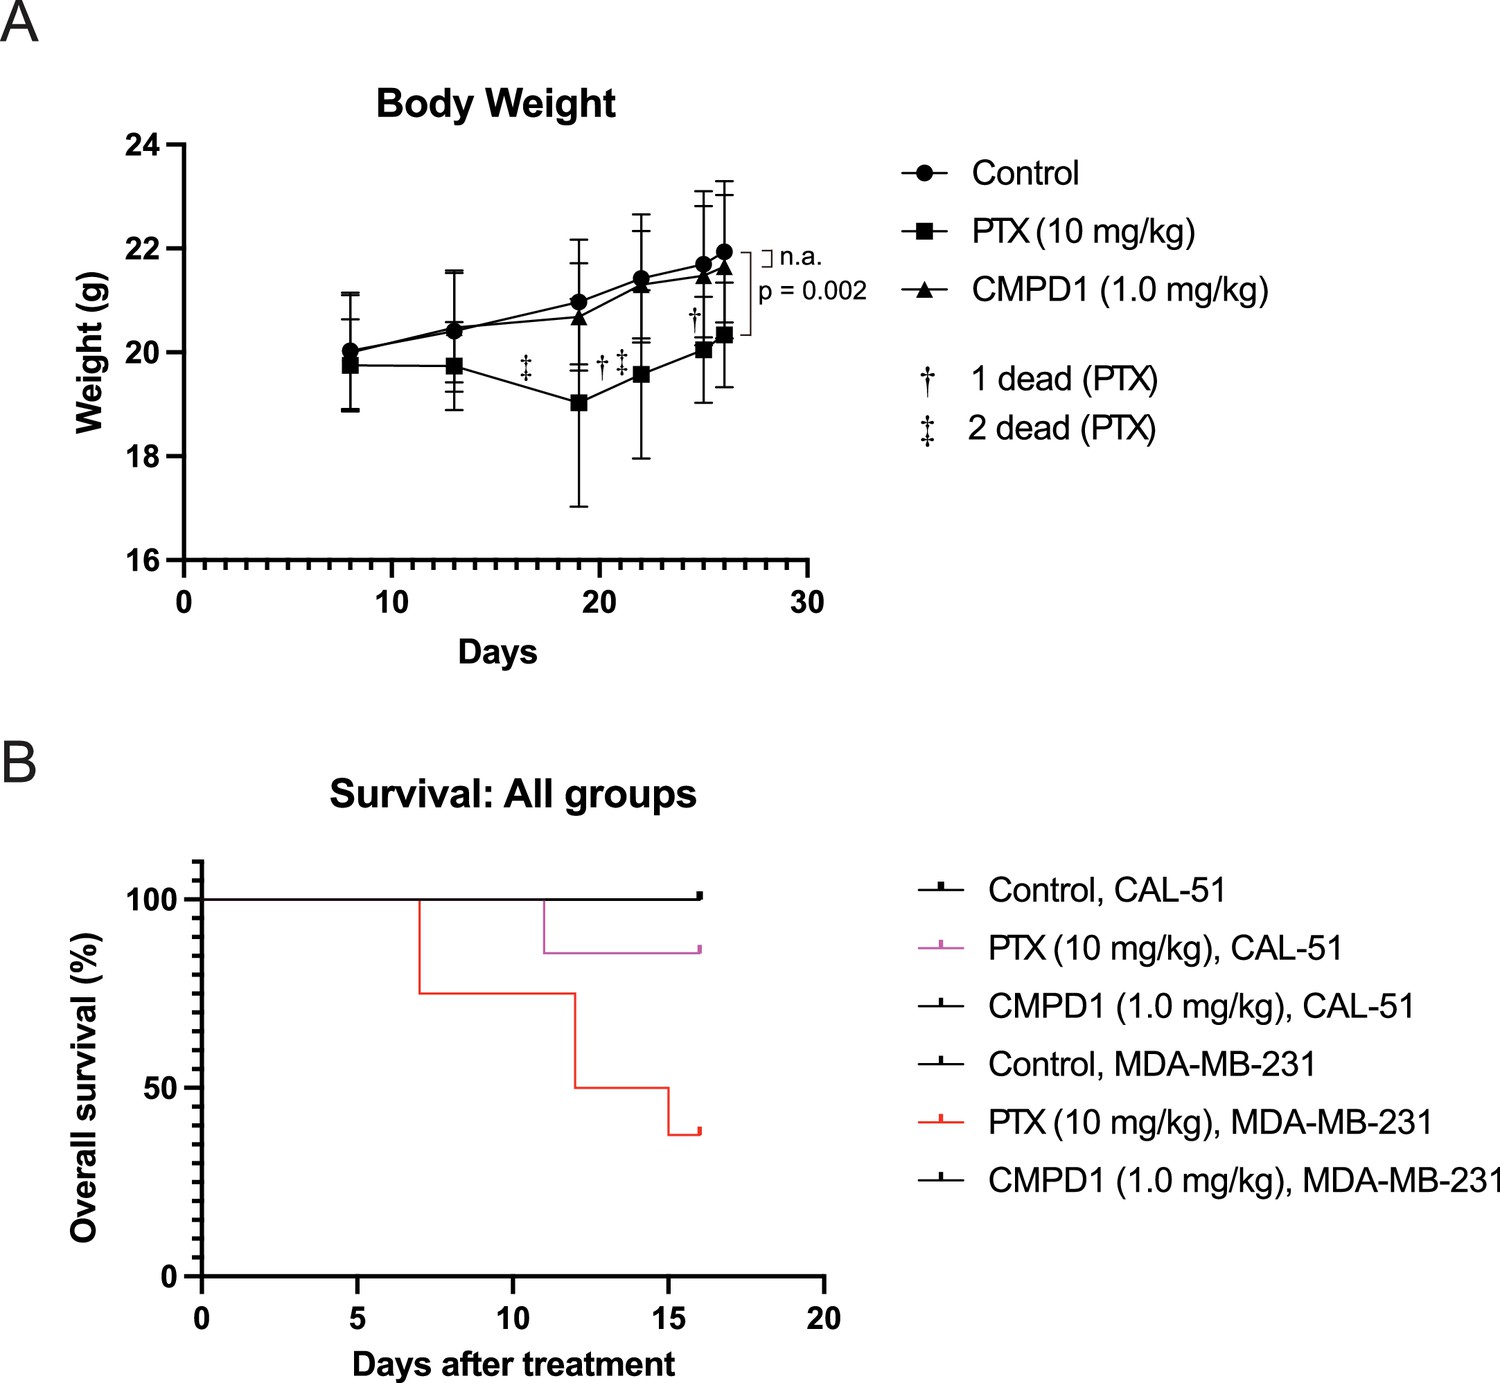
Body weight change and overall survival rate in mouse xenograft experiments.
(A) Longitudinal monitoring of body weight in mice undergoing xenograft treatment. (B) Kaplan-Meier survival analysis of mice during the treatment regime.
Figure 3—figure supplement 3
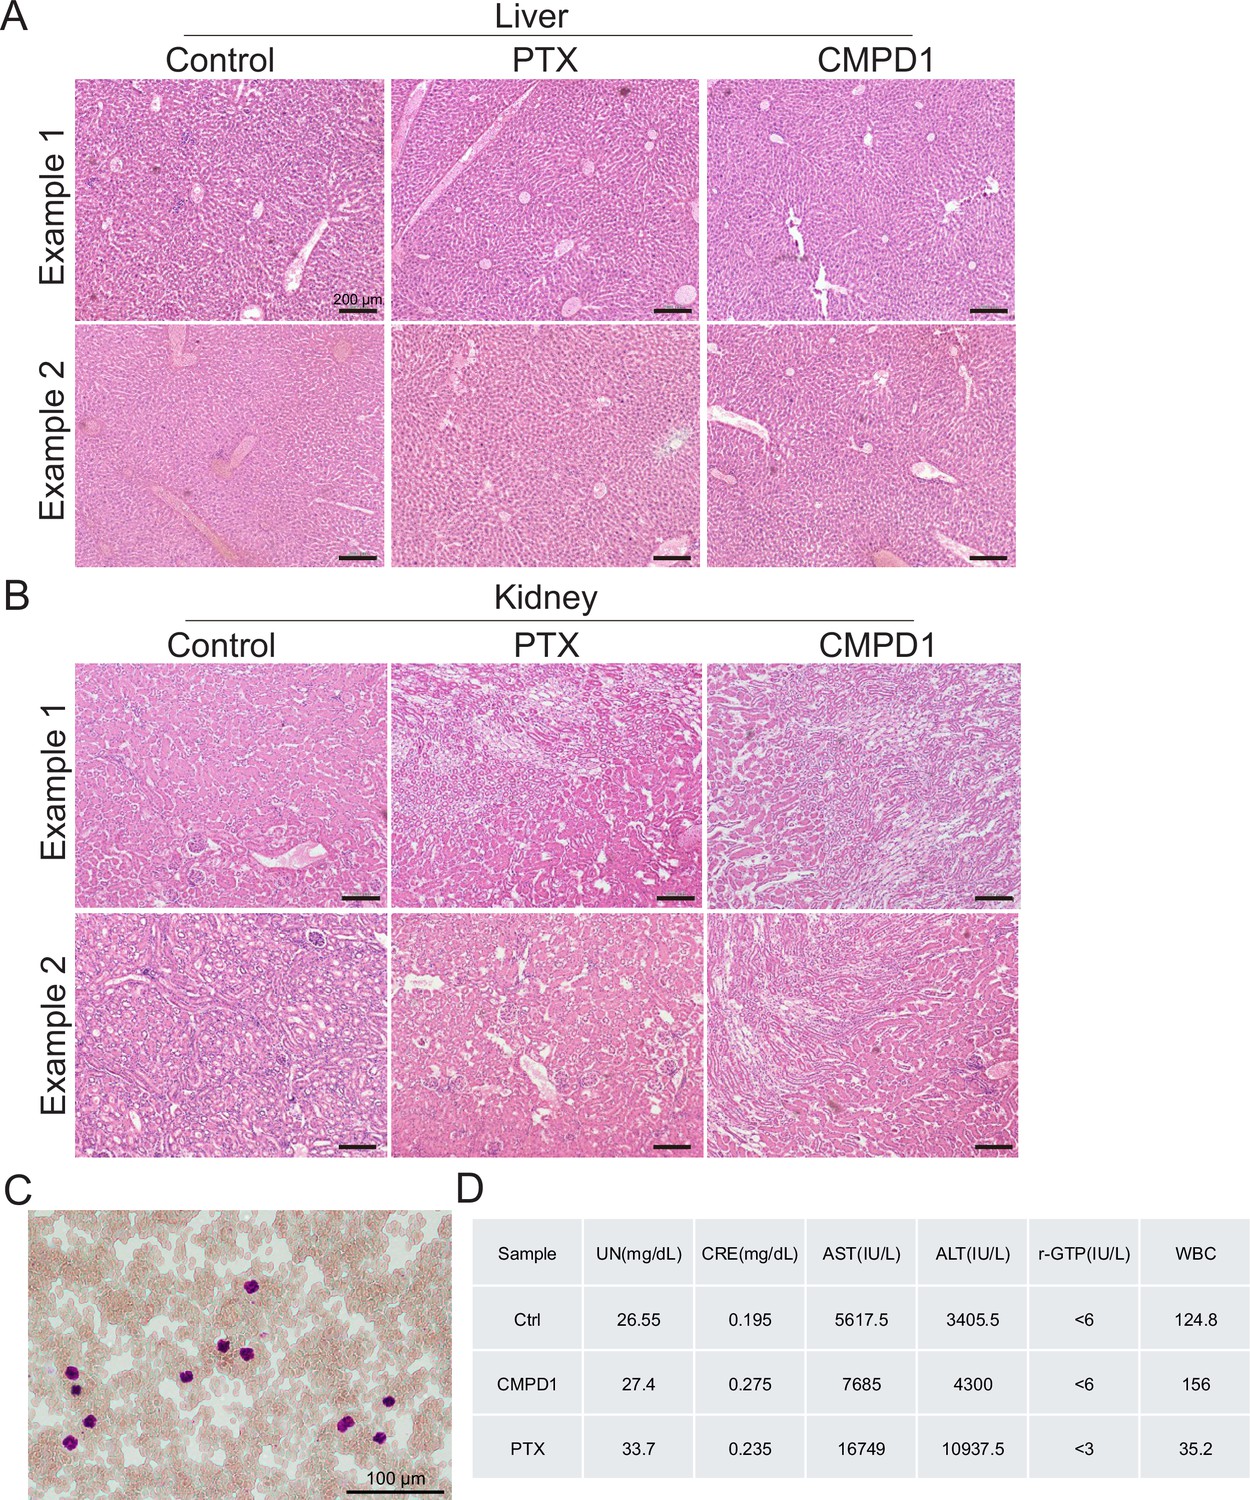
Histological and blood analyses in mouse xenograft experiments.
(A) Representative liver histology from vehicle-, paclitaxel (PTX)-, and CMPD1-treated mice. Examples 1 and 2 are derived from different individual animals. (B) Representative kidney histology from vehicle-, PTX-, and CMPD1-treated mice. Examples 1 and 2 are derived from different individual animals. Scale bars represent 200 µm. (C) Representative hematoxylin and eosin (H&E) staining of blood smears used for white blood cell (WBC) counting. (D) Quantification of blood markers reflecting liver and kidney function, as well as WBC counts. Results are the mean values of each group.
Figure 4
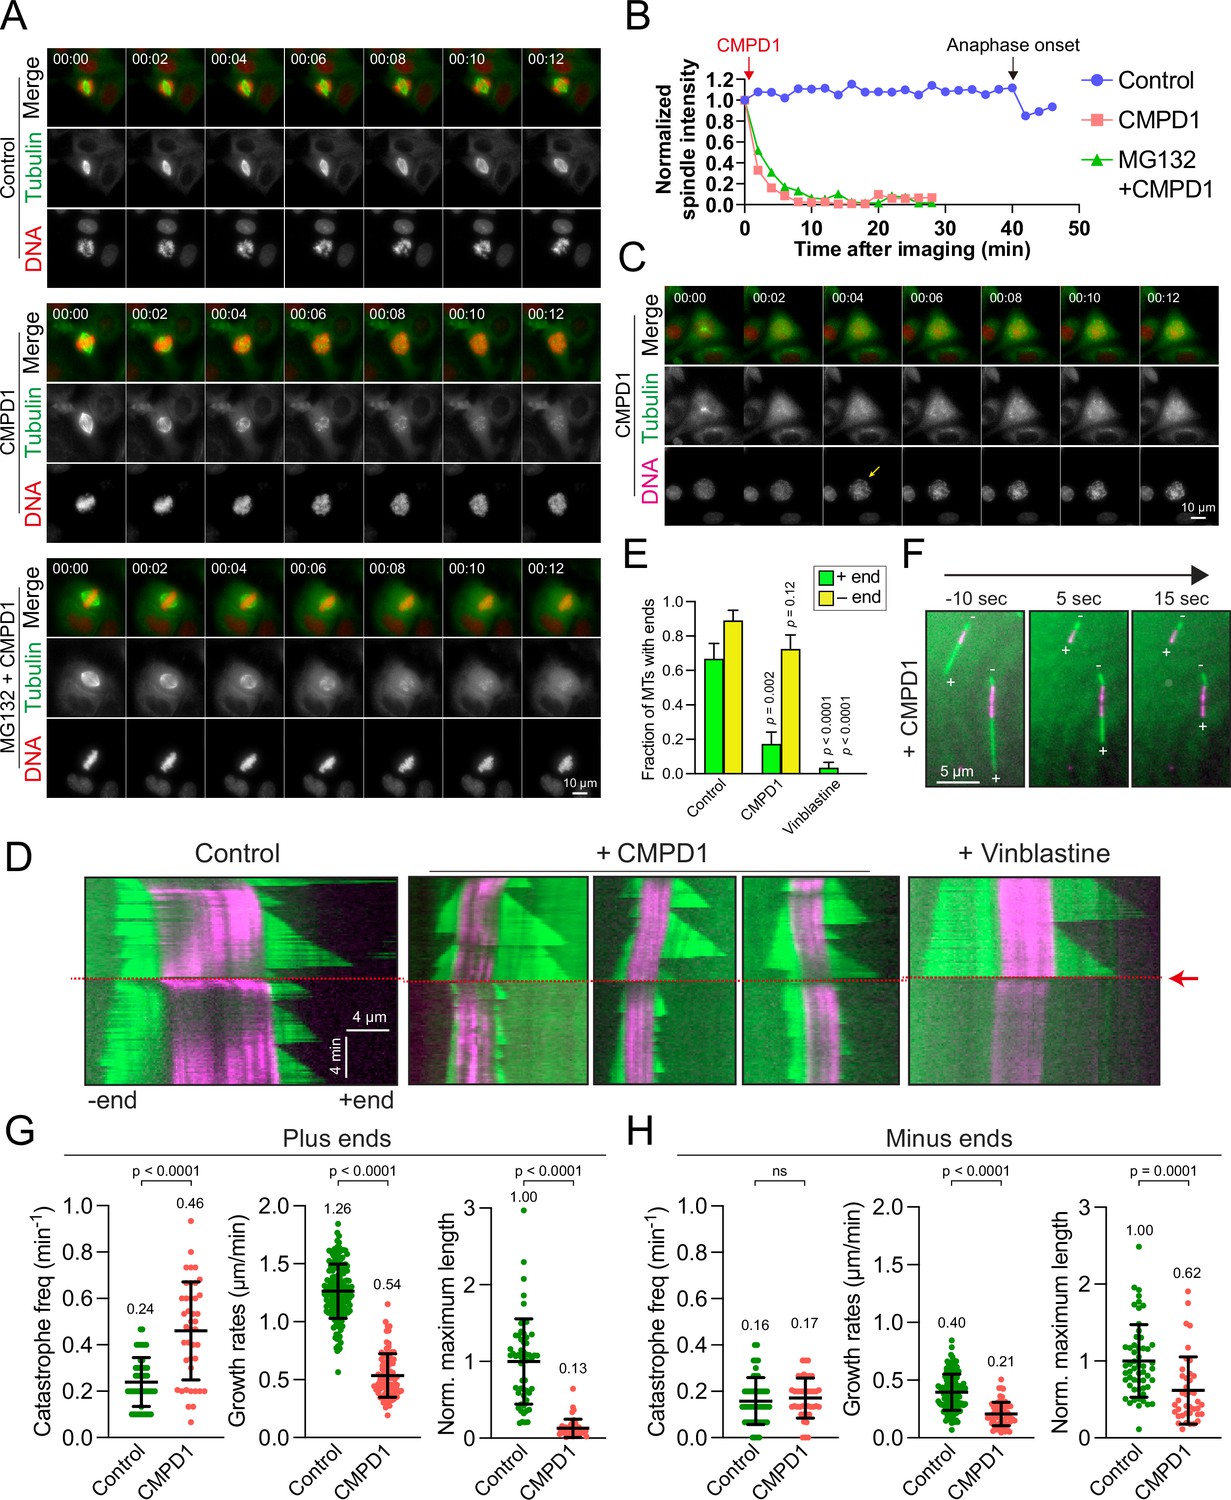
CMPD1 induces microtubule depolymerization.
(A) Representative time-lapse images of CAL-51 cells expressing α-tubulin-mNeonGreen and H2B-mScarlet upon the treatment with DMSO, 2 µM CMPD1, or 10 µΜ ΜG132 along with 2 µΜ CMPD1. CMPD1 was added into the cell culture media immediately after images at the first time point were acquired. Time is indicated in minutes. (B) The quantification of the signal levels of mitotic spindles over time in each condition as shown in (A). (C) Representative time-lapse images (interval: 2 min) of a G2 phase CAL-51 cell expressing α-tubulin-mNeonGreen and H2B-mScarlet in the presence of 2 μM CMPD1. Note that the two bright dots in the tubulin channel indicate the two clustered centrosomes before nuclear envelope breakdown (NEBD). The arrow in the DNA channel indicates the time of NEBD. Time is indicated in minutes. (D) Representative kymographs depicting microtubule plus- and minus-end dynamics before and after the addition of polymerization mix supplemented with 15 µM tubulin alone, or 15 µM tubulin supplemented with either 20 µM CMPD1 or 5 µM vinblastine, as indicated (GMPCPP-stabilized microtubule seeds, magenta; microtubules polymerized from seeds, green; see Materials and methods). Plus ends are positioned to the right, and minus ends are positioned to the left of the seeds in all kymographs. Red arrow and dashed line indicate the time of addition of tubulin alone or tubulin plus drug. (E) Plot depicting the fraction of microtubules with detectable plus or minus ends 1 min after addition of drug, or tubulin alone (n=27, 29, and 30 microtubules from left to right). Results are the mean ± s.d. (F) Representative images from a time-lapse sequence showing microtubule plus- and minus-end lengths 10 s prior to, and 5 and 15 s after the addition of polymerization mix supplemented with 20 µM CMPD1. (G) Plots depicting plus-end catastrophe frequencies (n=51 and 41 microtubules from left to right), plus-end growth rates (n=172 and 91 events from left to right), and normalized maximum length (n=55 and 41 microtubules from left to right) achieved over the imaging period. (H) Plots depicting minus-end catastrophe frequencies (n=51 and 41 microtubules from left to right), minus-end growth rates (n=129 and 63 events from left to right), and normalized maximum length (n=55 and 40 microtubules from left to right) achieved over the imaging period. Results are the mean ± s.d. Data were pooled from at least two to four biological replicates (G–H).
Figure 5
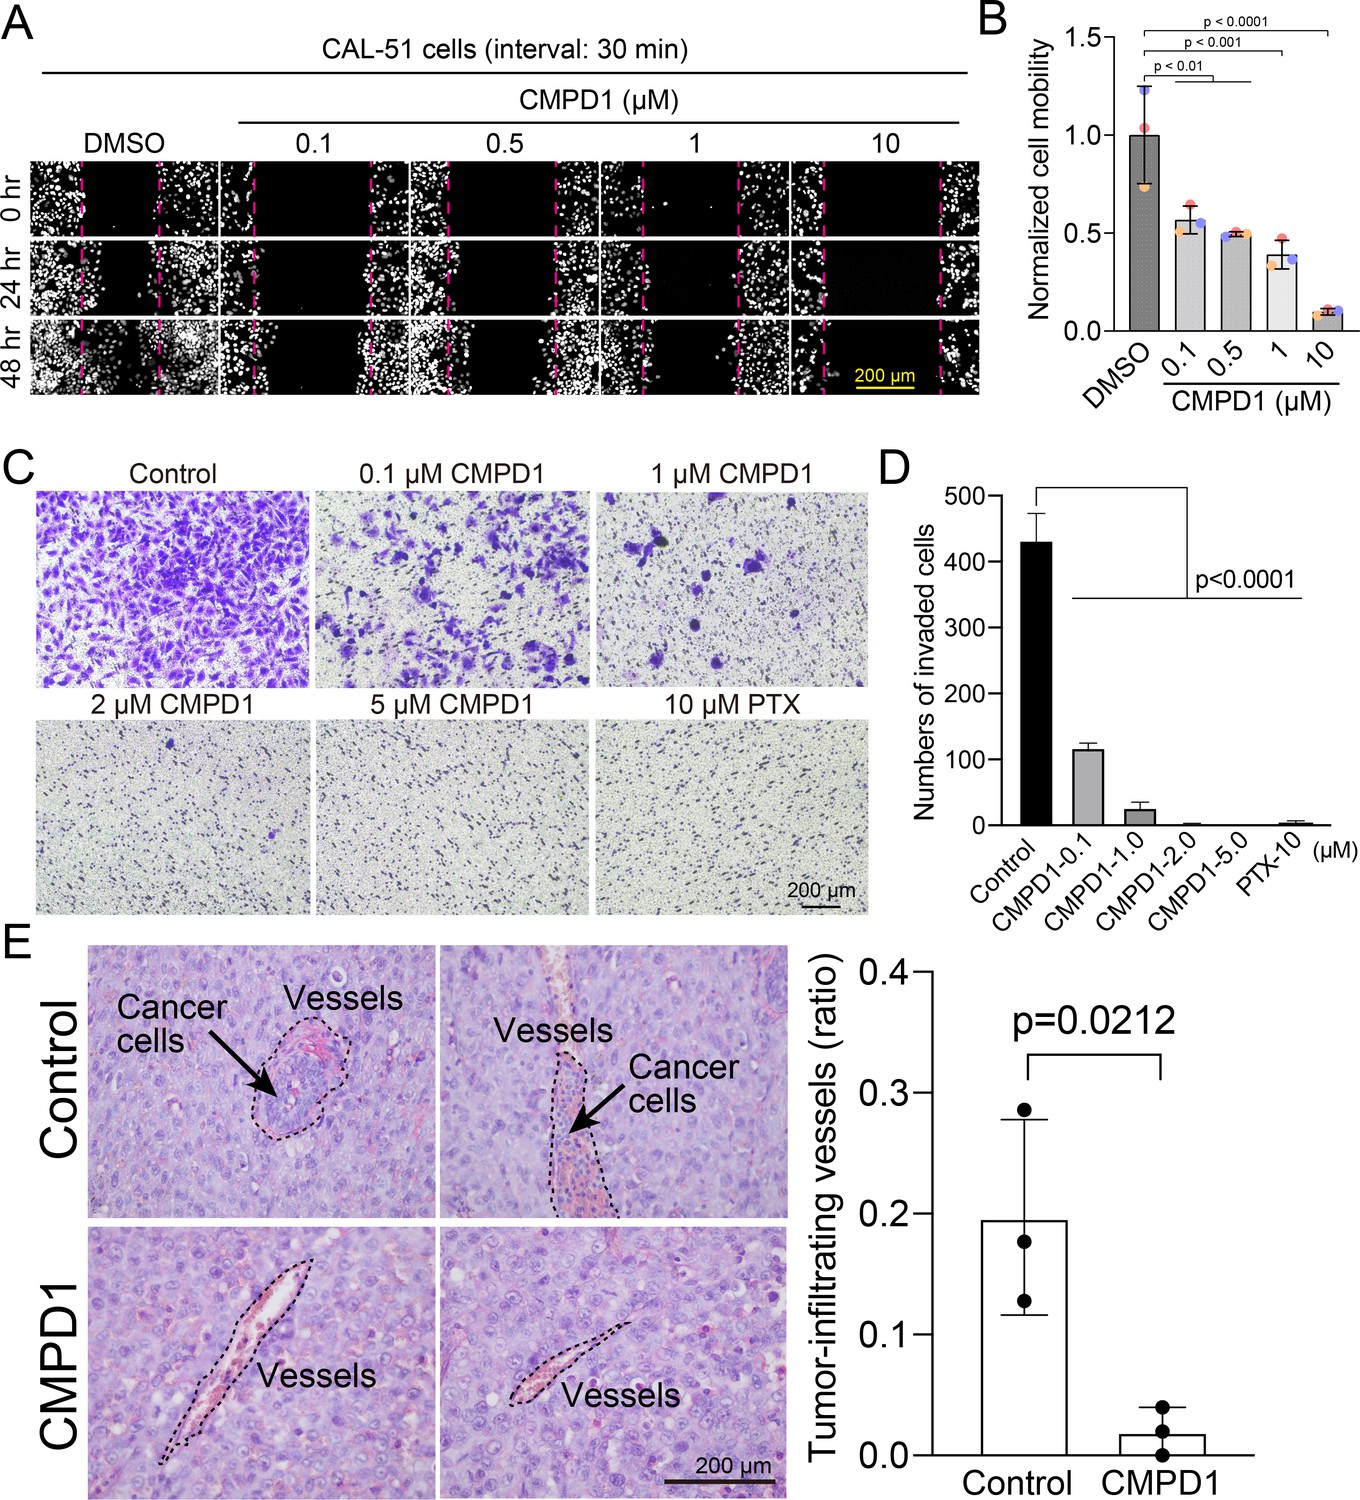
CMPD1 inhibits cancer cell migration and invasion.
(A) Representative images of H2B-mScarlet CAL-51 cells treated with DMSO or CMPD1 at different concentrations (0, 0.1, 0.5, 1, 10 μΜ) at three different time points (0, 24, and 48 hr posttreatment). A wound (cell-free zone) was created using a tip, followed by the addition of indicated drugs and live-cell imaging (interval: 30 min). (B) Quantification of cell migration speed when cells were treated with indicated drugs. Each condition was normalized to the speed of DMSO-treated cells. The distance between the edge of the wound was measured using the ImageJ macro. Results are the mean ± s.d. N=3 biological replicates. The p-value was calculated using Tukey’s multiple comparisons test. (C) Representative images of trans-well invasion assay using MDA-MB-231 cells treated with DMSO, CMPD1 (0.1, 1, 2, 5 μΜ), or 10 μΜ paclitaxel (PTX). The p-value was calculated using Tukey’s multiple comparison test. (D) The quantification of the average number of invaded cells in each condition as shown in (C). (E) Left: example images of blood vessels in xenograft tumors derived from mice treated with DMSO or 1.0 mg/kg CMPD1 as shown in Figure 3C. Two sets of example images with ×400 magnification acquired from different tumors were shown. Right: the quantification of the percentage of blood vessels infiltrated with cancer cells. Results are mean ± s.d. The p-value was calculated using two-tailed t-test.
Figure 6 with 4 supplements
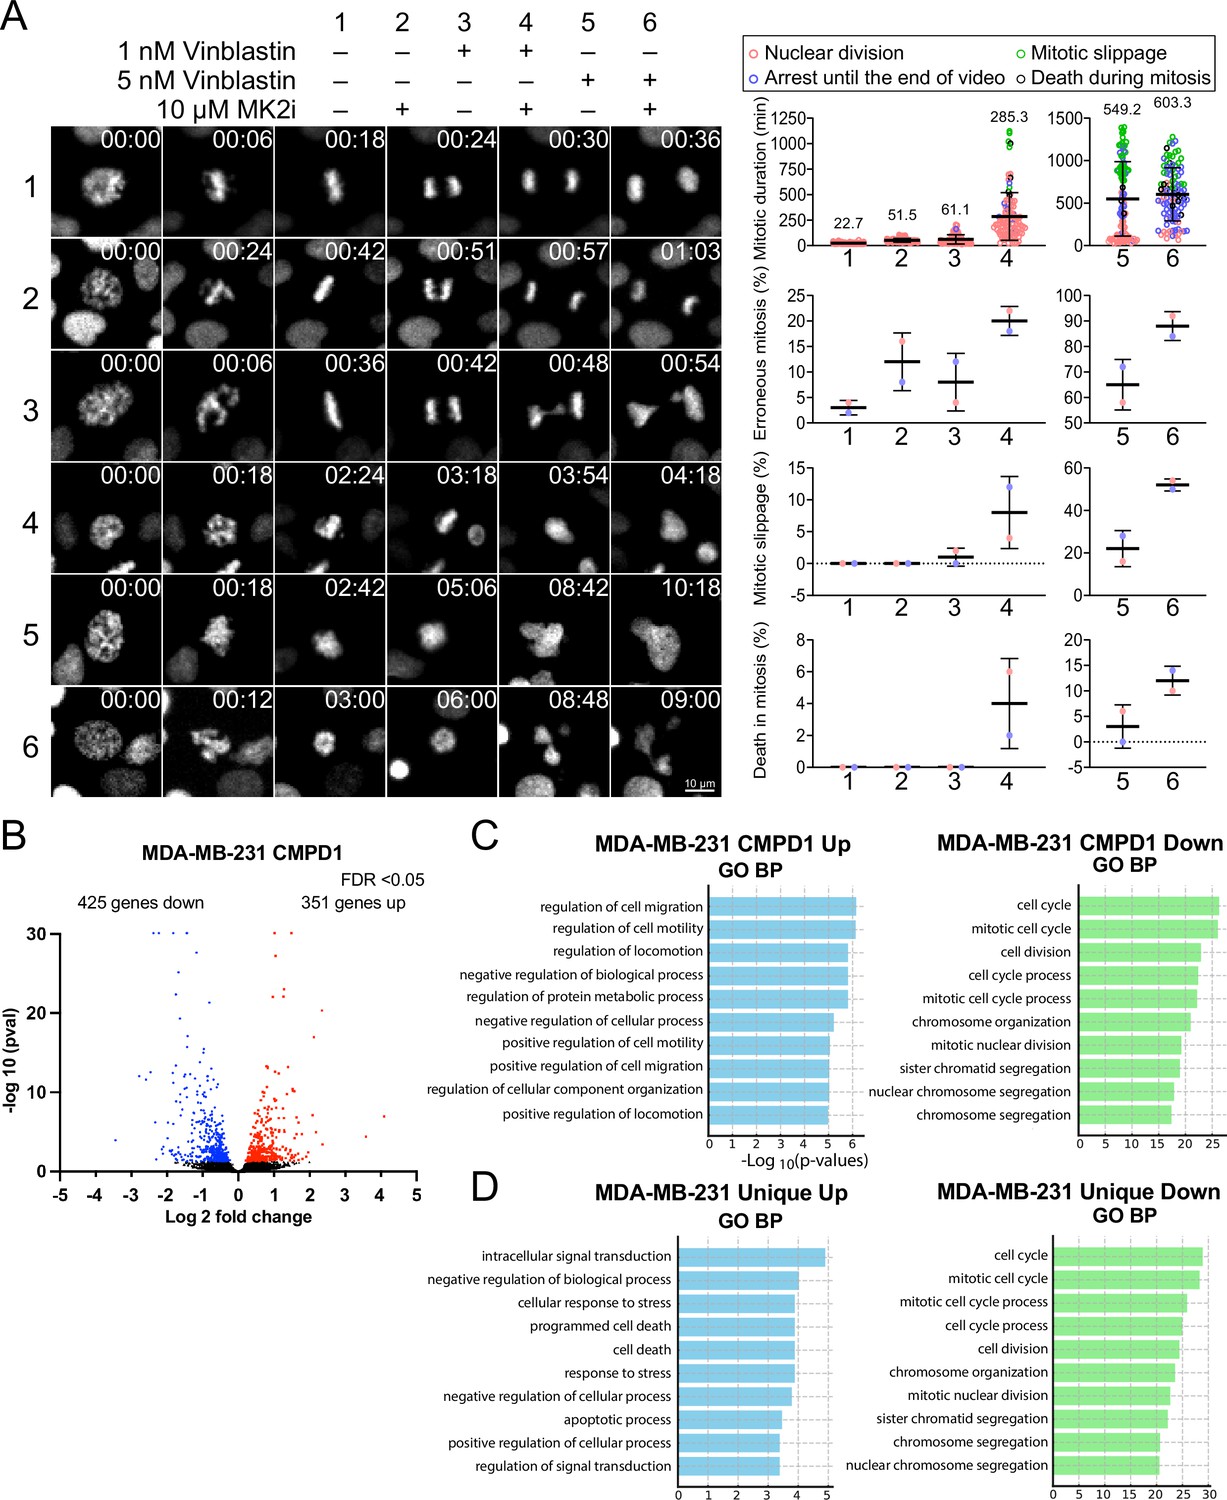
MK2 inhibition enhances the efficacy of microtubule inhibitors in cancer cells.
(A) Left: representative time-lapse images of mitotic CAL-51 cells treated with indicated combinations of drugs (10 μΜ MK2i, 1 nM vinblastine, 5 nM vinblastine). Right: quantification of the mitotic duration, mitotic error rate, mitotic slippage rate, and the frequency of death in mitosis. The fate of mitotic cells was color-coded as indicated above the quantification plots. N=100 cells pooled from two biological replicates for each condition. Time shown on the upper right corner of the representative images is indicated in minutes after nuclear envelope breakdown (NEBD). (B) Volcano plot displaying changes in gene expression following CMPD1 treatment in MDA-MB-231 cells. RNA-seq was conducted with three biological replicates. Differentially expressed genes (DEGs) are highlighted in red (upregulated) and blue (downregulated). (C) Pathway enrichment analysis of DEGs using the Gene Ontology (GO) Biological Processes (BP). Enrichment analysis was performed with the DAVID online tool. (D) Comparison of GO BP enrichment analysis of DEGs unique to MDA-MB-231 cells relative to RPE1 cells. Genes uniquely up- or downregulated in MDA-MB-231 cells, but not in RPE1 cells, were subjected to GO BP enrichment analysis.
-
Figure 6—source data 1
The list of differentially expressed genes in control MDA-MB-231 cells and in cells treated with CMPD1 or TPX.
- https://cdn.elifesciences.org/articles/104859/elife-104859-fig6-data1-v1.xlsx
-
Figure 6—source data 2
The list of differential expressed genes upon treatment with CMPD1 or PTX in RPE1 cells.
- https://cdn.elifesciences.org/articles/104859/elife-104859-fig6-data2-v1.xlsx
Figure 6—figure supplement 1
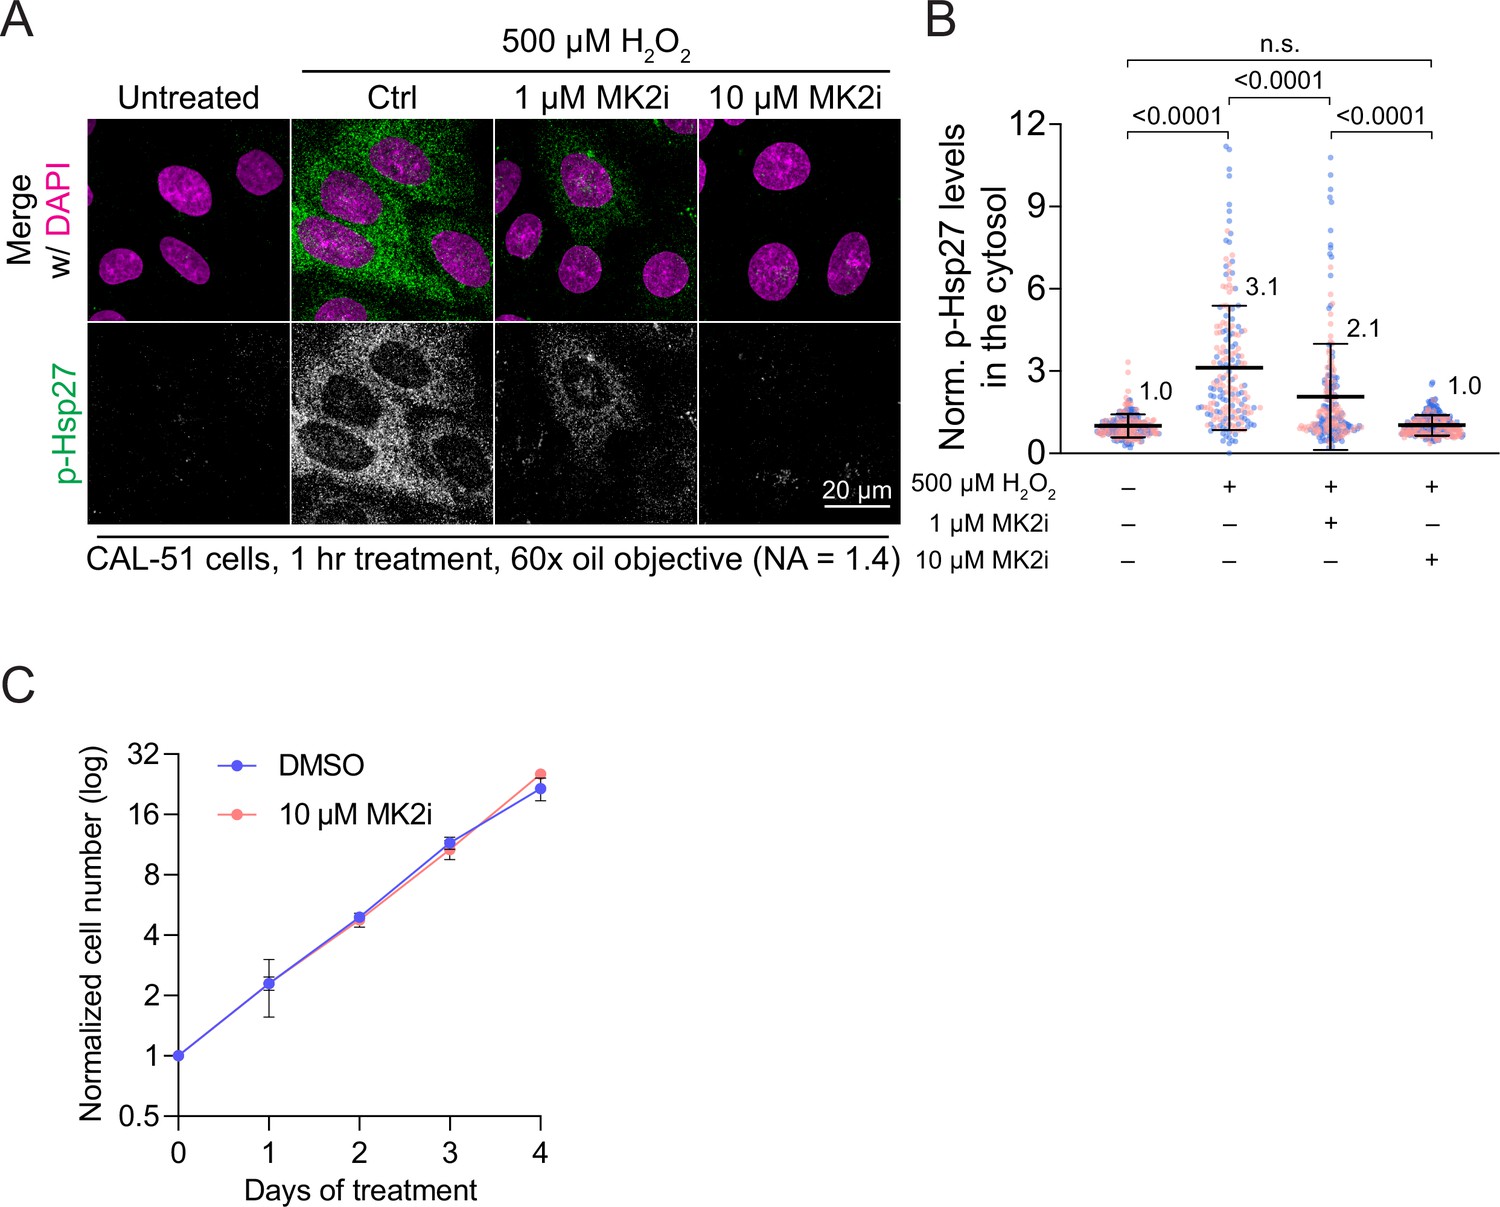
MK2 inhibitor suppresses the phosphorylation of downstream substrates without affecting the growth of cancer cells.
(A) Representative immunofluorescence images of CAL-51 cells stained with phospho-Hsp27 (p-Hsp27) antibody following the stimulation of 500 μM H2O2 along with treatment with either 1 or 10 µM MK2 inhibitor (MK2i) for 1 hr. (B) Quantification of p-Hsp27 fluorescence intensity from (A). Each dot indicates one cell. More than 100 cells were analyzed and pooled from two color-coded biological replicates. The p-value was calculated using Tukey’s multiple comparison test. (C) Growth curves of DMSO-treated control CAL-51 cells versus 10 µM MK2i-treated CAL-51 cells over a 4-day period. The number of cells counted on each day was normalized to the number of cells seeded on day 0 and indicated in a log2 format. Results are mean ± s.d. Two biological replicates were performed.
Figure 6—figure supplement 2
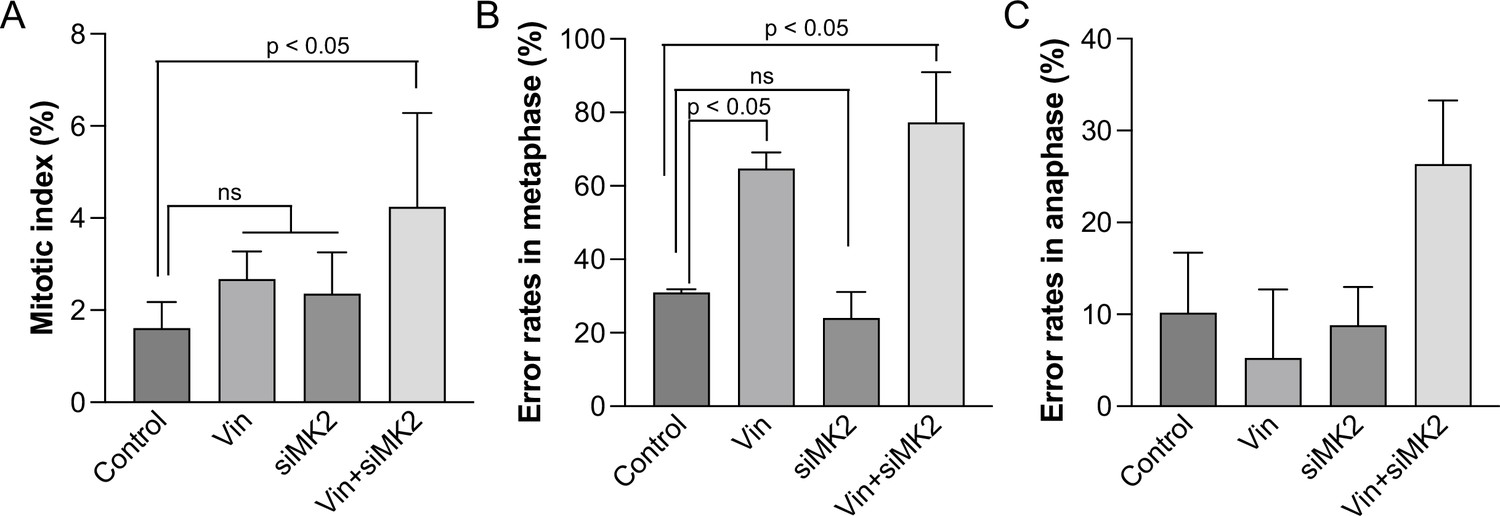
MK2 depletion by siRNA recapitulates the effects of MK2i, which enhances vinblastine-induced cytotoxicity.
(A) Quantification of the mitotic index in CAL-51 cells under the following conditions: DMSO control, 1 nM vinblastine (24 hr), MK2 siRNA (48 hr), and MK2 siRNA (48 hr) combined with 1 nM vinblastine (24 hr). The p-value was calculated using Tukey’s multiple comparison test. (B) Quantification of the frequency of errors in metaphase observed under the conditions described in (A). The p-value was calculated using Tukey’s multiple comparison test. (C) Quantification of the frequency of errors in anaphase under the conditions described in (A).
Figure 6—figure supplement 3
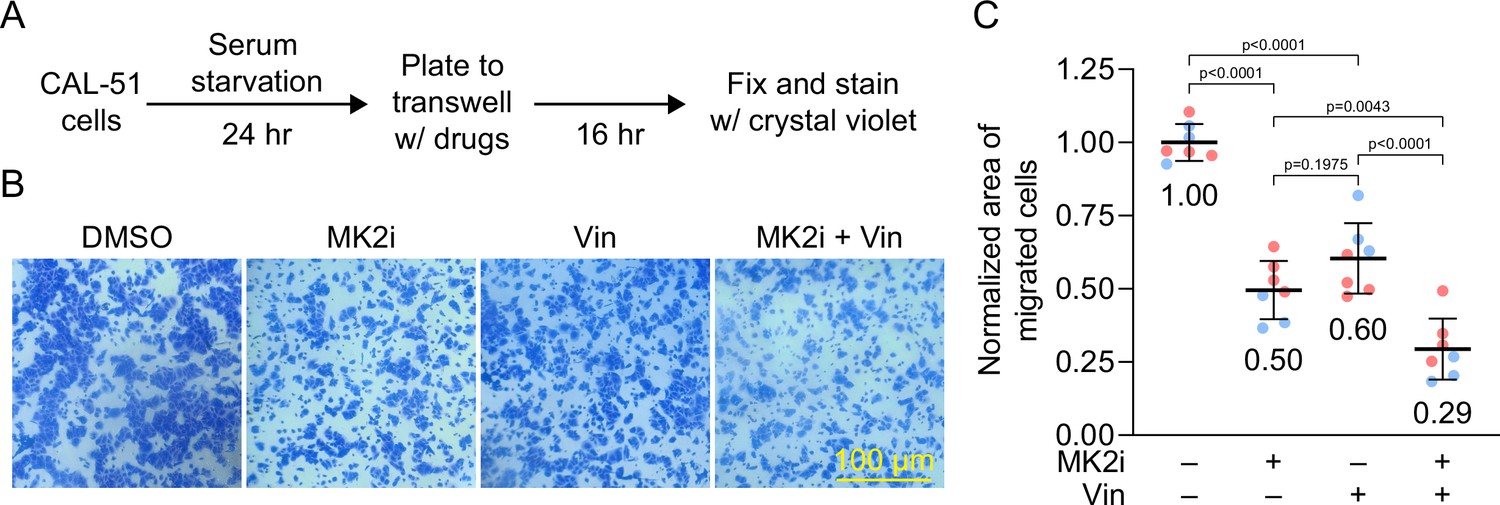
MK2i and vinblastine synergistically suppress the migration ability of CAL-51 cells.
(A) Schematic overview of the trans-well migration assay performed using CAL-51 cells. Briefly, CAL-51 cells were starved in the media without serum for 24 hr, followed by reseeding in a trans-well in the presence of indicated drugs. (B) Representative images of migrated CAL-51 cells 16 hr posttreatment with DMSO, 10 µM MK2 inhibitor (MK2i), 0.1 nM vinblastine, or a combination of 10 µM MK2i and 0.1 nM vinblastine. The migrated cells located at the lower side of the trans-well were stained by crystal violet. (C) Quantification of migrated cells under the treatment conditions described in (B). Two biological replicates were performed and color-coded. Each dot represents the normalized number of cells in the same size of the field of view. The p-value was calculated using Tukey’s multiple comparison test.
Figure 6—figure supplement 4
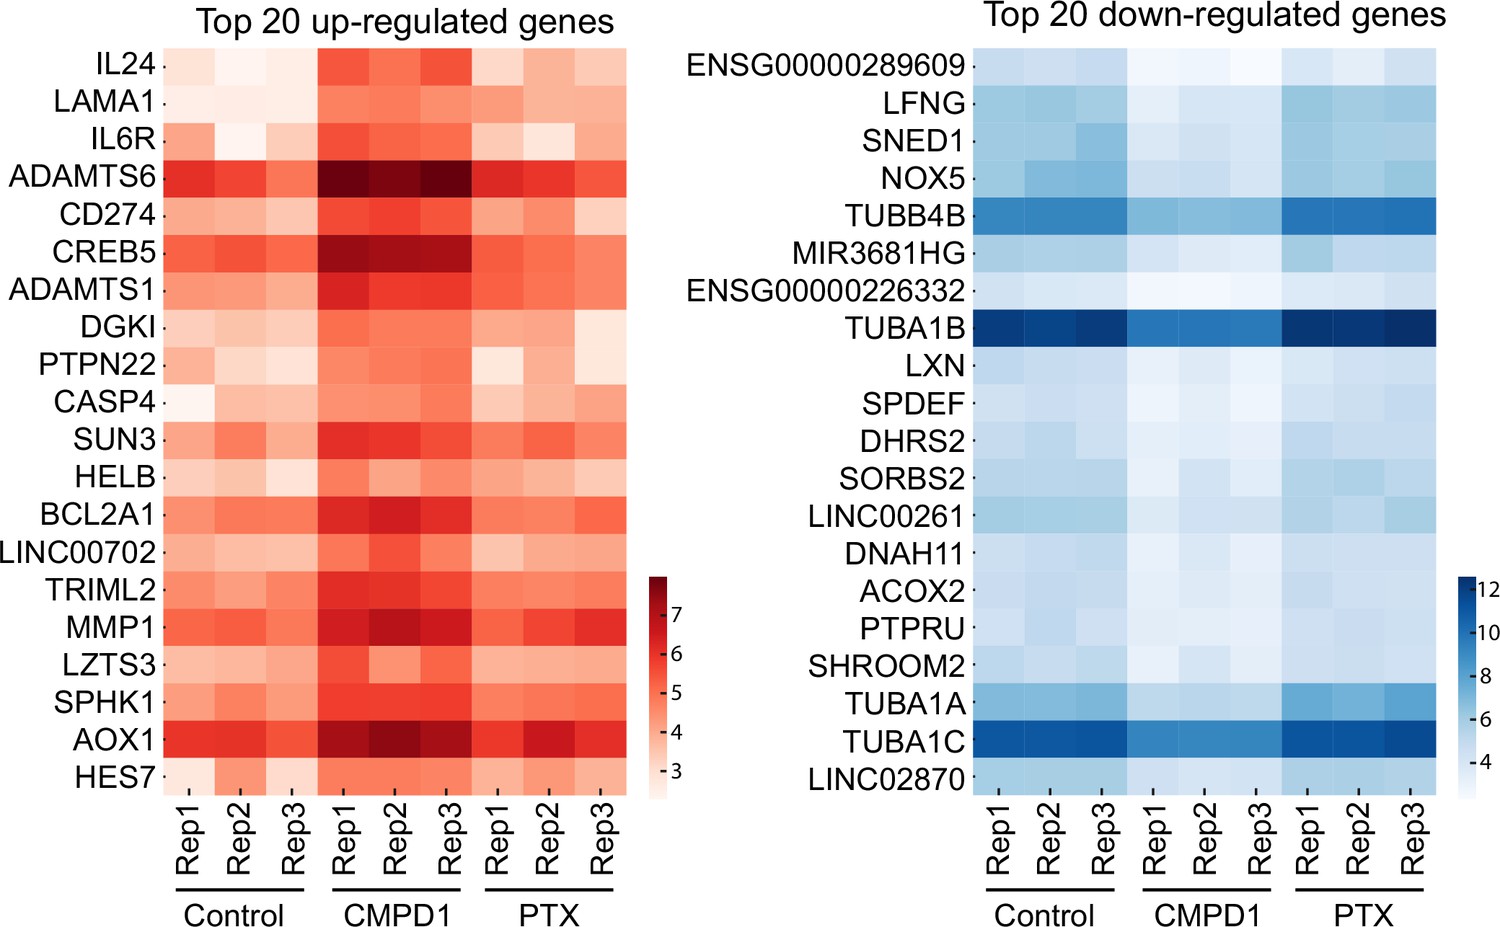
Top 20 upregulated and downregulated genes in CMPD1-treated MDA-MB-231 cells.
The top 20 upregulated (left) and downregulated (right) genes identified in MDA-MB-231 cells following treatment with CMPD1 were shown, along with control (vehicle) and PTX-treated gene expression data. Heatmaps display normalized read counts in each condition.
Figure 7
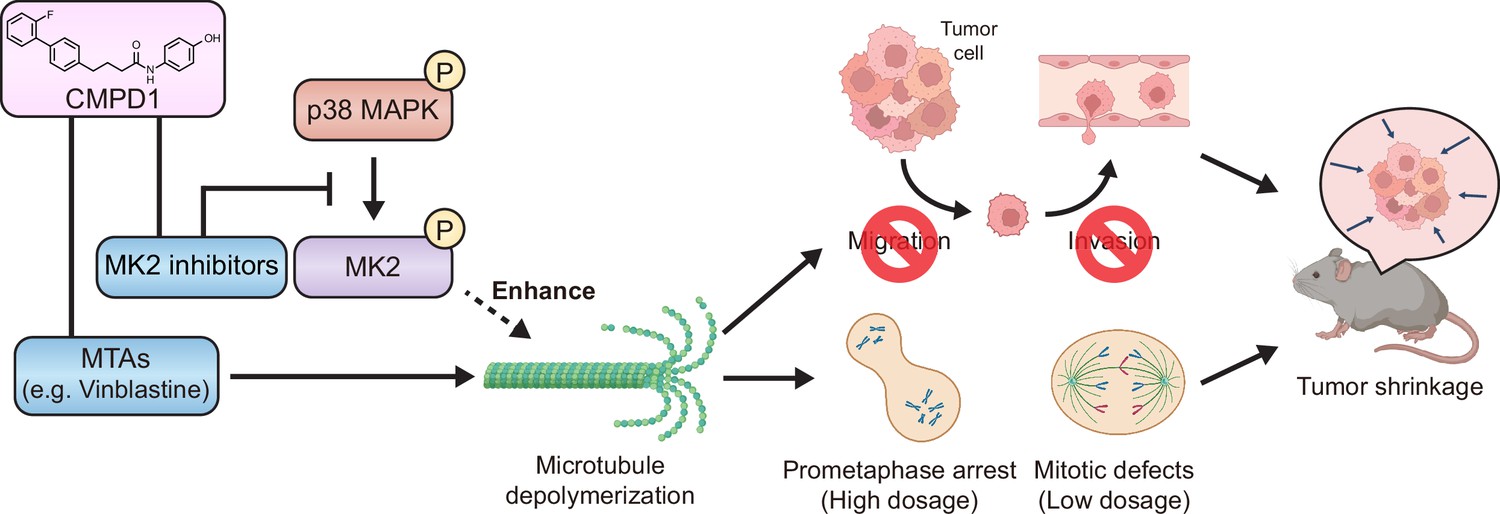
The model of CMPD1-mediated cytotoxicity effects on cancer cells.
CMPD1 exhibits its tumor-specific cytotoxicity likely via two pathways. First, CMPD1 acts as a kinase inhibitor which prevents p38 mitogen-activated protein kinase (MAPK)-dependent phosphorylation of MK2, leading to the disruption of proper actin remodeling and spindle formation during mitosis. Second, CMPD1 serves as a microtubule-targeting agent (MTA), which can specifically induce depolymerization at the plus ends of microtubules. Both impaired actin reorganization and attenuated microtubule filament formation inhibit cancer cell migration and invasion, thereby preventing metastasis. On the other hand, failure of spindle assembly during mitosis causes the extended prometaphase arrest and the diminished mitotic fidelity, resulting in apoptosis of tumor cells and tumor shrinkage.
Videos
Video 1
Control MDA-MB-231 (H2B-mCherry) mitotic cells.
Video 2
CMPD1-treated MDA-MB-231 (H2B-mCherry) mitotic cells.
Video 3
Control CAL-51 (H2B-mScarlet and tubulin-mNeonGreen) mitotic cells.
Video 4
CMPD1-treated CAL-51 (H2B-mScarlet and tubulin-mNeonGreen) mitotic cells.
Video 5
MG132 and CMPD1-treated CAL-51 (H2B-mScarlet and tubulin-mNeonGreen) mitotic cells.
Tables
Key resources table
| Reagent type (species) or resource | Designation | Source or reference | Identifiers | Additional information |
|---|---|---|---|---|
| Cell line (Homo sapiens) | hTERT RPE-1 | ATCC | CRL-4000, RRID:CVCL_4388CVCL_4388 | |
| Cell line (Homo sapiens) | MCF10A | ATCC | CRL-10317 | |
| Cell line (Homo sapiens) | CAL-51 | Scribano et al., Sci Transl Med. (2021) | RRID:CVCL_1110 | |
| Cell line (Homo sapiens) | Histone H2B-mScarlet, α-tubulin-mNeonGreen CAL-51 | Scribano et al., Sci Transl Med. (2021) | ||
| Cell line (Homo sapiens) | p53-KO CAL-51 | Redman-Rivera et al., Nat Commun. (2021) | ||
| Cell line (Homo sapiens) | MDA-MB-231 | ATCC | CRM-HTB-26 | |
| Cell line (Homo sapiens) | T47-D | ATCC | HTB-133 | |
| Transfected construct (human) | siRNA to MK2 (SMARTpool) | Horizon Discovery | L-003516-00-0010 | |
| Antibody | anti-Phospho-HSP27 (Ser82) (Rabbit monoclonal) | Cell Signaling Technology | Cat# 9709S, RRID:AB_11217429 | IF(1:1000) |
| Chemical compound, drug | CMPD1 | MedChemExpress | Cat# HY-108643 | |
| Chemical compound, drug | Paclitaxel | MedChemExpress | Cat# HY-B0015 | |
| Chemical compound, drug | Vinblastine | MedChemExpress | Cat# HY-13780 | |
| Chemical compound, drug | MK2-IN-3 hydrate (MK2i) | MedChemExpress | Cat# HY-112457 | |
| Chemical compound, drug | MG132 | MedChemExpress | Cat# HY-13259 | |
| Chemical compound, drug | MPS1 Inhibitor III, AZ3146 | Sigma | Cat# 5319760001 | |
| Chemical compound, drug | DMSO | Thermo Fisher Scientific | Cat# BP231-1 | |
| Commercial assay or kit | VitroGel Cell Invasion Assay Kit | TheWell Bioscienc | Cat# IA-VHM01-4P | |
| Other | Crystal Violet Stain Solution 1% Aqueous | Electron Microscopy Sciences | Cat# 26105-01 |
Additional files
Download links
A two-part list of links to download the article, or parts of the article, in various formats.
Downloads (link to download the article as PDF)
Open citations (links to open the citations from this article in various online reference manager services)
Cite this article (links to download the citations from this article in formats compatible with various reference manager tools)
Inhibition of p38-MK2 pathway enhances the efficacy of microtubule inhibitors in breast cancer cells
eLife 13:RP104859.
https://doi.org/10.7554/eLife.104859.3


