Secretory leukocyte protease inhibitor influences periarticular joint inflammation in Borrelia burgdorferi-infected mice
- Section of Infectious Diseases, Department of Internal Medicine, School of Medicine, Yale University, United States
- Institute of Insect Sciences, College of Agriculture and Biotechnology, Zhejiang University, China
- Department of Pathology, Yale School of Medicine, United States
- Section of Rheumatology, Allergy and Immunology, Department of Internal Medicine, School of Medicine, Yale University, United States
- Department of Immunobiology, Yale School of Medicine, United States
- Department of Pharmacology, Yale School of Medicine, United States
- Divisions of Immunology, Faculty of Medicine, Tohoku Medical and Pharmaceutical University, Japan
Figures
Figure 1

B. burgdorferi burden in C57BL/6 WT and Slpi-/- mice.
WT and Slpi-/- mice were infected with 105 spirochetes by subcutaneous injection. (A–C) Spirochete burden in skin was assessed by ear punch biopsies at 7 days (A), 14 days (B), and between 21 and 24 days (C) post infection. (D, E) Spirochete burden in tibiotarsal joint and heart tissues was assessed between 21 and 24 days (D, heart, E, joint) post infection. At least n=6 mice were infected in each group. The spirochete burden was measured by qPCR detecting flaB and normalized to mouse β-actin. Each data point represents an individual animal. Representative data are shown from three separate experiments. The error bars represent mean ± SEM, and p-values were calculated using the nonparametric Mann–Whitney test.
-
Figure 1—source data 1
Source data value for Figure 1A-E.
- https://cdn.elifesciences.org/articles/104913/elife-104913-fig1-data1-v1.xlsx
Figure 2
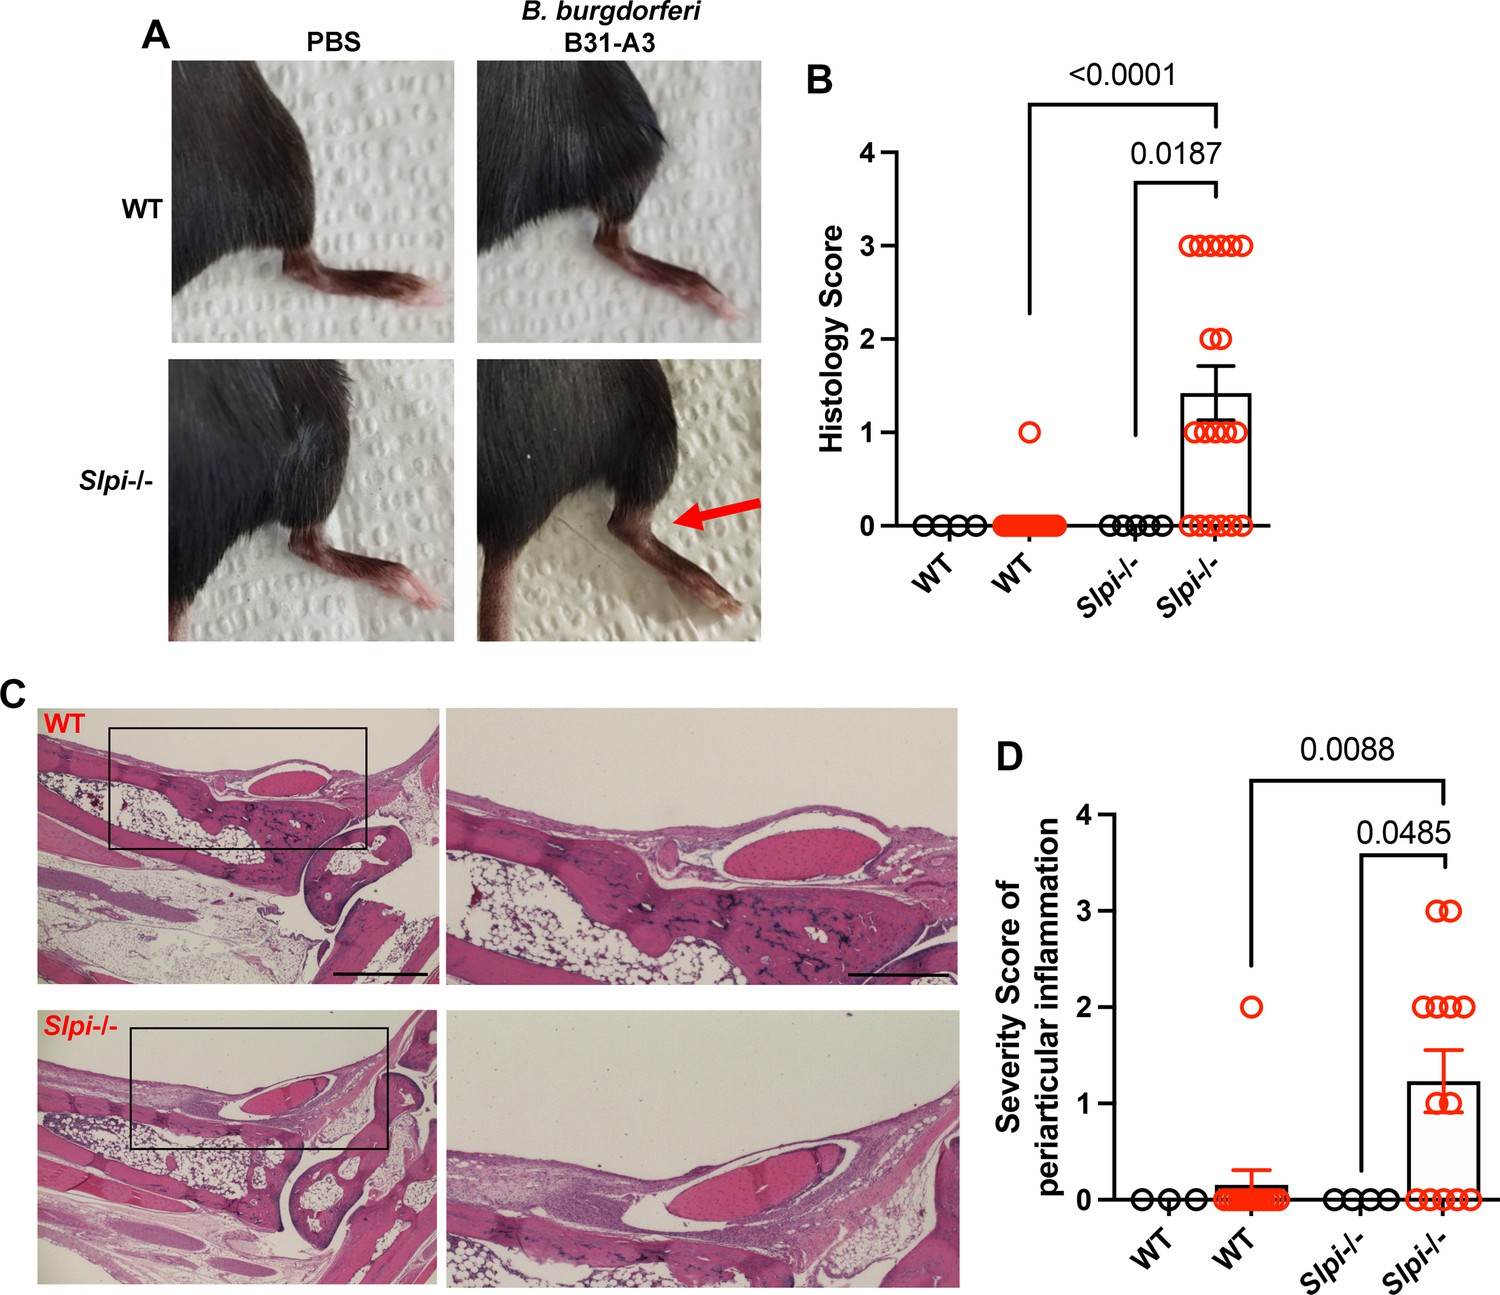
Assessment of ankle inflammation in WT and Slpi-/- mice infected with B. burgdorferi between 21 and 24 dpi.
(A) Representative images are shown of the tibiotarsal joints of WT and Slpi-/- mice with/without B. burgdorferi infection between 21 and 24 dpi. The swelling is indicated by the red arrow. (B) Swelling of the tibiotarsal joints of individual mice was scored visually by an observer blinded to the experimental groups (scale of 0 [negative] to 3 [severe]). (C) The tibiotarsal joint of each mouse was dissected, fixed, sectioned, and stained with H&E. Representative images from B. burgdorferi-infected C57BL/6 WT and Slpi-/- mice are shown. Lower magnification (left panels, scale bar: 100 μm) and higher magnification (right panels, scale bar: 50 μm) of selected areas (black rectangle) are shown. (D) The severity of periarticular inflammation was scored blindly by the pathologist on a scale of 0 (negative) to 3 (severe). black, PBS-sham infection; red, B. burgdorferi infection. Results from two independent experiments were pooled and shown here. The error bars represent mean ± SEM, and p-values were calculated using the nonparametric Mann–Whitney test.
-
Figure 2—source data 1
Source data value for Figure 2B and D.
- https://cdn.elifesciences.org/articles/104913/elife-104913-fig2-data1-v1.xlsx
Figure 3 with 2 supplements

Immune profile analysis of infected WT and Slpi-/- mice.
(A, B) Infiltrating cell population analysis of tibiotarsal joint tissues of infected WT and Slpi-/- mice. (A) The neutrophil population was gated on the CD11bLY6G double-positive cells among the CD45-positive cells. (B) The macrophage population was gated on the CD64-positive cells among the CX3CR1-positive myeloid cells. Results from two independent experiments were pooled and shown here. (C–E) Expression levels of C-X-C motif chemokine receptor 2 (Cxcr2, C), monocyte chemoattractant protein 1 (Mcp-1, D), and C-C motif chemokine receptor 2 (Ccr2, E) were assessed in the tibiotarsal tissue using RT-qPCR. (F) The serum cytokine profile was assessed using mouse cytokine/chemokine 32-plex array. An increase in IL-6 was observed in the infected Slpi-/- mice. (G, H) The serum level of neutrophil elastase (NE) was measured using an ELISA kit. (I) Serum levels of MMPs were assessed using a mouse MMP 5-Plex Discovery Assay. An increase in MMP-8 was observed in the infected Slpi-/- mice. Serum was obtained by cardiac puncture of WT and Slpi-/- C57BL/6 mice with/without infection between 21 and 24 dpi (F, G, and I) and of infected C3H/HeN mice at 21 dpi (H). black, PBS-sham infection; red, B. burgdorferi infection. Each data point represents an individual animal. The error bar represents mean ± SEM, and p-values were calculated using the nonparametric Mann–Whitney test.
-
Figure 3—source data 1
Source data value for Figure 3A-I.
- https://cdn.elifesciences.org/articles/104913/elife-104913-fig3-data1-v1.xlsx
Figure 3—figure supplement 1

The macrophages population analyzed using Ly6G-negative gating strategy.
The macrophage population was first gated on the Ly6G-negative population, then gated on the CD64-positive cells among the CX3CR1-positive myeloid cells. Results from two independent experiments were pooled and shown here. The error bar represents mean ± SEM, and p-values were calculated using the nonparametric Mann–Whitney test.
-
Figure 3—figure supplement 1—source data 1
Source data for Figure 3-figure supplement 1.
- https://cdn.elifesciences.org/articles/104913/elife-104913-fig3-figsupp1-data1-v1.xlsx
Figure 3—figure supplement 2
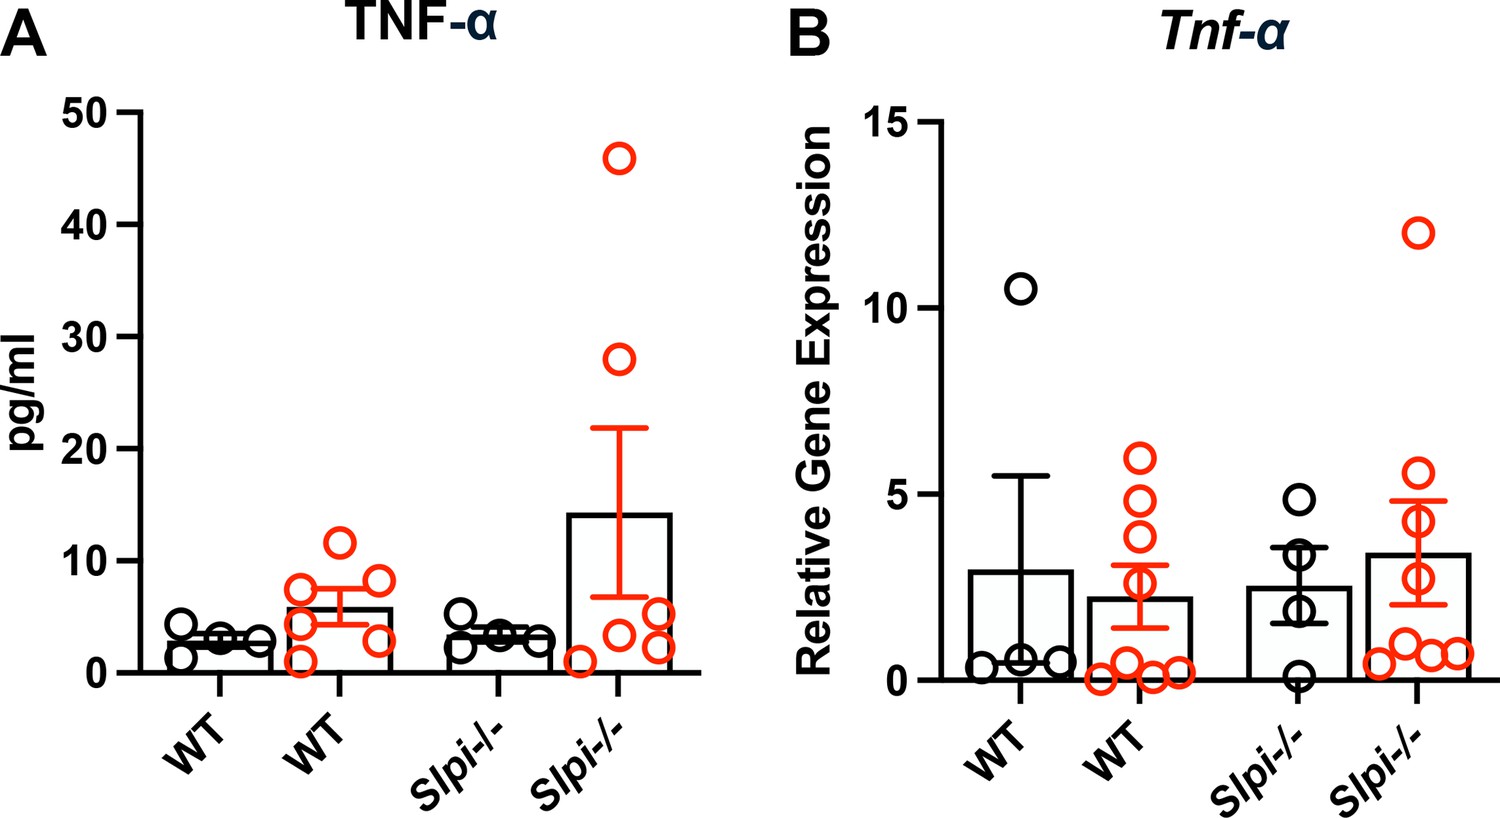
Serum and gene expression levels of TNF-α.
(A) The serum level of TNF-α was assessed using a mouse cytokine/chemokine 32-plex array. (B) The gene expression level of Tnf-α was assessed in the tibiotarsal tissue using RT-qPCR. Serum was obtained by cardiac puncture and the tibiotarsal tissue was collected from WT and Slpi-/- C57BL/6 mice with/without B. burgdorferi infection between 21 and 24 dpi. black, PBS-sham infection; red, B. burgdorferi infection. Each data point represents an individual animal. The error bar represents mean ± SEM, and p-values were calculated using the nonparametric Mann–Whitney test.
-
Figure 3—figure supplement 2—source data 1
Source data for Figure 3-figure supplement 2.
- https://cdn.elifesciences.org/articles/104913/elife-104913-fig3-figsupp2-data1-v1.xlsx
Figure 4

Serum secretory leukocyte protease inhibitor (SLPI) levels in Lyme disease subjects versus healthy controls.
The serum level of SLPI was measured by ELISA. Sera samples were from five adult healthy controls (HCs). 18 samples were from people with Lyme disease (LD) including 5 samples from three subjects presenting with Lyme arthritis (red) and 13 samples from four subjects with erythema migrans (black). The error bar represents mean ± SEM, and p-values were calculated using the nonparametric Mann–Whitney test.
-
Figure 4—source data 1
Source data for Figure 4.
- https://cdn.elifesciences.org/articles/104913/elife-104913-fig4-data1-v1.xlsx
Figure 5 with 3 supplements
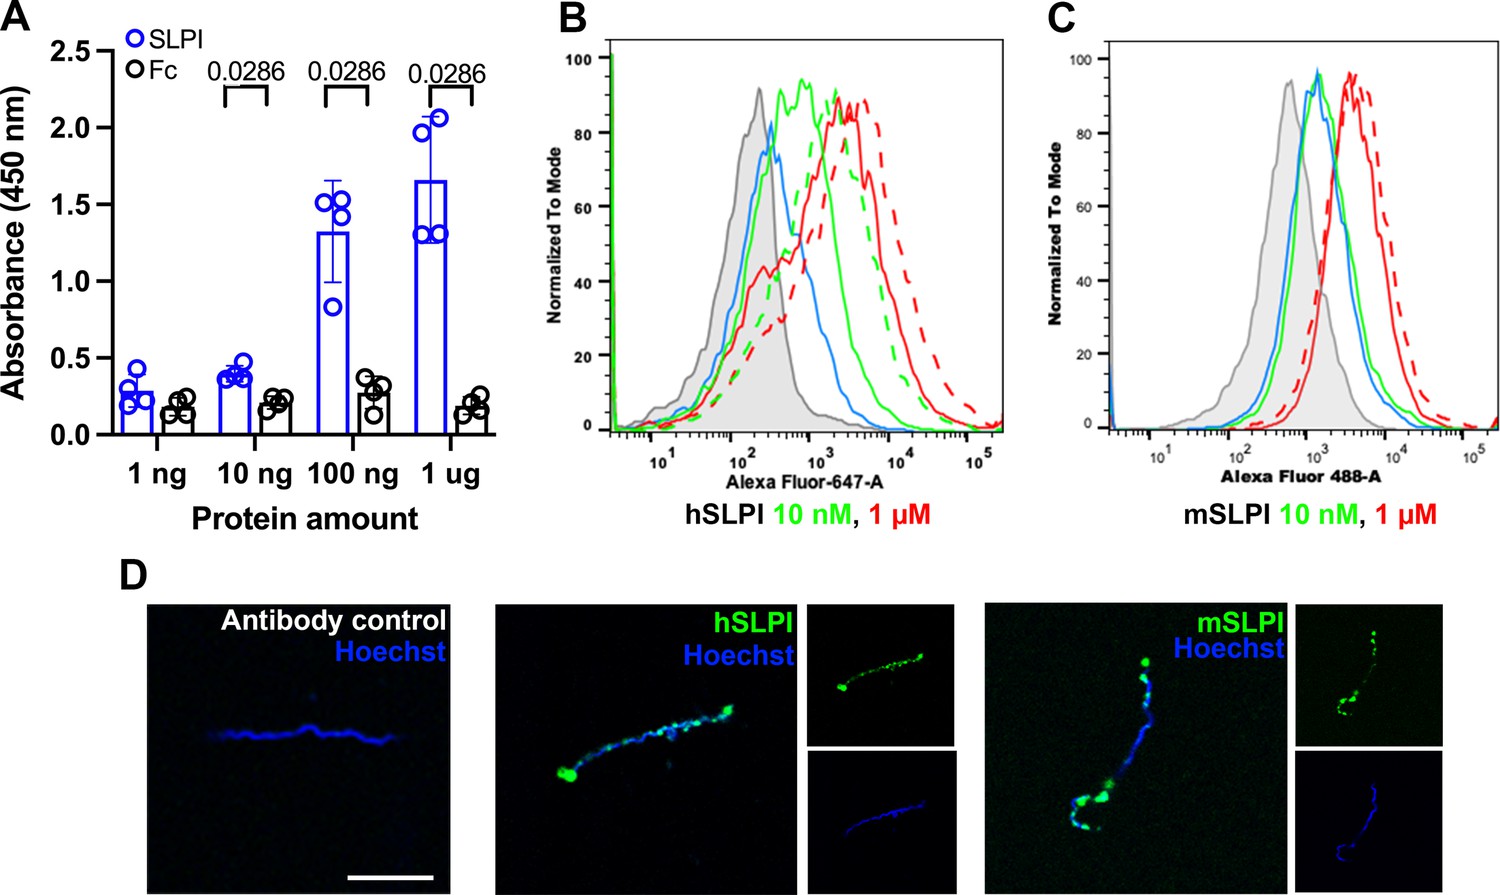
B. burgdorferi interaction with human and murine secretory leukocyte protease inhibitor (SLPI).
(A) Sandwich ELISA results show the interaction of B. burgdorferi whole-cell lysates with human SLPI. ELISA plates were coated with B. burgdorferi whole-cell lysates and probed with increasing amount of human SLPI (blue) or human Fc proteins (black) as the negative control. The values plotted represent the mean ± SEM of duplicates from two experiments. p-value is displayed in the graph and determined using the nonparametric Mann–Whitney test. (B, C) Flow cytometry histograms show binding of human (B) and murine (C) SLPI to B. burgdorferi cultured at 33°C (solid line) and 37°C (dash line). B. burgdorferi was cultured to a density of 106 /ml. The same volume of cultures was incubated at 33°C or 37°C for 24 h before adding 10 nM (green) or 1 μM (red) human or murine SLPI. The binding was detected with goat anti-human or murine SLPI and donkey anti-goat AF647 or AF488. B. burgdorferi alone (gray) and antibody control (without SLPI, blue) were used as negative controls. (D) Immunofluorescent microscopy was used to directly observe the binding of B. burgdorferi with human and murine SLPI. Merged and single-color images are shown. Representative histograms and fluorescent images are shown from three independent experiments. Scale bar: 10 μm.
-
Figure 5—source data 1
Source data for Figure 5A.
- https://cdn.elifesciences.org/articles/104913/elife-104913-fig5-data1-v1.xlsx
Figure 5—figure supplement 1
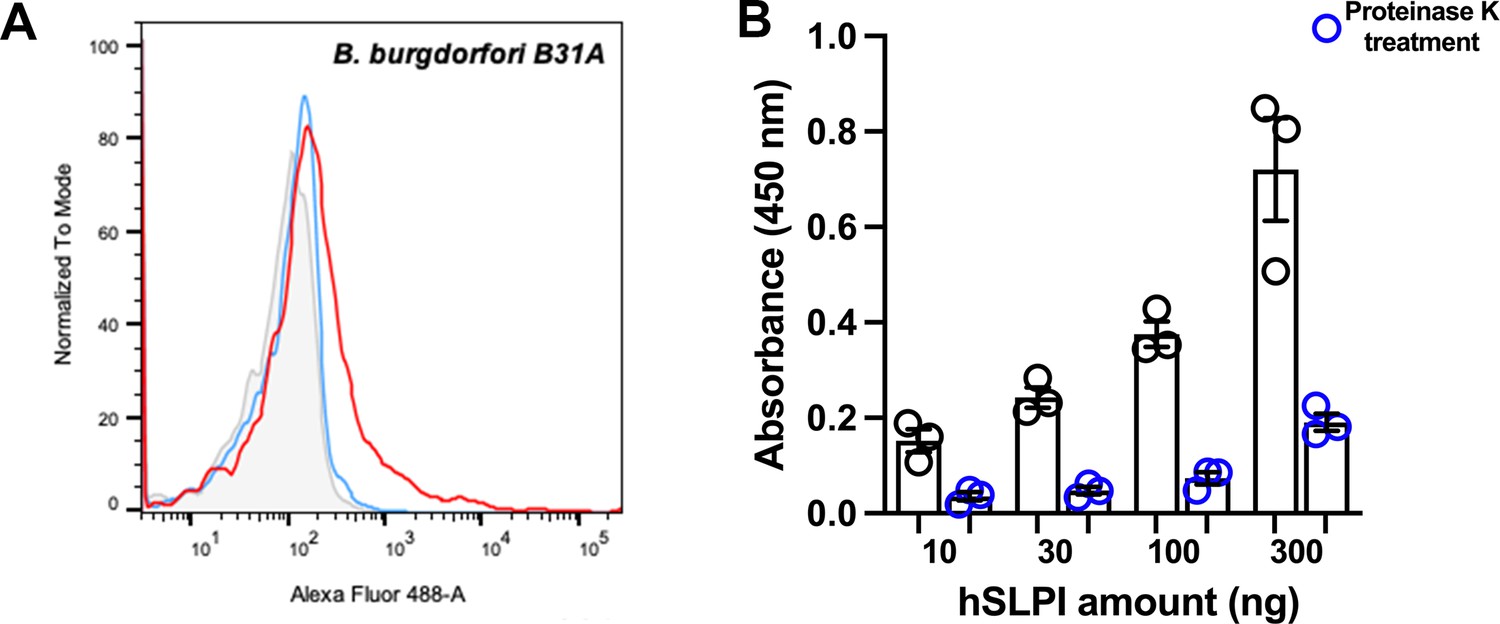
The binding of human secretory leukocyte protease inhibitor (SLPI) to non-infectious B. burgdorferi B31A and proteinase K-treated B. burgdorferi B31A3.
(A) Flow cytometry histogram shows the lack of binding of human SLPI (1 μM, red) to non-infectious B. burgdorferi B31A. B. burgdorferi alone (gray) and antibody control (without SLPI, blue) were used as negative controls. A representative histogram from two independent experiments is shown. (B) ELISA result shows the interaction between human SLPI and B. burgdorferi B31A3 whole-cell lysates in the presence (blue) or absence (black) of proteinase K. ELISA plates were coated with B. burgdorferi B31A3 whole-cell lysates and probed with increasing amount of human SLPI. The values plotted represent the mean ± SEM of triplicates from one experiment.
-
Figure 5—figure supplement 1—source data 1
Source data for Figure 5-figure supplement 1B.
- https://cdn.elifesciences.org/articles/104913/elife-104913-fig5-figsupp1-data1-v1.xlsx
Figure 5—figure supplement 2
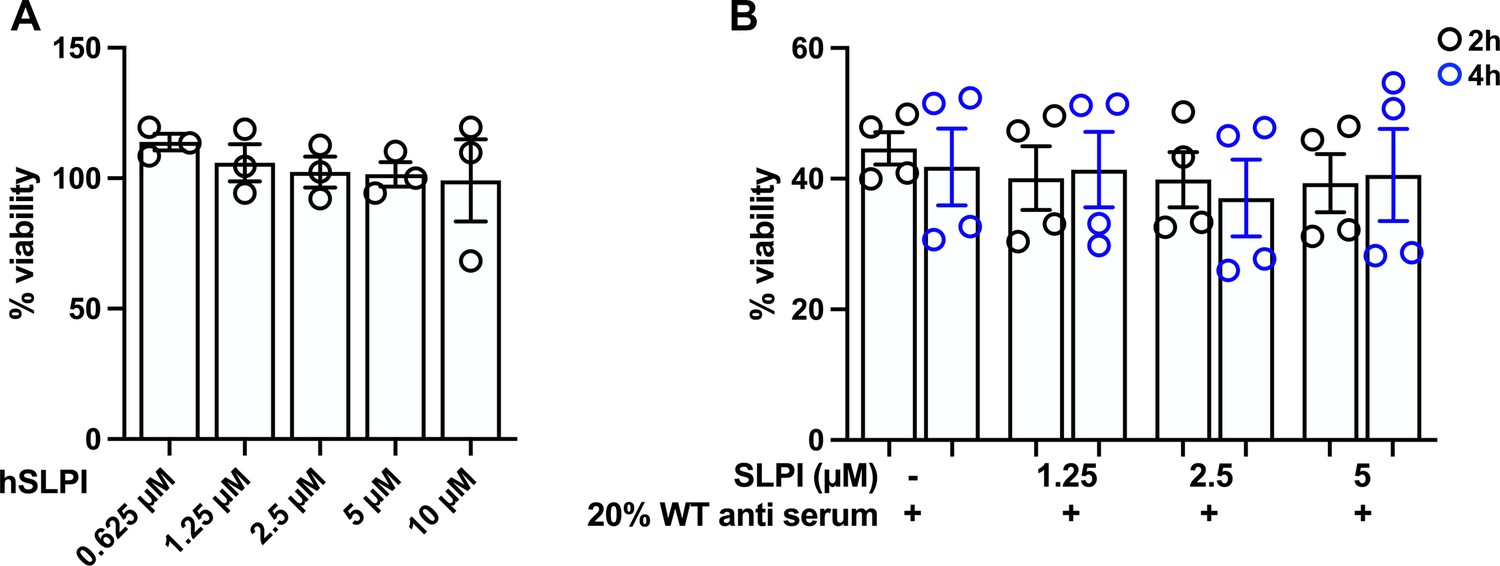
The effect of human secretory leukocyte protease inhibitor (SLPI) binding on B. burgdorferi viability and antibody-mediated killing.
(A) Human SLPI (hSLPI, 0–10 μM) was incubated with 105 B. burgdorferi at 33°C for 48 h. The viability was assessed by BacTiter Glo microbial cell viability assay. The percent viability was normalized to the control spirochetes culture without hSLPI treatment. Results from one independent experiment performed in triplicate samples are shown here. (B) Human SLPI (hSLPI, 0–5 μM) was incubated with 105 B. burgdorferi at 33°C for 2 h. 20% mouse B. burgdorferi antisera were then added for 2 and 4 h. The viability was measured as described above. The percent viability was normalized to the control spirochetes culture without any treatment. Results from two independent experiments performed in duplicate samples are shown here. The error bar represents mean ± SEM.
-
Figure 5—figure supplement 2—source data 1
Source data for Figure 5-figure supplement 2A and B.
- https://cdn.elifesciences.org/articles/104913/elife-104913-fig5-figsupp2-data1-v1.xlsx
Figure 5—figure supplement 3
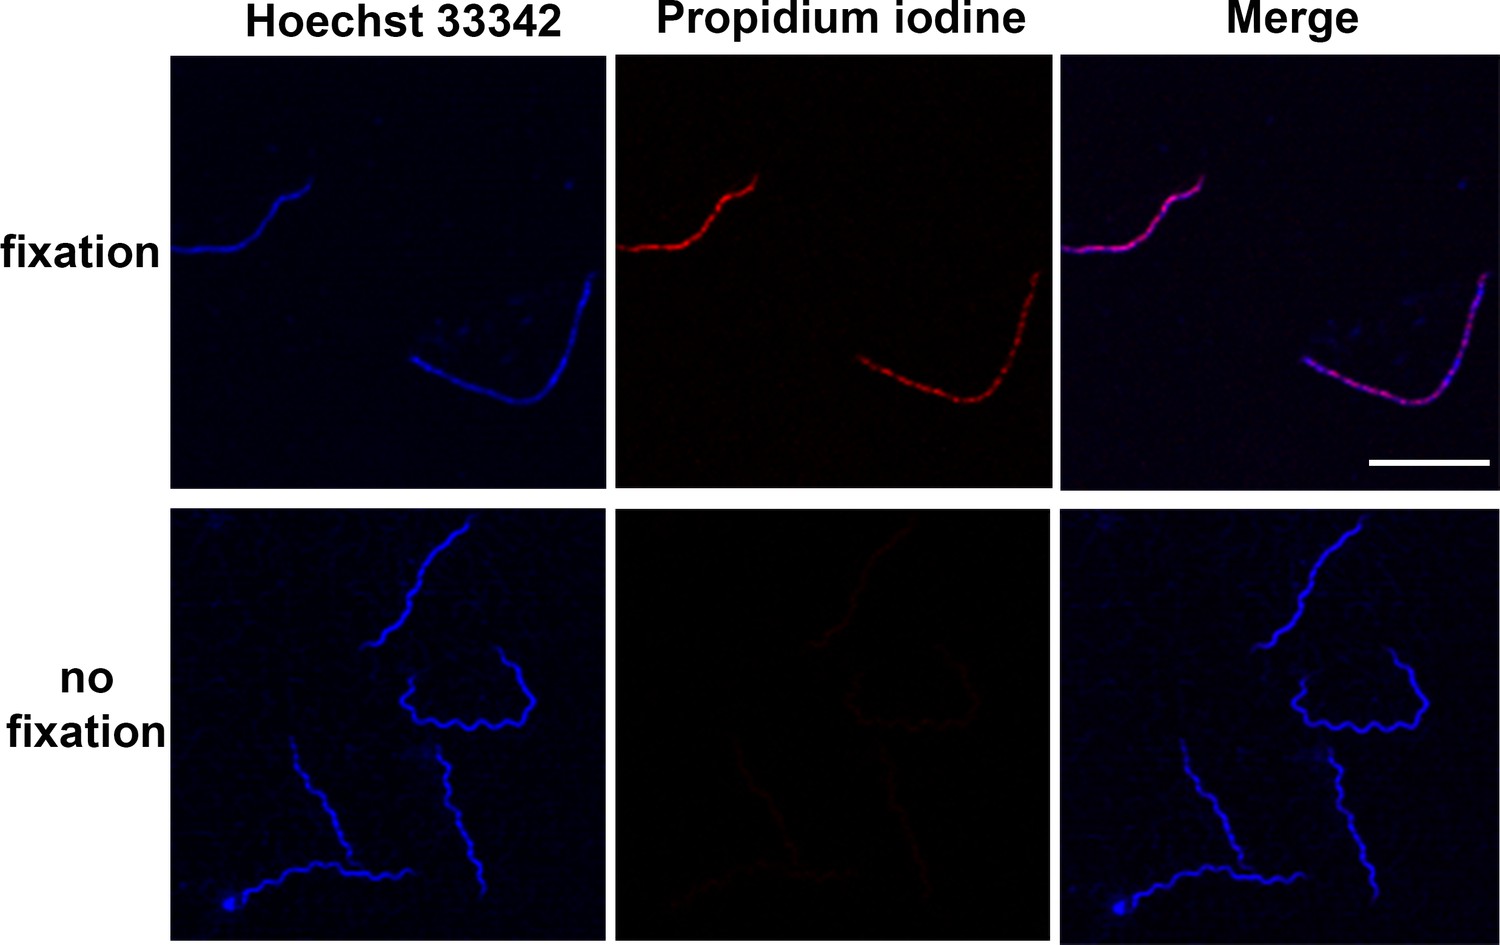
Hoechst 33324 and propidium iodide double staining of B. burgdorferi whole organism with and without fixation.
Immunofluorescent microscopy was used to directly observe the staining of B. burgdorferi. Merged and single-color images are shown. Representative images are shown from two independent experiments. Scale bar: 10 μm.
Tables
Key resources table
| Reagent type (species) or resource | Designation | Source or reference | Identifiers | Additional information |
|---|---|---|---|---|
| Strain, strain background (Borrelia burgdorferi) | B31-A3 | Dr. Utpal Pal’s laboratory | N/A | See ‘Materials and methods’, ‘B. burgdorferi culture’ |
| Strain, strain background (B. burgdorferi) | B31-A | This paper | N/A | See ‘Materials and methods’, ‘B. burgdorferi culture’ |
| Strain, strain background (Escherichia coli) | Rosetta-gami 2 (DE3) | Novagen | Cat#71351 | Electrocompetent cells |
| Strain, strain background (Mus musculus) | SLPI-/- | Dr. Akira Nakamura’s laboratory (Takayama et al., 1987; Bernard et al., 2018) | N/A | https://doi.org/10.3389/fimmu.2017.01538 https://doi.org/10.1084/jem.20021824 |
| Strain, strain background (M. musculus) | C3H/HeN | Charles River Laboratories | N/A | |
| Strain, strain background (M. musculus) | C57BL/6 | Jackson Laboratory | Stock #: 000664 RRID:IMSR_JAX:000664 | |
| Biological samples (M. musculus) | Mouse tibiotarsal tissue | This paper | N/A | Freshly isolated from Mus musculus |
| Antibody | TruStain FcX anti-mouse CD16/32 | BioLegend | Cat#101320 RRID:AB_1574975 | Flow cytometry (1 μl per test) |
| Antibody | PerCP anti-mouse CD45 | BioLegend | Cat#103130 RRID:AB_893339 | Flow cytometry (1 μl per test) |
| Antibody | BV711 anti-mouse Ly6G | BioLegend | Cat#127643 RRID:AB_2565971 | Flow cytometry (1 μl per test) |
| Antibody | PE anti-mouse CD11b | BioLegend | Cat#101208 RRID:AB_312791 | Flow cytometry (1 μl per test) |
| Antibody | APC/CY7 anti-mouse CX3CR21 | BioLegend | Cat#149047 RRID:AB_2892303 | Flow cytometry (1 μl per test) |
| Antibody | FITC anti-mouse Ly6C | BioLegend | Cat#128005 RRID:AB_1186134 | Flow cytometry (1 μl per test) |
| Antibody | APC anti-mouse CD64 | BioLegend | Cat#139305 RRID:AB_11219205 | Flow cytometry (1 μl per test) |
| Antibody | Goat anti-human SLPI | R&D Systems | Cat#AF1274 RRID:AB_2302508 | Flow cytometry (1 μl per test) |
| Antibody | Goat anti-murine SLPI | R&D Systems | Cat#AF1735 RRID:AB_2195050 | Flow cytometry (1 μl per test) |
| Antibody | Alexa Fluor 488 donkey anti-goat IgG (H+L) | Invitrogen | Cat#A32814 RRID:AB_2762838 | Flow cytometry (1 μl per test) |
| Antibody | Alexa Fluor 647 donkey anti-goat IgG (H+L) | Invitrogen | Cat#A-21447 RRID:AB_2535864 | Flow cytometry (1 μl per test) |
| Recombinant DNA reagent | Murine SLPI cDNA ORF clone (plasmid) | GenScript | OMu22721 | |
| Recombinant DNA reagent | pET-22b (+) (plasmid) | Novagen | Cat#69744-3 | |
| Sequence-based reagent | Mouse β-actin-F | This paper | PCR primers | AGCGGGAAATCGTGCGTG |
| Sequence-based reagent | Mouse β-actin-R | This paper | PCR primers | CAGGGTACATGGTGGTGCC |
| Sequence-based reagent | Borrelia flab-F | This paper | PCR primers | TTCAATCAGGTAACGGCACA |
| Sequence-based reagent | Borrelia flab-R | This paper | PCR primers | GACGCRRGAGACCCTGAAAG |
| Sequence-based reagent | Mouse Mcp1-F | This paper | PCR primers | GTTGGCTCAGCCAGATGCA |
| Sequence-based reagent | Mouse Mcp1-R | This paper | PCR primers | AGCCTACTCATTGGGATCATCTTG |
| Sequence-based reagent | Mouse Ccr2-F | This paper | PCR primers | AGTAACTGTGTGGATTGACAAGCACTTAGA |
| Sequence-based reagent | Mouse Ccr2-R | This paper | PCR primers | CAACAAAGGCATAAATGACAGGAT |
| Sequence-based reagent | Mouse Cxcr2-F | This paper | PCR primers | CACCCTCTTTAAGGCCCACAT |
| Sequence-based reagent | Mouse Cxcr2-R | This paper | PCR primers | ACAAGGACGACAGCGAAGATG |
| Peptide, recombinant protein | human SLPI | R&D Systems | Cat#1274-PI-100 | |
| Commercial assay or kit | LIVE/DEADfixable violet stain kit | Invitrogen | Cat#L34955 | |
| Commercial assay or kit | DNeasy Blood & Tissue Kit | QIAGEN | Cat#69504 | |
| Commercial assay or kit | iScript cDNA Synthesis Kit | Bio-Rad | Cat#1708891 | |
| Commercial assay or kit | Gibson Assembly Kit | NEB | Cat#E5510 | |
| Commercial assay or kit | Mouse Neutrophil Elastase/ELA2 DuoSet ELISA | R&D Systems | Cat#DY4517-05 | |
| Commercial assay or kit | Human SLPI DuoSet ELISA | R&D Systems | Cat#DY1274-05 | |
| Commercial assay or kit | BacTiter-Glo Microbial Cell Viability Assay kit | Promega | Cat#G8230 | |
| Commercial assay or kit | Mouse MMP 5-Plex Discovery Assay Array (MDMMP-S, P) | Eve Technologies | N/A | |
| Commercial assay or kit | Mouse Cytokine/Chemokine 32-Plex Discovery Assay Array (MD32) | Eve Technologies | N/A | |
| Chemical compound, drug | iQ SYBR Green Supermix | Bio-Rad | Cat#1725124 | |
| Chemical compound, drug | Barbour-Stoenner-Kelly H (BSK-H) complete medium | Sigma-Aldrich | Cat#B8291 | |
| Chemical compound, drug | Bouin’s solution | Sigma-Aldrich | Cat#HT10132 | |
| Chemical compound, drug | Hyaluronidase | Sigma-Aldrich | Cat#H3506 | |
| Chemical compound, drug | Collagenase | Sigma-Aldrich | Cat#C2139 | |
| Chemical compound, drug | ACK Lysing buffer | Gibco | Cat#A1049201 | |
| Chemical compound, drug | Trizol | Invitrogen | Cat#15596-018 | |
| Chemical compound, drug | Mca-RPKPVE-Nval-WRK(Dnp)-NH2 Fluorogenic MMP Substrate | R&D Systems | Cat#ES002 | |
| Chemical compound, drug | BugBuster Protein Extraction Reagent | Novagen | Cat#70921-3 | |
| Chemical compound, drug | Proteinase K | Thermo Scientific | Cat#EO0491 | |
| Chemical compound, drug | Ni-NTA agarose | QIAGEN | Cat#30230 | |
| Chemical compound, drug | KPL Sureblue TMB Microwell Peroxidase substrate, 1-component | Seracare | Cat#5120-0077 | |
| Chemical compound, drug | KPL TMB stop solution | Seracare | Cat#5150-0021 | |
| Chemical compound, drug | Hoechst 33342 | Invitrogen | Cat#H1399 | |
| Chemical compound, drug | RPMI 1640 | Gibco | Cat#11875-093 | |
| Software, algorithm | Prism | GraphPad | RRID:SCR_002798 | |
| Software, algorithm | FlowJo | BD Biosciences | https://www.flowjo.com/ |
Additional files
-
Supplementary file 1
Subject characterization.
- https://cdn.elifesciences.org/articles/104913/elife-104913-supp1-v1.docx
-
MDAR checklist
- https://cdn.elifesciences.org/articles/104913/elife-104913-mdarchecklist1-v1.pdf
Download links
A two-part list of links to download the article, or parts of the article, in various formats.
Downloads (link to download the article as PDF)
Open citations (links to open the citations from this article in various online reference manager services)
Cite this article (links to download the citations from this article in formats compatible with various reference manager tools)
Secretory leukocyte protease inhibitor influences periarticular joint inflammation in Borrelia burgdorferi-infected mice
eLife 14:RP104913.
https://doi.org/10.7554/eLife.104913.4


