Quantification of the effect of hemodynamic occlusion in two-photon imaging of mouse cortex
- Friedrich Miescher Institute for Biomedical Research, Switzerland
- Faculty of Natural Sciences, University of Basel, Switzerland
- Simons Initiative for the Developing Brain, University of Edinburgh, United Kingdom
Figures
Figure 1 with 3 supplements
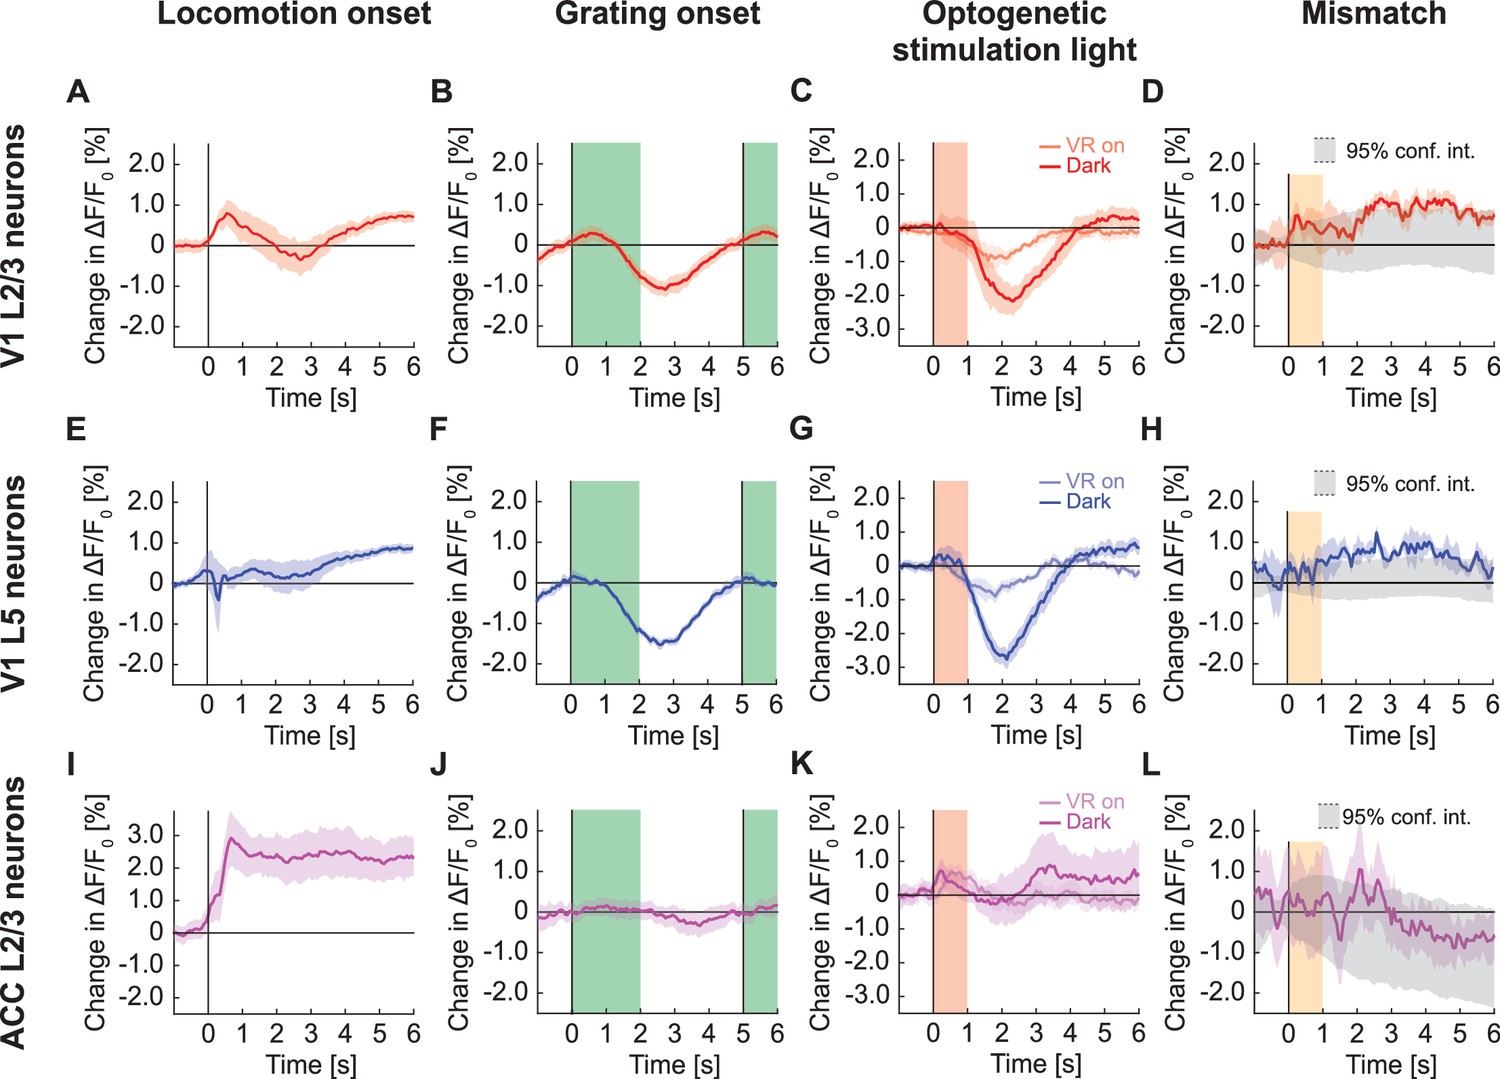
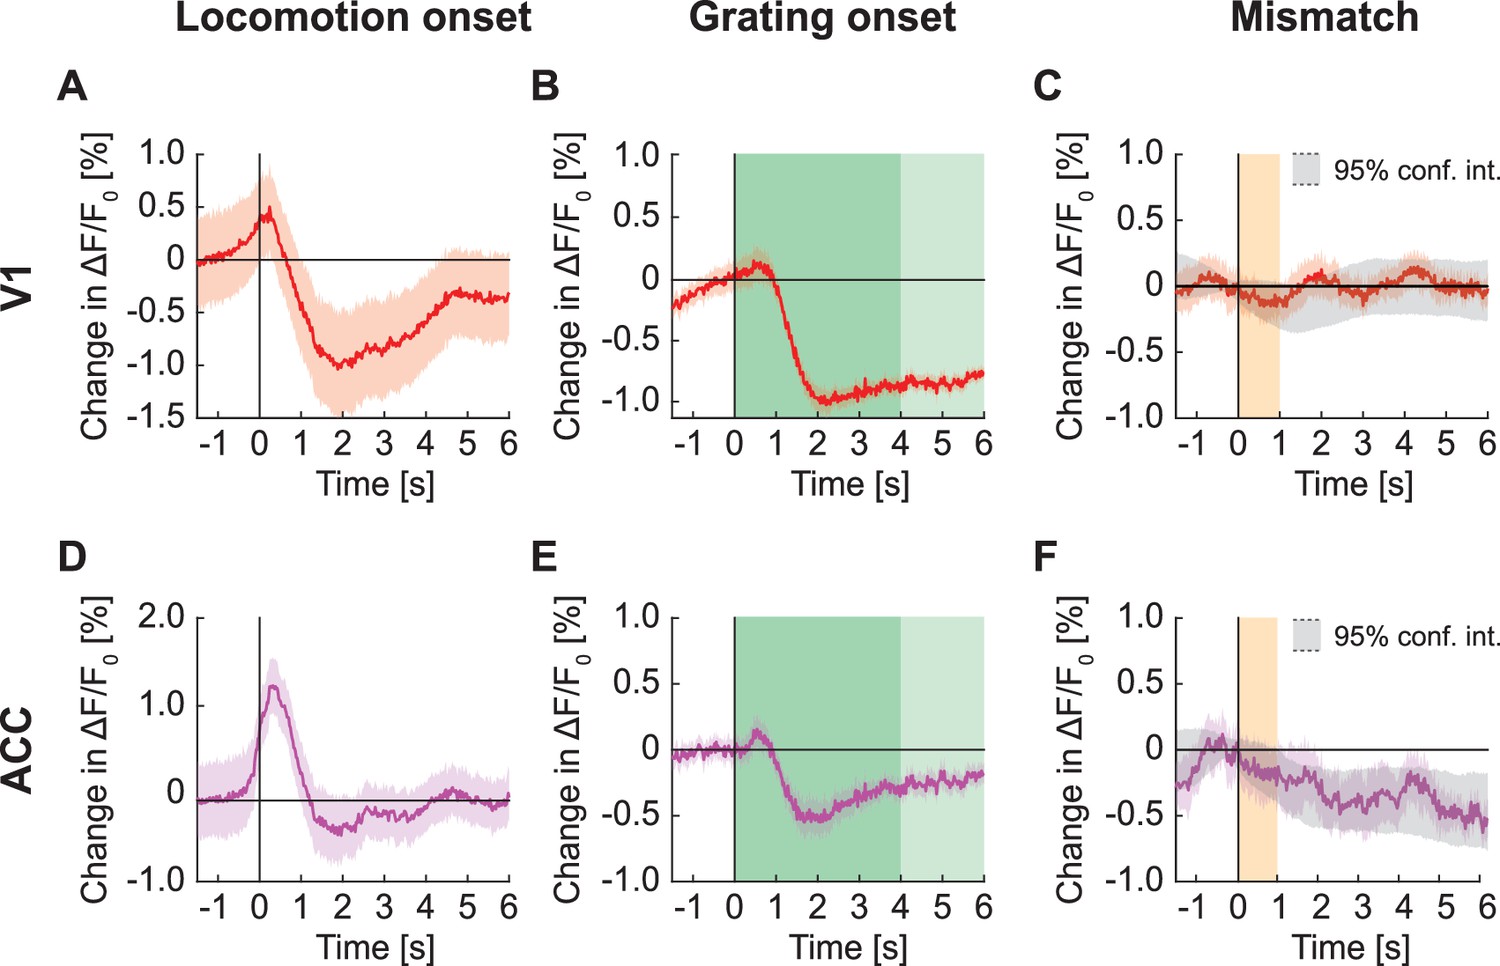
GFP responses in two-photon imaging of neurons in V1 and ACC.
(A) Average change in apparent GFP fluorescence in L2/3 neurons in V1 on locomotion onset. Mean (solid lines) and the bootstrap SE (shading) are calculated as hierarchical bootstrap estimate for each time bin. (B) As in (A), but for grating onsets in L2/3 neurons in V1. Green shading marks the duration of the gratings. (C) As in (A), but for responses to optogenetic stimulation light in L2/3 neurons in V1, with VR on (light red) or in dark (dark red). Pink shading marks the duration of the light stimulus. (D) As in (A), but for visuomotor mismatch in L2/3 neurons in V1. Orange shading marks the duration of visuomotor mismatch. As mismatch events are defined to occur during times of locomotion, and locomotion itself drives GFP responses, we would expect to find an increase in these signals by chance at mismatch. To correct for this, we quantified the distribution of signal amplitude on random triggers during locomotion (95% confidence interval, gray shading). (E) As in (A), but for L5 neurons in V1. (F) As in (B), but for L5 neurons in V1. (G) As in (C), but for L5 neurons in V1. (H) As in (D), but for L5 neurons in V1. (I) As in (A), but for L2/3 neurons in ACC. (J) As in (B), but for L2/3 neurons in ACC. (K) As in (C), but for L2/3 neurons in ACC. (L) As in (D), but for L2/3 neurons in ACC.
Figure 1—figure supplement 1
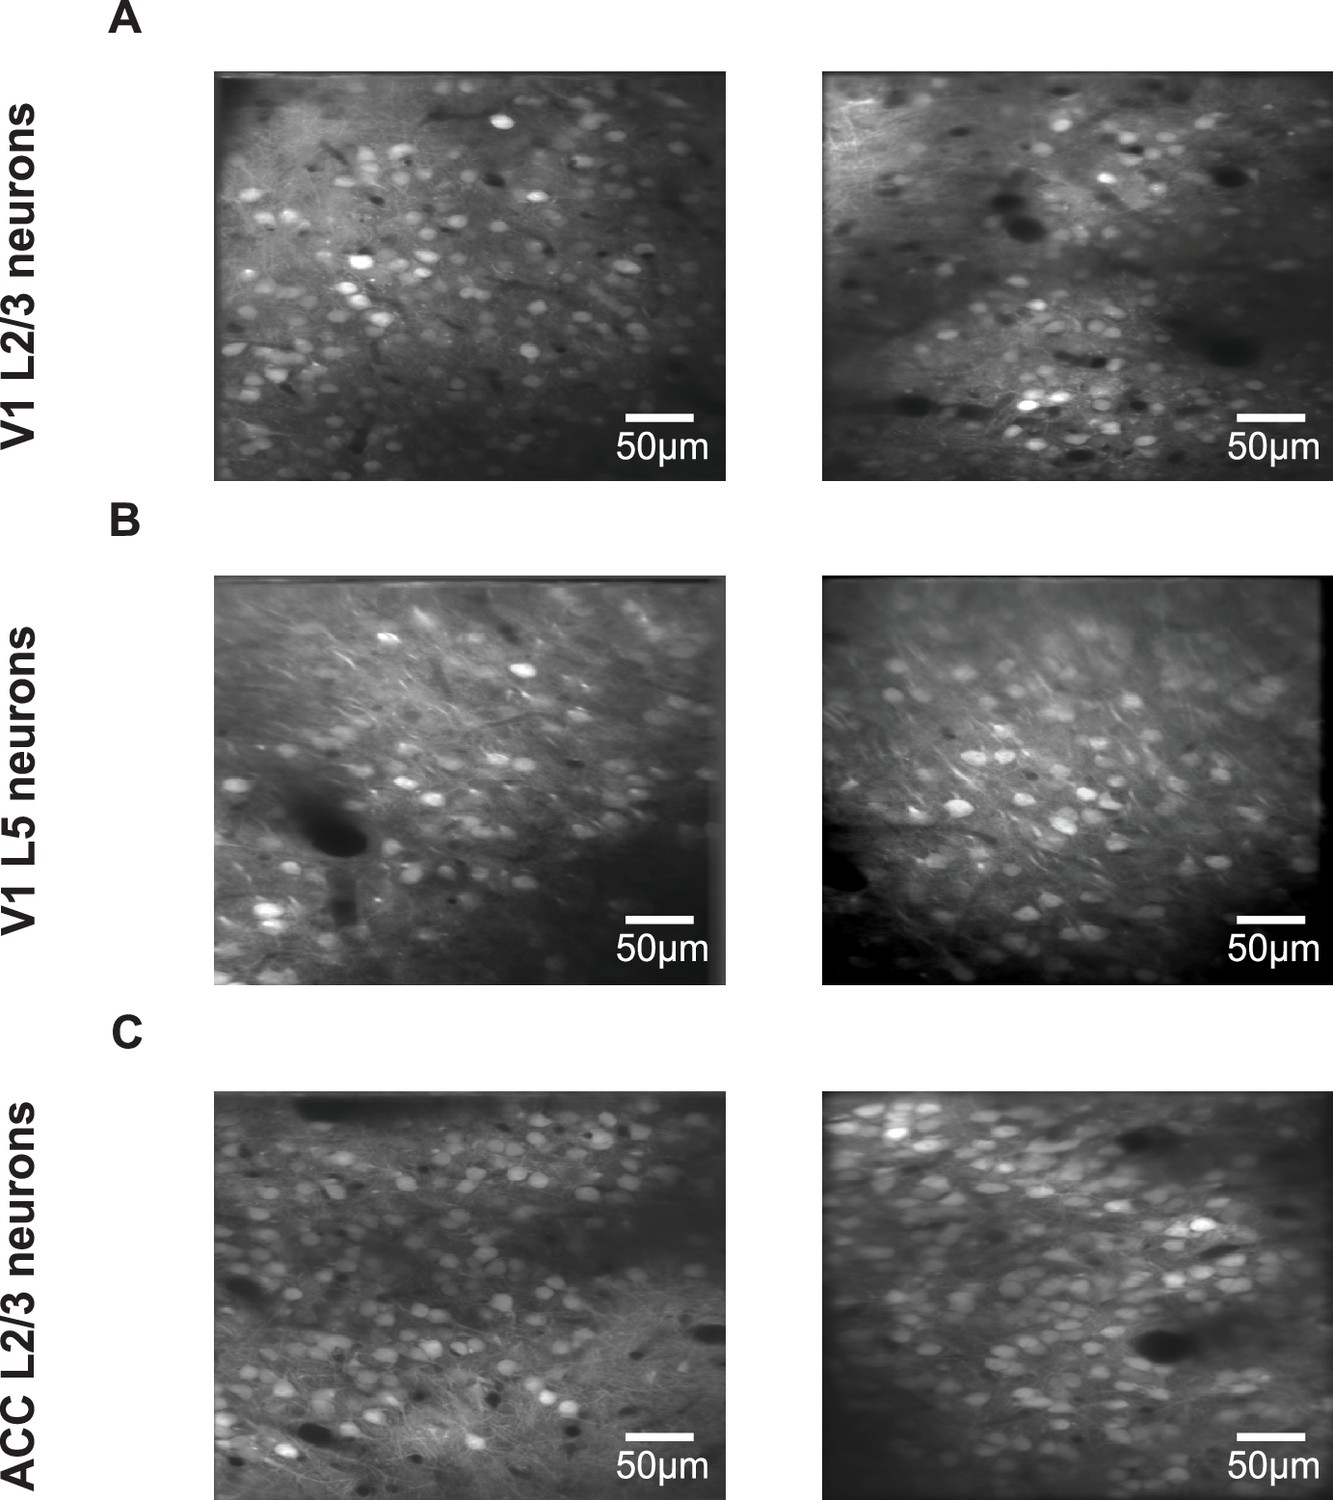
Example imaging sites.
(A) Example of two imaging sites in L2/3 of V1. (B) Example of two imaging sites in L5 of V1. (C) Example of two imaging sites in L2/3 of ACC.
Figure 1—figure supplement 2
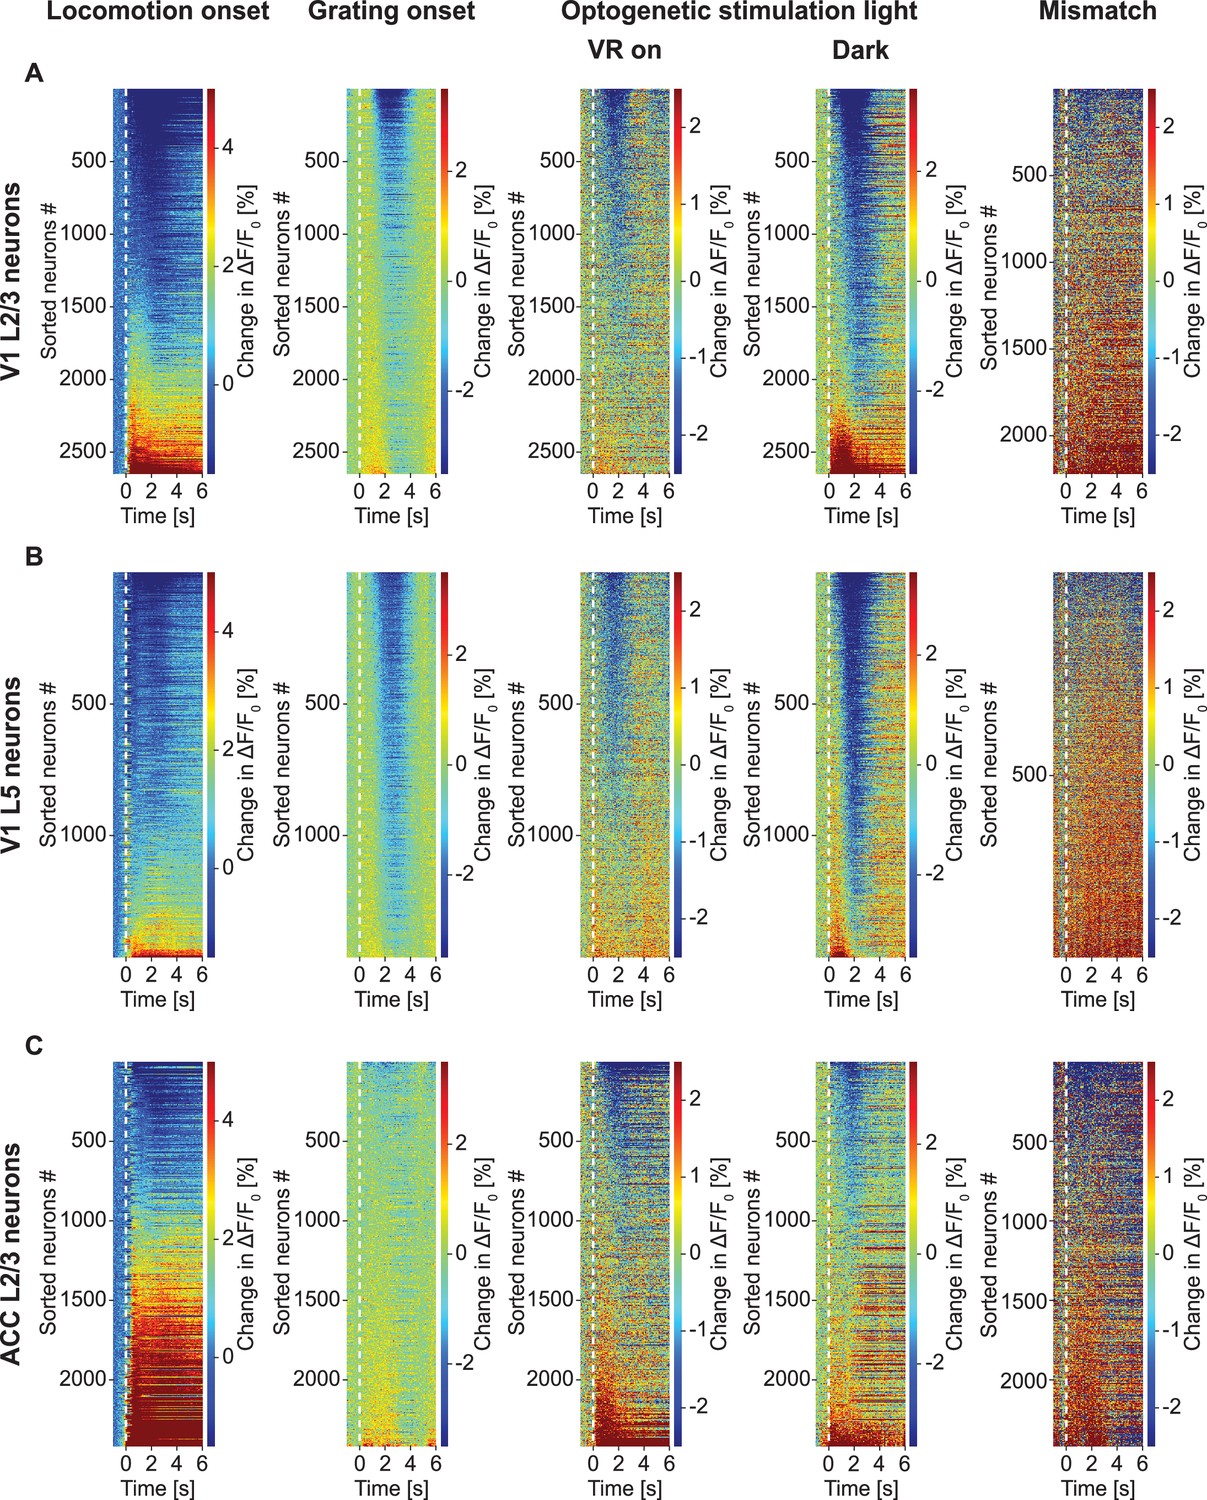
GFP response heatmaps.
(A) Trial-averaged change in apparent GFP fluorescence in L2/3 neurons in V1 to five different stimuli: locomotion onset, grating onset, optogenetic light stimulation with the VR on and in dark, and visuomotor mismatch. Note, the colormap is different for different panels and not always symmetric around 0 to illustrate all changes. (B) As in (A), but for L5 neurons in V1. (C) As in (A), but for L2/3 neurons in ACC.
Figure 1—figure supplement 3
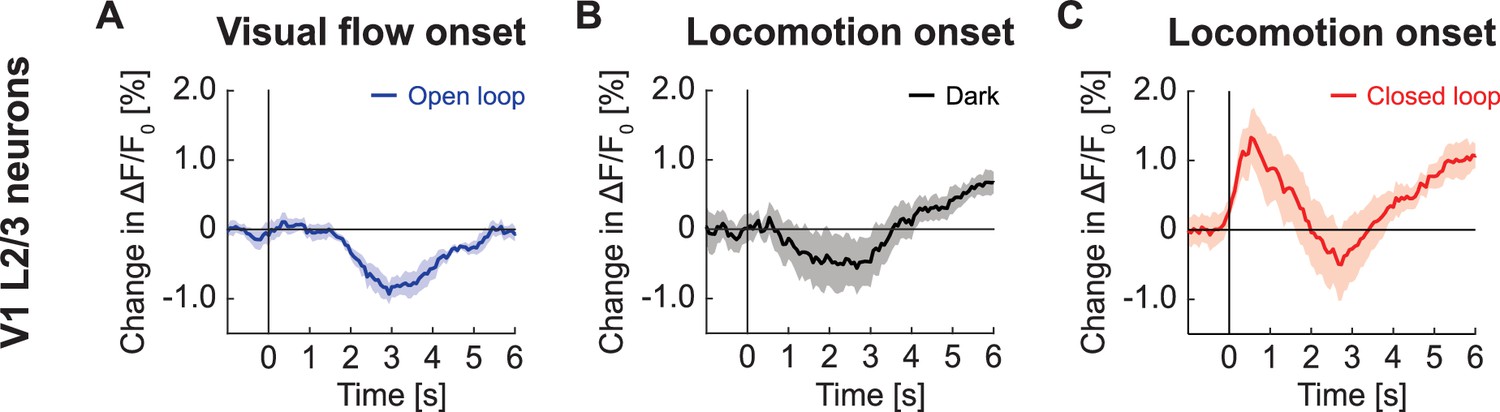
GFP response in V1 L2/3 on locomotion onset in closed loop was not a linear sum of component responses.
(A) Average change in GFP signal from L2/3 in V1 in response to visual flow onset in open loop during stationary periods. Mean (solid lines) and the bootstrap SE (shading) are calculated as hierarchical bootstrap estimate for each time bin. (B) As in (A), but locomotion onset in dark. (C) As in (A), but for locomotion onset in closed loop.
Figure 2
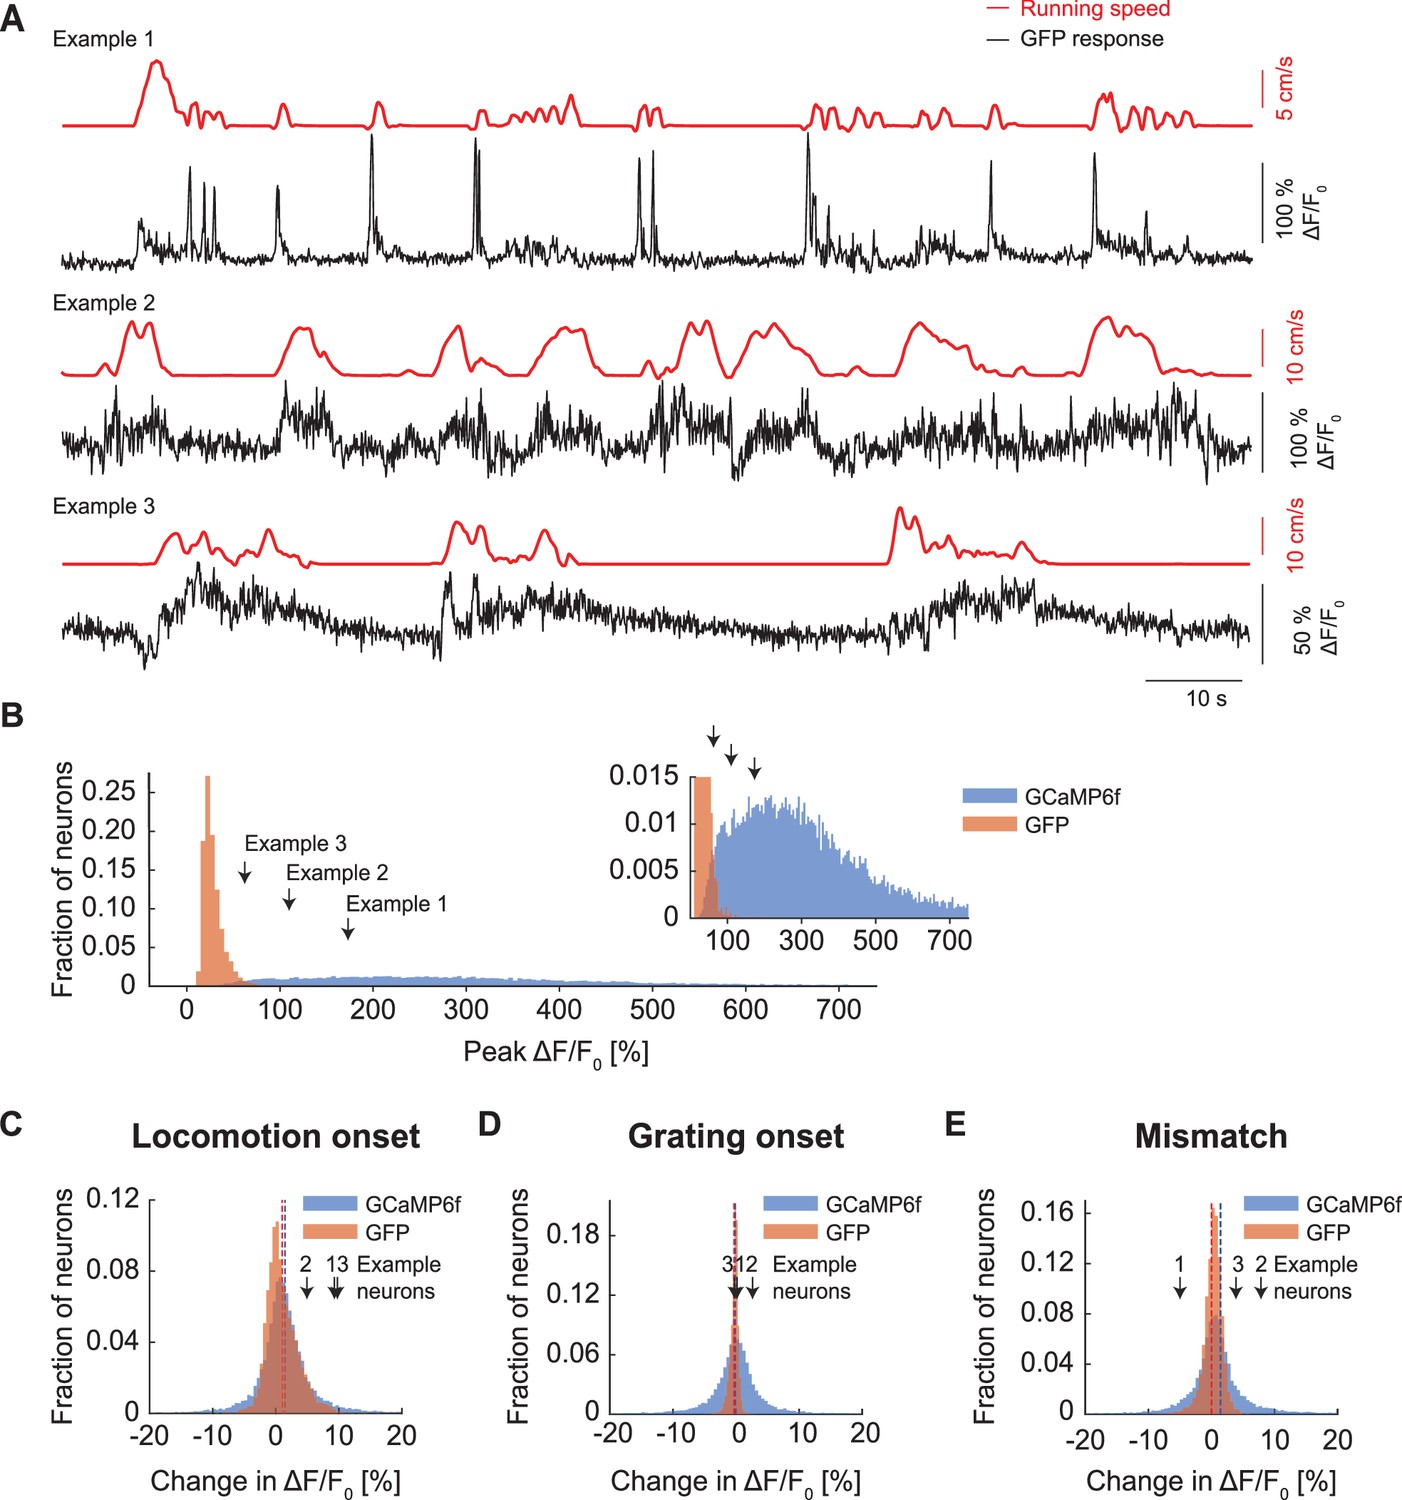
Peak responses of GCaMP6f were larger than those observed with GFP.
(A) Example GFP response traces (black) of three neurons with corresponding running speed traces (red). (B) Peak responses of GCaMP6f (blue) were typically an order of magnitude larger than those observed with GFP (orange). Inset is a zoomed-in version of the same data. (C) Histogram of trial averaged responses on locomotion onset measured with two-photon imaging of calcium indicator (blue) and GFP (orange). Dotted lines indicate the mean response of the distribution of locomotion onset response in calcium indicator (blue) and GFP (orange). (D) As in (C), but for grating onset. (E) As in (C), but for visuomotor mismatch.
Figure 3 with 1 supplement
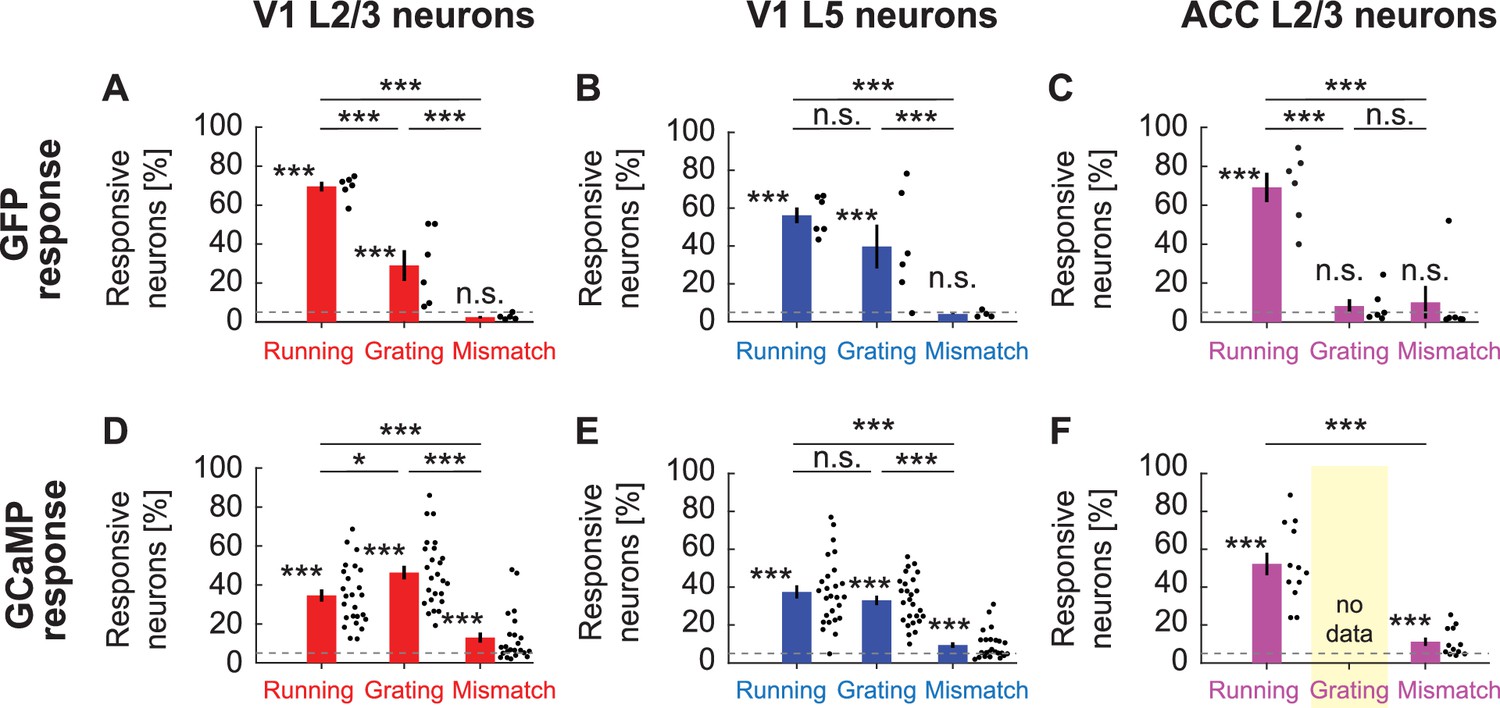
Fraction of neurons with significant GFP responses to different stimuli.
(A) The fraction of GFP expressing V1 L2/3 neurons responsive to locomotion, full-field grating, and visuomotor mismatch onset, quantified for all imaging sites. Each dot is an imaging site, jittered along the x-axis to make them visible. Whiskers mark the SEM. Dashed line indicates chance levels (p=0.05). n.s.: not significant; *: p<0.05; **: p<0.01; ***: p<0.001; see Supplementary file 1 for all statistical information. (B) As in (A), but for V1 L5 neurons. (C) As in (A), but for ACC L2/3 neurons. (D) As in (A), but for V1 L2/3 neurons expressing GCaMP6f. (E) As in (A), but for V1 L5 neurons expressing GCaMP6f. (F) As in (A), but for ACC L2/3 neurons expressing a GCaMP variant (data are from experiments using GCaMP3, GCaMP5, GCaMP6s, and GCaMP6f). Note, we have no grating presentation for this population.
Figure 3—figure supplement 1

Peak GFP response of neurons cannot be explained by GFP expression levels.
The peak ΔF/F0 response of each neuron is plotted against the mean GFP fluorescence intensity. Each dot is a neuron. Superimposed are the hierarchical bootstrap estimates of the median (dark red line) and 95% confidence intervals (light red lines) for each GFP fluorescence bin. We found no evidence of a difference in peak ΔF/F0 response between low, intermediate, and high GFP fluorescence expression levels (indicated by green shading) in our dataset. This is as one would expect, assuming the baseline fluorescence F0 is above the noise floor.
Figure 4 with 3 supplements
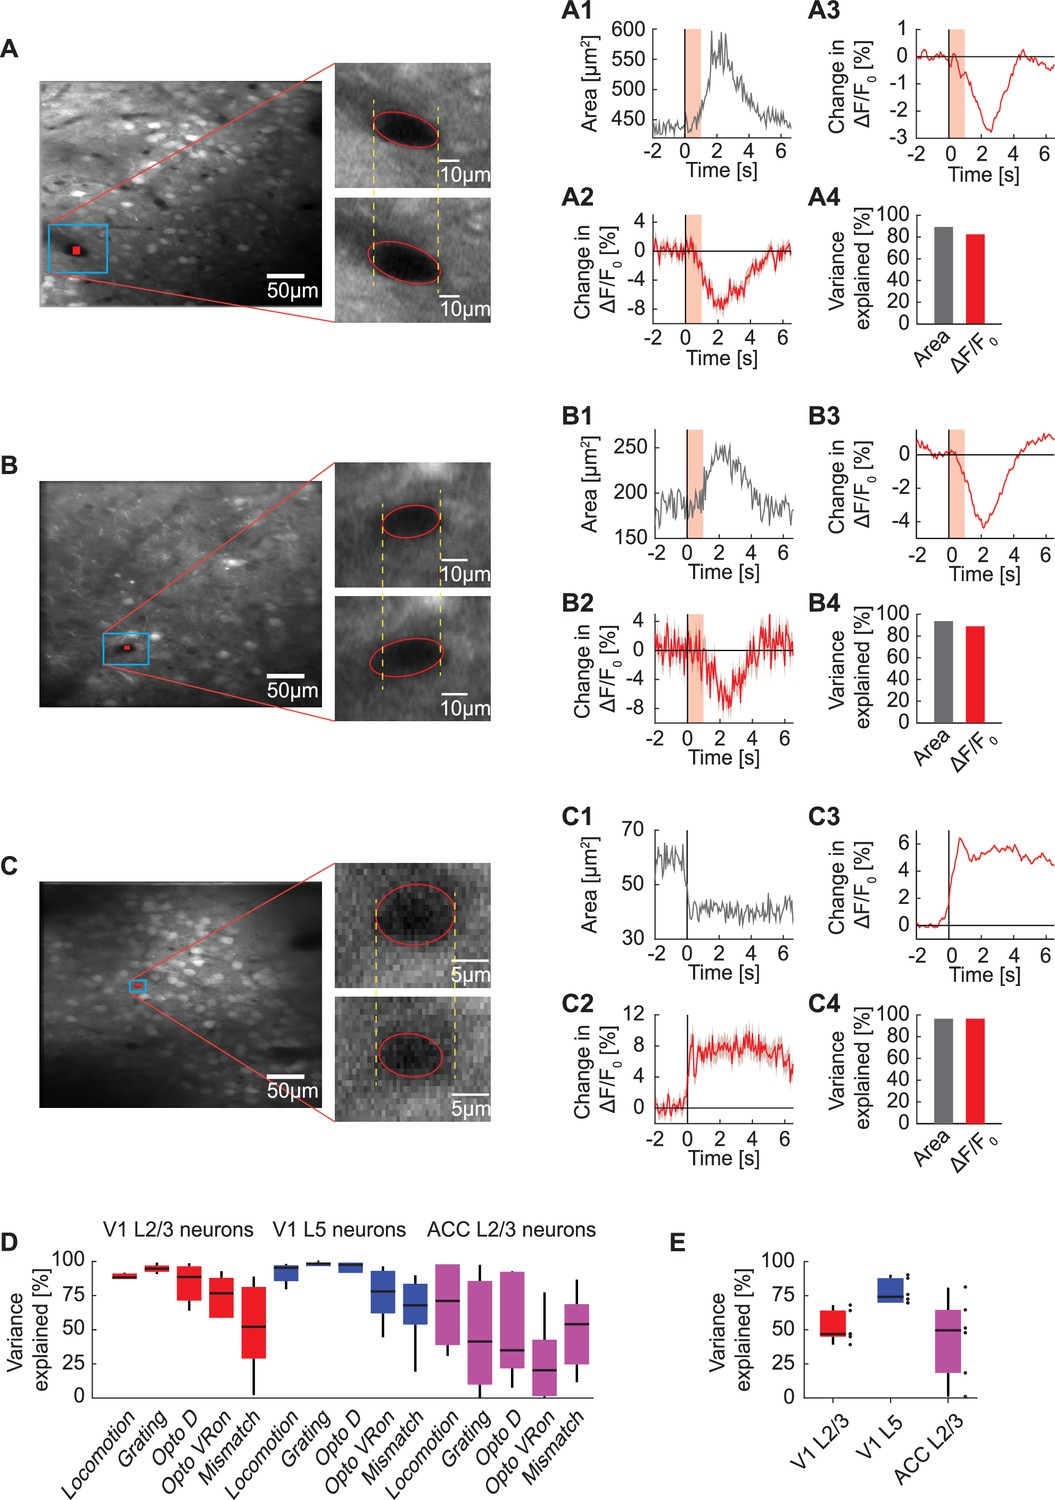
Correlation between blood vessel area and GFP responses.
(A) Example average fluorescence image from an imaging site in L2/3 of V1 under a two-photon microscope. The fluorescence signal is averaged over 22 trials of optogenetic stimulation light directed at V1 while the mouse was in the dark. Shown on the right is an example blood vessel before (upper panel) and after (lower panel) stimulation. (A1) Average area of the example blood vessel shown in (A) (in blue box) on light stimulation. The area of the indicated blood vessel is extracted from the trial averaged two-photon image. Shading in pink indicates the optogenetic light presentation. (A2) Average change in GFP signal from a ROI positioned within the blood vessel (shown in A in red). Mean (red) and SEM (shading) were calculated over light stimulation trials. (A3) Average change in GFP signal from all neurons (268 neurons) simultaneously imaged in the same site. Mean (red) and SEM (shading) were calculated over light stimulation trials. (A4) Variance in average GFP signal in this example L2/3 site in V1 explained by area of the example blood vessel and by the change in GFP signal from a ROI within the blood vessel. (B) As in (A), from an imaging site in L5 of V1. (C) As in (A), from an imaging site in L2/3 of ACC on locomotion onset. (D) Percentage of variance in neuronal GFP signal to individual events explained by the change in GFP signal from blood vessel ROIs. Boxes show 25th and 75th percentile, central mark is the median, and the whiskers extend to the most extreme datapoints not considered outliers. (E) Percentage of variance in neuronal GFP signal over the entire recording explained by blood vessel GFP signal per imaging location. Each datapoint is one imaging site. Boxes show 25th and 75th percentile, central mark is the median, and the whiskers extend to the most extreme datapoints not considered outliers.
Figure 4—figure supplement 1

Brain motion estimate.
(A) Estimate of average absolute brain velocity in pixels per frame at locomotion onset across all imaging sites. This estimate is based on the pixel-wise frame shift correction in the x and y directions. Note, these shifts are corrected in the data. Mean (solid lines) and the bootstrap SE (shading) are calculated as hierarchical bootstrap estimate for each time bin. Euclidean displacement was calculated as the room-mean-squared x- and y- displacement of the imaging site. (B) As in (A), but for grating onsets. Green shading marks the duration of the gratings. There is no appreciable change in brain velocity on visual stimulation. (C) As in (A), but for optogenetic stimulation light presentation in dark. Pink shading marks the duration of the light stimulus. (D) As in (A), but for optogenetic stimulation light presentation in VR. Pink shading marks the duration of the light stimulus.
Figure 4—figure supplement 2

The variance of neuronal GFP signal explained by blood vessel GFP signal as a function of smoothing window.
Black arrow indicates the smoothing window used in Figure 4E.
Figure 4—figure supplement 3

Average locomotion onset response during two-photon GFP imaging.
(A) Putative blood vessel shadow cast on an example imaging plane on locomotion onset. Shown is the baseline subtracted average pixelwise map of GFP response on locomotion onset. (B) Average GFP response of all neurons from the imaging site in (A). (C) Example of a typical response on locomotion onset. Here shadowing is likely caused by blood vessels closer to the surface of the brain. (D) Average GFP response of all neurons from the imaging site in (C).
Figure 5
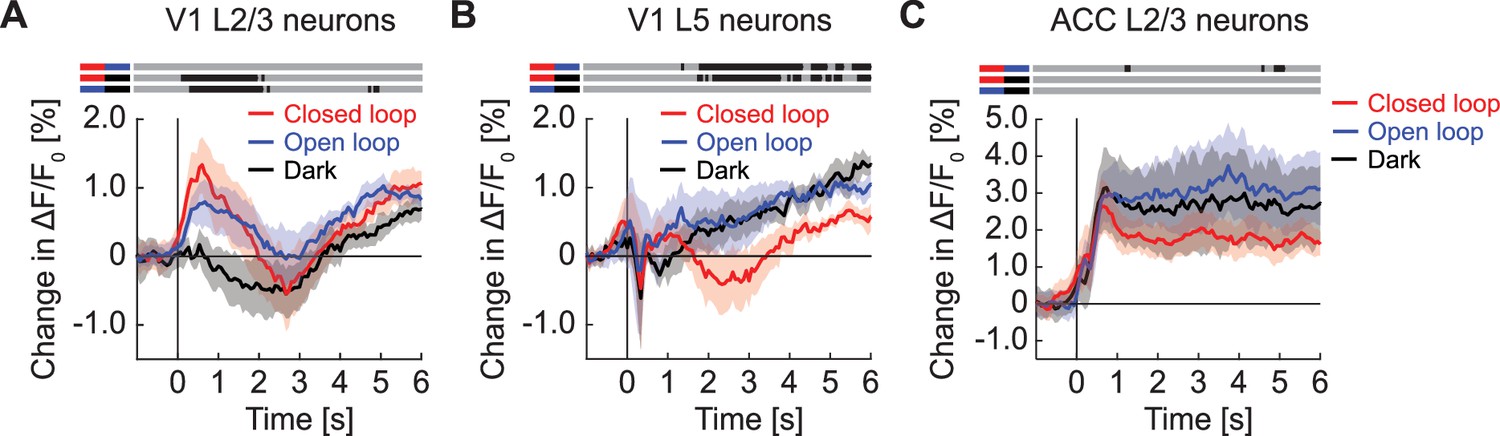
GFP responses at locomotion onset depended on visuomotor condition and cortical region.
(A) Average GFP response in L2/3 neurons in V1 on locomotion onset in closed loop (in red), in open loop (in blue), and in darkness (in grey). Here and in subsequent panels, bins with a significant difference (p<0.01) are indicated by a black line above the plot (lines compared are marked on the left by pairs of colored horizontal bars); those with p>0.01 are marked gray. Mean (solid lines) and the bootstrap SE (shading) are calculated as hierarchical bootstrap estimate for each time bin. (B) As in (A), but for L5 neurons in V1. (C) As in (A), but for L2/3 neurons in ACC.
Figure 6
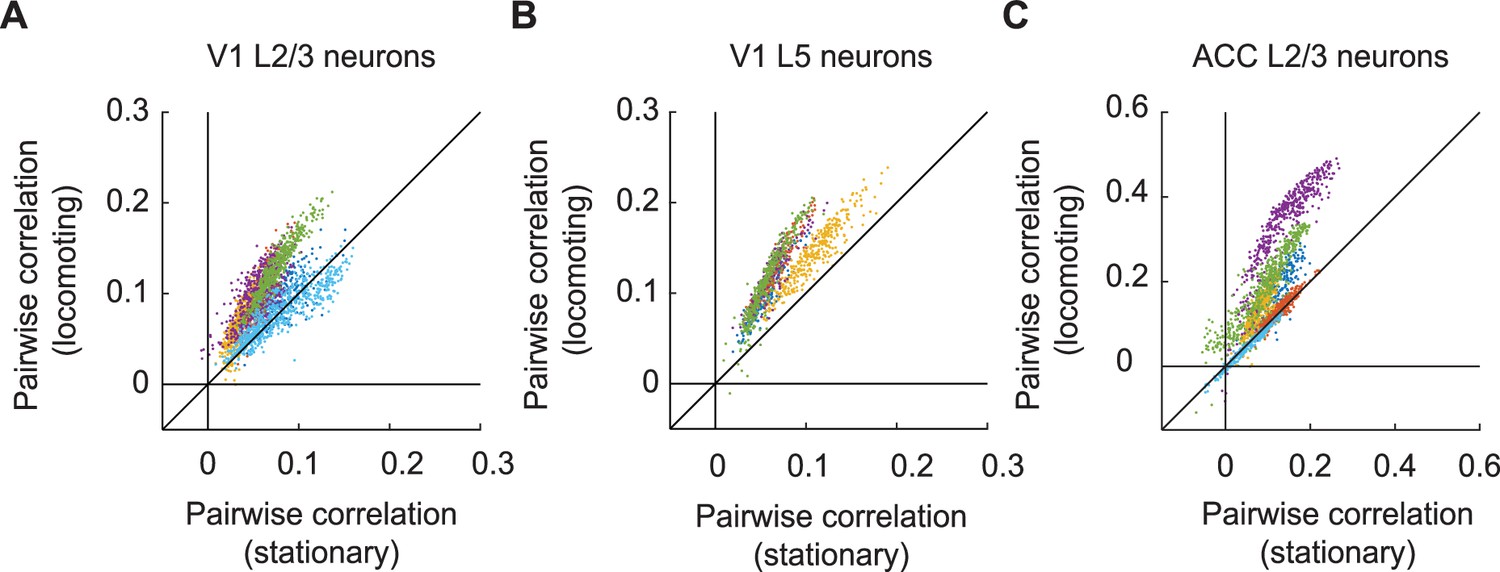
Locomotion increased pairwise correlation of GFP signals between neurons.
(A) Average pairwise correlation in GFP signal of V1 L2/3 neurons while mice were stationary and while they were locomoting. Each dot is the mean pairwise correlation of one neuron to all other neurons in the same imaging site. Colors indicate data from different mice. (B) As in (A), but for V1 L5 neurons. (C) As in (A), but for ACC L2/3 neurons.
Figure 7 with 1 supplement
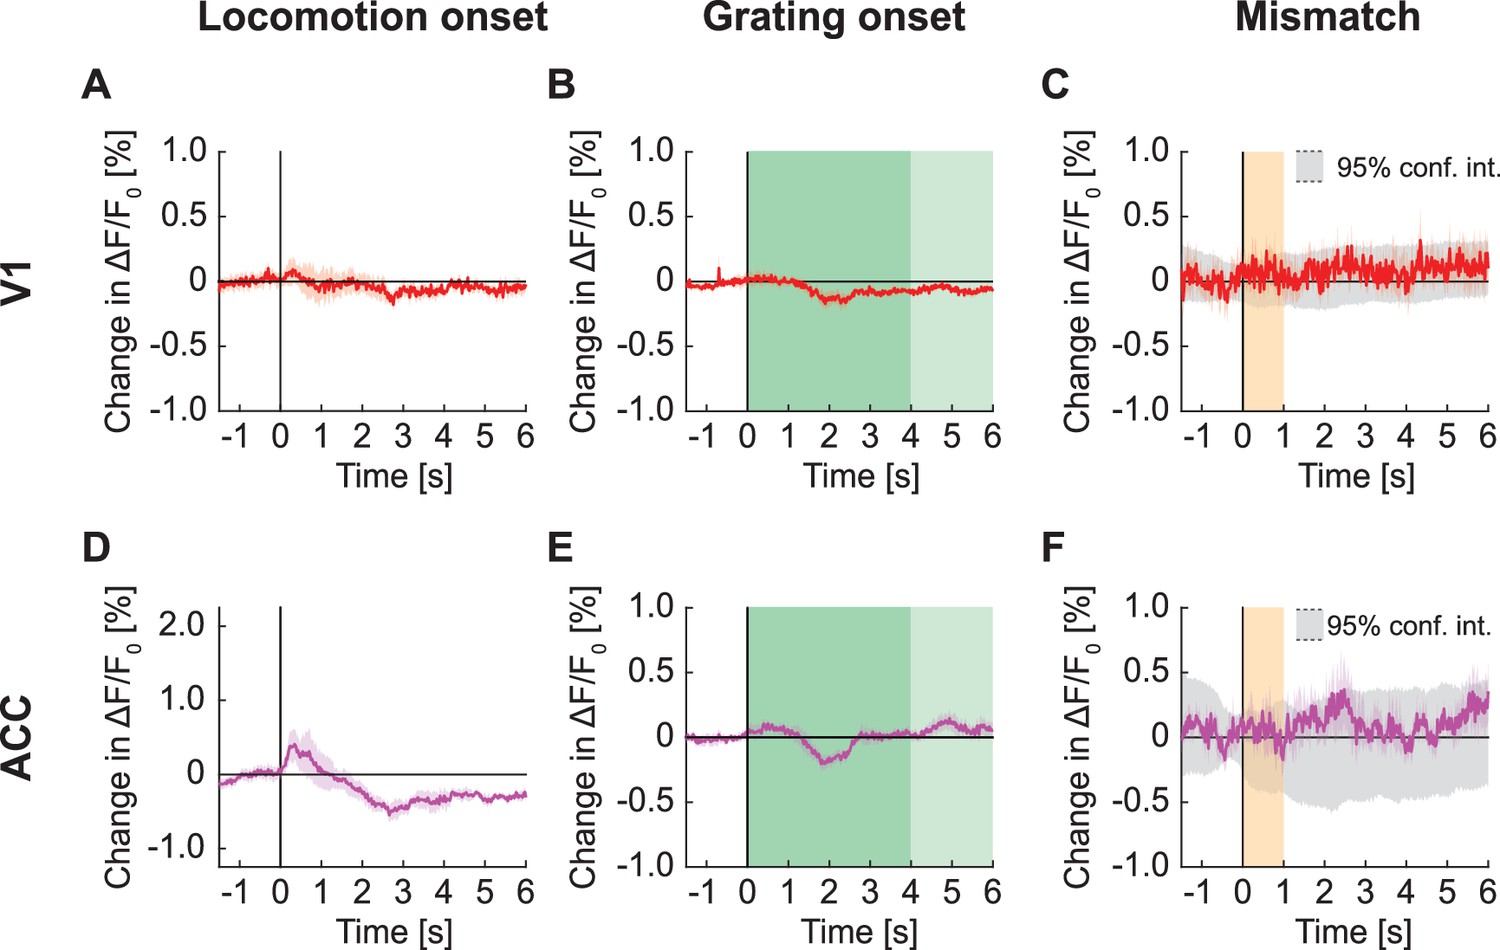
Signals in widefield fluorescence imaging of V1 and ACC in mice expressing GFP.
(A) Average change in signal from V1 on locomotion onset. Mean (solid lines) and the bootstrap SE (shading) are calculated as hierarchical bootstrap estimate for each time bin. (B) As in (A), but for grating onset in V1. Grating duration were randomly selected between 4 s and 8 s (green shading). (C) As in (A), but on visuomotor mismatch in V1. Orange shading marks the duration of visuomotor mismatch. Gray shading marks the 95% confidence interval. (D) As in (A), but for change in signal from ACC on locomotion onset. (E) As in (B), but for change in signal from ACC on grating onset. (F) As in (C), but for change in signal from ACC on visuomotor mismatch.
Figure 7—figure supplement 1
Signals in widefield fluorescence imaging of V1 and ACC in mice not expressing a fluorophore.
(A) Average change in signal from V1 on locomotion onset. Mean (solid lines) and the bootstrap SE (shading) are calculated as hierarchical bootstrap estimate for each time bin, in mice not expressing a fluorophore. (B) As in (A), but on grating onset in V1. Grating duration were randomly selected between 4 s and 8 s (green shading). (C) As in (A), but on visuomotor mismatch in V1. Orange shading indicates the duration of visuomotor mismatch. (D) As in (A), but for change in signal from ACC on locomotion onset. (E) As in (B), but for change in signal from ACC on grating onset. (F) As in (C), but for change in signal from ACC on visuomotor mismatch.
Figure 8 with 1 supplement
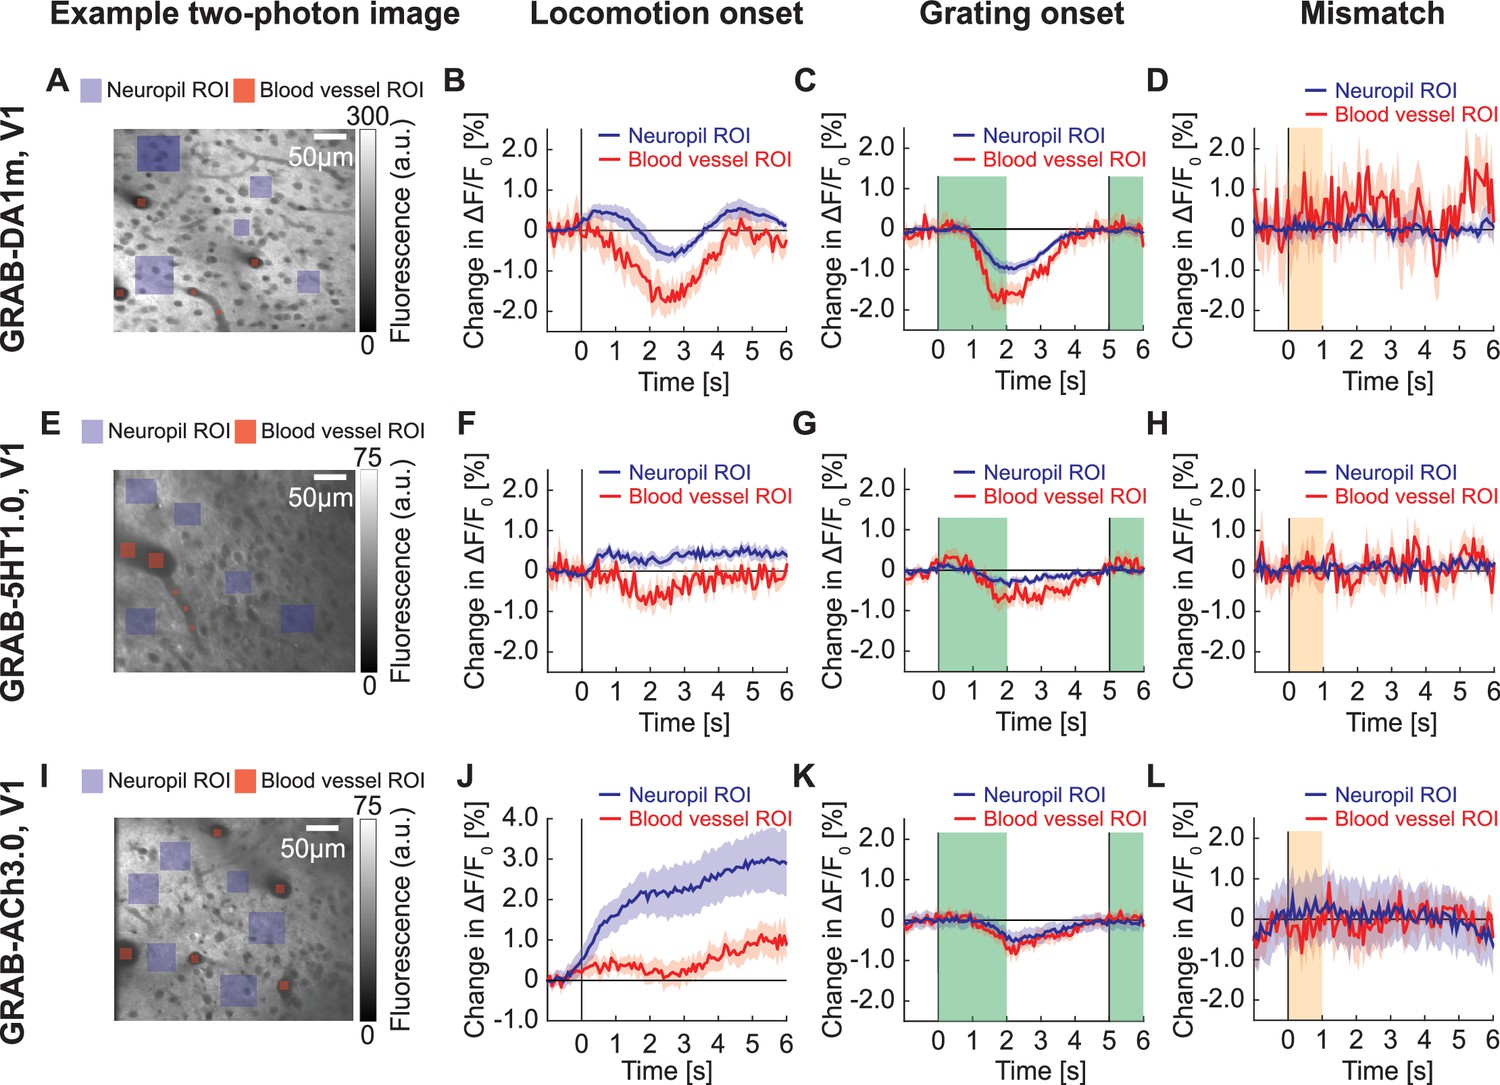
GRAB signals in V1 with two-photon imaging.
(A) Example two-photon image taken in V1 of mouse expressing GRAB-DA1m, with neuropil ROIs (in violet) and blood vessel ROIs (in red). (B) Average change in GRAB-DA1m signal in V1 on locomotion onset in ROIs over neuropil (in black) and in ROIs in blood vessels (in red). Mean (solid lines) and the bootstrap SE (shading) are calculated as hierarchical bootstrap estimate for each time bin. (C) As in (B), but for response to grating onset. Green shading marks the duration of the gratings. (D) As in (B), but for response to visuomotor mismatch. Orange shading marks the duration of visuomotor mismatch. (E) Example two-photon image taken in V1 of mouse expressing GRAB-5HT1.0, with neuropil ROIs (in green) and blood vessel ROIs (in red). (F) Average change in GRAB-5HT1.0 signal in V1 on locomotion onset in ROIs over neuropils (in black) and in ROIs in blood vessels (in red). (G) As in (F), but for response to grating onset. (H) As in (F), but for response to visuomotor mismatch. (I) Example two-photon image of mouse expressing GRAB-ACh3.0 in V1, with neuropil ROIs (in green) and blood vessel ROIs (in red). (J) Average change in GRAB-ACh3.0 fluorescence in V1 in response to locomotion onset in ROIs over neuropil (in black) and in ROIs over blood vessels (in red). (K) As in (J), but for response to grating onset. (L) As in (J), but for response to visuomotor mismatch.
Figure 8—figure supplement 1
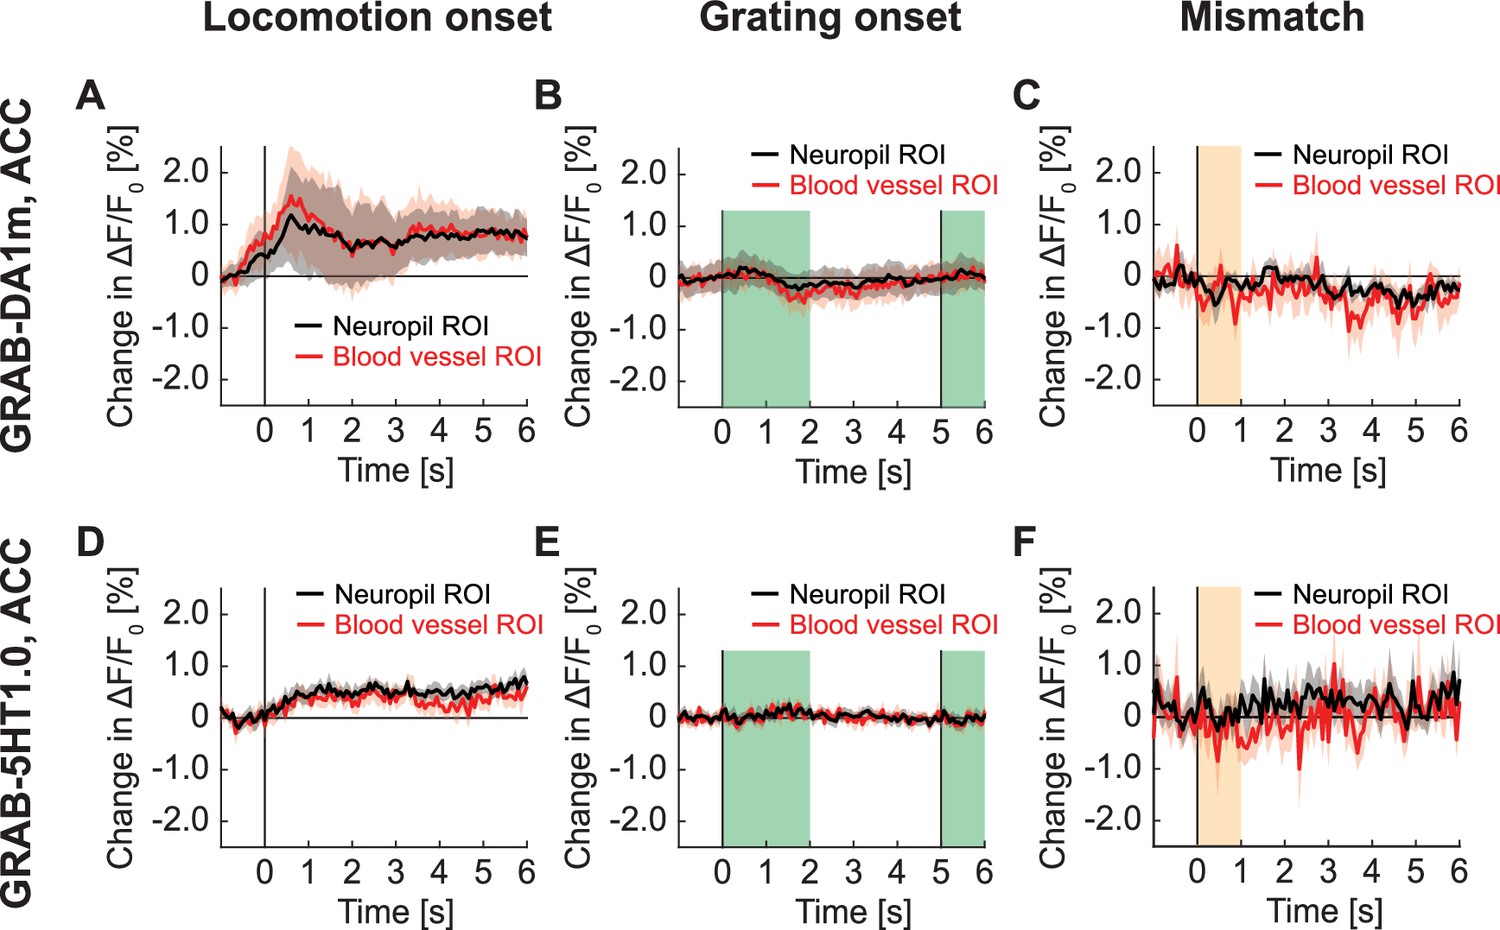
GRAB signals in ACC recorded with two-photon imaging.
(A) Average change in GRAB-DA1m signal in ACC on locomotion onset in ROIs over neuropil (in black) and in ROIs over blood vessels (in red). Mean (solid lines) and the bootstrap SE (shading) are calculated as hierarchical bootstrap estimate for each time bin. (B) As in (A), but for response to full-field grating onset. Green shading marks the duration of the gratings. (C) As in (A), but for response to visuomotor mismatch. (E) Average change in GRAB-5HT1.0 signal in ACC on locomotion onset in ROIs over neuropil (in black) and in ROIs over blood vessels (in red). (F) As in (G), but for response to grating onset. (G) As in (G), but for response to visuomotor mismatch.
Figure 9
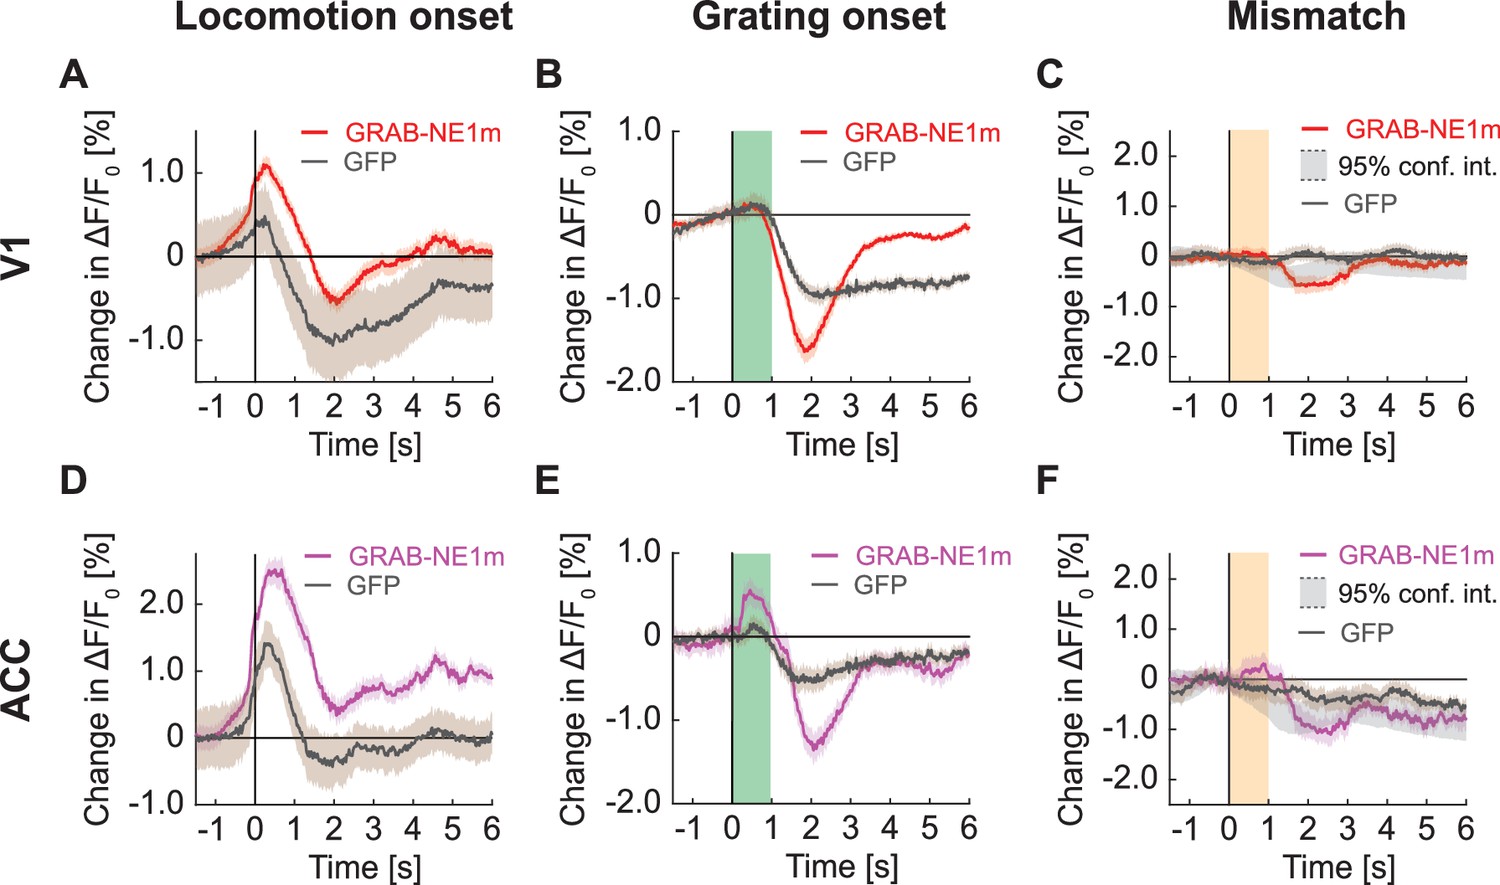
Signals of V1 and ACC in widefield imaging in mice expressing GRAB-NE1m.
(A) Average change in signal from V1 on locomotion onset. Mean (solid lines) and the bootstrap SE (shading) are calculated as hierarchical bootstrap estimate for each time bin. Here and below, GFP response (in gray) from Figure 7 overlaid. (B) As in (A), but for grating onset in V1. Green shading marks the duration of the gratings. (C) As in (A), but for visuomotor mismatch in V1. Orange shading marks the duration of visuomotor mismatch. Gray shading marks the 95% confidence interval. (D) As in (A), but for change in signal from ACC on locomotion onset. (E) As in (B), but for change in signal from ACC on grating onset. (F) As in (C), but for change in signal from ACC on visuomotor mismatch.
Author response image 1
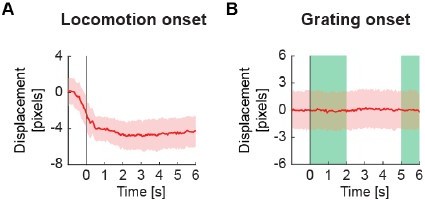
Average signed brain displacement.
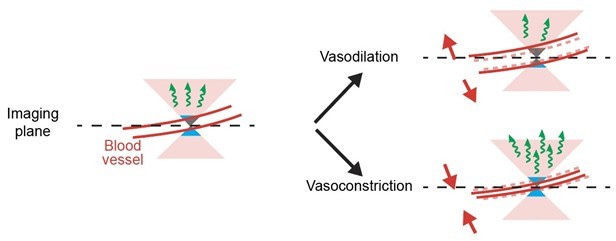
Author response image 2
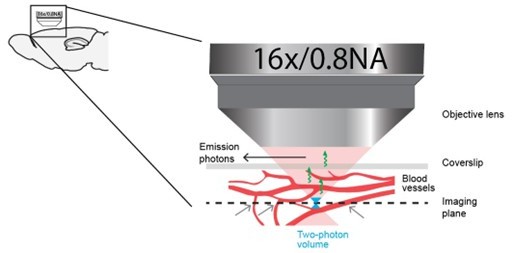
A schematic representation of the cone of illumination.
Author response image 3
Average response of ROIs placed within blood vessels co-vary with hemodynamic occlusion.
Tables
Key resources table
| Reagent type (species) or resource | Designation | Source or reference | Identifiers | Additional information |
|---|---|---|---|---|
| Strain, strain background (adeno-associated virus) | AAV2/1-Ef1α-eGFP-WPRE (1012 GC/ml) | FMI vector core | vector.fmi.ch | |
| Strain, strain background (adeno-associated virus) | AAV2/1-Ef1α-GCaMP6f-WPRE (1011–1014 GC/ml) | FMI vector core | vector.fmi.ch | |
| Strain, strain background (adeno-associated virus) | AAV2/9-hSyn-GRAB-DA1m (1012 GC/ml) | FMI vector core | vector.fmi.ch | |
| Strain, strain background (adeno-associated virus) | AAV2/9-hSyn-GRAB-5HT1.0 (1013 GC/ml) | FMI vector core | vector.fmi.ch | |
| Strain, strain background (adeno-associated virus) | AAV2/9-hSyn-GRAB-ACh3.0 (1013 GC/ml) | FMI vector core | vector.fmi.ch | |
| Strain, strain background (adeno-associated virus) | AAV-PHP.eB-EF1α-eGFP (1013 GC/ml) | FMI vector core | vector.fmi.ch | |
| Strain, strain background (adeno-associated virus) | AAV-PHP.eB-hSyn-GRAB-NE1m (1013 GC/ml) | FMI vector core | vector.fmi.ch | |
| Chemical compound, drug | Fentanyl citrate | Actavis | CAS 990-73-8 | Anesthetic compound |
| Chemical compound, drug | Midazolam (Dormicum) | Roche | CAS 59467-96-8 | Anesthetic compound |
| Chemical compound, drug | Medetomidine (Domitor) | Orion Pharma | CAS 86347-14-0 | Anesthetic compound |
| Chemical compound, drug | Ropivacaine | Presenius Kabi | CAS 132112-35-7 | Analgesic compound |
| Chemical compound, drug | Lidocaine | Bichsel | CAS 137-58-6 | Analgesic compound |
| Chemical compound, drug | Buprenorphine | Reckitt Benckiser Healthcare | CAS 52485-79-7 | Analgesic compound |
| Chemical compound, drug | Humigel | Virbac | - | Ophthalmic gel |
| Chemical compound, drug | Flumazenil (Anexate) | Roche | CAS 78755-81-4 | Anesthetic antagonist |
| Chemical compound, drug | Atipamezole (Antisedan) | Orion Pharma | CAS 104054-27-5 | Anesthetic antagonist |
| Chemical compound, drug | Metacam | Boehringer Ingelheim | CAS 71125-39-8 | Analgesic compound |
| Chemical compound, drug | N-Butyl-2-cyanoacrylate | Braun | CAS 6606-65-1 | Histoacryl |
| Chemical compound, drug | Dental cement (Paladur) | Heraeus Kulzer | CAS 9066-86-8 | |
| Genetic reagent (Mus musculus) | C57BL/6 | Charles River | - | |
| Genetic reagent (M. musculus) | B6J.129S6-Chattm2(Cre)Lowl/MwarJ Alias used here: ChAT-IRES-Cre | Jackson Laboratories | RRID:IMSR_JAX:028861 | Cre expression in cholinergic neurons |
| Genetic reagent (M. musculus) | B6J.FVB(Cg)- Tg(Tlx3-cre)PL56Gsat/Mmucd Alias used here: Tlx3-Cre | MMRRC | RRID:MMRRC_041158-UCD | Cre expression in a subset of L5 neurons |
| Genetic reagent (M. musculus) | B6.Cg- Tg(Fos/EGFP)1-3Brth/J Alias used here: fosGFP | Jackson Laboratories | RRID:IMSR_JAX:014135 | Cre expression in a subset of cortical neurons |
| Software, algorithm | MATLAB (2023b) | The MathWorks | RRID:SCR_001622 | Data analysis |
| Software, algorithm | LabVIEW | National Instruments | RRID:SCR_014325 | Hardware control |
| Software, algorithm | Two-photon acquisition software | Keller laboratory | sourceforge.net/p/iris-scanning/ | Data acquisition |
| Software, algorithm | Image data processing software | Keller laboratory | sourceforge.net/p/iris-scanning/calliope | Data processing |
| Software, algorithm | Python | python.org | RRID:SCR_008394 | Virtual reality |
| Software, algorithm | Panda3D | panda3d.org | RRID:SCR_021216 | Virtual reality |
| Other | Virtual reality and two-photon setup | Leinweber et al., 2014; Leinweber et al., 2017 | N/A | Hardware setup |
| Other | OBIS 673 nm LX | Coherent | Cat#1187194 | Optogenetic stimulation laser |
| Other | LED | Prizmatix | UHP-T-595 | Sham stimulation |
| Other | Titanium headplate | FMI/ETHZ workshop | N/A | Mice head-fixation |
| Other | Dental drill | Meisinger | N/A | For craniotomy |
Additional files
-
Supplementary file 1
Statistical information on all analysis.
- https://cdn.elifesciences.org/articles/104914/elife-104914-supp1-v1.docx
-
Supplementary file 2
Number of mice in different experimental groups.
- https://cdn.elifesciences.org/articles/104914/elife-104914-supp2-v1.docx
-
MDAR checklist
- https://cdn.elifesciences.org/articles/104914/elife-104914-mdarchecklist1-v1.docx
Download links
A two-part list of links to download the article, or parts of the article, in various formats.
Downloads (link to download the article as PDF)
Open citations (links to open the citations from this article in various online reference manager services)
Cite this article (links to download the citations from this article in formats compatible with various reference manager tools)
Quantification of the effect of hemodynamic occlusion in two-photon imaging of mouse cortex
eLife 14:RP104914.
https://doi.org/10.7554/eLife.104914.3


