Successful retrieval of competing spatial environments in humans involves hippocampal pattern separation mechanisms
- University of California, Davis, United States
Figures
Figure 1 with 2 supplements

Experimental design and performance.
(a) Depiction of contextual modifications between environments. Each colored box represents a different target store. Cities 1 & 2 (similar cities) are identical aside from swapped position of stores (purple and teal). City 3 (interference city) shares the same stores as similar cities but in a novel layout. City 4 (distinct city) has a novel layout and stores. (b) During encoding participants completed 4 rounds of navigation and map drawing of each city. (c) Retrieval consisted of 8 blocks of city-specific distance judgments. (d) Retrieval accuracy demonstrates lower performance on city 3. **p<0.01
Figure 1—figure supplement 1
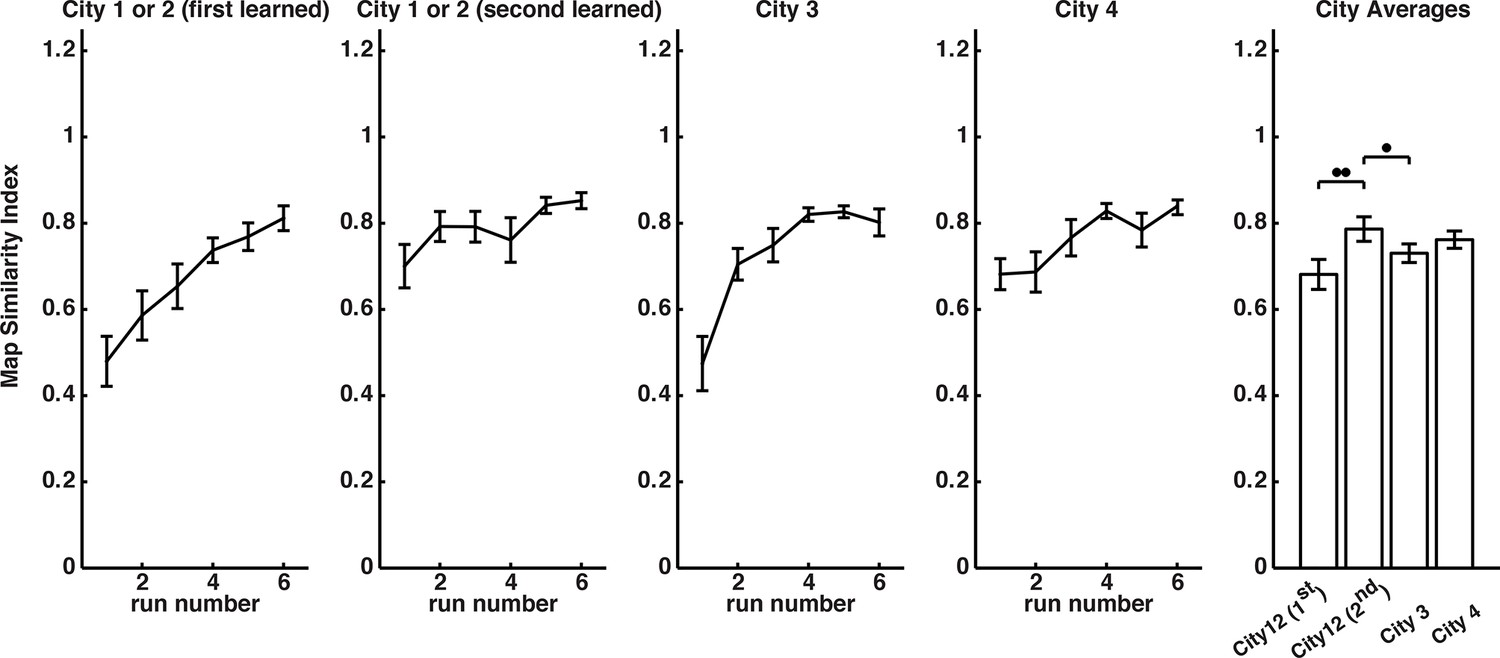
Map drawing learning curves.
https://doi.org/10.7554/eLife.10499.004
Figure 1—figure supplement 2
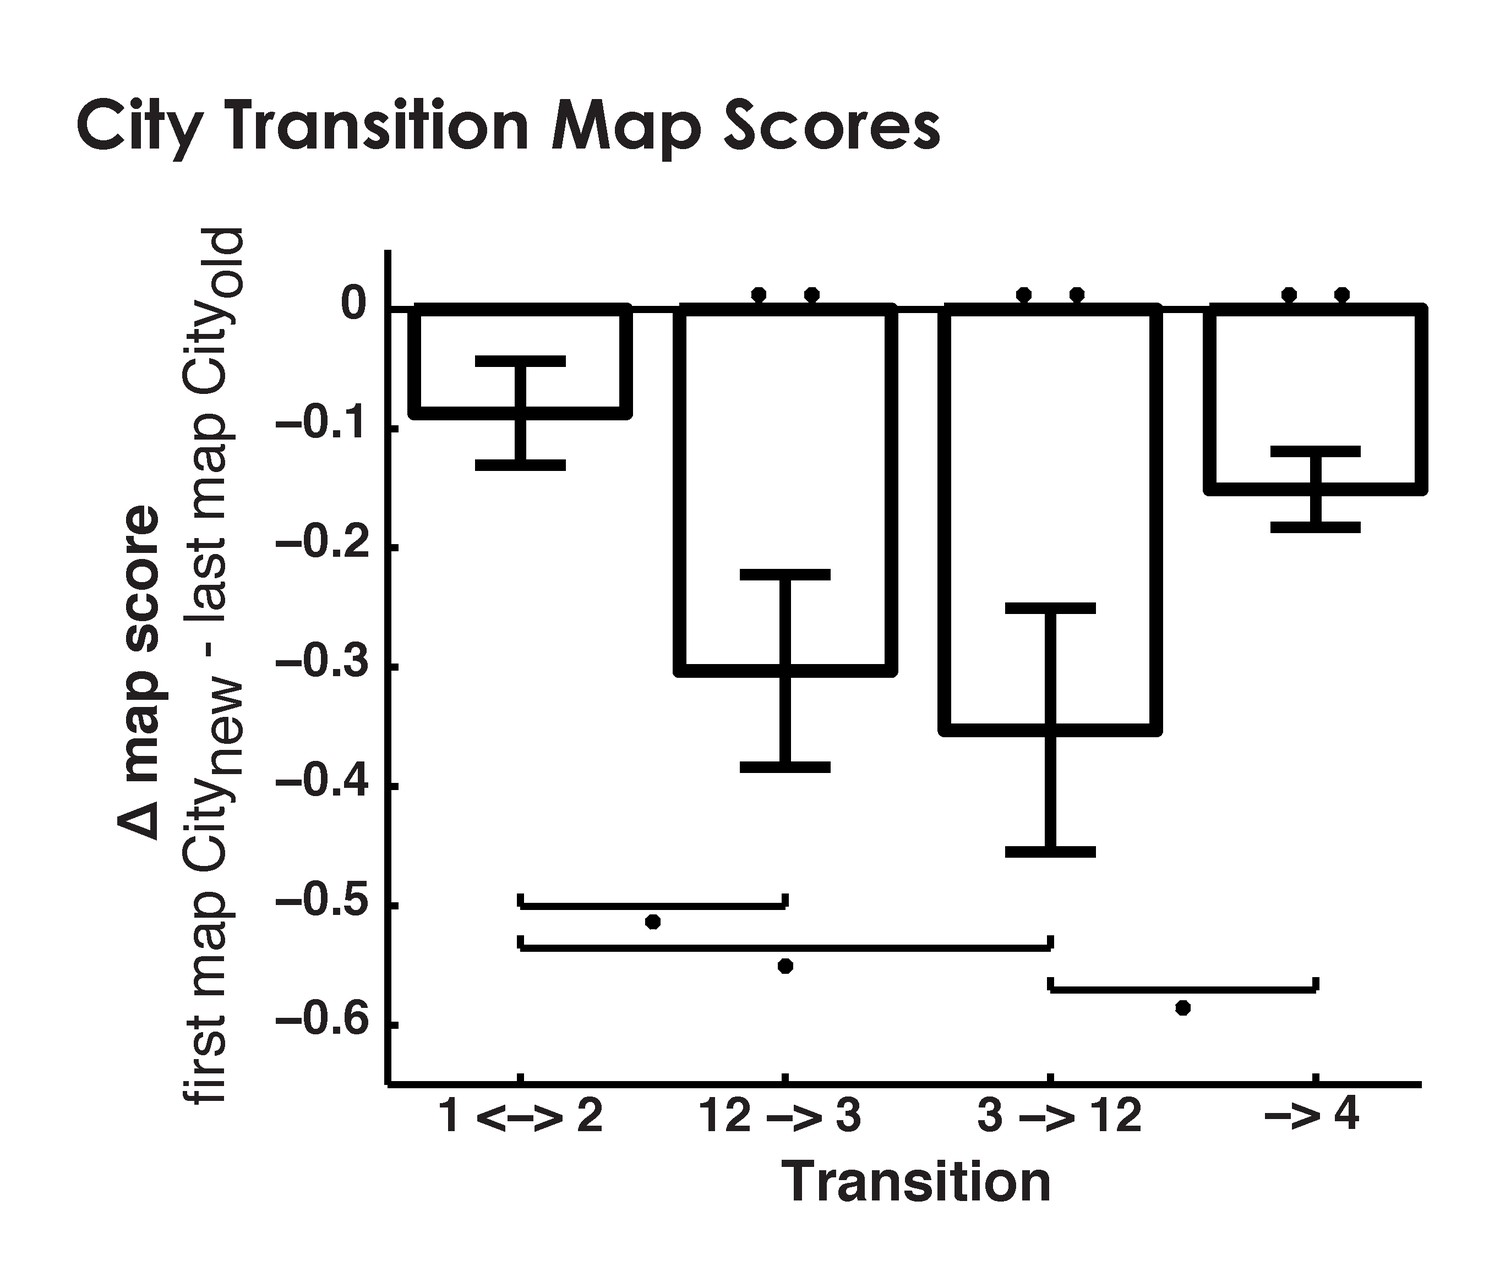
City transition map scores.
https://doi.org/10.7554/eLife.10499.005
Figure 2 with 1 supplement
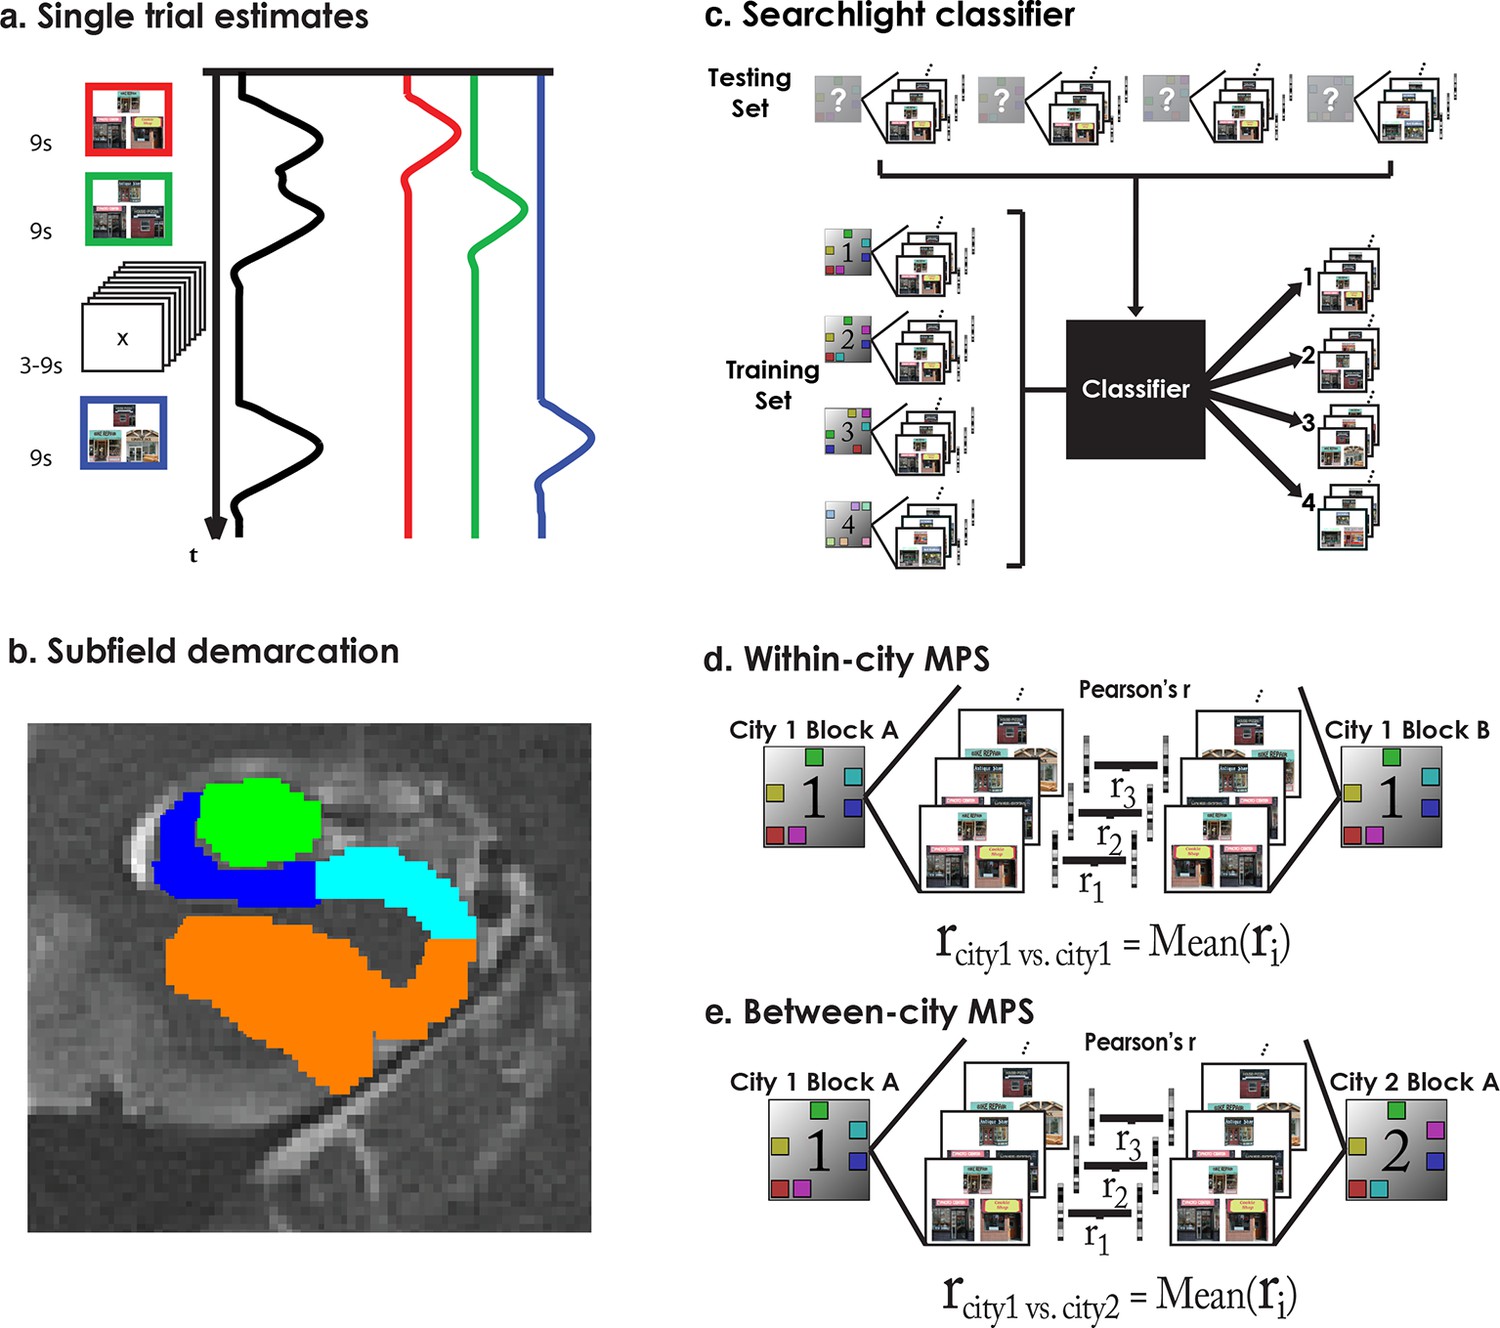
Analysis methods.
(a) Single trial parameter estimates were generated by building a single model with a separate regressor for each trial. (b) Subfields were demarcated manually to create separate ROIs for CA3/DG, CA1, Subiculum, and PHG. (c) The searchlight classifier was trained using single trial estimates from half of the retrieval blocks and tested on the remaining retrieval data. Training/testing was repeated for all searchlight spheres in each subjects MTLs, creating subject specific statistical maps. (d) Within-city similarity was assessed for each ROI by extracting the trial parameter estimates from the subfields and correlating between matched trials of a city’s “A” and “B” retrieval blocks. (e) Between-city similarity was calculated consistent with within-city similarity.
Figure 2—figure supplement 1
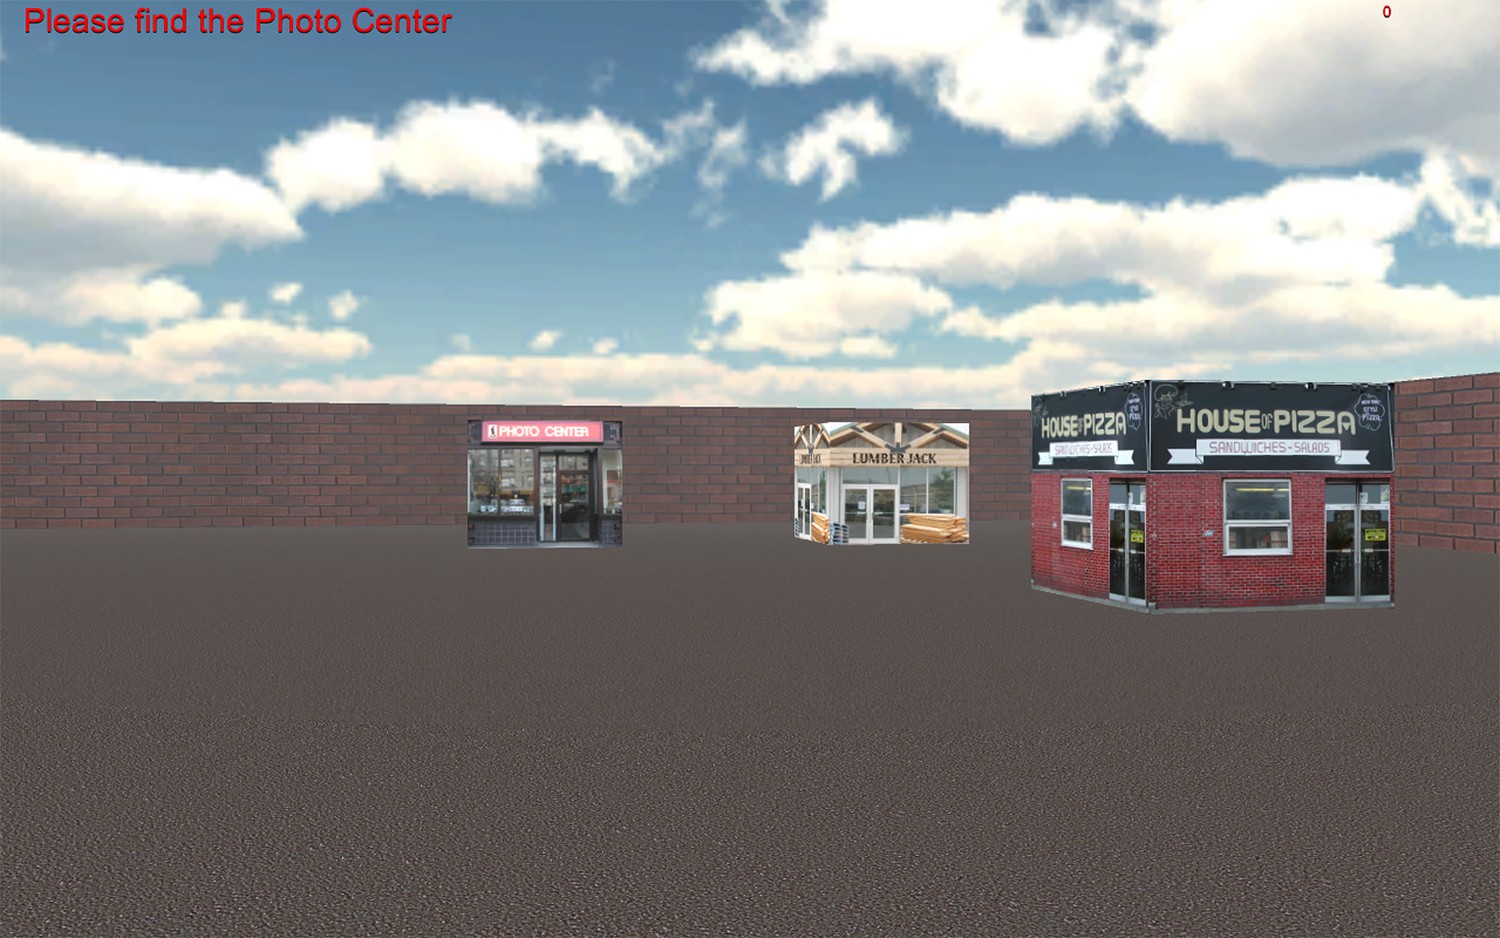
Snapshot of virtual environment.
https://doi.org/10.7554/eLife.10499.007
Figure 3 with 2 supplements
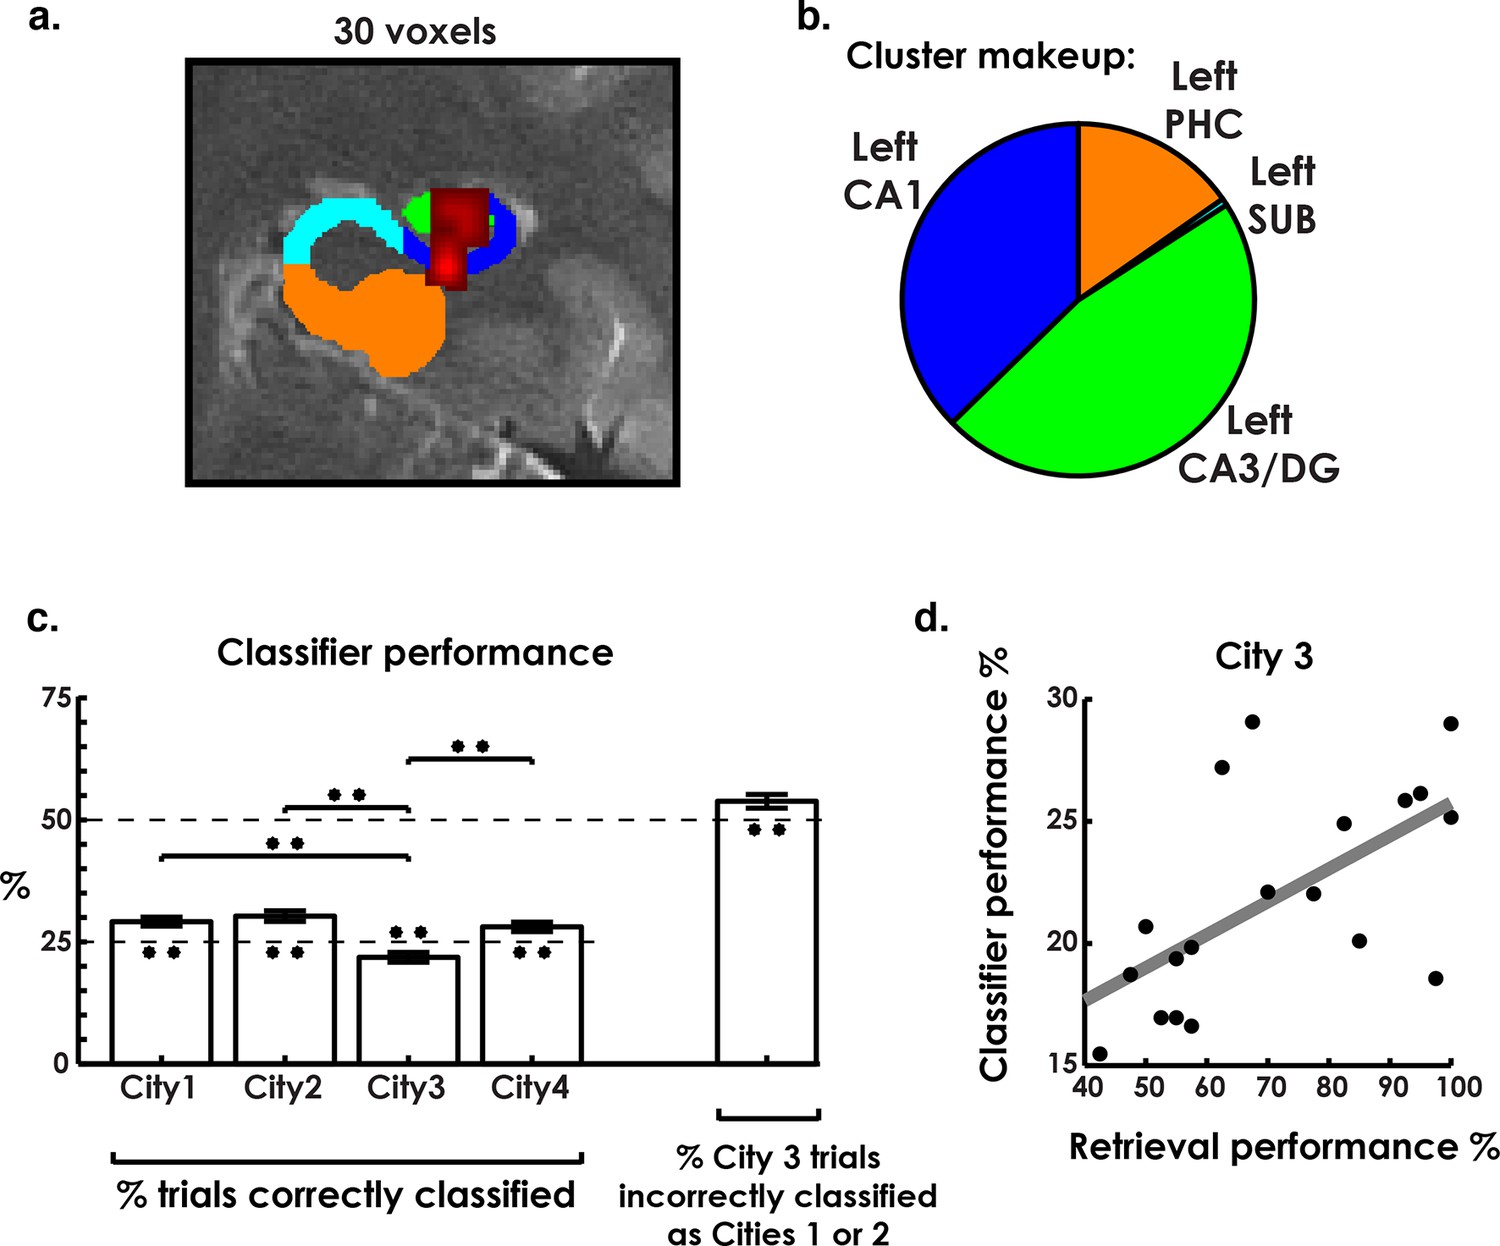
Environment classification.
(a) City classification searchlight revealed a cluster of above chance classification performance throughout much of left CA3/DG and CA1. (b) Pie chart of distribution of voxels in the searchlight showing their predominance in CA3/DG and CA1. (c) Classifier performance of each city revealed above chance performance on cities 1, 2, and 4 and below chance performance on city 3. Further analysis of city 3 classification performance revealed above-chance misclassification of city 3 trials as cities 1 & 2. (d) City 3 (interference city) retrieval performance and city 3 classifier performance were positively correlated. *p<0.05, **p<0.01.
Figure 3—figure supplement 1
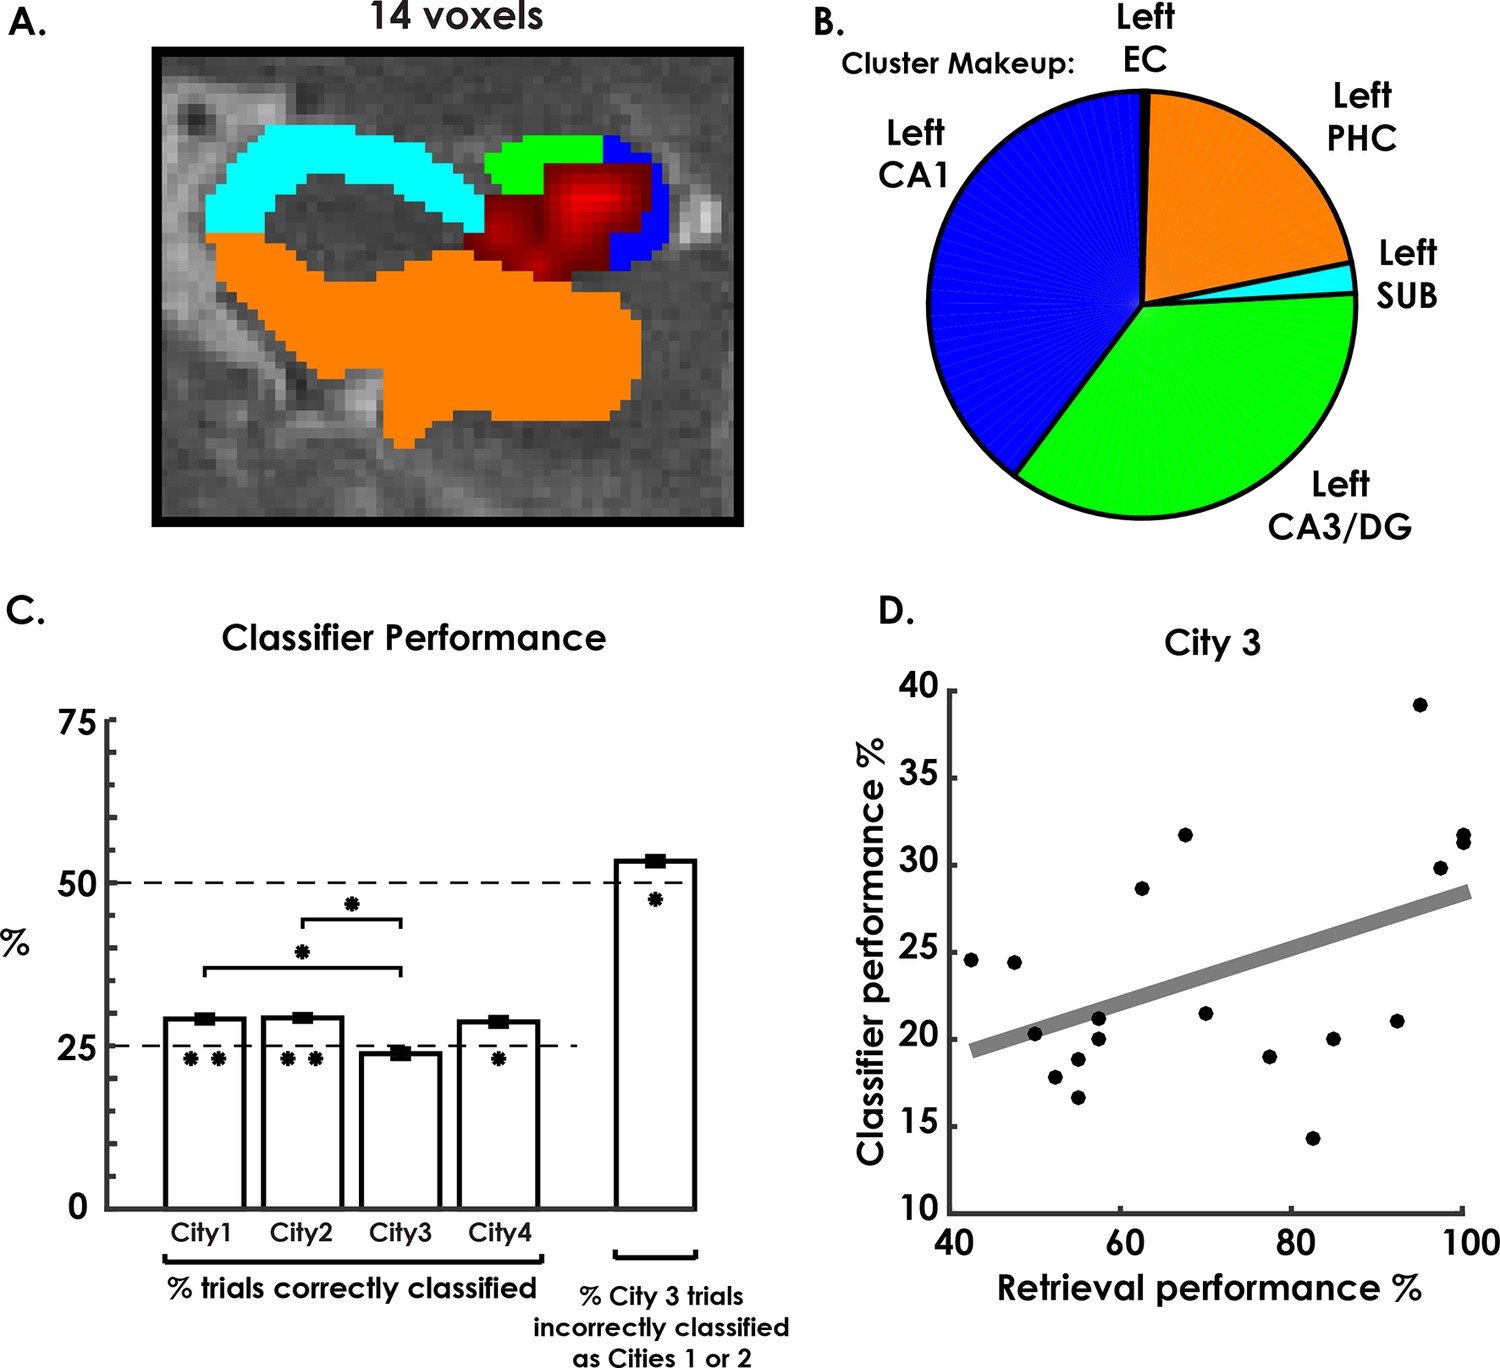
Classifier trained with matched number of trials from each city.
https://doi.org/10.7554/eLife.10499.009
Figure 3—figure supplement 2

City 1 & 2 classification results broken down by correctly classified and incorrectly classified as each city.
https://doi.org/10.7554/eLife.10499.010
Figure 4 with 1 supplement
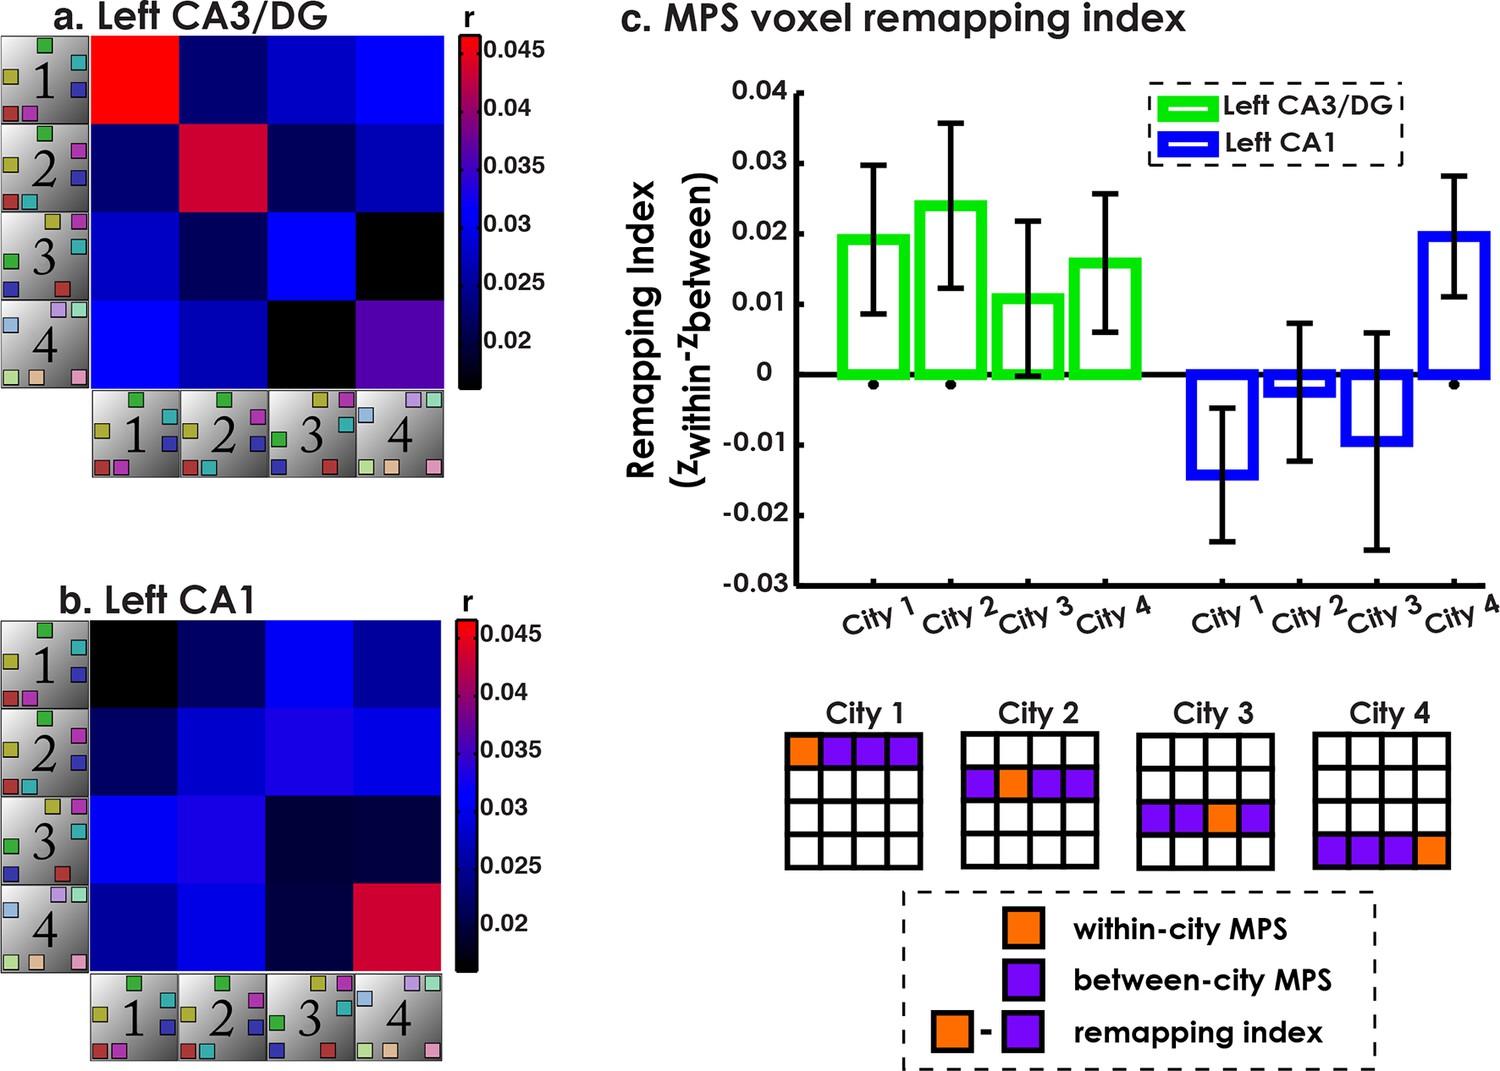
Multivariate pattern similarity analysis (MPS) ofenvironment similarity during retrieval.
(a) Similarity matrix of all pairwise city MPS conditions in CA3/DG. Diagonal depicts within-city and off-diagonal depicts between city MPS conditions. (b) Same as (a) for CA1. (c) Voxel remapping index for CA3/DG (green) and CA1 (blue). Remapping index for each city was the z-transformed contrast between within city and average between cities MPS (see legend below). Left CA3/DG showed overall more remapping than CA1, with significant remapping for Cities 1 & 2 and marginally significant remapping for City 4. Left CA1 showed significant remapping only for City 4. *p<0.05.
Figure 4—figure supplement 1
Cortical region MPS analysis.
https://doi.org/10.7554/eLife.10499.012
Figure 5 with 2 supplements
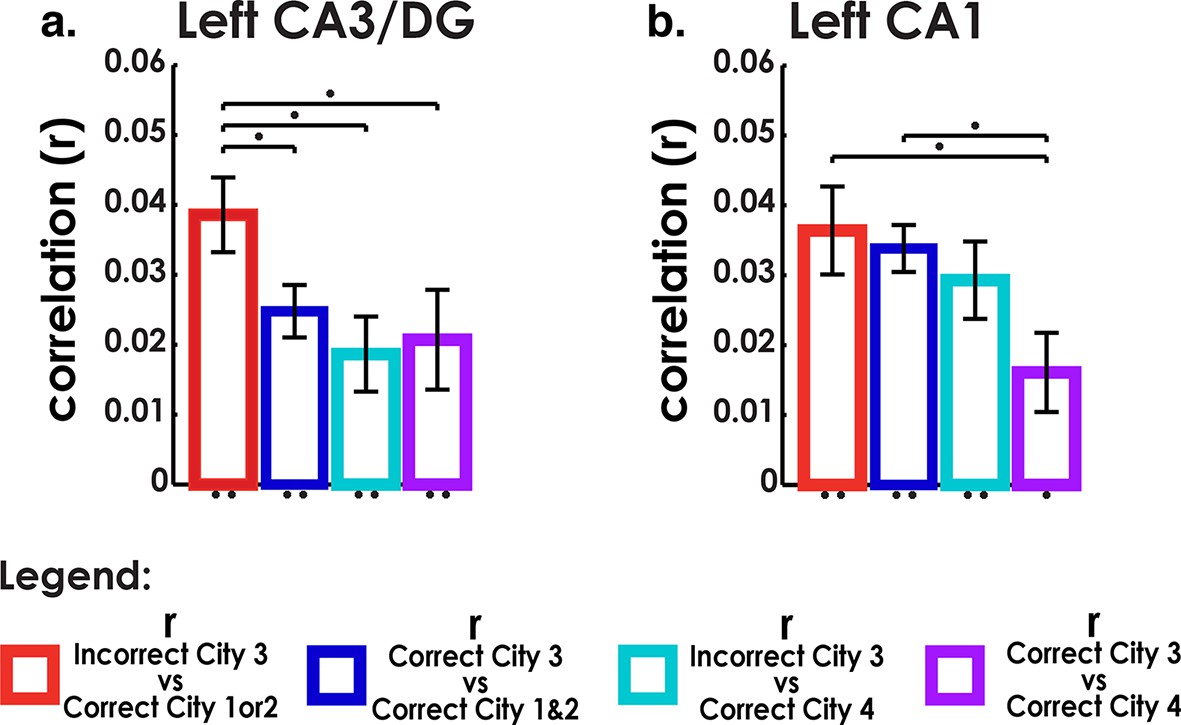
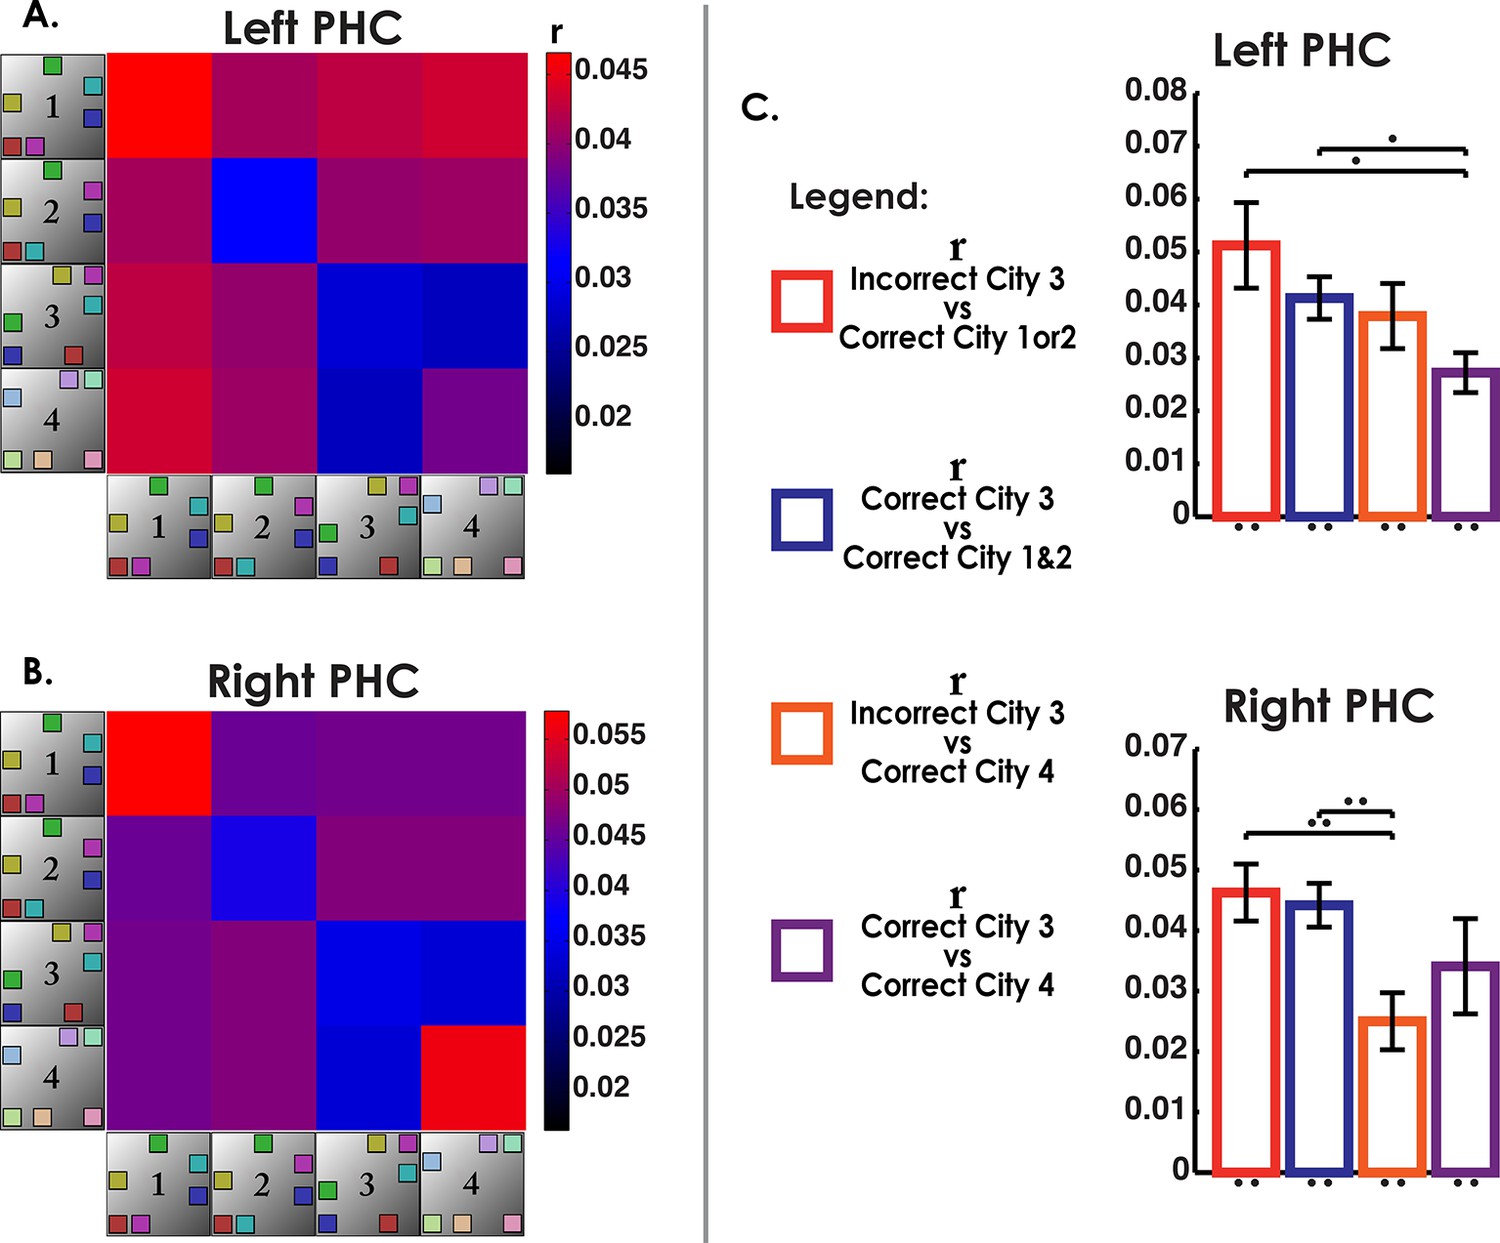
Analysis of incorrect and correct interference city trials.
(a) Analysis of interference city trials reveals higher similarity between incorrect city 3 (interfering city) and correct city 1 or 2 trials than between correct city 3 and correct cities 1 and 2 trials in CA3/DG. Control comparisons suggest that this effect could be attributed to interference from cities 1 & 2. Left bar greater than all other bars t(18)>2.2, p<0.04. (b) CA1 did not exhibit similar behavior for incorrect vs correct between-city 3 comparisons. *p<0.05, **p<0.01.
Figure 5—figure supplement 1

Right hemisphere hippocampal interference city MPS analysis.
https://doi.org/10.7554/eLife.10499.014
Figure 5—figure supplement 2

Empirical HRF plotted beside Canonical HRF convolved with 4 s boxcar function (average response time was 3.8 s).
https://doi.org/10.7554/eLife.10499.015
Author response image 1
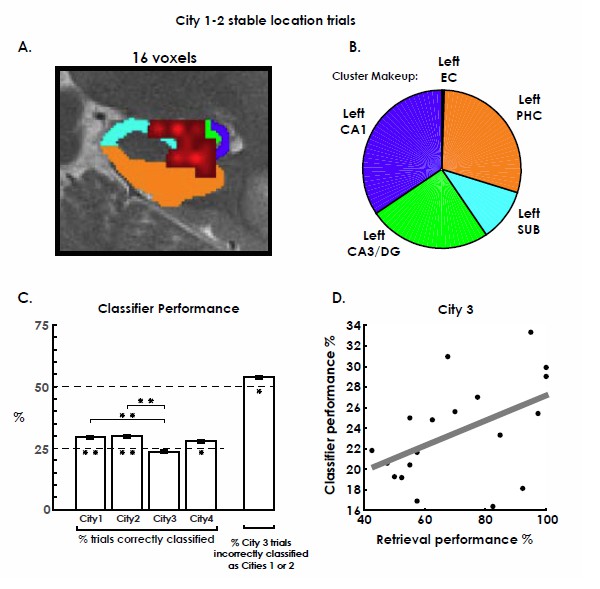
Stable City 1-2 trial classifier results. *p<0.05 Bonferrroni corrected, **p<0.01 Bonferroni corrected.
https://doi.org/10.7554/eLife.10499.016
Author response image 2
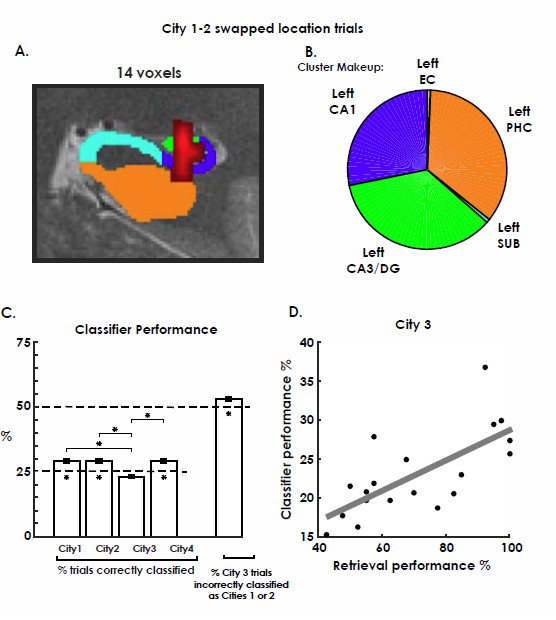
City 1-2 swapped location trial classifier results. *p<0.05 Bonferrroni corrected, **p<0.01 Bonferroni corrected.
https://doi.org/10.7554/eLife.10499.017
Author response image 3
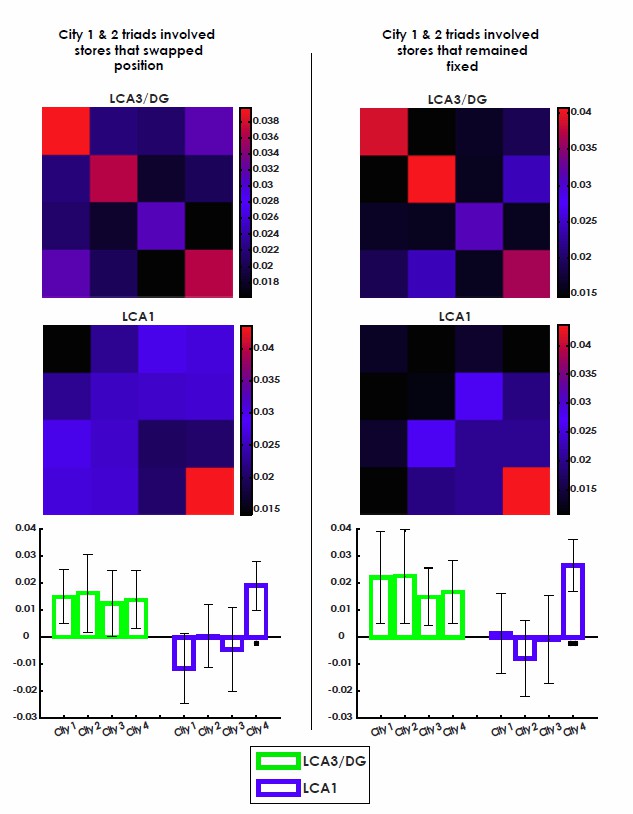
Stable and swapped City 1 and 2 ROI analysis.
https://doi.org/10.7554/eLife.10499.018Download links
A two-part list of links to download the article, or parts of the article, in various formats.
Downloads (link to download the article as PDF)
Open citations (links to open the citations from this article in various online reference manager services)
Cite this article (links to download the citations from this article in formats compatible with various reference manager tools)
Successful retrieval of competing spatial environments in humans involves hippocampal pattern separation mechanisms
eLife 4:e10499.
https://doi.org/10.7554/eLife.10499


