Cortical dynamics in hand/forelimb S1 and M1 evoked by brief photostimulation of the mouse’s hand
- Department of Neuroscience, Feinberg School of Medicine, Northwestern University, United States
- School of Life Sciences, Peking University, China
Figures
Figure 1 with 3 supplements
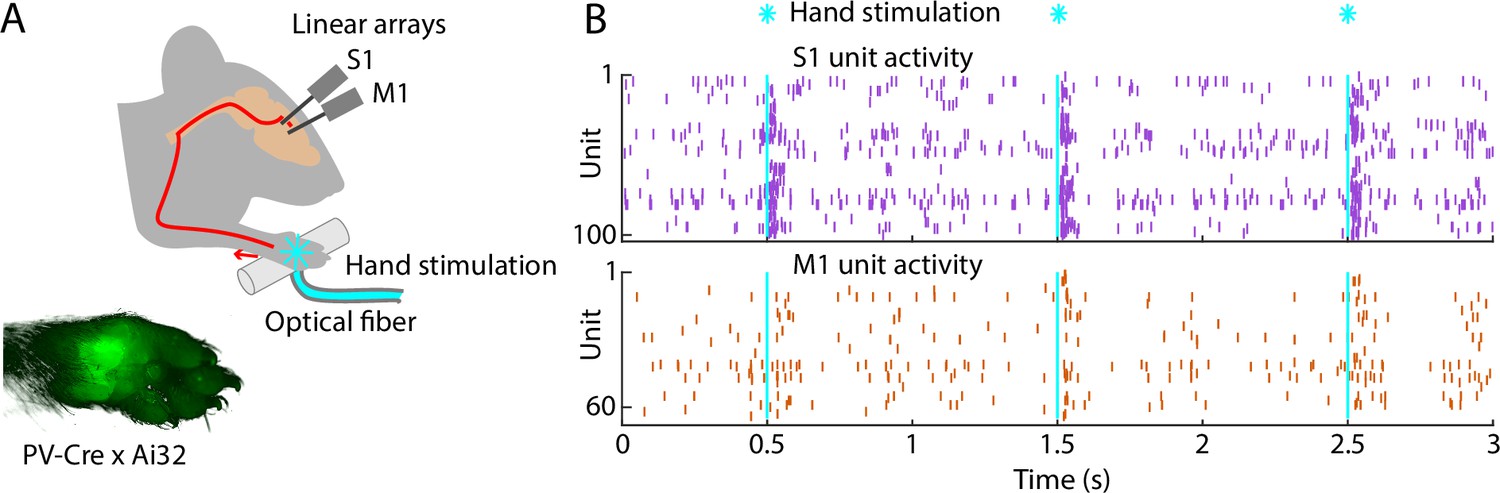
Brief stimulation of the hand evokes barrages of spiking activity in S1 and M1.
(A) Experimental approach. Schematic depicts optogenetic photostimulation of the hand of an awake head-fixed mouse via an optical fiber in the holding bar, with cortical population spiking activity recorded on linear arrays inserted in both S1 and M1. Image of the hand shows green fluorescence across the glabrous skin of the palm, from labeling of mechanoreceptor afferents (PV-Cre × Ai32 mouse). (B) Example segment of a recording, showing for three trials the raster plots of spiking activity for active units in S1 (top, purple) and M1 (bottom, orange) during photostimulation of the hand (25 trials total, 1 s inter-stimulus interval, 5 ms duration, 5 mW light intensity at the fiber tip, 910 μm core diameter).
Figure 1—figure supplement 1
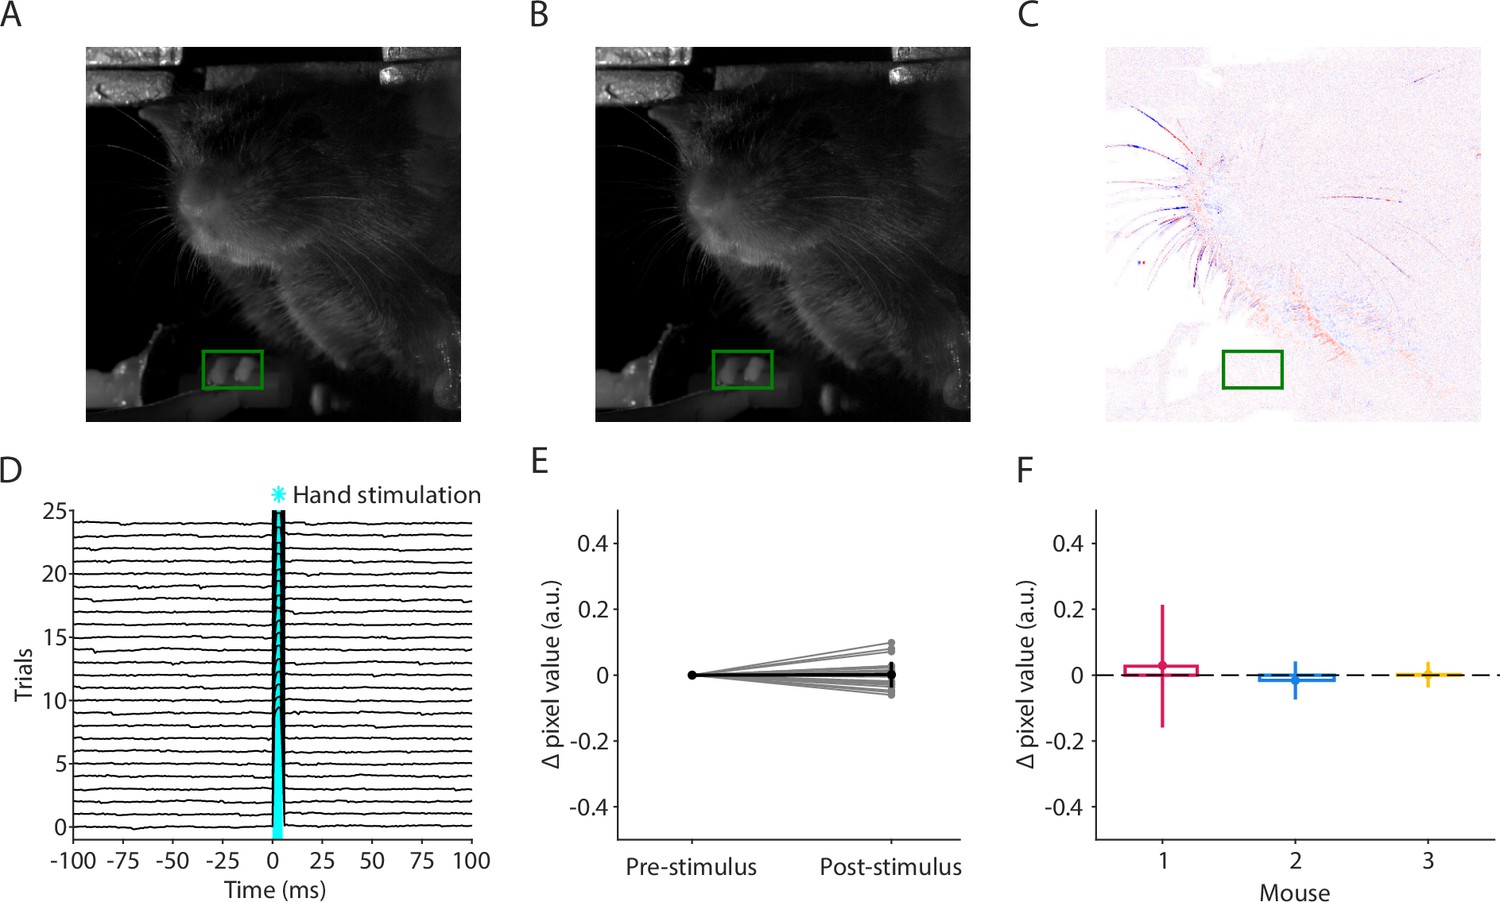
Optogenetic stimulation of mechanosensory afferents in the mouse’s hand does not evoke forelimb movements.
(A) Average video frame during the baseline period from 100 to 0 ms before stimulus onset for one example photostimulation trial for one example mouse. The region of interest (ROI) for detecting hand movements is indicated in green. (B) Example video frame from the post-stimulus interval for the same stimulus and mouse in (A). (C) Difference image between the frames in (A) and (B). (D) Average change in pixel values from baseline over the green ROI for all trials for the same mouse depicted in (A–C). Blue shaded area represents the time when the LED was on (5 ms duration, 5 mW light intensity at the fiber tip, 910 μm core diameter). (E) Average change in pixel values over the green ROI in the period from −100 to 0 ms before the stimulus (Pre-stimulus) and from 6 to 100 ms after the stimulus (Post-stimulus) for all trials (thin gray lines) and the average over trials (mean ± s.d., thick black line). (F) Post-stimulus trial-average change in pixel values for n = 3 mice. Error bars are s.d. over trials. Average changes are not significantly different from zero (Wilcoxon signed rank; mouse 1: n = 150 trials, W = 4853, p = 0.13; mouse 2: n = 25 trials, W = 133, p = 0.44; mouse 3: n = 25 trials, W = 152, p = 0.79).
Figure 1—figure supplement 2

Histological reconstruction of electrode placements in S1 and M1.
Left: Example brain section, showing cortical labeling of fluorescent probe tracks (red). For this example, corticospinal neurons (green) were also labeled. Right: Example epifluorescence image of a dye-coated 64-channel probe. Inset shows a zoom-in view of the electrode (magenta square), 23 μm vertical spacing between channels in a horizontally staggered configuration. Total recording length from bottom-to-top channel: 1449 μm.
Figure 1—video 1
Video motion analysis.
Top left: Example video of a mouse during phototactile stimulation, recorded at 1000 frames per second and downsampled to 30 frames per second for display. Approximate LED onset times are indicated (exact onset times cannot be shown as the frame period is longer than the LED illumination duration). The region of interest (ROI) for assessing digit movement is indicated by a green rectangle. Top right: Difference in pixel value from the baseline (average of the 100 ms prior to each flash) for the same video, pseudocolored so that negative values are shown in blue and positive values in red. Bottom: Trace showing the average change in pixel value over the indicated ROI for each frame. The currently displayed video frame is indicated with a red circle. The duration of LED illumination for each flash is indicated in blue. Note the artifact due to the video camera capturing the light from the LED, which was excluded from analysis.
Figure 2
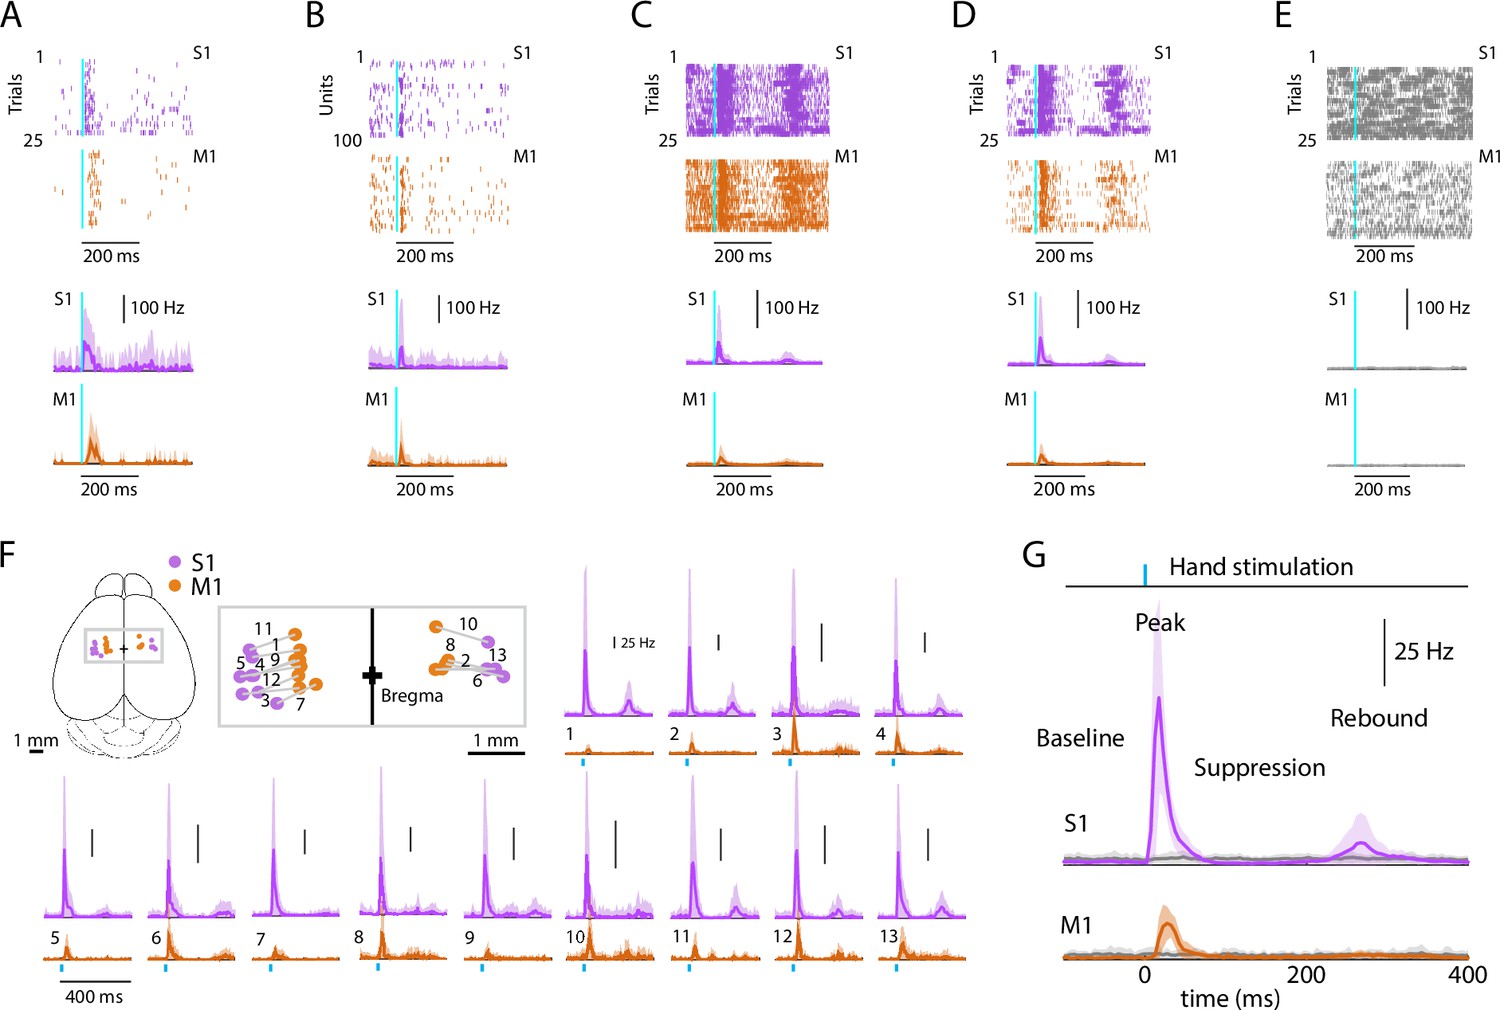
Evoked cortical responses follow a triphasic peak-suppression-rebound pattern.
(A) Top: Example rasters of one stimulus-responsive unit in each area, ordered by trial and aligned to the onset of photostimulation. Bottom: Peristimulus time histogram (PSTH) of average firing rate across trials (mean ± s.d.). (B) Top: All stimulus-responsive units on the probes for one trial. Bottom: Average PSTH across units (mean ± s.d.). (C) Top: All units on the probes, for all trials. Bottom: Overall average PSTH (mean ± s.d.). (D) Same as in C, but only including stimulus-responsive units. (E) Top: All units on the probes, for all trials with the hand off the light-delivery bar. Bottom: Overall average PSTH (mean ± s.d.). (F) PSTHs for each pairwise S1–M1 recording. Inset (top left) shows brain schematic with locations of the S1 and M1 probes for each experiment. Bottom: Average (mean ± s.d.) PSTHs of responsive units aligned to the photostimulation (dashed line), for each experiment (13 recordings from 9 mice). (G) Average stimulus-evoked cortical responses in forelimb S1 and M1. Grand average (mean ± s.d.) PSTHs across recordings aligned to the onset of the hand photostimulation. Light gray traces: same, but for trials with the hand off the light-delivery bar.
Figure 3
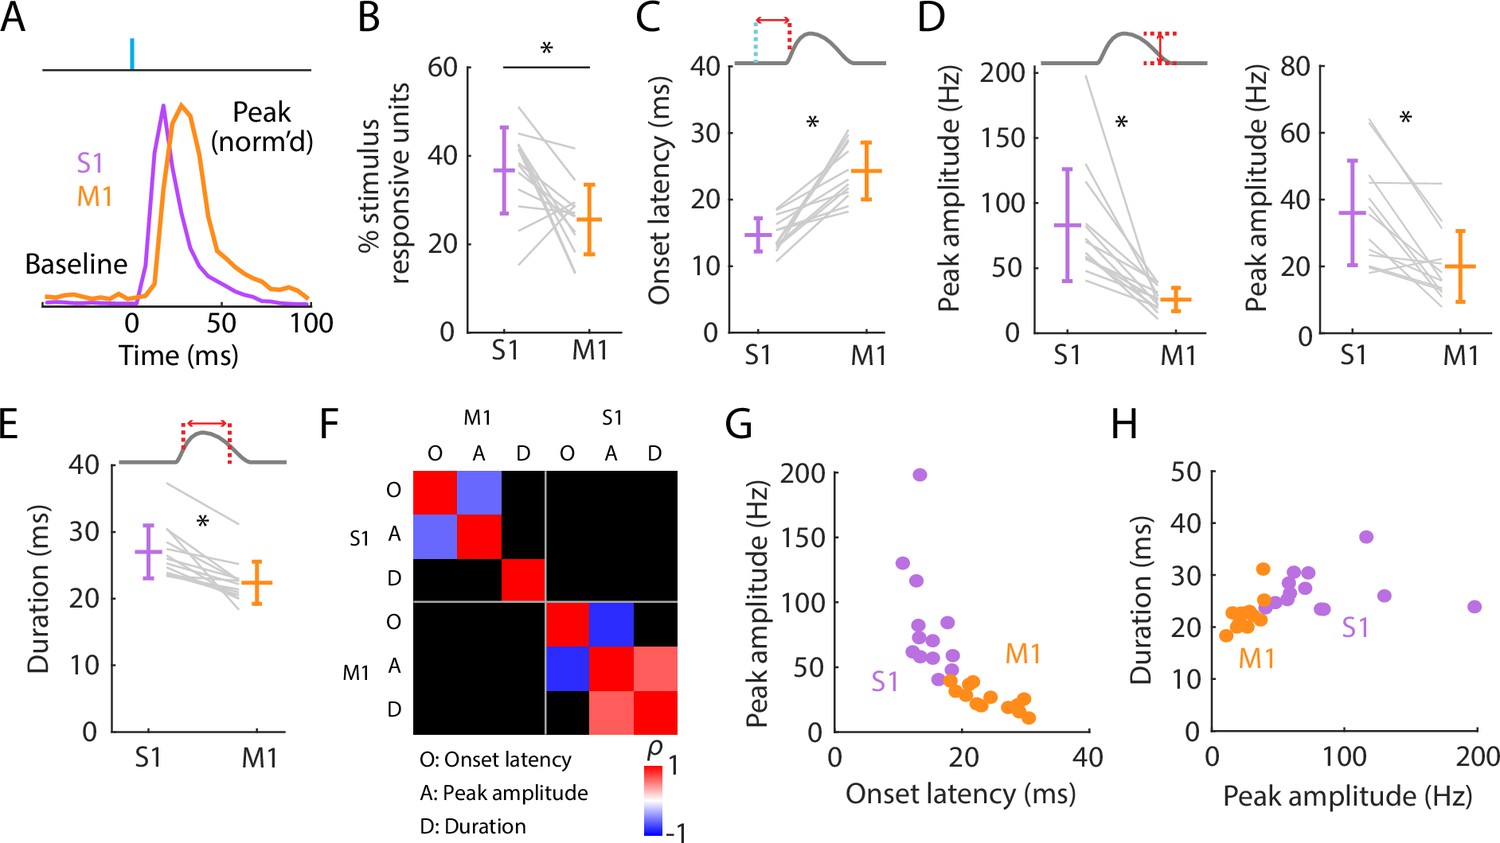
Initial peak responses in M1 are delayed and attenuated relative to S1.
(A) Scaled versions of the grand average peristimulus time histograms (PSTHs), showing the first 100 ms of the responses. (B) Percentages of all recorded units that were stimulus responsive, with the overall averages (mean ± s.d.) and group comparison (Wilcoxon’s signed rank test, W = 80, *: p = 0.01; n = 13 recordings from 9 mice). (C) Onset latencies in S1 and M1, averaged over individual responsive units for each experiment (gray lines), along with the overall averages (mean ± s.d.) and group comparison (W = 0, *: p = 2 × 10⁻⁴). The schematic above the plot depicts measurement of onset latency relative to stimulus onset. (D) Left: Same as C, but for peak amplitudes (W = 91, *: p = 2 × 10⁻⁴). Right: Same, but calculated for single units only (W = 88, *: p = 0.01). (E) Same as C, but for response durations (W = 91, *: p = 2 × 10⁻⁴). (F) Correlation matrix showing correlations among average response properties for all recordings (mean values across individual responsive units for each experiment). Colors indicate Spearman’s correlation index, rho (ρ). Non-significant correlations are shown in black. (G) Peak amplitude versus onset latency (S1: ρ = −0.58, p = 0.04; M1: ρ = −0.82, p = 0.001). (H) Response duration versus peak amplitude (S1: ρ = 0.02, p = 0.95; M1: ρ = 0.64, p = 0.02).
Figure 4
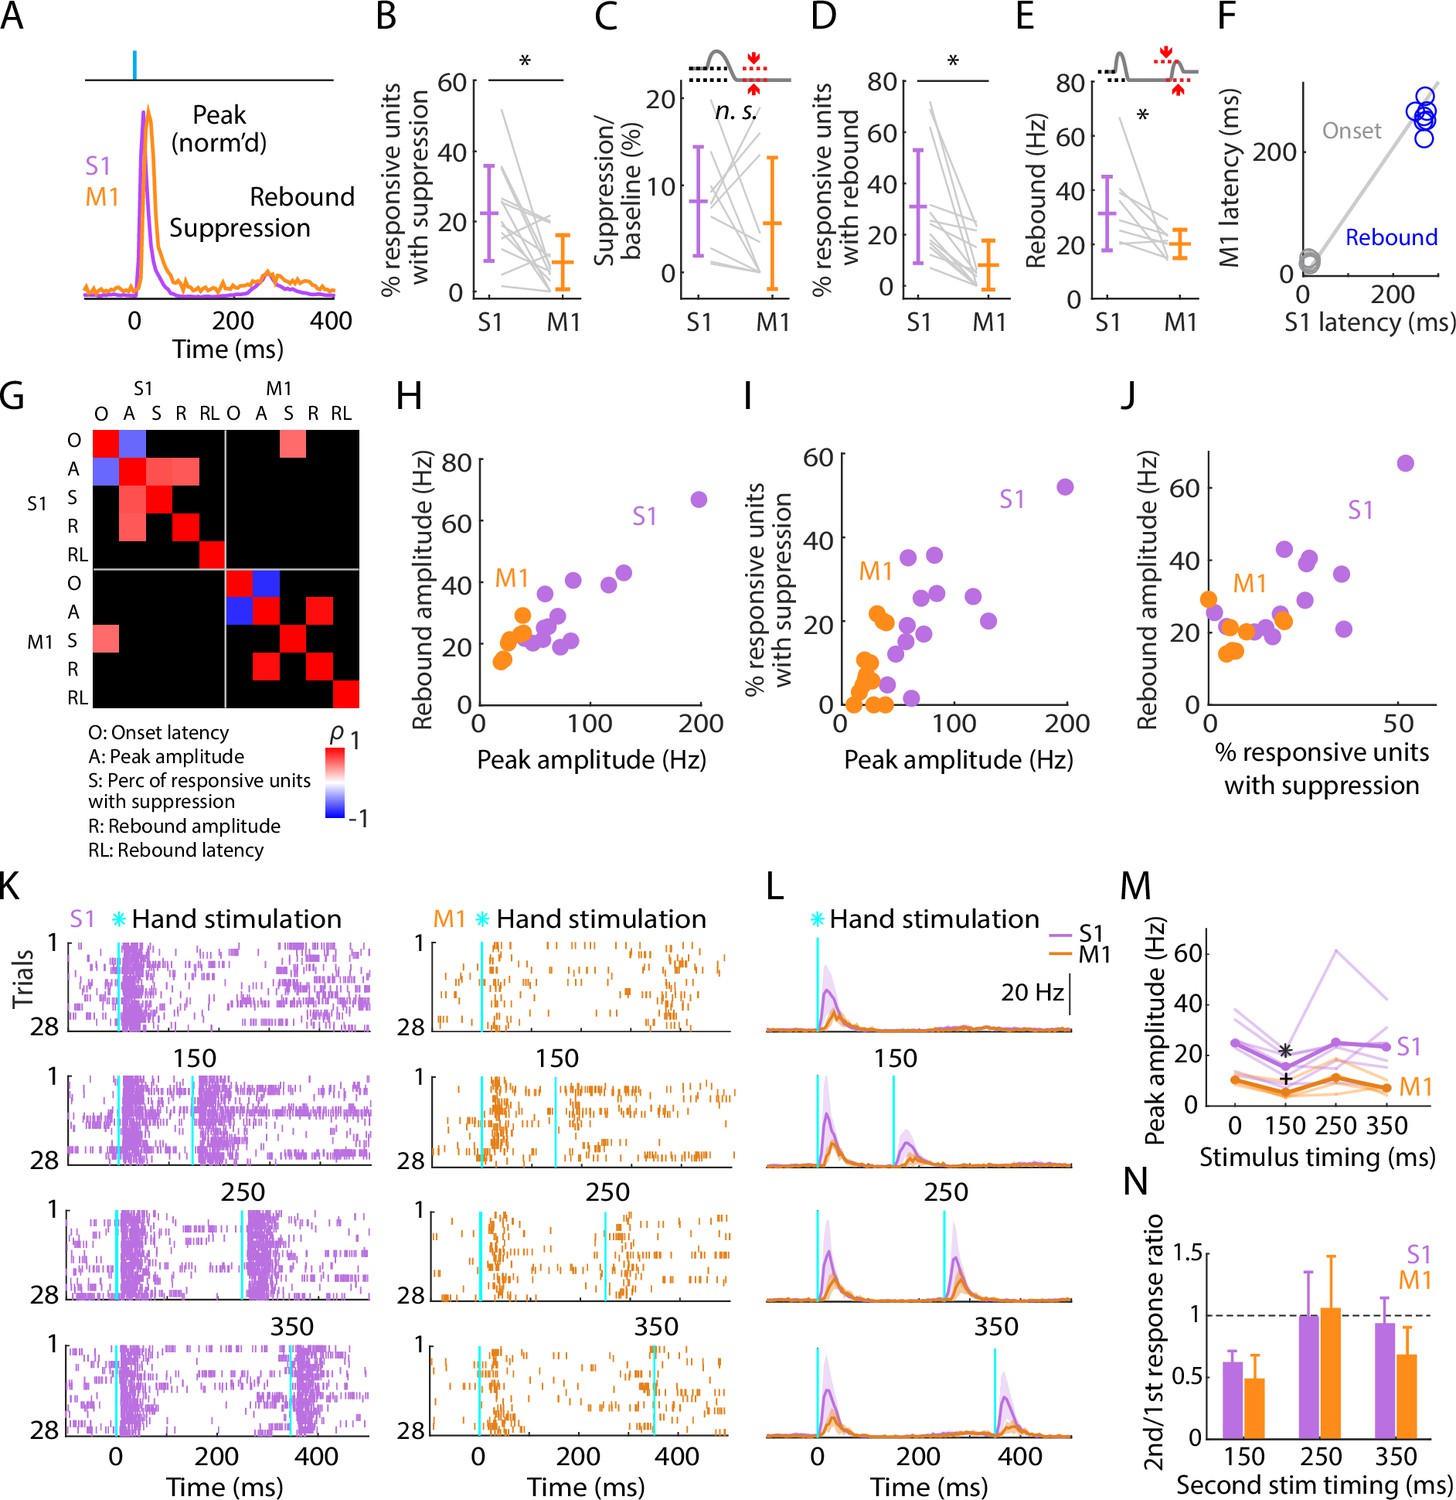
Post-peak activity is suppressed in S1 and rebounds in both S1 and M1.
(A) Scaled versions of the grand average peristimulus time histograms (PSTHs), showing the first 400 ms of the responses. (B) Percentage of stimulus-responsive units in S1 and M1 exhibiting significant post-peak suppression (relative to the pre-stimulus baseline), for each experiment (gray lines) along with the overall averages (mean ± s.d.) and group comparison (Wilcoxon’s signed rank test, W = 82, *: p = 0.01; n = 13 recordings from 9 mice, stimulus-responsive units only). (C) Suppression as a percentage of baseline firing rate amplitude for units in B. The schematic above the plot depicts measurement of amplitude during the suppression period (from 110 to 170 ms post-stimulation) (W = 36, p = 0.43). (D) Percentage of stimulus-responsive units exhibiting significant post-suppression rebound (relative to the pre-stimulus baseline), for each experiment (gray lines) along with the overall averages (mean ± s.d.) and group comparison (W = 91, *: p = 2 × 10⁻⁴). (E) Rebound amplitude for units in D (W = 35, *: p = 0.02). (F) Average onset and rebound latencies in M1 versus S1, for each experiment (circles). (G) Correlation matrix showing correlations among average response properties for all recordings (mean values across individual responsive units for each experiment). Colors indicate Spearman’s correlation index, rho (ρ). Non-significant correlations are shown in black. (H) Rebound amplitude versus peak amplitude (S1: ρ = 0.65, p = 0.02; M1: ρ = 0.95, p = 0.001). (I) Percentage of stimulus-responsive units with suppression versus peak amplitude (S1: ρ = 0.68, p = 0.01; M1: ρ = 0.38, p = 0.2). (J) Rebound amplitude versus percentage of stimulus-responsive units with suppression (S1: ρ = 0.52, p = 0.07; M1: ρ = 0.14, p = 0.75). (K) Example segment of a recording, showing raster plots of population spiking activity in S1 and M1, aligned to single (top) and double photostimulation of the hand (28 trials total). (L) Grand average (mean ± s.d.) PSTHs across recordings, aligned to the onset of the hand photostimulation (n = 7 recordings from 4 mice in S1, and 4 recordings from 3 mice in M1). (M) Peak amplitudes in S1 and M1 evoked by a single stimulus (at time 0) and a second stimulus delivered with variable lag (150, 250, or 350 ms after the first), for each experiment (thin lines) along with the overall averages (thick lines, mean), and group comparisons (Friedman test, S1 latency effect, χ32 = 8.66, p = 0.03, M1 latency effect, χ32 = 9.3, p = 0.02; Dunn–Sidak’s post hoc multiple comparisons within S1, *: p = 0.04, and M1, +: p = 0.04 for second pulse at 150 ms versus first pulse; no other significant post hoc differences were found). (N) S1 and M1 peak amplitudes evoked by the second pulse, normalized to the first pulse’s response (horizontal dashed line).
Figure 5 with 1 supplement
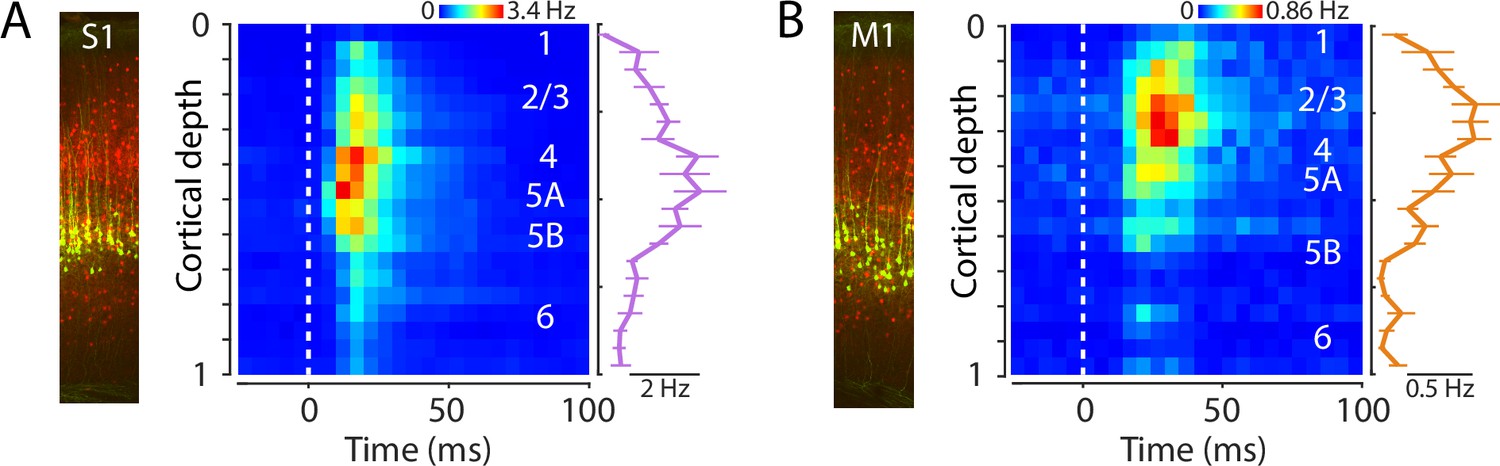
Laminar profiles of evoked activity in S1 and M1.
(A) Left: Example image of S1 cortex with labeled corticospinal neurons (green) and parvalbumin (PV) neurons (red). Right: Evoked spiking activity of all active units across the depth of the cortex (average of 11 recordings from 8 mice). Each unit’s spikes were binned according to its depth, in 20 bins total across the full cortical depth, where 0 is the pial surface and 1 is the lower boundary of cortex with white matter. Plot shows the grand average amplitude in each depth bin (mean ± s.e.m. across recordings), measured around the time of the peak response. (B) Same, for M1 laminar profile.
Figure 5—figure supplement 1
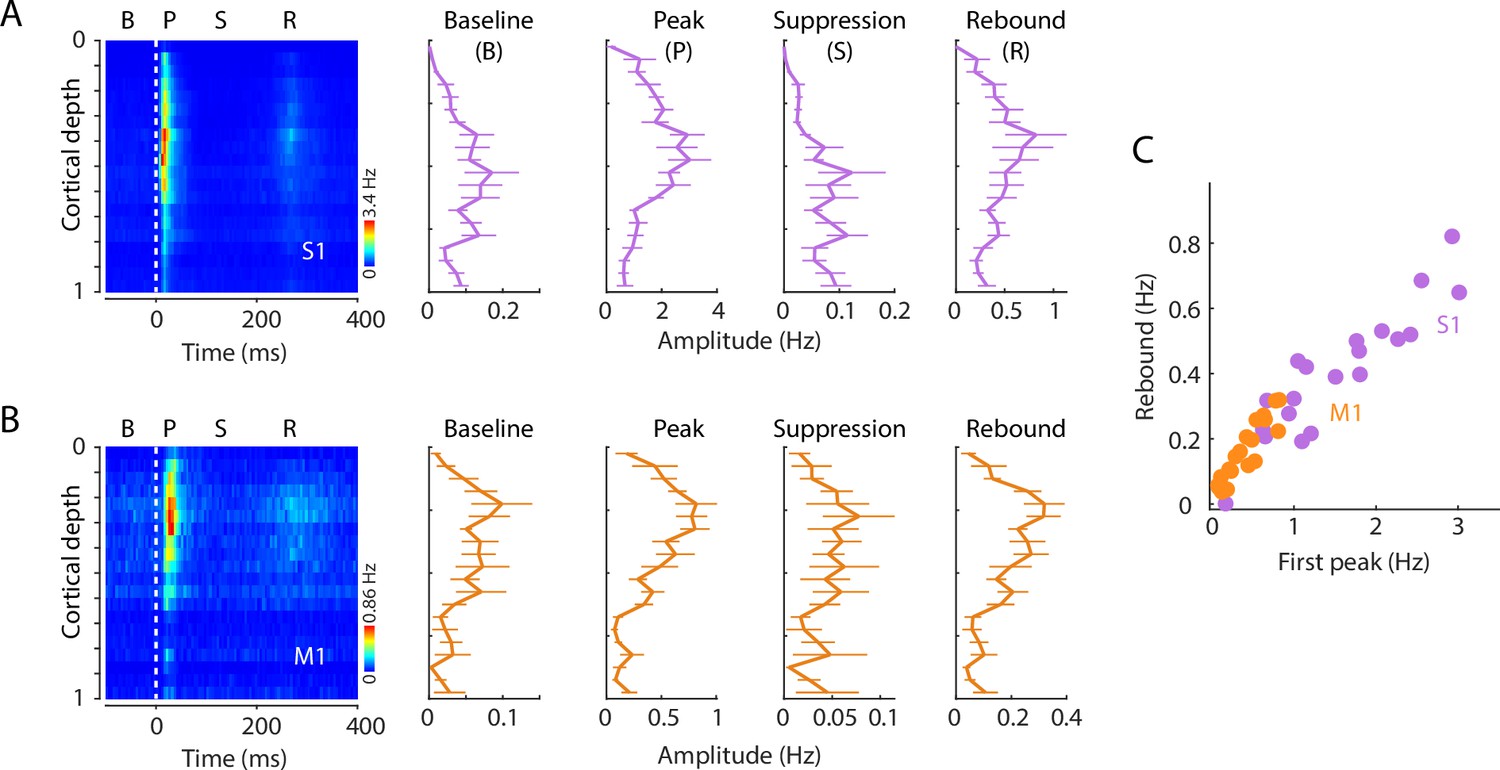
Laminar profiles of activity across the triphasic response to hand stimulation.
(A) Evoked spiking activity of units across the depth of S1 cortex. Plots show the overall amplitude (mean ± s.e.m., 11 recordings from 8 mice) during the baseline (B), initial peak (P), suppression (S), and rebound (R) intervals. (B) Same, for M1 responses. (C) S1 (purple) and M1 (orange) rebound versus initial peak response amplitudes in each of the 20 depth bins (Spearman’s correlation index, S1: ρ = 0.88, p < 10–308; M1: ρ = 0.91, p = 3 × 10⁻⁶).
Figure 6 with 1 supplement
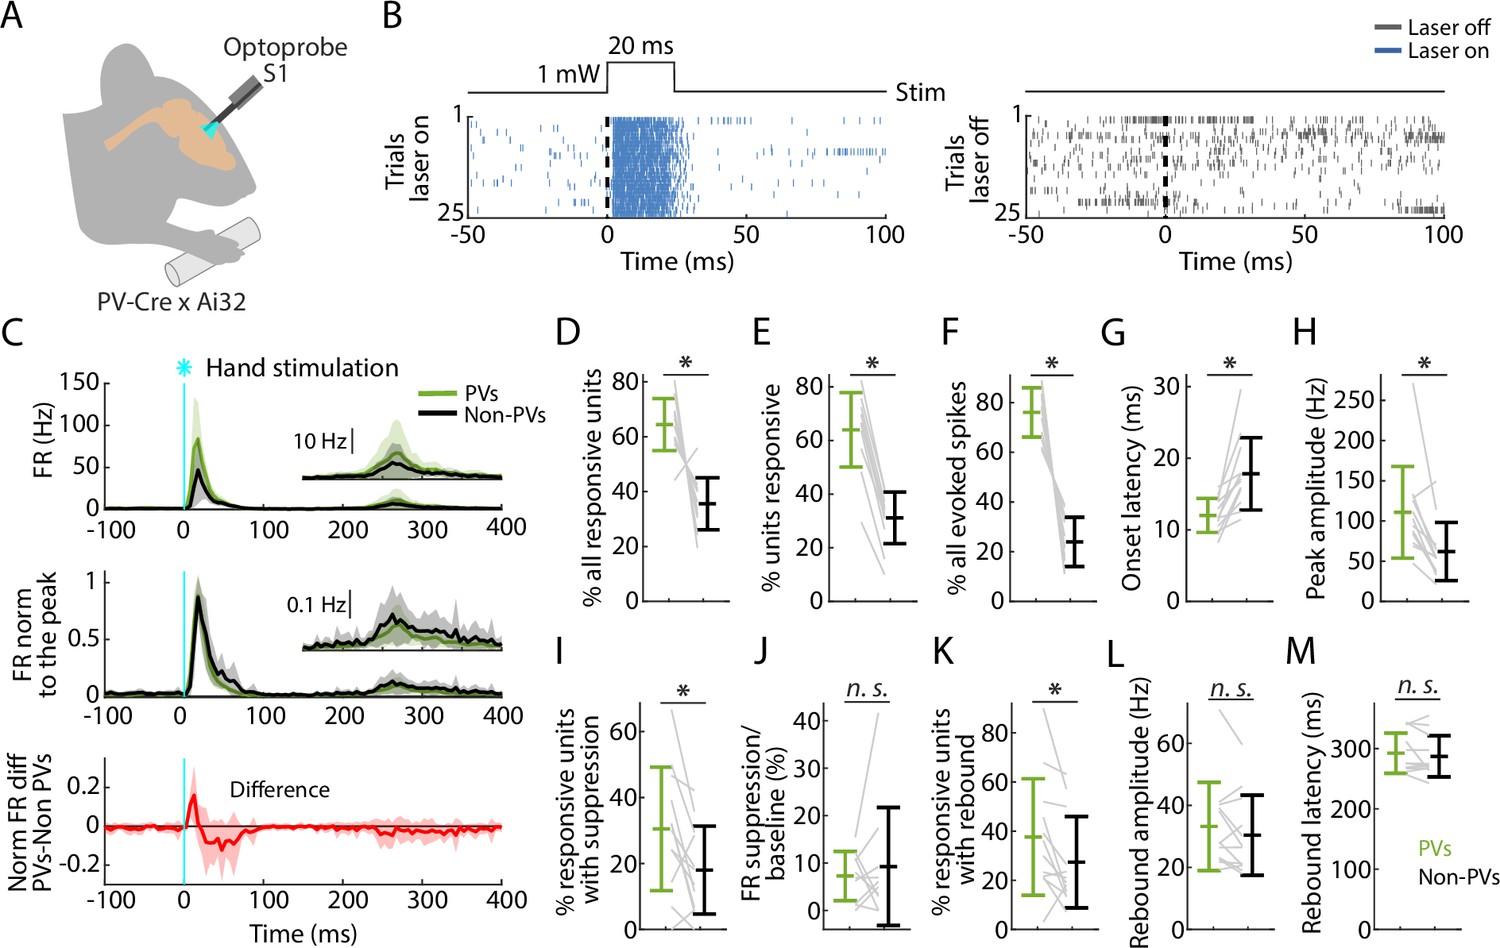
PV neurons in S1 are strongly recruited by hand stimulation.
(A) Experimental approach. Schematic depicts recording during optogenetic stimulation of parvalbumin (PV) neurons in S1. (B) Left: Example segment of a recording, shown as a raster plot of population spiking activity during the local optogenetic stimulation (laser on, 25 trials total, 1 s inter-stimulus interval, 20 ms duration, 1 mW light intensity at the fiber tip, 105 μm core diameter). Right: Raster plot of spiking activity aligned to sham events triggered at the same interval as the laser stimulus, but with the laser off. (C) Top: Grand average (mean ± s.d.) peristimulus time histograms (PSTHs) for the stimulus-responsive opto-tagged PV (green) and non-PV (black) units in S1 across recordings (12 recordings from 8 mice) aligned to the onset of the hand photostimulation. Inset on the right shows the same data on a magnified y-axis scale. Middle: Grand average (mean ± s.d.) peak-normalized PSTHs. Bottom: Average (mean ± s.d.) difference of PV minus non-PV peak-normalized PSTHs. (D) Percentage of stimulus-responsive units that are PV versus non-PV, for each experiment (gray lines) along with the overall averages (mean ± s.d.) and group comparison (Wilcoxon’s signed rank test, W = 77, *: p = 0.001). (E) Percentage of PV and non-PV units that are stimulus responsive in each experiment (Wilcoxon’s signed rank test, W = 78, *: p = 5 × 10⁻⁴). (F) Percentage of evoked spikes coming from PV and non-PV units over the time-course of the initial peak response (W = 78, *: p = 5 × 10⁻⁴). (G) Onset latencies of PV and non-PV units (W = 0, *: p = 5 × 10⁻⁴). (H) Peak amplitudes of PV and non-PV units (W = 75, *: p = 0.002). (I) Percentage of stimulus-responsive PV and non-PV units with significant suppression (in the time window 110–170 ms) compared to pre-stimulus baseline (W = 68, *: p = 0.02). (J) Suppression as a percentage of baseline firing rate amplitude for PV and non-PV units in I (W = 23, p = 0.7). (K) Percentage of stimulus-responsive PV and non-PV units with significant rebound compared to pre-stimulus baseline (W = 68, *: p = 0.02). (L) Rebound amplitude for PV and non-PV units in K (W = 55, p = 0.2). (M) Rebound latency for PV and non-PV units in K (W = 40, p = 0.6).
Figure 6—figure supplement 1
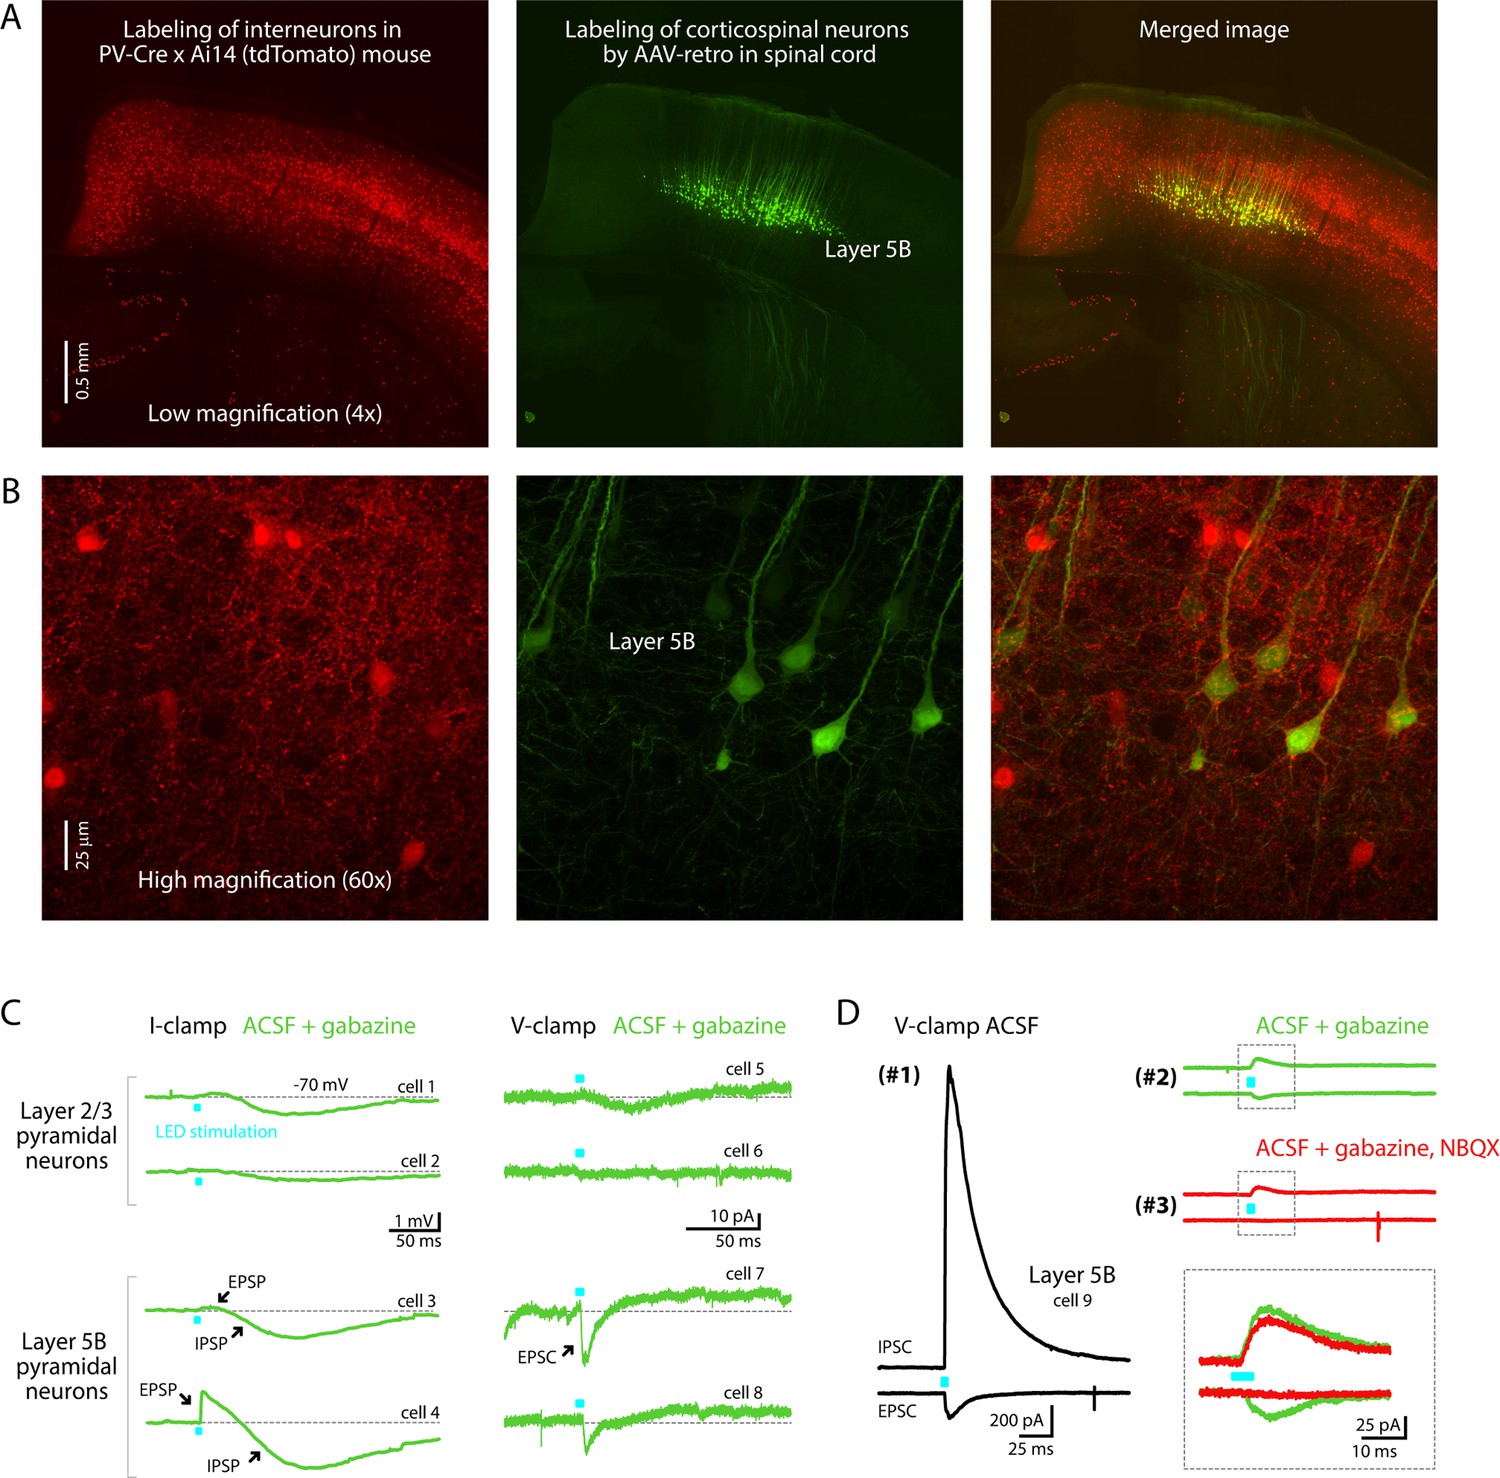
Labeling patterns in PV-Cre mice.
(A) Low-magnification confocal images showing the fluorescent labeling of cortical neurons in a PV-Cre × Ai14 (tdTomato-reporter) mouse (left) and corticospinal neurons (green) labeled retrogradely from the spinal cord (middle), with a merged image (right). (B) High-magnification images from layer 5B of the same sections. Images are representative of results from 3 mice, showing no co-labeling; specifically, in each mouse 0% (0 of 50) of the tdTomato-expressing cells were corticospinal neurons, and 0% (0 of 50) of the corticospinal neurons expressed tdTomato. (C) Example traces from optogenetic–electrophysiological assessment of possible excitatory responses evoked by photostimulation in acute brain slices from 2 PV-Cre × Ai32 (ChR2-reporter) mice. Responses of layer 2/3 and layer 5B pyramidal neurons to photostimulation of PV-expressing axons were recorded in the presence of gabazine (10 µM; GABA-A receptor antagonist) in current-clamp (potassium-based internal solution) mode (left) or voltage clamp (cesium-based internal solution) mode (right). (D) Example traces show excitatory and inhibitory responses of a single layer 5B neuron recorded at –70 mV (bottom traces; EPSCs) and 10 mV (upper traces; IPSCs). Responses were recorded first (#1) in control conditions with plain artificial cerebrospinal fluid (ACSF), then (#2) in the presence of gabazine, and finally (#3) after also adding NBQX (10 µM; AMPA receptor antagonist). Inset shows a close-up view on the area designated by the dashed square, indicating that a small (~25 pA) NBQX-sensitive inward (i.e., excitatory) current.
Figure 7 with 2 supplements
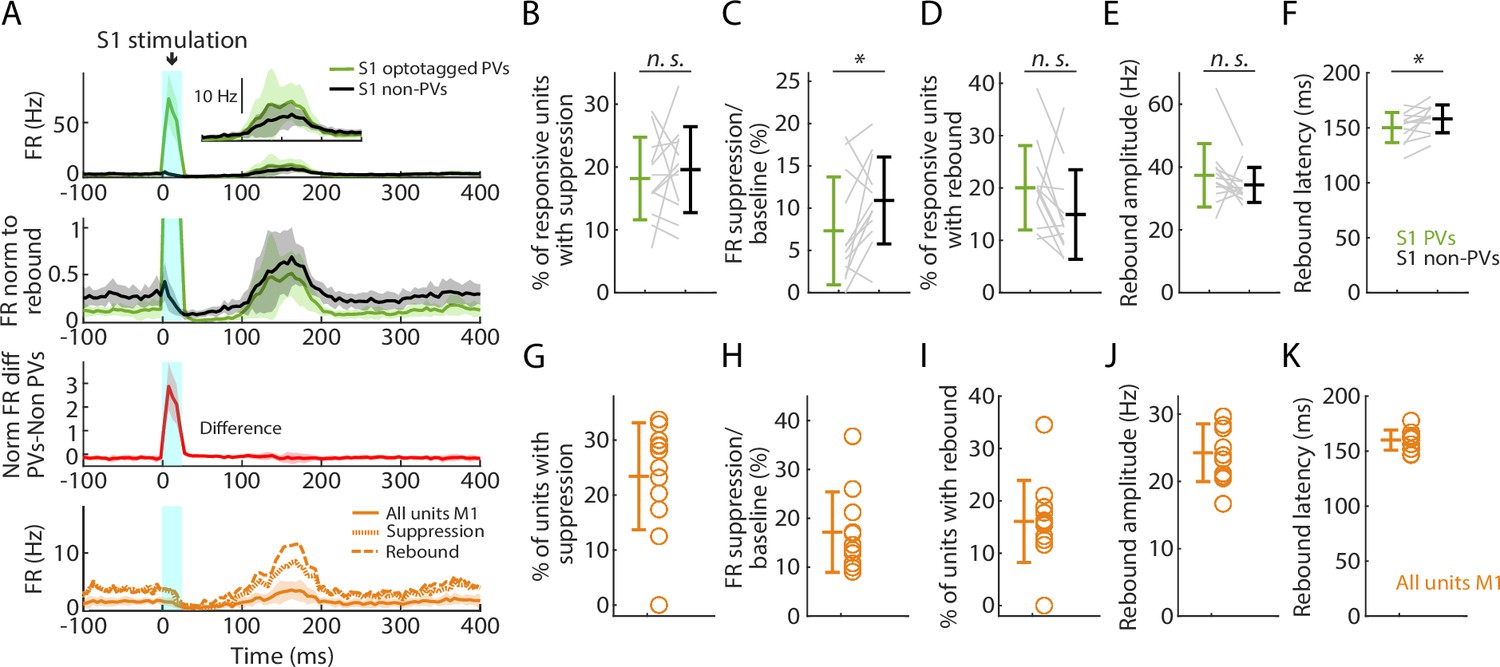
Selective activation of parvalbumin (PV) neurons in S1 generates suppression and rebound.
(A) Top plot: Grand average (mean ± s.d.) peristimulus time histograms (PSTHs) for opto-tagged PV and non-PV units in S1 across recordings (12 recordings from 8 mice), aligned to the onset of the cortical photostimulation (1 mW at the fiber tip, 105 μm core diameter). Inset on the right shows the rebound segment of the same data on a magnified y-axis scale. Second plot: Grand average PSTHs normalized to the post peak rebound amplitude. Third plot: Average difference of PV minus non-PV post peak rebound-normalized PSTHs. Fourth plot: Grand average PSTH for all M1 units, and for units with suppression or rebound. (B) Percentage of PV and non-PV units with significant suppression (in the time window 110–170 ms) compared to pre-stimulus baseline (Wilcoxon’s signed rank test, W = 27, p = 0.63). (C) Suppression as a percentage of baseline firing rate amplitude for PV and non-PV units in B (W = 12, *: p = 0.03). (D) Percentage of PV and non-PV units with significant rebound compared to pre-stimulus baseline (W = 61, p = 0.09). (E) Rebound amplitude for PV and non-PV units in D (W = 59, p = 0.13). (F) Rebound latency for PV and non-PV units in D (W = 10, *: p = 0.02). (G–K) Same as B–F but for all units recorded on the M1 probe during S1 photostimulation.
Figure 7—figure supplement 1
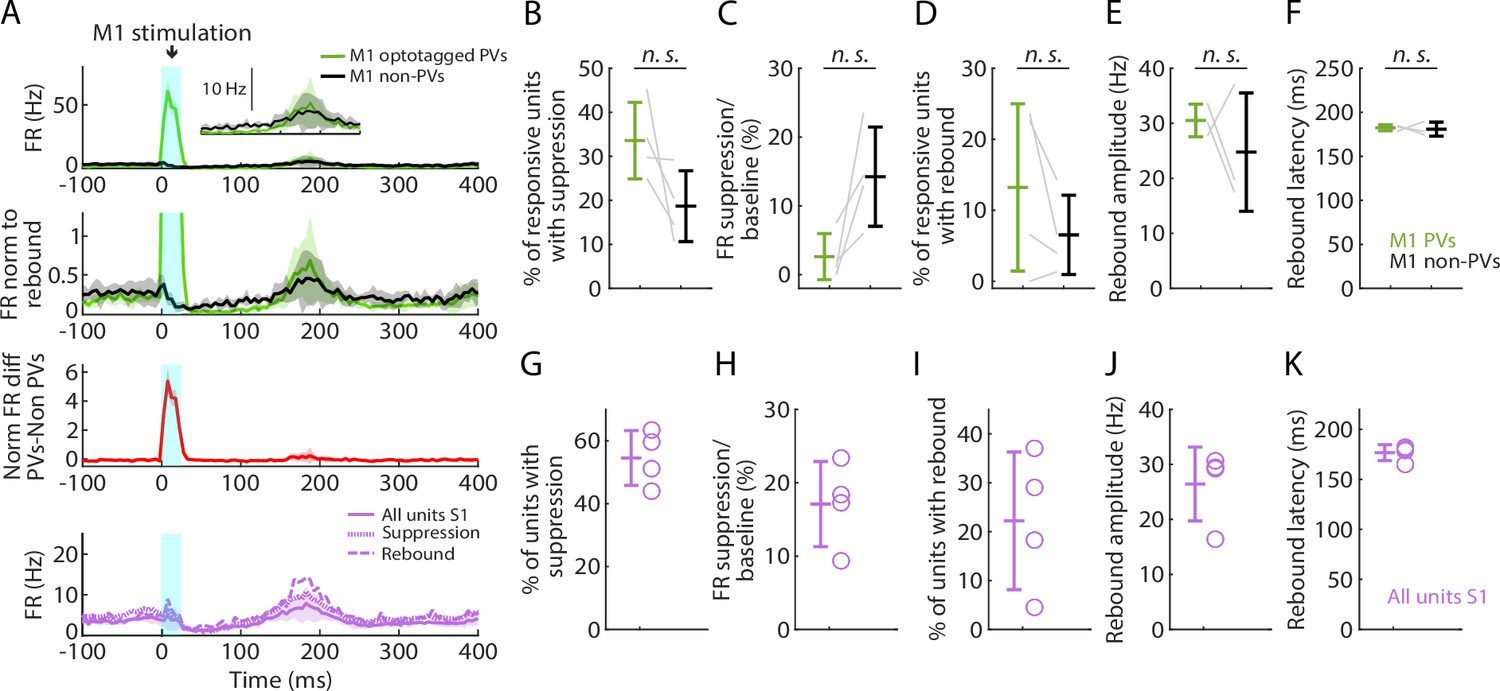
Selective activation of parvalbumin (PV) neurons in M1 generates suppression and rebound.
(A) Top plot: Grand average (mean ± s.d.) peristimulus time histograms (PSTHs) for opto-tagged PV and non-PV units in M1 across recordings (4 recordings from 3 mice), aligned to the onset of focal M1 photostimulation (1 mW at the fiber tip, 105 μm core diameter). Inset on the right shows the rebound segment of the same data on a magnified y-axis scale. Second plot: Grand average PSTHs normalized to the post peak rebound amplitude. Third plot: Average difference of PV minus non-PV post peak rebound-normalized PSTHs. Fourth plot: Grand average PSTH for all S1 units, and for units with suppression or rebound. (B) Percentage of PV and non-PV units with significant suppression (in the time window 110–170 ms) compared to pre-stimulus baseline (paired samples t-test, t3 = 2.08, p = 0.13). (C) Suppression as a percentage of baseline firing rate amplitude for PV and non-PV units in B (t3 = −2.84, p = 0.07). (D) Percentage of PV and non-PV units with significant rebound compared to pre-stimulus baseline (t3 = 1.67, p = 0.19). (E) Rebound amplitude for PV and non-PV units in D (t2 = 0.76, p = 0.53). (F) Rebound latency for PV and non-PV units in D (t2 = 0.23, p = 0.82). (G–K) Same as B–F but for all units recorded on the S1 probe during M1 photostimulation.
Figure 7—figure supplement 2
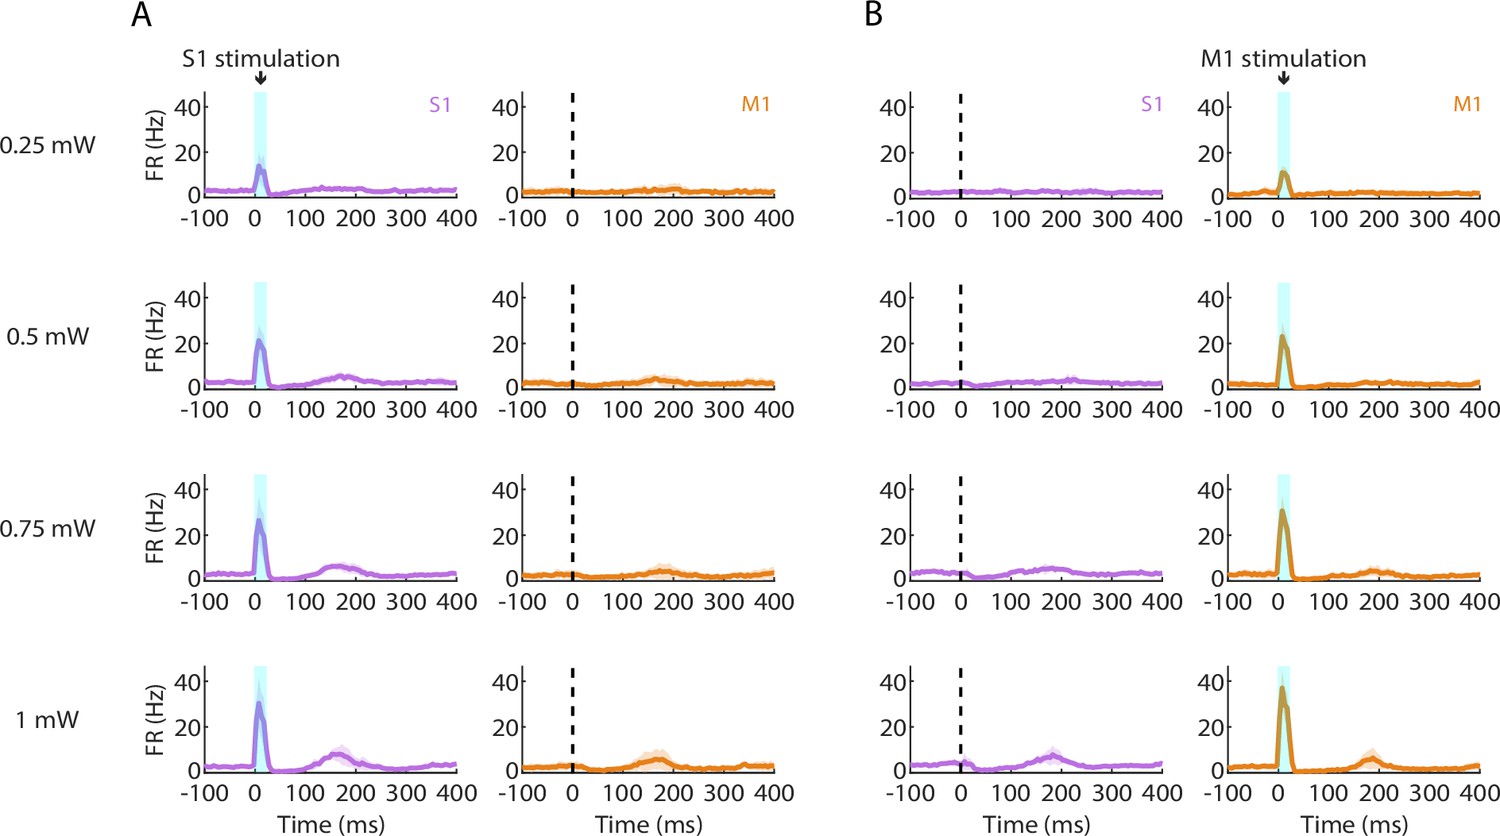
Suppression and rebound induced by parvalbumin (PV) activation scale with photostimulation intensity.
(A) Left: Grand average (mean ± s.d.) peristimulus time histograms (PSTHs) for S1 activity across recordings (4 recordings from 3 mice) during focal PV activation at a range of photostimulus intensities (0.25–1 mW at the fiber tip, 105 μm core diameter). Right: Simultaneous M1 recorded activity. (B) Same as A but during M1 photostimulation.
Figure 8
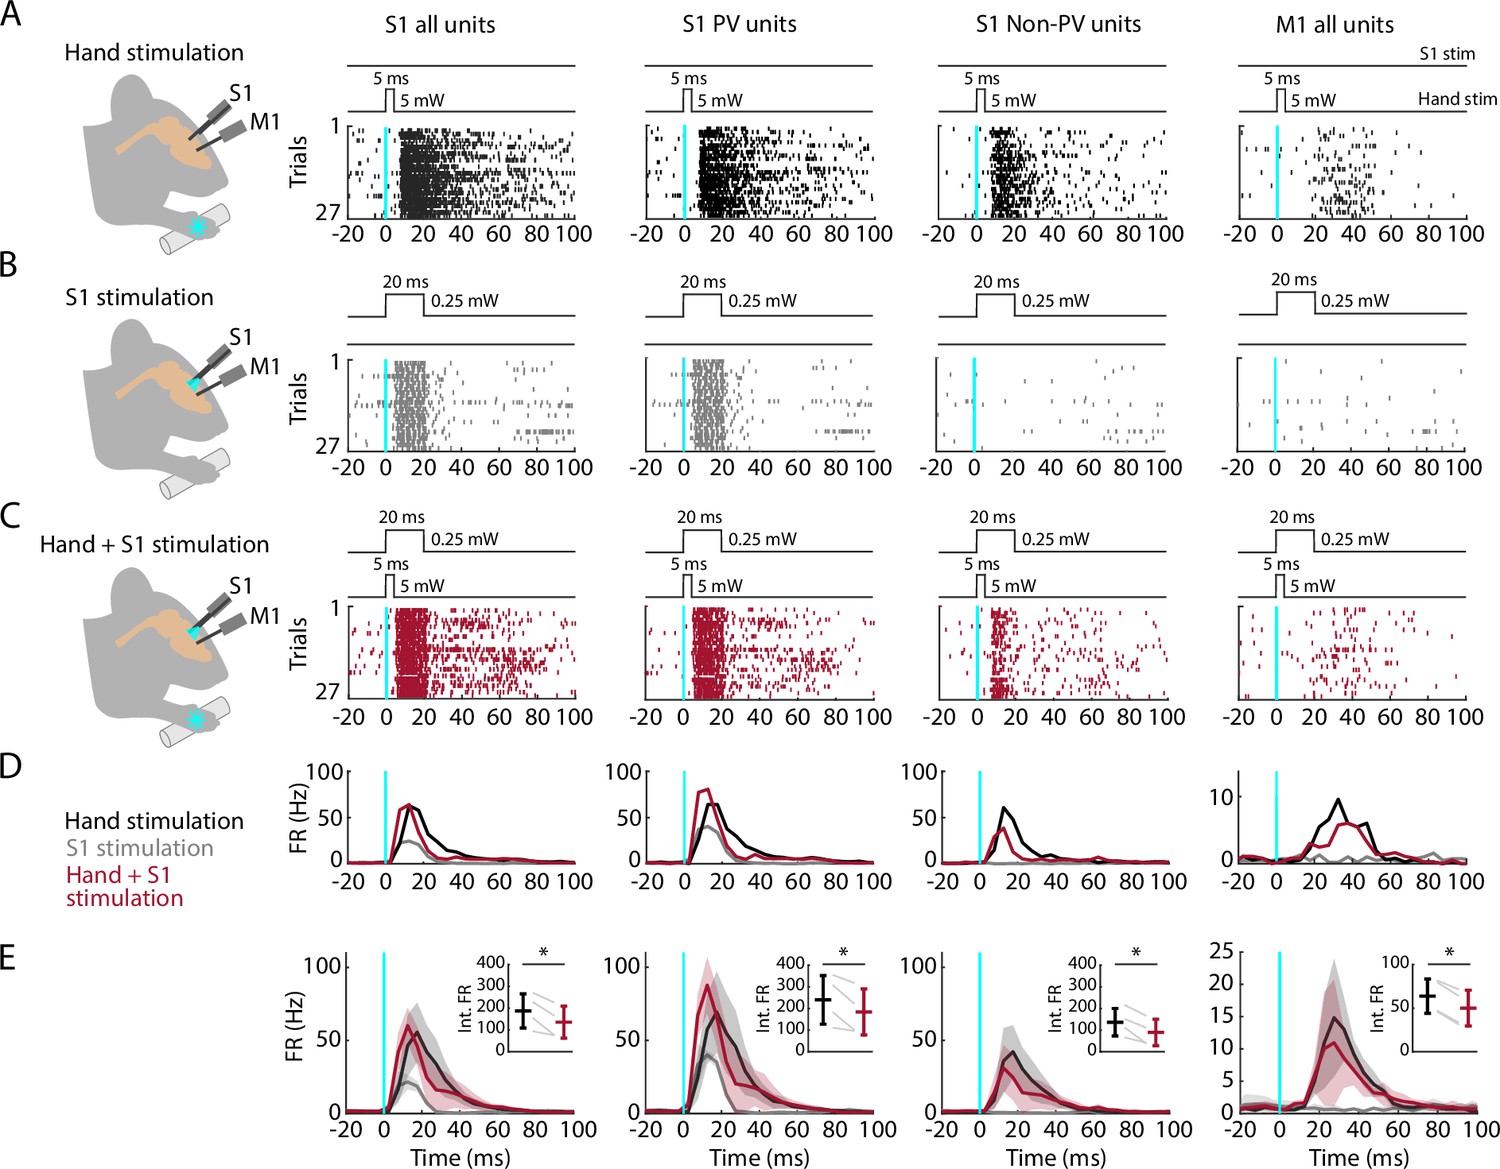
Partial silencing of S1 reduces M1 responses to hand stimulation.
(A) First column: Experimental approach. Schematic depicts recording in S1 while simultaneous optogenetic stimulation of the hand of an awake head-fixed mouse (PV-Cre × Ai32). Example segment of a recording, showing raster plots of units responsive to hand stimulation (27 trials total). The schematic above the plot depicts the timing and parameters of stimulation (5 ms duration, 1 s inter-stimulus interval, 5 mW light intensity at the fiber tip, 910 μm core diameter). Second column: Same but for S1 opto-tagged stimulus-responsive parvalbumin (PV) units. Third column: Same but for S1 stimulus-responsive non-PV units. Fourth column: Same but for M1 units responsive to hand stimulation. (B) Same stimulus-responsive units as in A during focal optogenetic stimulation of PV neurons in S1 (27 trials total, 1 s inter-stimulus interval, 20 ms duration, 0.25 mW light intensity at the fiber tip, 105 μm core diameter). (C) Same stimulus-responsive units as in A during simultaneous hand and focal S1 photostimulation. (D) Average (mean) peristimulus time histogram (PSTH) across S1 units responsive to hand stimulation (first column), parsed into PV (second column), and non-PV units (third column) along with M1 activity (fourth column) aligned to the onset of the stimulation (black: hand, gray: cortex, maroon: hand + S1 stimulation) for the same example recording in (A–C). (E) Grand average (mean ± s.d.) PSTHs across recordings (4 recordings from 4 mice). Inset: Average activity (integral of FR) 15–50 ms after the stimulation onset (hand versus hand + S1 stimulation) along with the group comparison (paired t-Student test, S1 units: t3 = 4, *: p = 0.02; PV units: t3 = 3.2, *: p = 0.049; non-PV units: t3 = 4.6, *: p = 0.02; M1 units: t3 = 11.7, *: p = 0.001).
Figure 9

Schematic summary.
Comparison of evoked cortical dynamics and synaptic circuit organization along the hand/forelimb-related transcortical loop through S1 and M1. The illustration combines the schematic summary from Yamawaki et al., 2021, which depicts the major local and corticocortical excitatory synaptic circuit connections along the loop, together with our current results, which show the laminar profiles of population spiking activity across the cortical depth in each area. The profiles show the same data as in Figure 5A, B, normalized to the maximum value in S1 plotted as heatmaps. CST: corticospinal tract, CuN: cuneate nucleus, ML: medial lemniscus, MN: motor neurons, TC: thalamocortical axons, VPL: ventral posterolateral nucleus of the thalamus. Adapted from Figure 7 of Yamawaki et al., 2021.
Tables
Table 1
Properties of the evoked S1 and M1 responses.
| Parameter | S1 | M1 | S1 vs M1 statistical comparison | M1 minus S1 difference |
|---|---|---|---|---|
| Baseline firing rate (Hz) | 1.2 ± 0.7 | 0.6 ± 0.2 | 0.001 | −0.6 ± 0.7 |
| Short-latency response | ||||
| Stimulus-responsive units (%) | 36.7 ± 9.7 | 25.6 ± 7.9 | 0.01 | n/a |
| Onset latency (ms) | 14.7 ± 2.5 | 24.3 ± 4.3 | 2 × 10⁻⁴ | 9.6 ± 5.3 |
| Peak latency (ms) | 21.4 ± 2.5 | 31.2 ± 4.3 | 2 × 10⁻⁴ | 9.8 ± 5.1 |
| Duration (ms) | 27.0 ± 4.0 | 22.4 ± 3.2 | 2 × 10⁻⁴ | −4.6 ± 3.0 |
| Amplitude (Hz) | 83.0 ± 43.1 | 25.8 ± 8.9 | 2 × 10⁻⁴ | n/a |
| Post-peak suppression | ||||
| Stimulus-responsive units with suppression (%) | 22.3 ± 13.6 | 8.4 ± 7.7 | 0.01 | n/a |
| Amplitude (Hz) | 0.3 ± 0.3 | 0.1 ± 0.2 | 0.2 | n/a |
| Amplitude (% of baseline) | 8.2 ± 6.3 | 5.6 ± 7.5 | 0.4 | n/a |
| Post-inhibitory rebound | ||||
| Stimulus-responsive units with rebound (%) | 30.9 ± 22.1 | 8.1 ± 9.6 | 2 × 10⁻⁴ | n/a |
| Peak latency (ms) | 289.0 ± 31.9 | 274.7 ± 36.2 | 0.8 | −2.4 ± 21.9 |
| Amplitude (Hz) | 31.4 ± 13.6 | 20.2 ± 5.3 | 0.02 | n/a |
-
Parameters of the activity in S1 and M1 evoked by hand photostimulation. Measurements are reported as the overall average (mean ± s.d.) across recordings (13 recordings from 9 mice) along with the group comparison (Wilcoxon’s signed rank test).
Table 2
Statistical results for the S1 silencing experiments.
| Hand stim. (Int. FR) | Hand + S1 stim. (Int. FR) | (Hand + S1 stim.)/hand (%) | W | p | |
|---|---|---|---|---|---|
| S1 | |||||
| All units | |||||
| Mouse 1 | 271.1 | 225.7 | 83.3% | 5.2e2 | 2 × 10⁻⁶ |
| Mouse 2 | 155.2 | 76 | 49.0% | 142.5 | 3 × 10⁻⁸ |
| Mouse 3 | 94.1 | 75.1 | 79.8% | 793.5 | 0.002 |
| Mouse 4 | 228.4 | 165.2 | 72.3% | 428.5 | 7 × 10⁻⁹ |
| Mean ± s.d. | 187.2 ± 78.4 | 135.5 ± 73.5 | 69.7 ± 1.2% | n/a | n/a |
| PV units | |||||
| Mouse 1 | 355.6 | 317.6 | 89.3% | 129.5 | 0.02 |
| Mouse 2 | 183.4 | 100.7 | 54.9% | 81.5 | 8 × 10⁻⁵ |
| Mouse 3 | 111.4 | 96 | 86.2% | 377 | 0.047 |
| Mouse 4 | 308.9 | 222.2 | 71.9% | 92 | 2 × 10⁻⁵ |
| Mean ± s.d. | 239.8 ± 112.3 | 184.1 ± 106.4 | 74.2 ± 1.2% | n/a | n/a |
| Non-PV units | |||||
| Mouse 1 | 216.4 | 166.3 | 76.8% | 125 | 2 × 10⁻⁵ |
| Mouse 2 | 111.7 | 38 | 34.0% | 4 | 7 × 10⁻⁵ |
| Mouse 3 | 66.2 | 41.5 | 62.7% | 79.5 | 0.01 |
| Mouse 4 | 151.6 | 110.8 | 73.2% | 125 | 7 × 10⁻⁵ |
| Mean ± s.d. | 136.5 ± 63.7 | 89.15 ± 61.4 | 58.8 ± 1.4% | n/a | n/a |
| M1 | |||||
| Mouse 1 | 81.9 | 71.4 | 87.2% | 148 | 0.01 |
| Mouse 2 | 46.1 | 31.2 | 67.7% | 47 | 0.01 |
| Mouse 3 | 79.8 | 63.9 | 80.1% | 365 | 8 × 10⁻⁵ |
| Mouse 4 | 47.2 | 33.6 | 71.2% | 57.5 | 0.02 |
| Mean ± s.d. | 63.8 ± 19.8 | 50.0 ± 20.6 | 76.2 ± 1.1% | n/a | n/a |
-
Average (mean ± s.d.) activity (integral of firing rate, ‘Int. FR’) across stimulus-responsive units 15–50 ms after stimulation onset (of hand or hand + S1) along with the statistical intra-recording comparison (Wilcoxon’s signed rank test, 4 recordings from 4 mice). All p-values remained significant after false discovery rate correction for multiple comparisons.
Key resources table
| Reagent type (species) or resource | Designation | Source or reference | Identifiers | Additional information |
|---|---|---|---|---|
| Strain, strain background (M. musculus) | PV-Cre or B6.129P2-Pvalbtm1(cre)Arbr/J | Jackson Laboratory (Hippenmeyer et al., 2005) | #017320 RRID:IMSR_JAX:017320 | |
| Strain, strain background (M. musculus) | Ai32 or B6.Cg-Gt(ROSA)26Sortm32(CAG-COP4*H134R/EYFP)Hze/J | Jackson Laboratory (Madisen et al., 2012) | #024109 RRID:IMSR_JAX:024109 | |
| Strain, strain background (M. musculus) | Ai14 or B6.Cg-Gt(ROSA)26Sortm14(CAG-tdTomato)Hze/J | Jackson Laboratory (Madisen et al., 2010) | #007914 RRID:IMSR_JAX:007914 | |
| Recombinant DNA reagent | pAAVretro-CAG-GFP | Addgene | #37825 RRID:Addgene_37825 | |
| Recombinant DNA reagent | AAVretro-CAG-tdTomato | Addgene | #59462 RRID:Addgene_59462 | |
| Chemical compound, drug | NBQX disodium salt | Tocris | #1044 PubChemCID: 3272523 | |
| Chemical compound, drug | Gabazine | Tocris | #1262 PubChemCID:107895 | |
| Software, algorithm | Open Ephys | Open Ephys | #021624 RRID:SCR_021624 | |
| Software, algorithm | MATLAB | http://www.mathworks.com/products/matlab/ | #001622 RRID:SCR_001622 | |
| Software, algorithm | KiloSort | https://github.com/cortex-lab/Kilosort (Pachitariu et al., 2016; Steinmetz et al., 2021; Pachitariu, 2024) | #016422 RRID:SCR_016422 | v3 |
| Software, algorithm | Wavesurfer | https://wavesurfer.janelia.org/ | v0.945 | |
| Software, algorithm | Phy | https://github.com/cortex-lab/phy | ||
| Other | Vybrant DiI Cell-Labeling Solution | Invitrogen | Catalog #: V22885 | See ‘Probe track localization’ |
Additional files
Download links
A two-part list of links to download the article, or parts of the article, in various formats.
Downloads (link to download the article as PDF)
Open citations (links to open the citations from this article in various online reference manager services)
Cite this article (links to download the citations from this article in formats compatible with various reference manager tools)
Cortical dynamics in hand/forelimb S1 and M1 evoked by brief photostimulation of the mouse’s hand
eLife 14:RP105112.
https://doi.org/10.7554/eLife.105112.3


