CRISPR-edited DPSCs constitutively expressing BDNF enhance dentin regeneration in injured teeth
- Department of Oral Biology, College of Dentistry, University of Illinois Chicago, United States
Figures
Figure 1
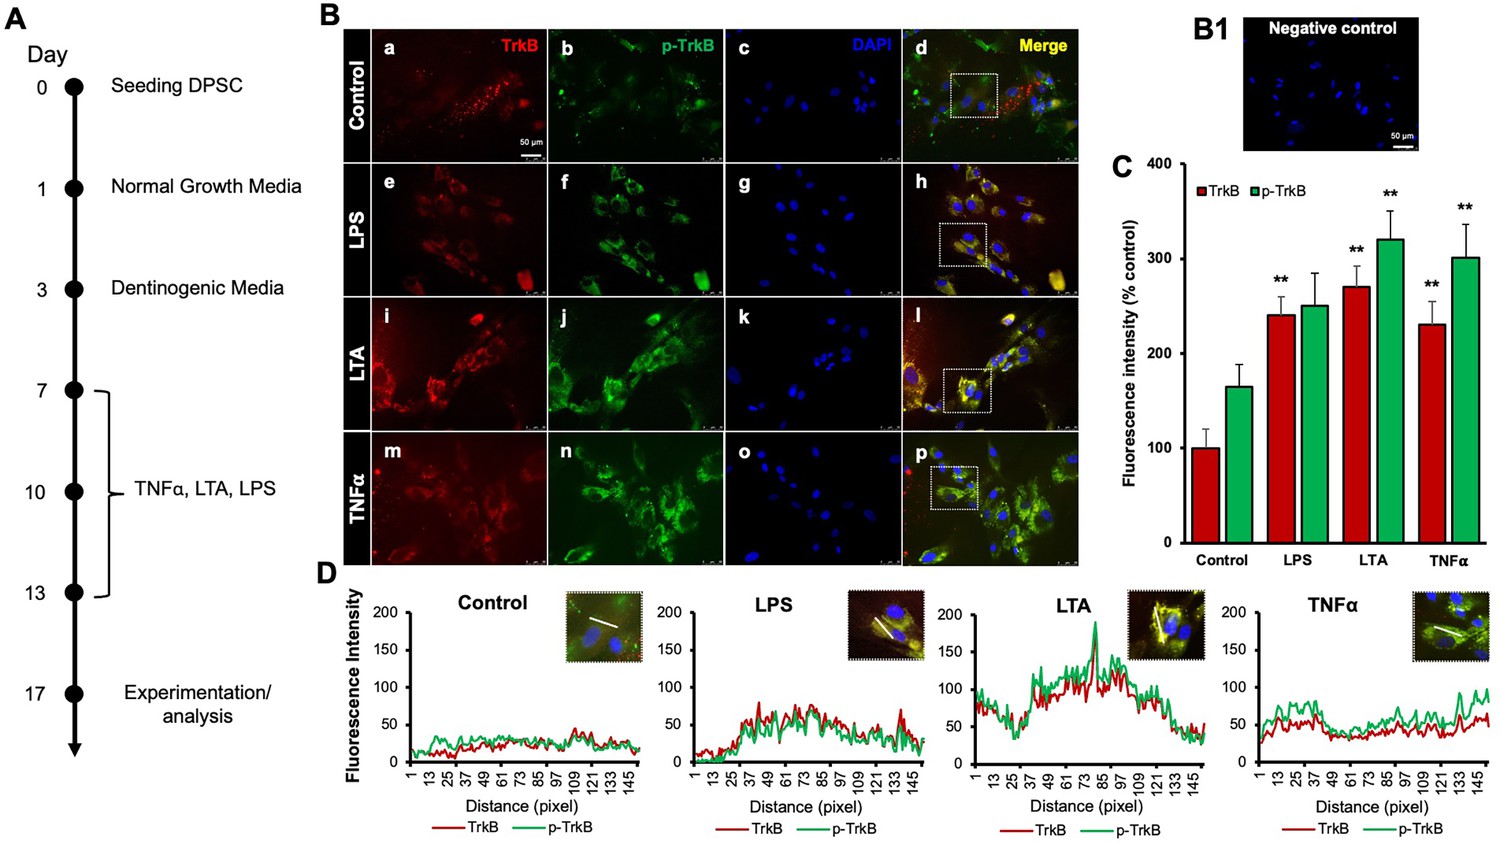
Effects of various inflammatory mediators on the expression of tropomyosin receptor kinase B (TrkB) and its phosphorylation in human dental pulp stem cells (DPSCs).
(A) Schematic representation of DPSC differentiation stimulated by various inflammatory mediators. (B) DPSCs were cultured in normal growth media with or without lipopolysaccharide (LPS), lymphotoxin-alpha (LTA), or tumor necrosis factor alpha (TNFα) for 24 h, and cells were fixed, and double immunofluorescent staining was performed (TrkB: red; p-TrkB: green). Cells were counter-stained with DAPI (blue). (a–d) The control cells showed less TrkB and p-TrkB expression than the LPS (e–h), LTA (i–l), or TNFα (m–p) treated groups. (B1) Negative control. (C) The bar graph shows a significant increment in TrkB and p-TrkB expression in the groups treated with inflammatory mediators. *p<0.05 and **p<0.01 vs. control. (D) The line graph shows that the co-localization of TrkB and p-TrkB are higher peaks observed in LPS, LTA, and TNFα-treated groups than in control. Scale bar: 50 μm.
Figure 2
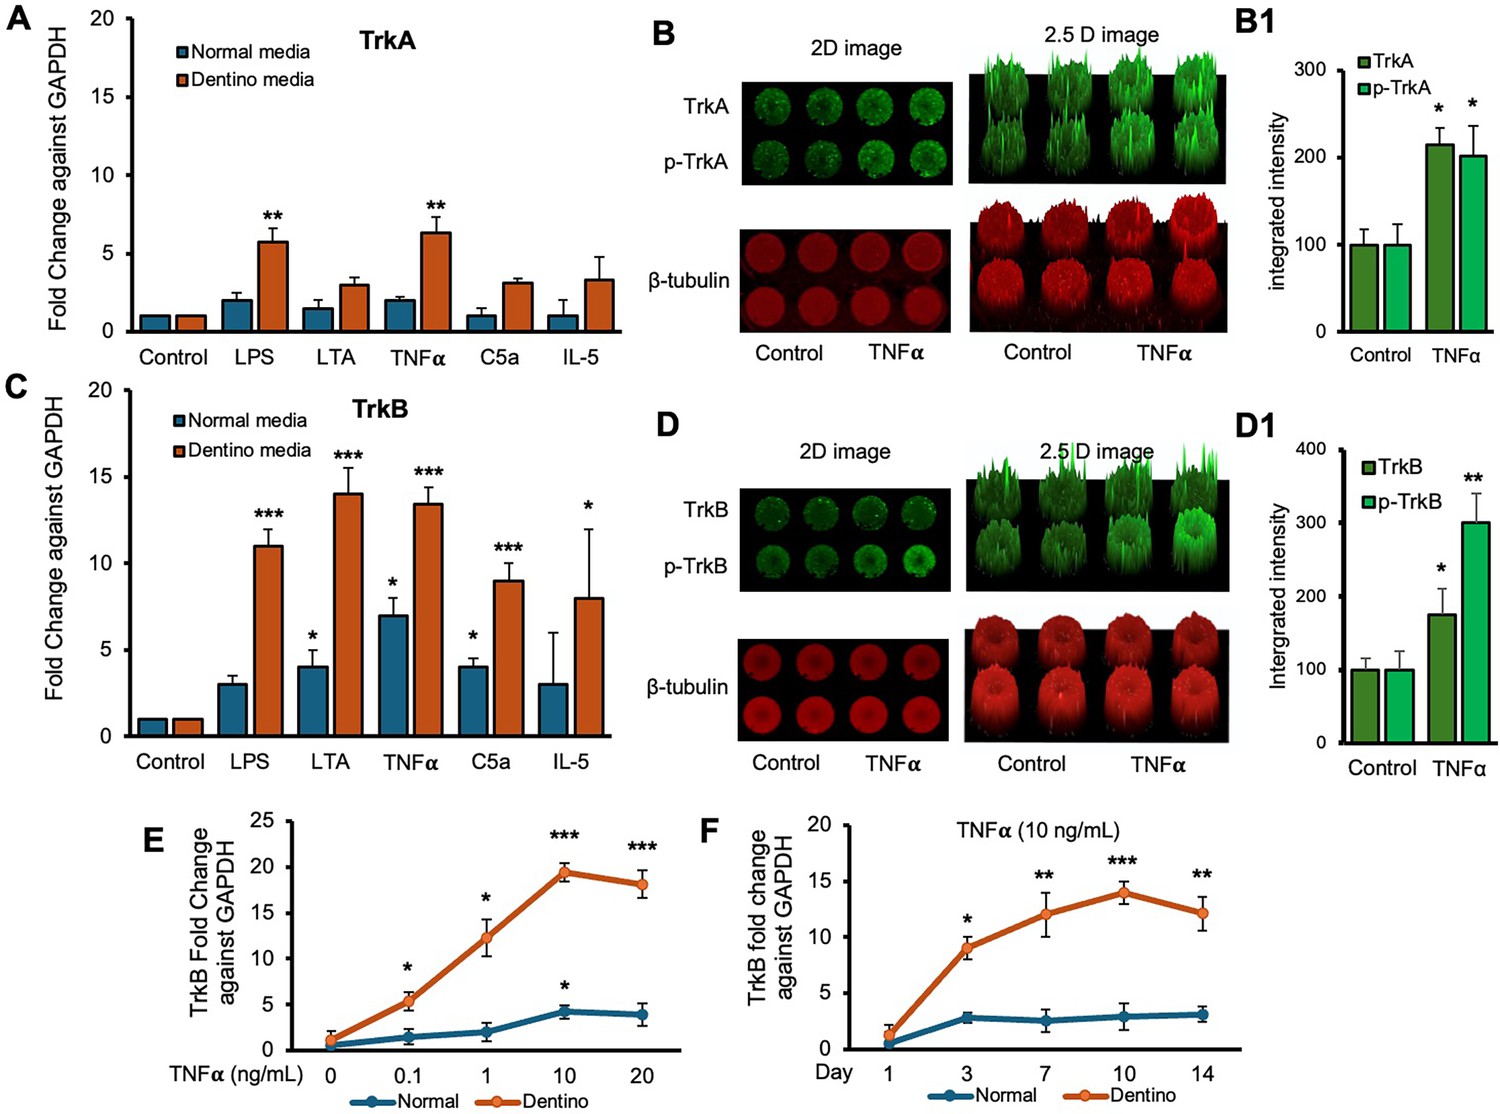
Time-course analyses of tropomyosin receptor kinase B (TrkB) mRNA expression in dental pulp stem cells (DPSCs).
(A, C) Real-time PCR was used to determine the effect of various inflammatory mediators (lipopolysaccharide [LPS], lymphotoxin-alpha [LTA], interleukin 5 (IL5), tumor necrosis factor alpha [TNFα], and C5a) on the expression level of TrkA and TrkB mRNA in DPSCs after 1-day treatment in regular growth medium (blue bars) or dentinogenic medium (red bars). While these inflammatory components do not affect much the expression of TrkA or TrkB in normal growth medium, inflammatory mediators such as LPS, LTA, and TNFα stimulation increase TrkB expression in DPSCs undergoing odontoblastic differentiation (orange bars ‘LPS, LTA, and TNFα’ vs. orange bar ‘Control’). Comparatively, TrkA expression changed little during the odontoblastic differentiation of DPSCs (A). (B, D) In cell western assay showing effects of TNFα on the expression of TrkA and TrkB and their phosphorylation in 2D and 2.5 D models. Graphs (B1, D1) show fluorescence intensity TNFα vs. control. (E) Effect of TNFα on TrkB expression. DPSCs were cultured in regular or dentinogenic/osteogenic medium and with 0, 0.1, 1, 10, or 20 ng/mL of TNFα. TrkB mRNA expression was determined by real-time PCR analysis after 24 h of culture. TNFα stimulation, independent of the concentration used, quickly potentiates the odontogenesis-regulated expression of TrkB. However, this TrkB expression increase is sustained with increasing concentrations of TNFα treatment, even at 20 ng/mL. (F) Real-time PCR was used to evaluate the level of TrkB mRNA in DPSCs after 1, 3, 7, 10, and 14 days of culture in regular medium (blue lines) or dentinogenic medium (orange lines) in TNFα-stimulated DPSCs odontoblastic differentiation. In contrast to relatively stable TrkB levels in undifferentiated DPSCs, TrkB expression quickly increased in dentinogenic medium, with the most significant increase detected between 7 and 10 days (fold increase: 7 day = 12.04 ± 2.1, 10 days = 14.1 ± 1.72). Results are expressed as relative expression to glyceraldehyde 3-phosphate dehydrogenase (GAPDH). Data are presented as mean ± SD of three independent experiments. *p<0.05 vs. regular medium, *p<0.05, and **p<0.01, ***p<0.001 vs. dentinogenic medium and without inflammatory stimulation.
Figure 3
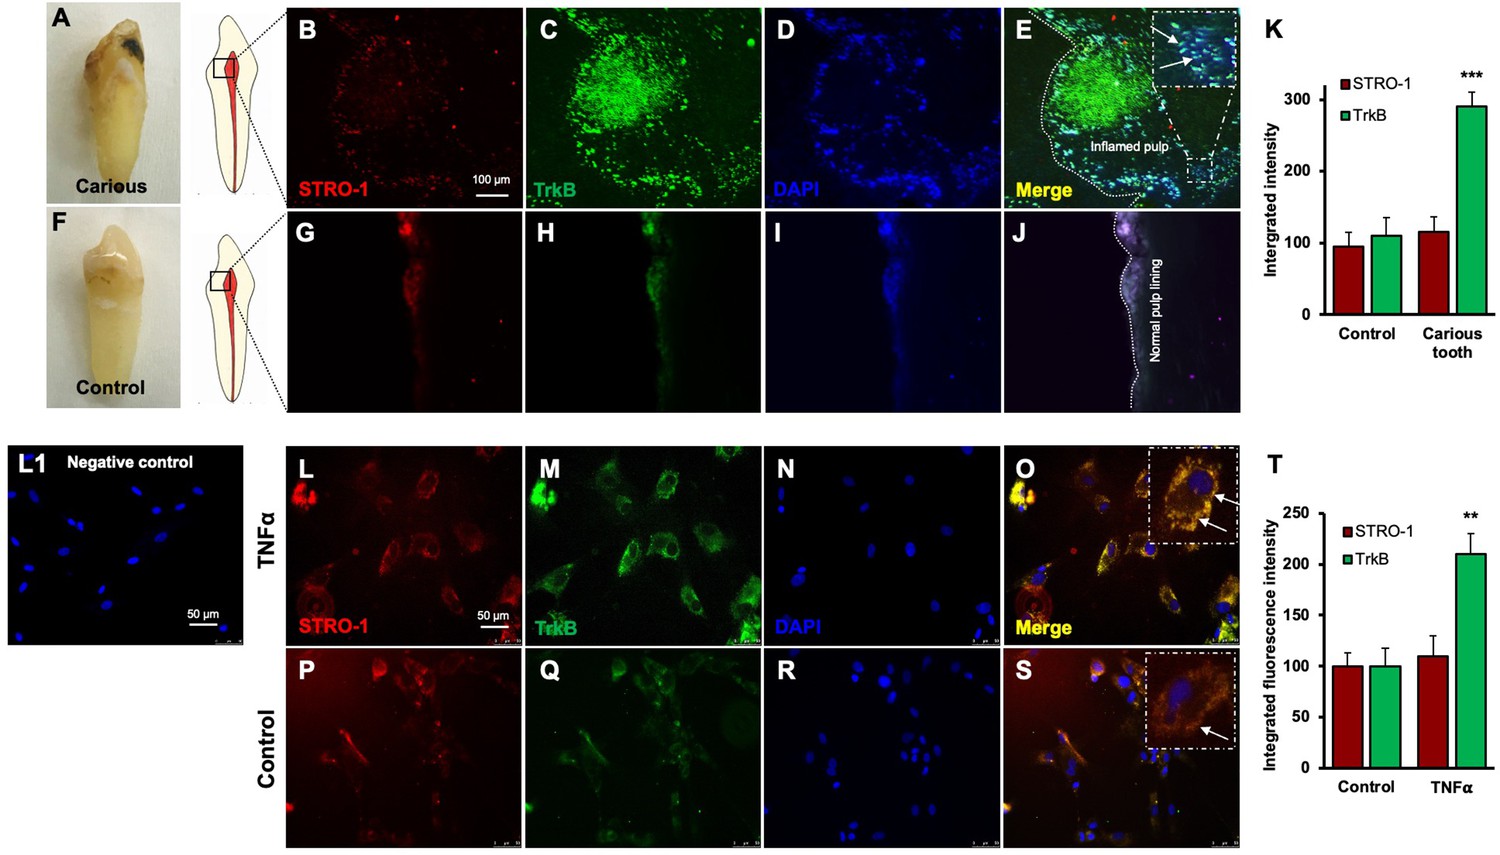
Expression of STRO-1 and tropomyosin receptor kinase B (TrkB) in human carious or normal tooth in vivo and dental pulp stem cells (DPSCs) in vitro.
(A–J) Immunofluorescence double staining was used to localize STRO-1 and TrkB-expressing cells in the human virgin (control) and carious tooth section. While the expression of STRO-1 was detected in the vicinity of blood vessels, TrkB is expressed more in inflamed pulp tissue compared with virgin tooth. Merged images of STRO-1 and TrkB staining demonstrated a co-expression of TrkB and STRO-1 in the perivascular area. Scale bar: 100 μm. Nuclei were counterstained with DAPI (blue). (L1) Negative control (K) The bar graph shows a significantly higher expression of TrkB in the carious tooth section (***p<0.001 vs. control). (L–S) Expression of STRO-1 and TrkB by DPSCs in vitro. Immunofluorescence double staining was used to analyze TrkB expression in control or untreated and TNFα-treated cells. All control DPSCs express both the mesenchymal stem cell marker STRO1 and TrkB, while TNFα-treated cells' TrkB expression was significantly higher than control. Merged images of STRO1 and TrkB revealed that all STRO-1-positive cells expressed TrkB. Nuclei were counterstained with DAPI (blue). Scale bar = 50 μm. (T) The bar graph shows significantly higher expression of TrkB in TNFα-treated cells (p<0.01 vs. control).
Figure 4
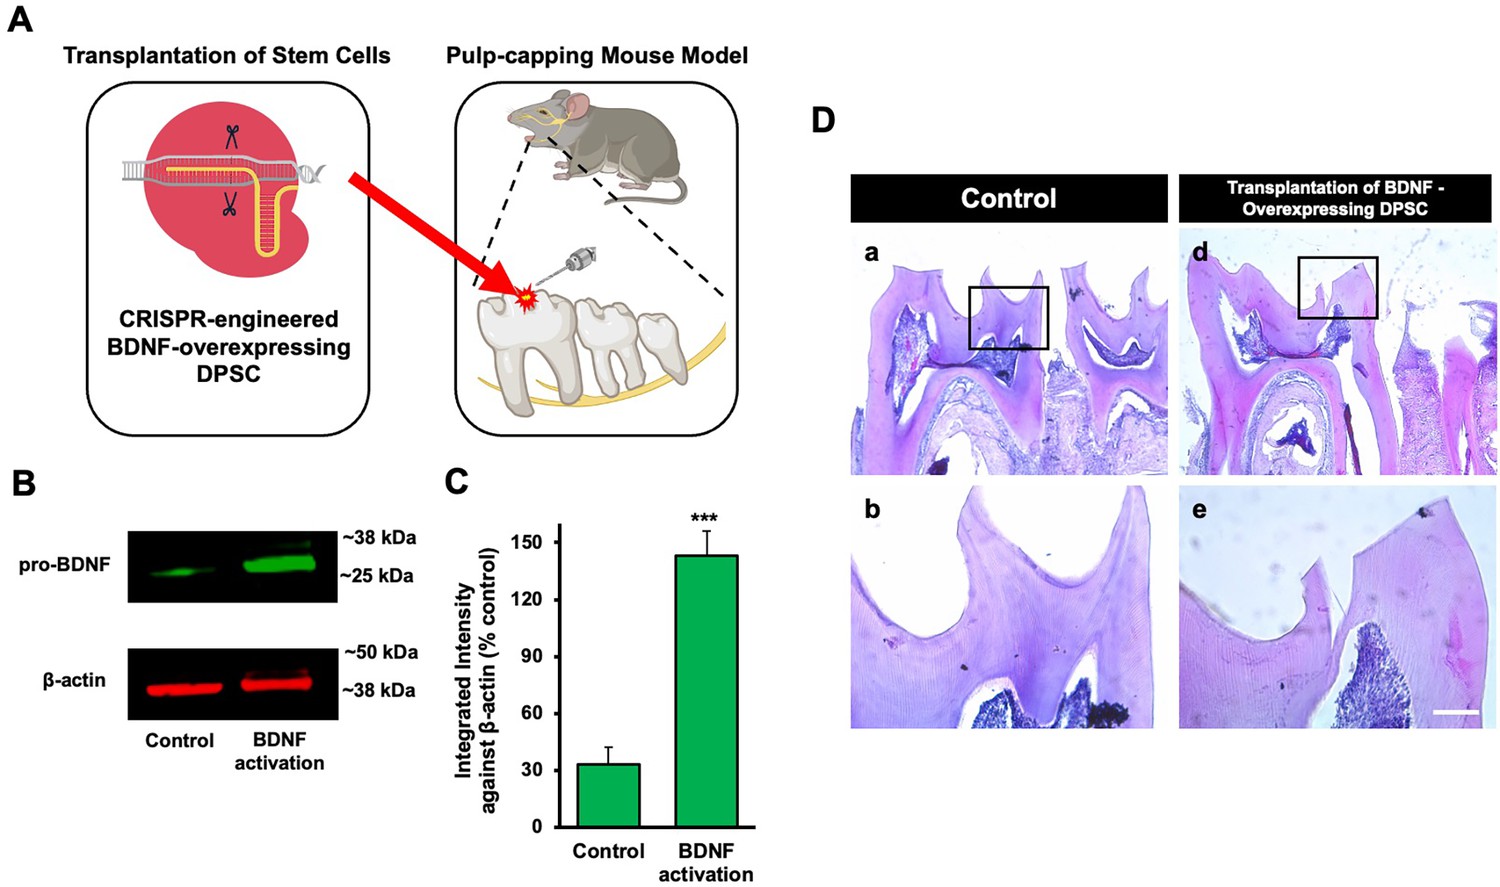
The transplantation of Clustered Regularly Interspaced Short Palindromic Repeats (CRISPR)-engineered brain-derived neurotrophic factor (BDNF)-overexpressing dental pulp stem cells (DPSCs) in the pulp-capping mouse model.
(A) A schematic representation of the transplantation of DPSC into the first molar tooth after drilling. (B) The confirmation of BDNF CRISPR activation plasmid enhanced the expression of pro-BDNF. (C) Bar graph showing the integrated intensity of CRISPR-engineered BDNF-activated DPSCs against β-actin compared to control. (D) H&E staining of sham control and injured tooth in mouse (n = 6 each group) transplanted with CRISPR-engineered BDNF-overexpressing DPSCs. Scale bar: 100 μm.
-
Figure 4—source data 1
Original files for western blot images displayed in Figure 4B.
- https://cdn.elifesciences.org/articles/105153/elife-105153-fig4-data1-v1.zip
-
Figure 4—source data 2
Original files for western blot images displayed in Figure 4B with labeling.
- https://cdn.elifesciences.org/articles/105153/elife-105153-fig4-data2-v1.zip
Figure 5
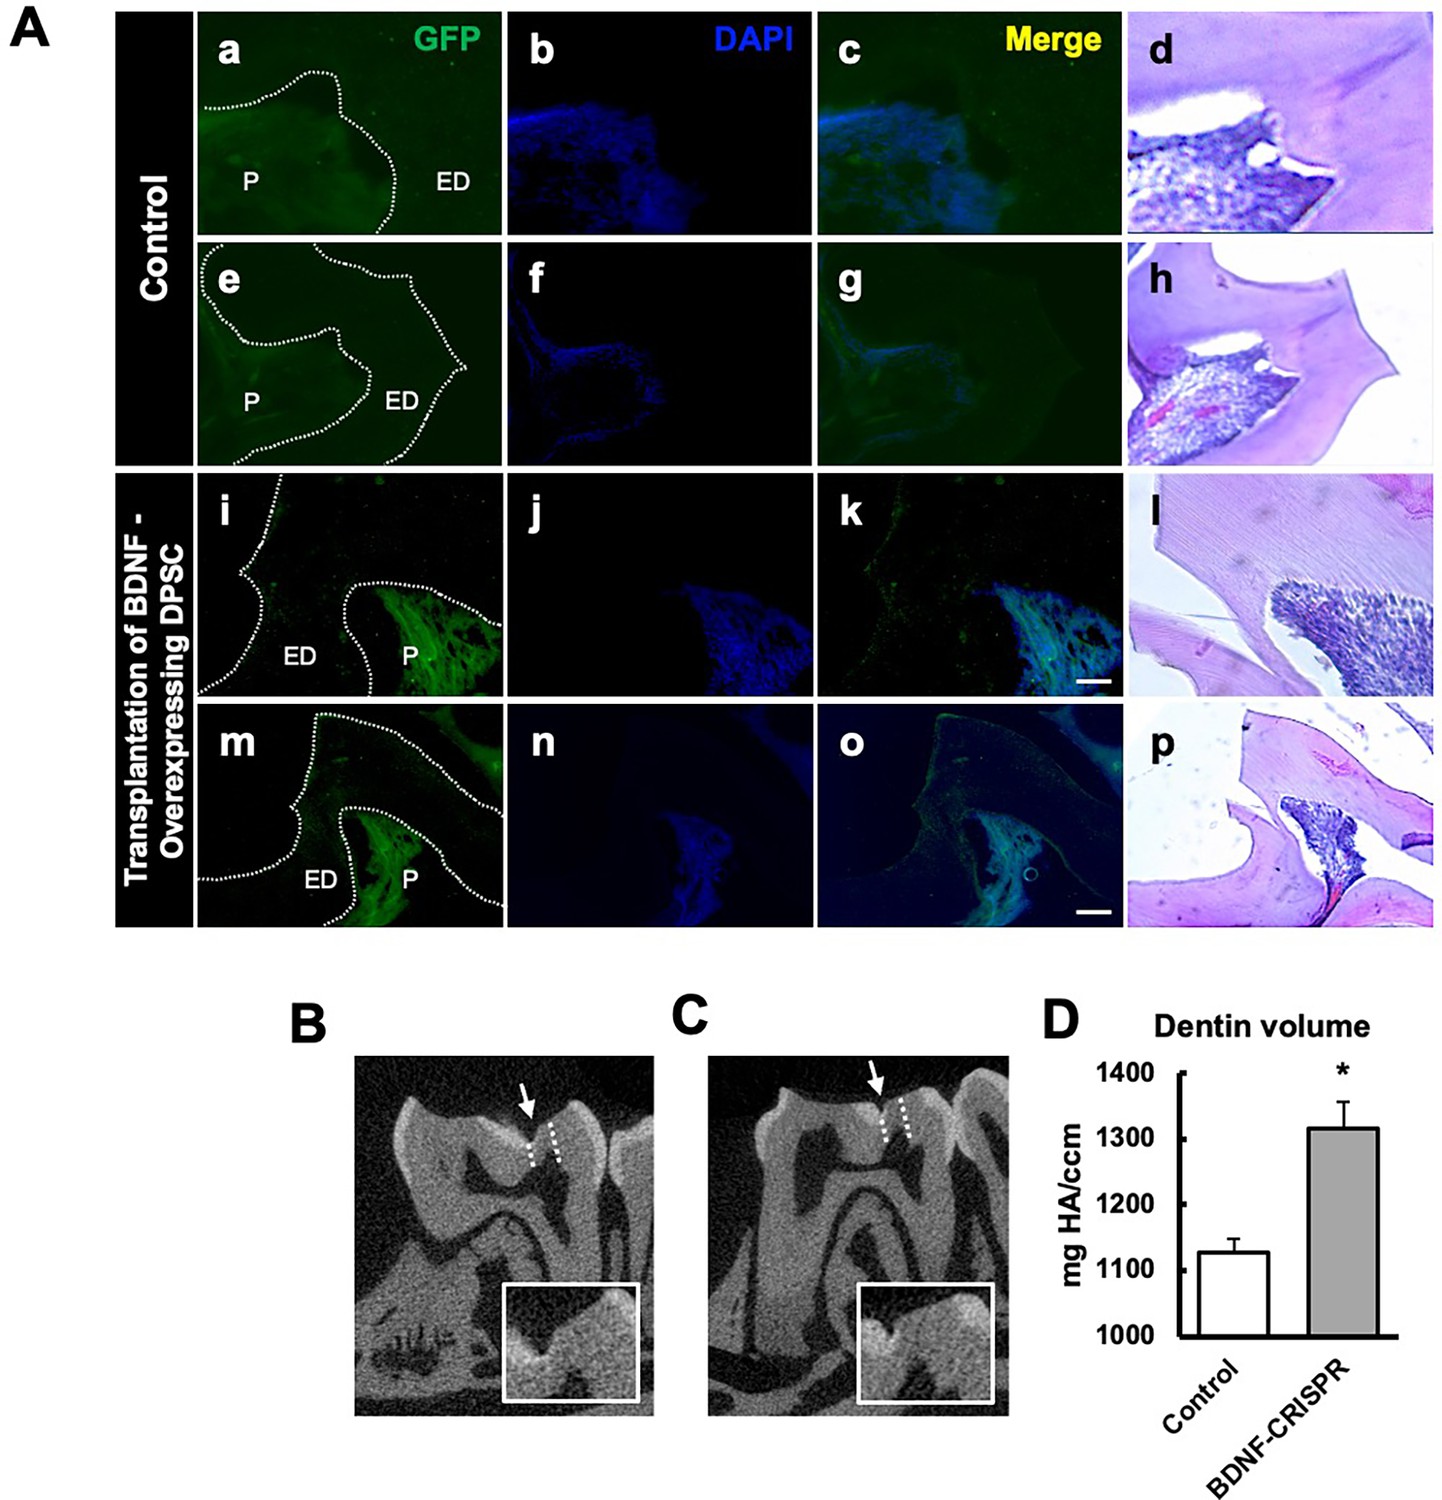
The transplantation of Clustered Regularly Interspaced Short Palindromic Repeats (CRISPR)-engineered brain-derived neurotrophic factor (BDNF)-overexpressing dental pulp stem cells (DPSCs) in the pulp-capping mouse model and micro-CT analysis.
(A) Immunohistochemistry was performed to assess GFP-tagged transplanted cells. The white arrow indicates the pulp lining. Scale bar: 100 μm (B) Micro-CT image in the sham control of the pulp-capping mouse model. The white arrow indicates the drilling operation, and the dotted line specifies the injured area of dentin. The white box is a magnified image of the injured area. (C) The transplantation of CRISPR-engineered BDNF-overexpressing DPSCs in the pulp-capping mouse model. (D) Analyzed density of dentin compared with sham control vs. transplantation of CRISPR-engineered BDNF-overexpressing DPSCs in the pulp-capping mouse model (n=5). p<0.05 vs. control.
Figure 6
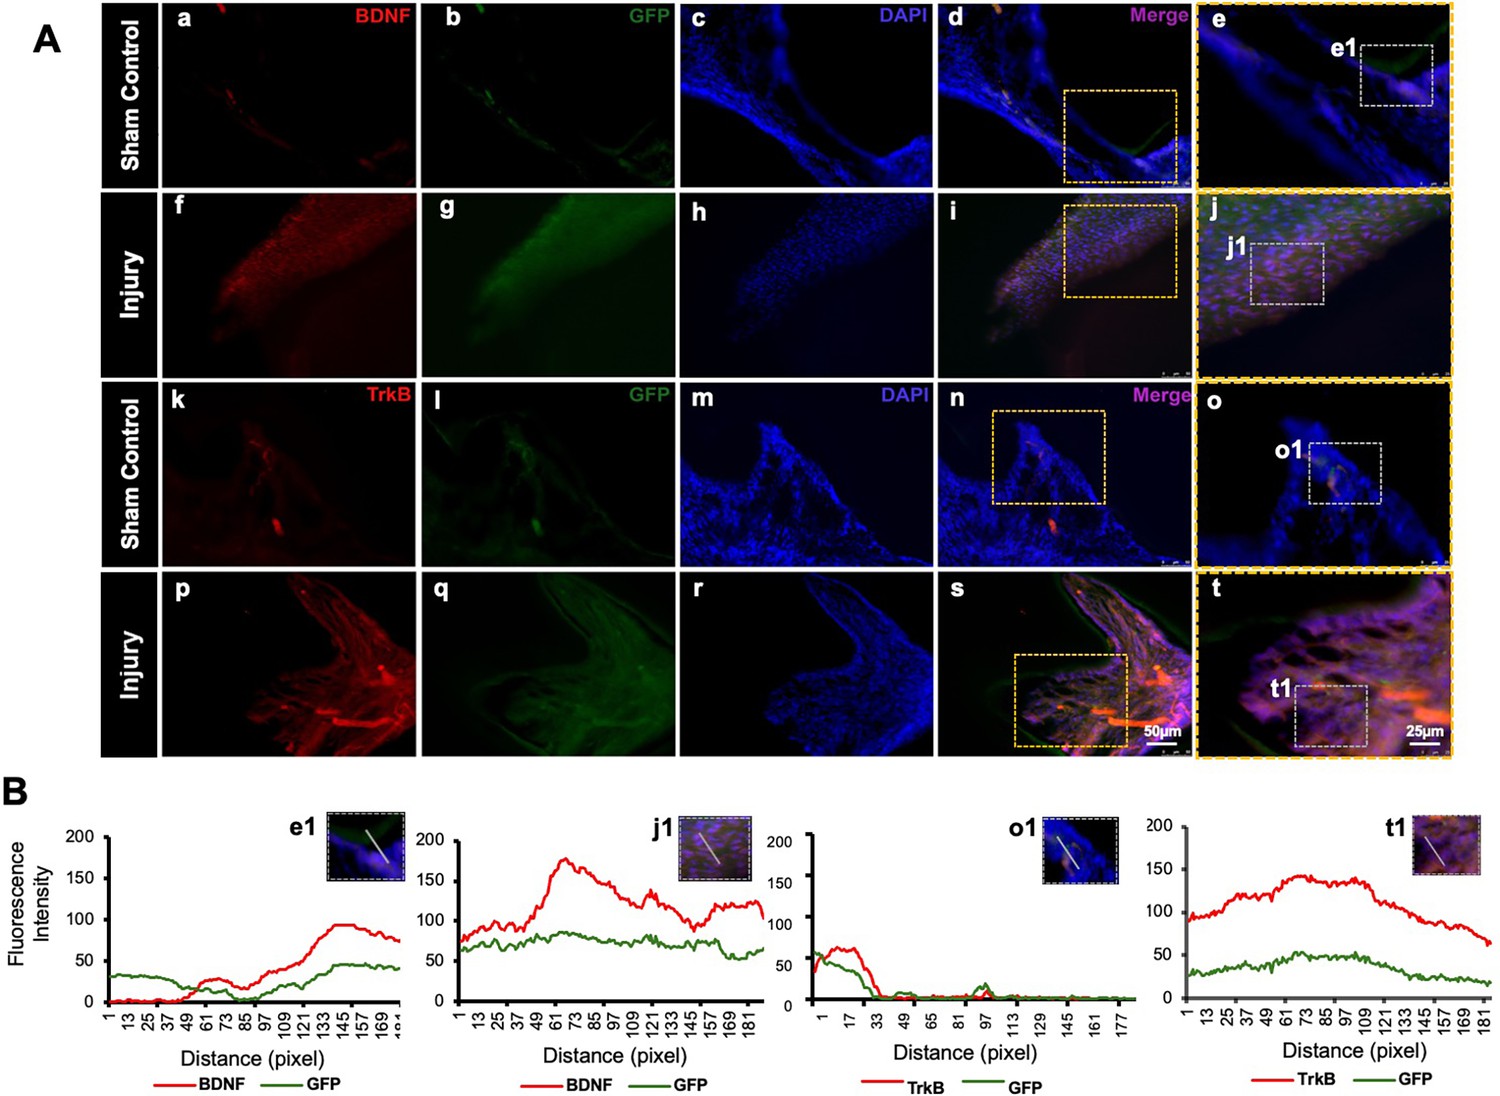
Detection of brain-derived neurotrophic factor (BDNF) and tropomyosin receptor kinase B (TrkB) in GFP-tagged cells transplanted in the pulp-capping mouse model.
(A) Representative image of sham control of the pulp-capping mouse model. (a–j) Sham control vs. (k–t) representative image of the transplantation of Clustered Regularly Interspaced Short Palindromic Repeats (CRISPR)-engineered BDNF-overexpressing DPSCs in the pulp-capping mouse model. Scale bars: 25 and 50 μm. (B) Line graphs showing the co-localization of BDNF and GFP [B (e1 and j1)] and of TrkB and GFP [B (o1 and t1)].
Figure 7
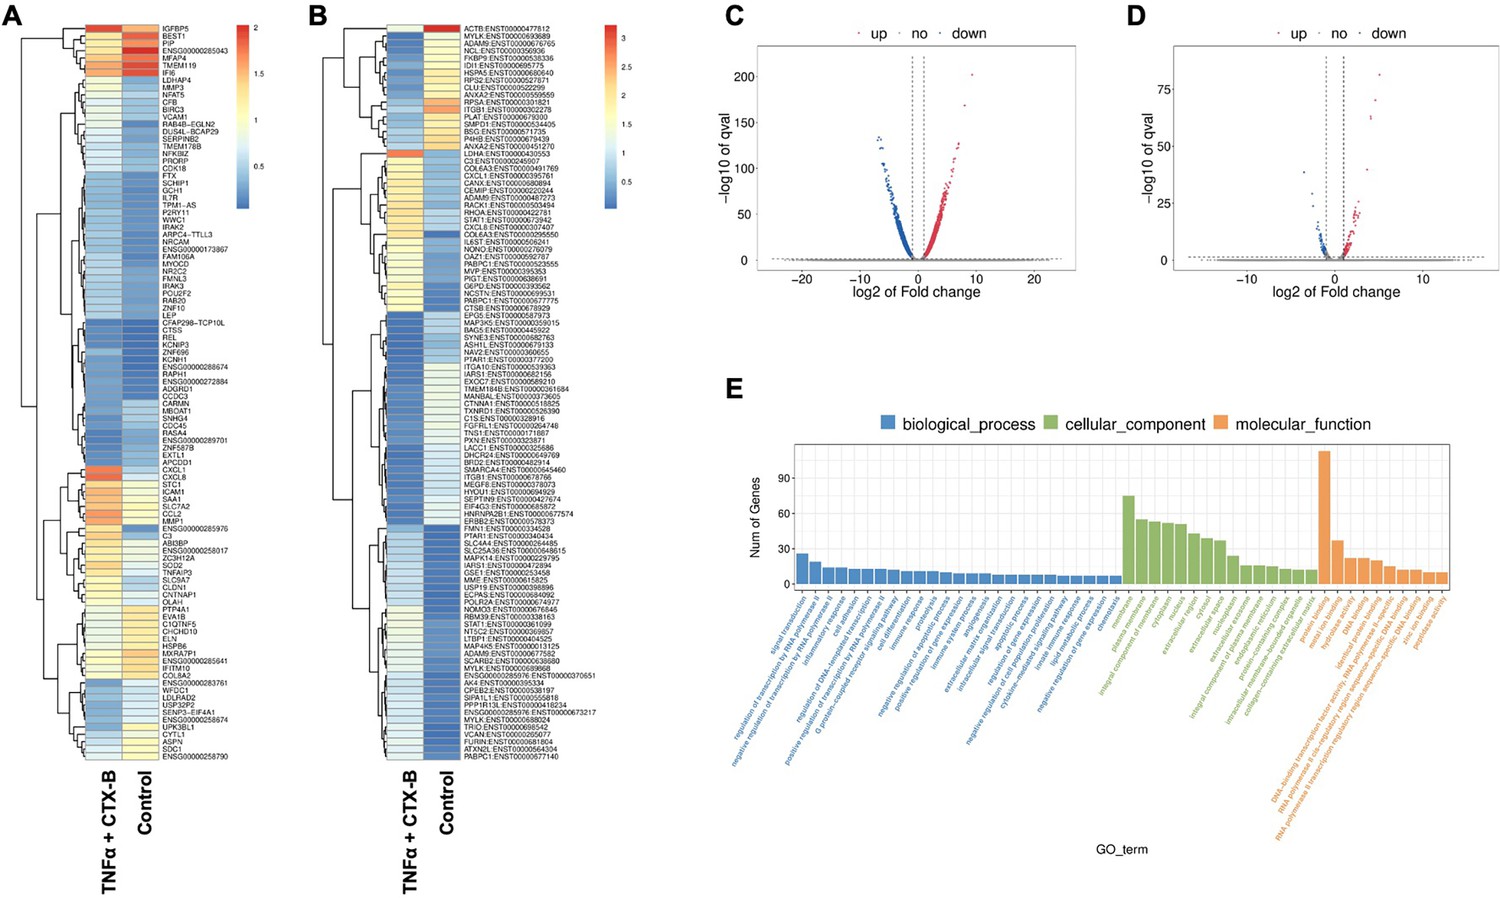
The total RNA-seq analysis between normal dental pulp stem cells (DPSCs) and tumor necrosis factor alpha (TNFα)+cyclotraxin-B (CTX-B)-treated DPSCs in dentinogenic media.
(A) Heatmap of the differentially expressed genes between normal DPSCs and TNFα+CTX-B DPSCs in dentinogenic media from total RNA-seq analysis. (B) Transcripts heatmap of the differentially expressed genes between normal DPSCs and TNFα+CTX-B DPSCs in dentinogenic media from total RNA-seq analysis. Color corresponds to log to fold change. Red and yellow stripes in the figure represent high-expression genes, while blue stripes represent low-expression genes. (C) Volcano map comparing gene expression between normal DPSCs and TNFα+CTX-B-treated DPSCs. (D) Volcano map comparing transcripts between normal DPSCs and TNFα+CTX-B-treated DPSCs. In both plots, the x-axis represents the log2 fold change in gene expression, and the y-axis represents the -log10 of the adjusted p-value. Genes or transcripts significantly upregulated are marked in red, and downregulated genes are marked in blue. The dotted horizontal line indicates the threshold for statistical significance, while vertical lines indicate fold change thresholds. (E) Significant enriched Gene Ontology (GO) terms among control and TNFα+CTX-B-treated DPSCs based on biological process (blue), cellular function (green), and molecular function (orange). Bar chart representing the number of genes associated with significant GO terms. The x-axis lists the GO terms, while the y-axis shows the number of genes enriched for each term.
Figure 8
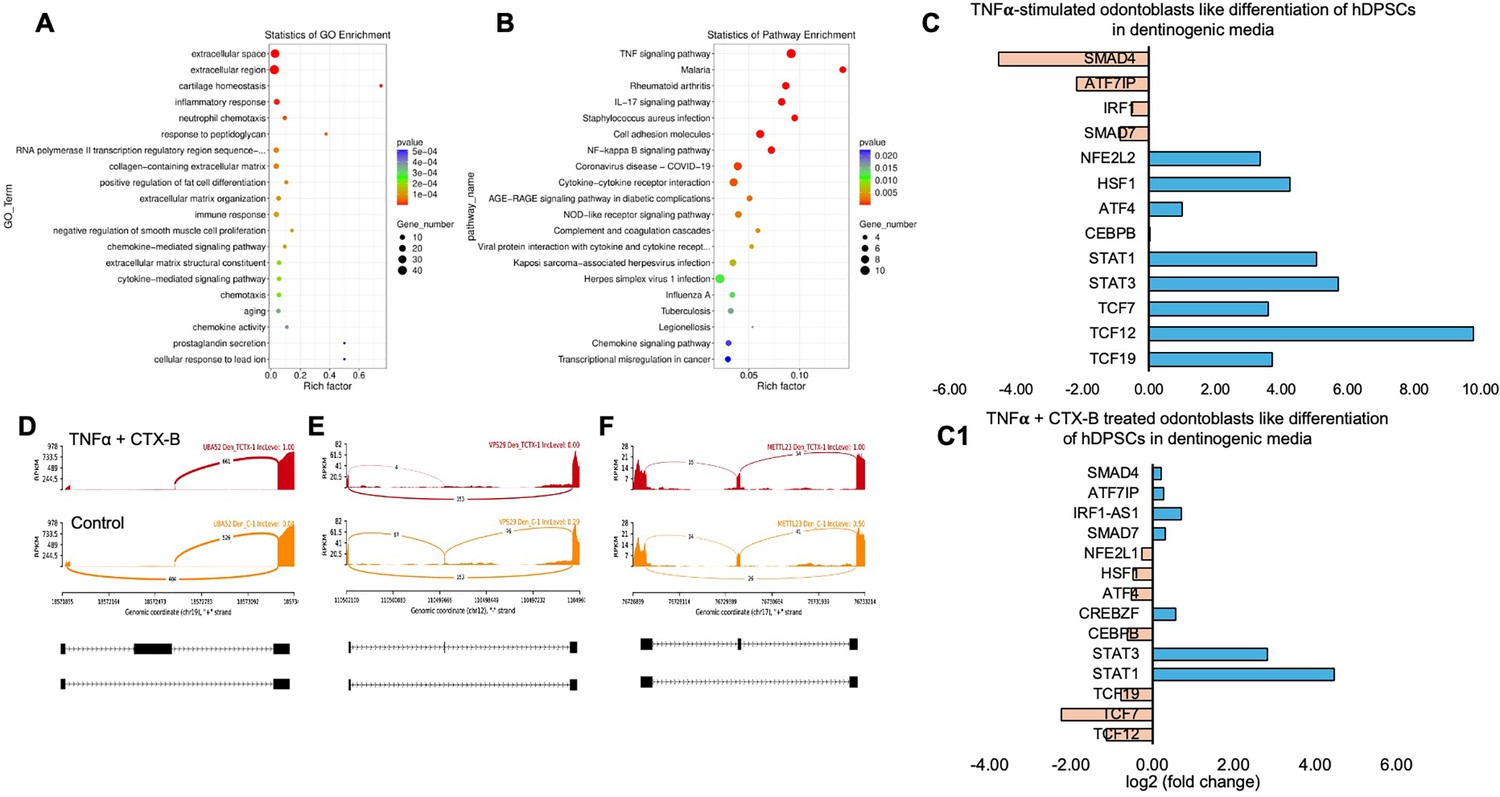
Signaling pathways affected by tumor necrosis factor alpha (TNFα)-induced dental pulp stem cells (DPSCs) mediated by tropomyosin receptor kinase B (TrkB) inhibitor in odontoblasts like differentiation of DPSCs in dentinogenic media.
(A) A dot plot showing the Gene Ontology (GO) terms enriched in the dataset. The size of the dots represents the number of differentially expressed genes (DEGs), while the color indicates the p-value, with darker colors representing more significant enrichment depending on the rich factor, which is the ratio of the number of DEGs annotated in a GO term to the total number of genes annotated in that term. (B) The pathways enriched among the DEGs. The x-axis shows the rich factor, and the y-axis lists the pathways. The size of the dot indicates the number of genes involved in each pathway. (C–C1) Next-generation RNA sequencing was done using the poly-A-RNA sequencing technique. Histogram showing upregulated and activated transcription factors (blue) and repressed or downregulated transcription factors (orange). Histogram showing the effect of TNFα alone and combined with cyclotraxin-B (CTX-B) on the regulation of various transcription factors. Notably, TCF (7, 12, 19) was abolished with the treatment of CTX-B. (D–F) The Sashimi plots show the expression patterns of specific genes in response to TNFα+CTX-B treatment. Data were examined on sashimi plots, which revealed the number of variants and genomic mutations on chr19, chr12, and chr17 in TNFα+CTX-B-treated cells in dentinogenic media against control. Red sashimi plots show variants in the TNFα+CTX-B-treated group, and orange shows in the control. The lower black annotations are Read alignments of alternative isoforms and genomic regions of interest providing the gene model, with exons represented as thick blocks and introns as thin lines.
Figure 9
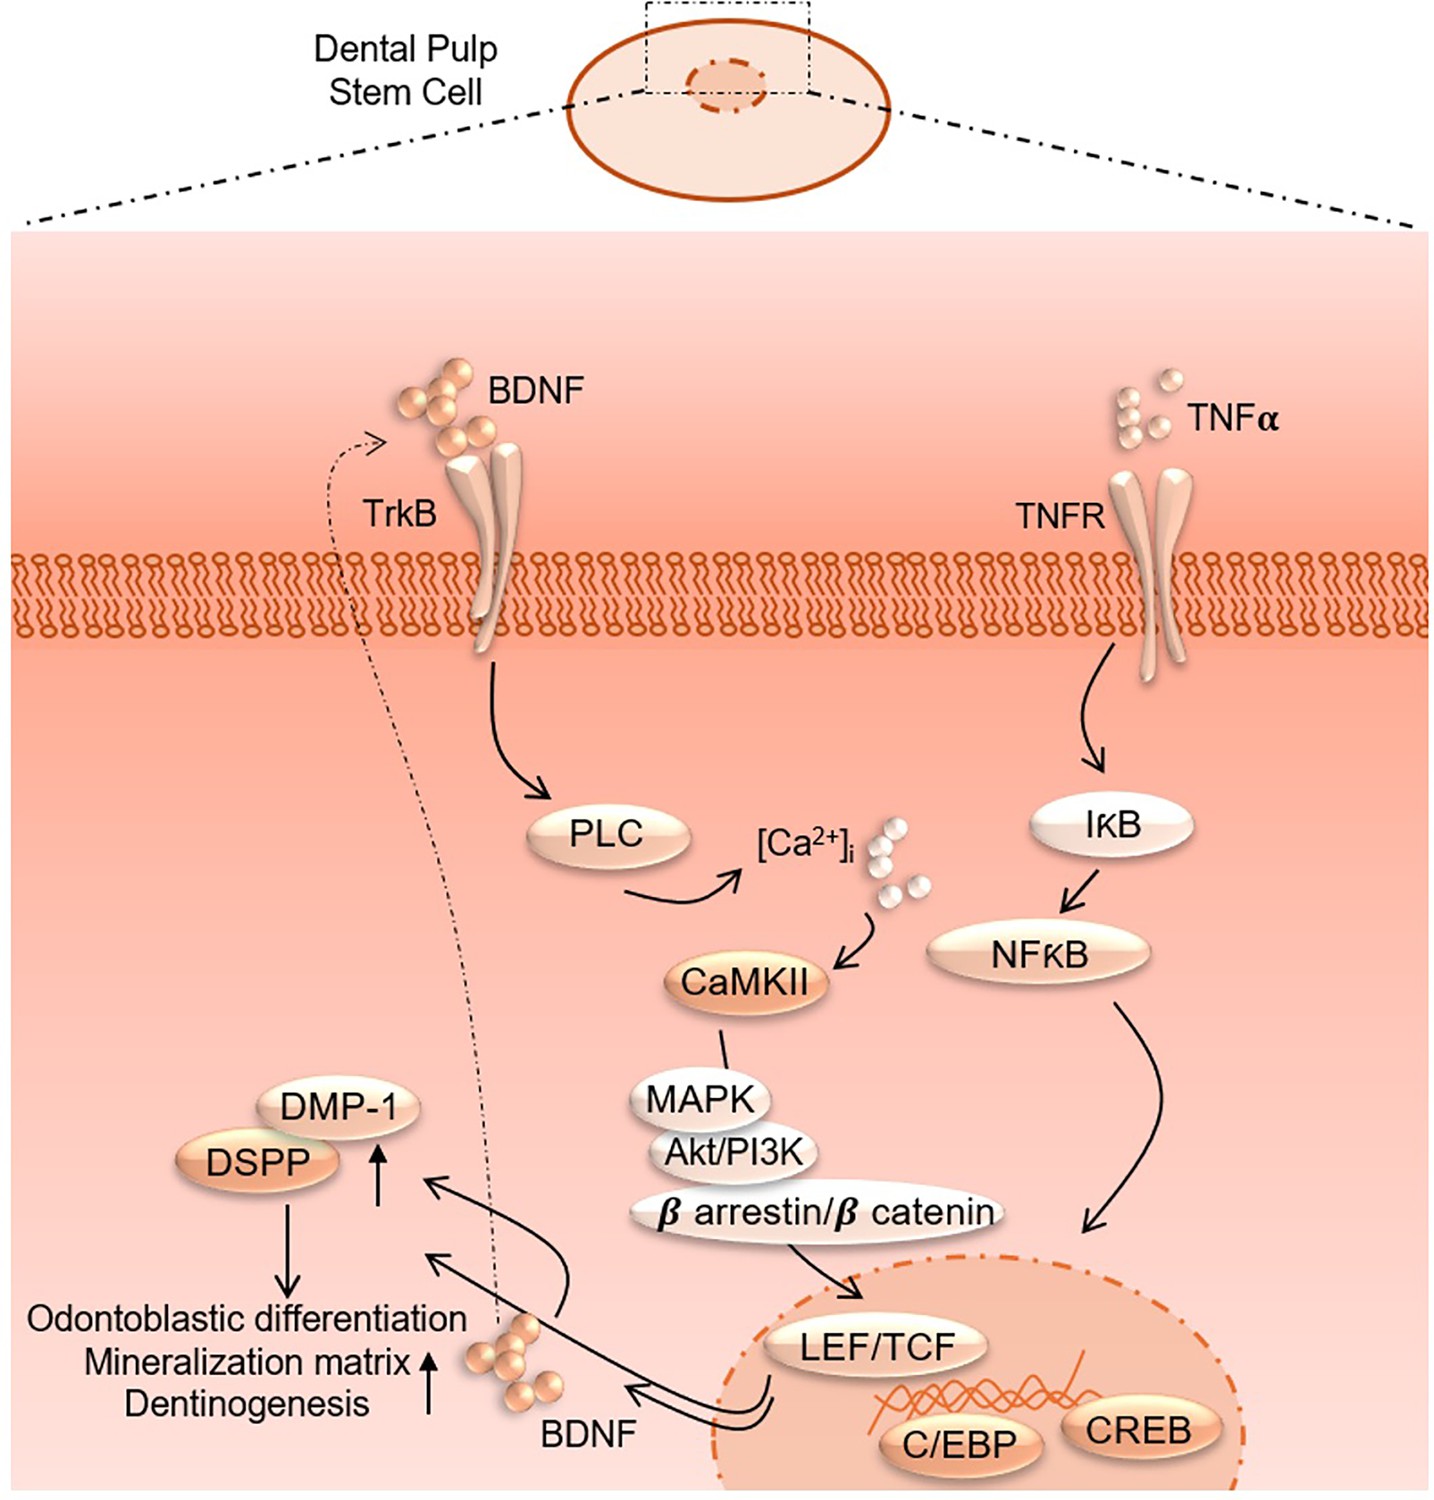
Proposed interaction of tumor necrosis factor alpha (TNFα) and brain-derived neurotrophic factor (BDNF)/tropomyosin receptor kinase B (TrkB) downstream signaling to modulate odontoblastic differentiation in dental pulp stem cells (DPSCs).
Author response image 1
Additional files
Download links
A two-part list of links to download the article, or parts of the article, in various formats.
Downloads (link to download the article as PDF)
Open citations (links to open the citations from this article in various online reference manager services)
Cite this article (links to download the citations from this article in formats compatible with various reference manager tools)
CRISPR-edited DPSCs constitutively expressing BDNF enhance dentin regeneration in injured teeth
eLife 14:RP105153.
https://doi.org/10.7554/eLife.105153.3


