Mechanisms that regulate the C1-C2B mutual inhibition control functional switch of UNC-13
- Department of Neuroscience, City University of Hong Kong, China
- Centre for Regenerative Medicine and Health, Hong Kong Institute of Science and Innovation, Chinese Academy of Sciences, China
- Queensland Brain Institute, The University of Queensland, Australia
- Neuroscience Research Center, Key Laboratory of Biomedical Information Engineering of Ministry of Education,School of Life Science and Technology, Xi’an Jiaotong University, China
- School of Biomedical Engineering, Guangzhou Medical University; Guangzhou National Laboratory; Bioland Laboratory, China
- Key Laboratory of Cognitive Science, Hubei Key Laboratory of Medical Information Analysis and Tumor Diagnosis & Treatment, Laboratory of Membrane Ion Channels and Medicine, College of Biomedical Engineering, South-Central Minzu University, China
- Key Laboratory of Molecular Biophysics of the Ministry of Education, College of Life Science and Technology, Huazhong University of Science and Technology, China
- Department of Neurology of the Fourth Affiliated Hospital and School of Brain Science and Brain Medicine, Zhejiang University School of Medicine, China
Figures
Figure 1 with 1 supplement
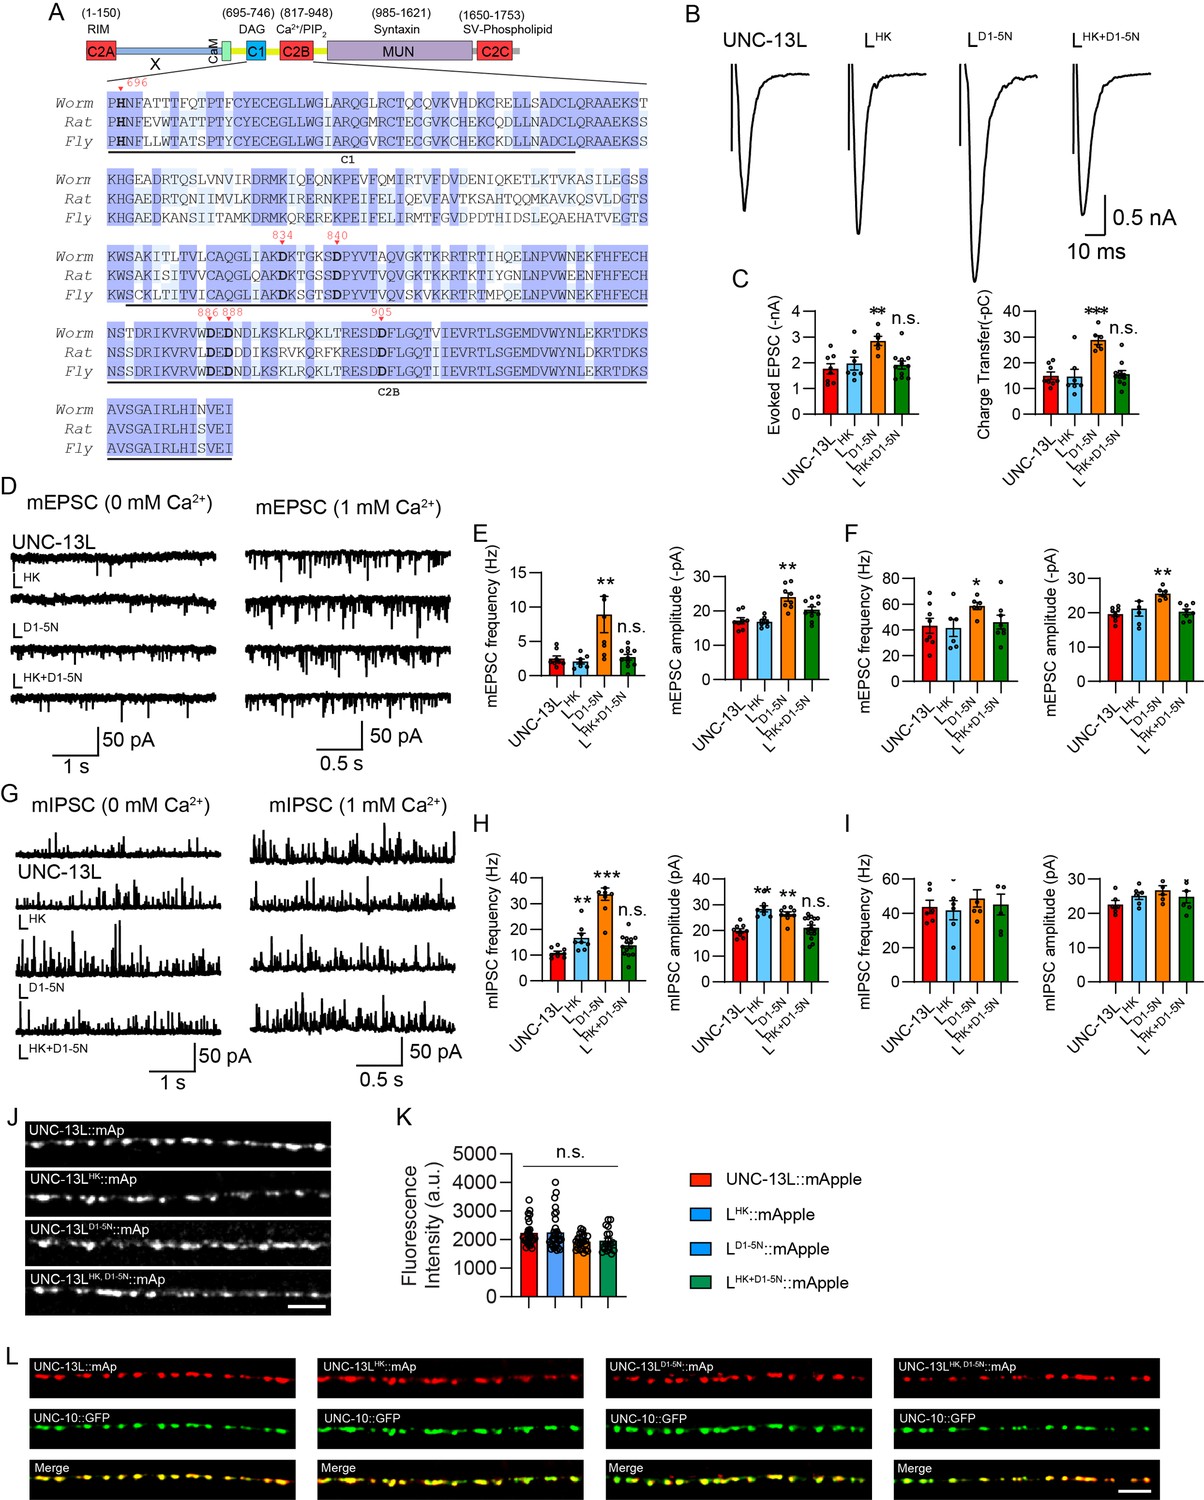
Concurrent HK and DN mutations eliminate the enhancement of synaptic vesicle (SV) release.
(A) Sequence alignment of the C1 and C2B domains between the worm UNC-13L, the rat Munc13-1, and the fly UNC-13A. The highly conserved residues in all three species are marked in blue, while shared only by two species are marked in light blue. The HK mutation in C1 that affects diacylglycerol (DAG) binding and the DN mutations in C2B that abolish Ca2+ binding are marked bold and indicated by inverted red triangles. (B) Example traces of stimulus-evoked excitatory postsynaptic currents (EPSCs) from UNC-13L, LHK, LD1-5N, and LHK+D1-5N rescued animals. (C) Quantification of the evoked EPSC amplitude and charge transfer from the same genotypes as in B. (D) Representative miniature EPSC (mEPSC) traces (recorded at 0 mM and 1 mM Ca2+) from the indicated genotypes. (E and F) Averaged mEPSC frequency and amplitude from the same genotypes as in D. (G) Representative miniature inhibitory postsynaptic current (mIPSC) traces (recorded at 0 mM and 1 mM Ca2+) from the indicated genotypes. (H and I) Quantification of the frequency and amplitude of the mIPSCs from the same genotypes as in G. (J) Representative confocal z stack images for mApple-tagged UNC-13L, UNC-13LHK, UNC-13LDN, and UNC-13LHK+DN (all driven by the unc-129 promoter). Scale bar, 5 μm. (K) Quantification of the fluorescence intensity from the lines in J. (L) Colocalization between the active zone marker UNC-10::GFP and mApple-tagged UNC-13L, UNC-13LHK, UNC-13LDN, and UNC-13LHK+DN. Data are mean ± SEM (**p<0.01, ***p<0.001 when compared to UNC-13L rescue; n.s., nonsignificant when compared to UNC-13L rescue; one-way ANOVA).
Figure 1—figure supplement 1
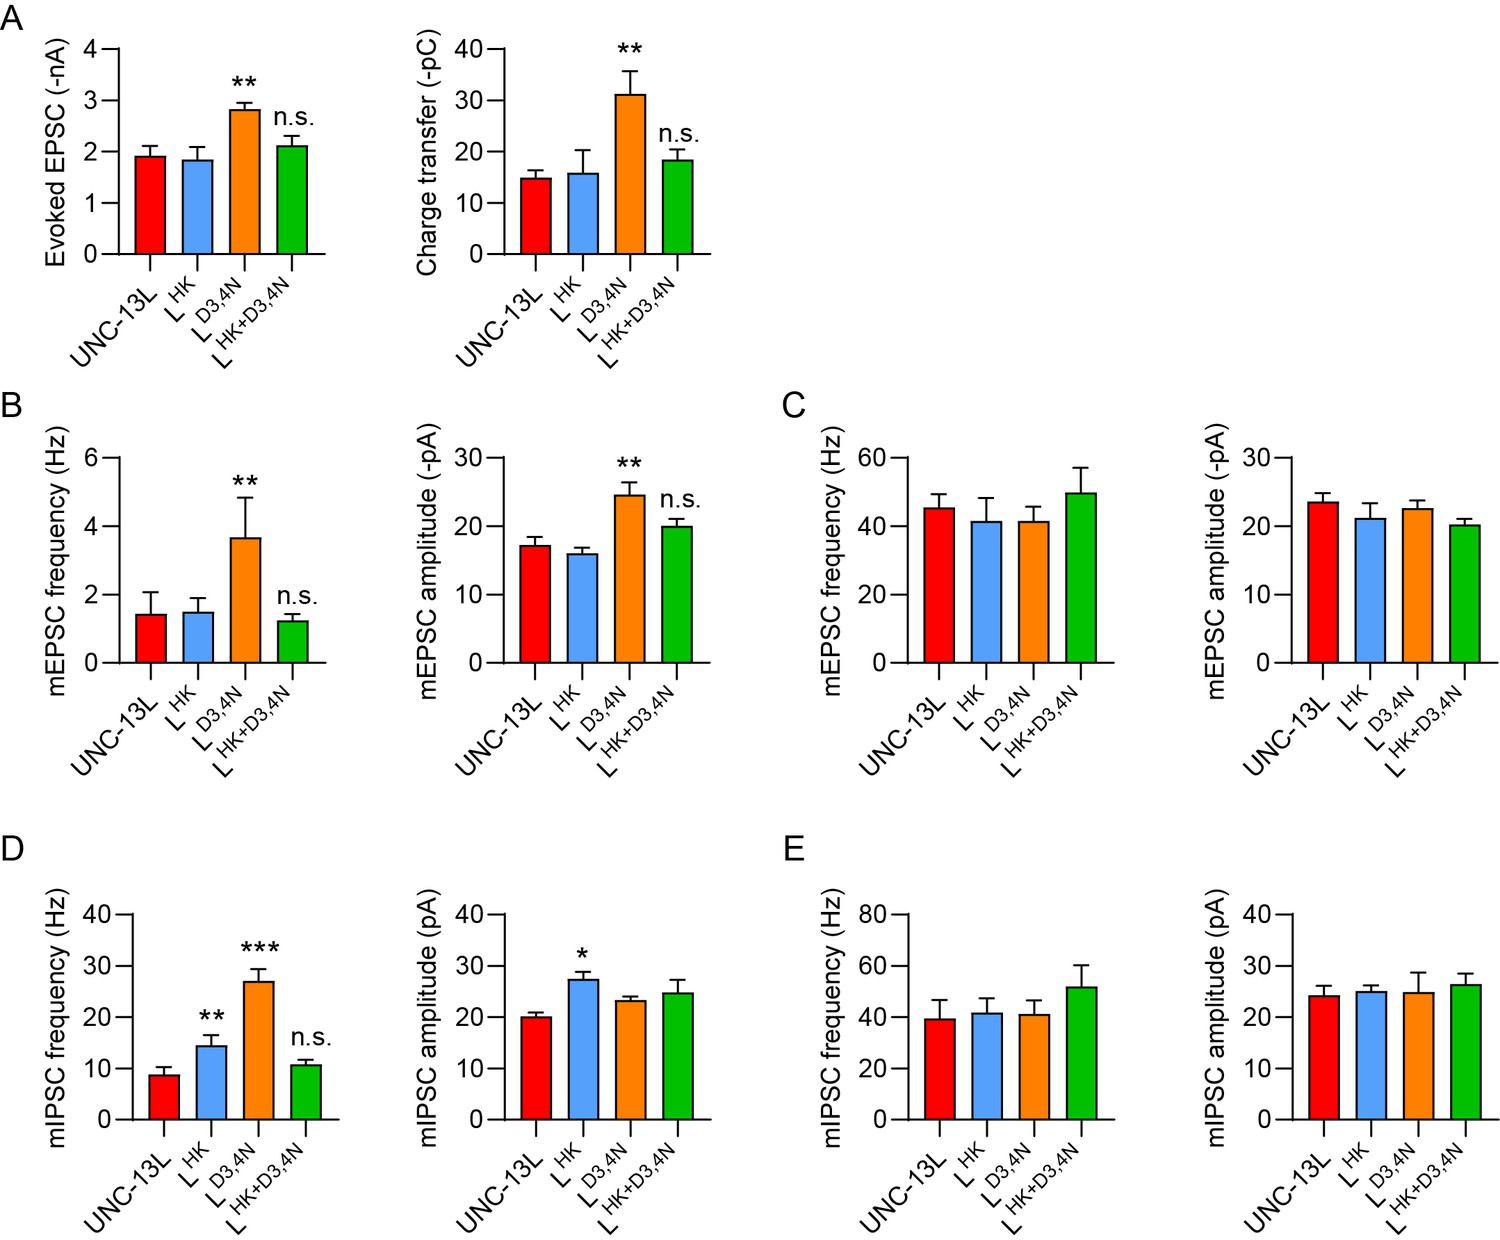
Concurrent HK and D3,4N mutations also eliminate the enhancement of synaptic vesicle (SV) release.
(A) Quantification of the evoked excitatory postsynaptic current (EPSC) amplitude and charge transfer from UNC-13L, LHK, LD3,4N, and LHK+D3,4N rescued animals. (B and C) Quantification of the frequency and amplitude of the miniature EPSCs (mEPSCs) (recorded at 0 mM and 1 mM Ca2+) from the same genotypes in A. (D and E) Quantification of the frequency and amplitude of the miniature inhibitory postsynaptic currents (mIPSCs) (recorded at 0 mM and 1 mM Ca2+) from the same genotypes as in A. Data are mean ± SEM (*p<0.05, **p<0.01, ***p<0.001 when compared to UNC-13L; n.s., nonsignificant when compared to UNC-13L; one-way ANOVA).
Figure 2
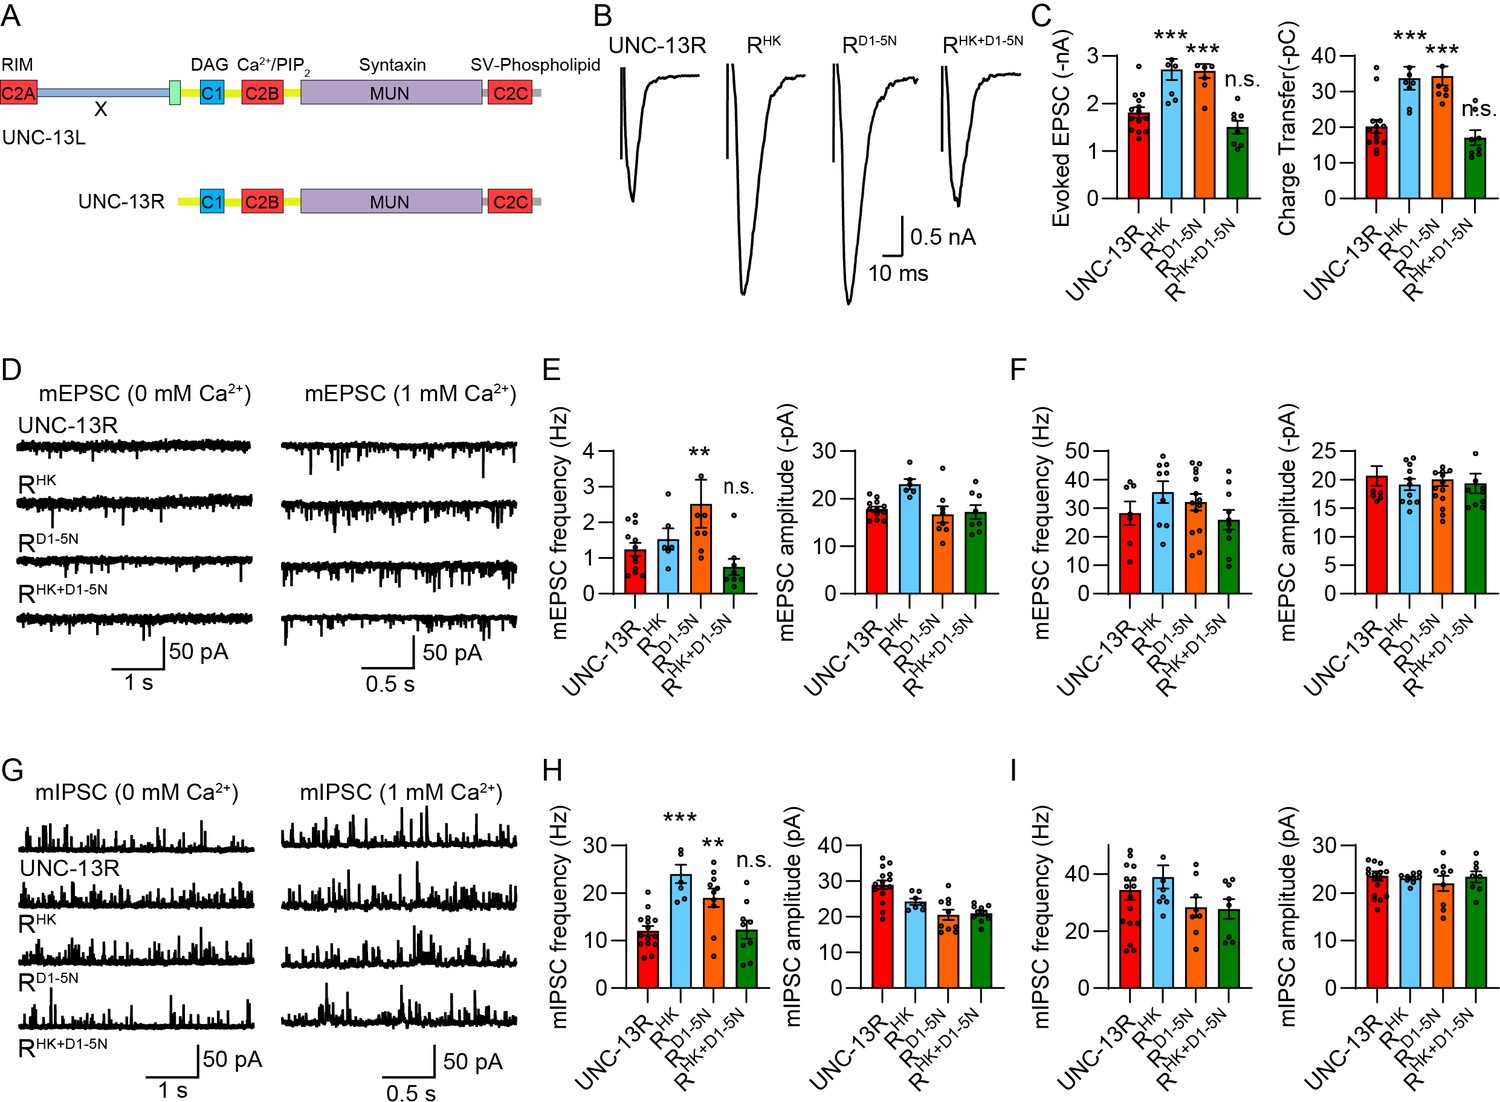
The N-terminus in UNC-13L regulates the functions of C1 and C2B.
(A) Cartoon depicting the HK and DN mutations in UNC-13L and UNC-13R. (B) Example traces of stimulus-evoked excitatory postsynaptic currents (EPSCs) from UNC-13R, RHK, RD1-5N, and RHK+D1-5N rescued animals. (C) Quantification of the evoked EPSC amplitude and charge transfer from the same genotypes as in B. The dashed lines represent the level of wild-type UNC-13L rescue. (D) Representative miniature EPSC (mEPSC) traces (recorded at 0 mM and 1 mM Ca2+) from the indicated genotypes. (E and F) Quantification of the frequency and amplitude of the mEPSCs from the same genotypes as in D. (G) Representative miniature inhibitory postsynaptic current (mIPSC) traces (recorded at 0 mM and 1 mM Ca2+) from the indicated genotypes. (H and I) Quantification of the frequency and amplitude of the mIPSCs from the same genotypes as in G. Data are mean ± SEM (**p<0.01, ***p<0.001 when compared to UNC-13L rescue; n.s., nonsignificant when compared to UNC-13L rescue; one-way ANOVA).
Figure 3
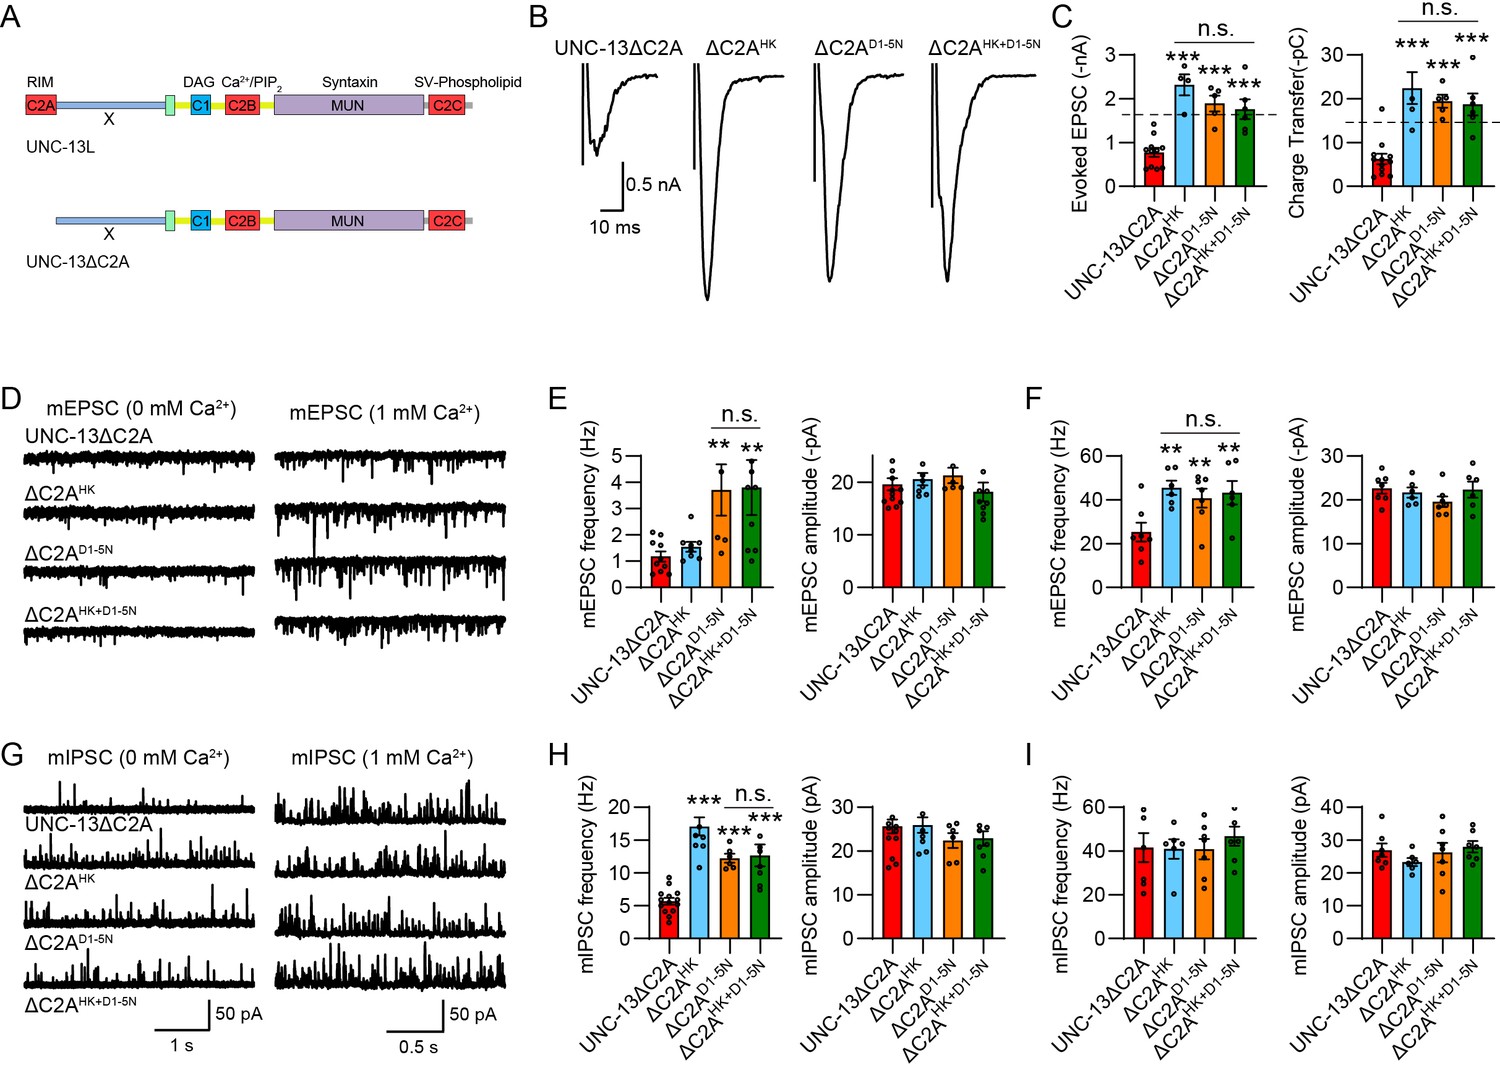
The C2A domain regulates the functions of C1 and C2B.
(A) Domain structure of UNC-13L and UNC-13LΔC2A. (B) Example traces of stimulus-evoked excitatory postsynaptic currents (EPSCs) from UNC-13ΔC2A, ΔC2AHK, ΔC2AD1-5N, and ΔC2AHK+D1-5N rescued animals. (C) Quantification of the evoked EPSC amplitude and charge transfer from the same genotypes as in B. The dashed lines represent the level of wild-type UNC-13L rescue. (D) Representative miniature EPSC (mEPSC) traces (recorded at 0 mM and 1 mM Ca2+) from the indicated genotypes. (E and F) Quantification of the frequency and amplitude of the mEPSCs from the same genotypes as in (D). (G) Representative miniature inhibitory postsynaptic current (mIPSC) traces (recorded at 0 mM and 1 mM Ca2+) from the indicated genotypes. (H and I) Quantification of the frequency and amplitude of the mIPSCs from the same genotypes as in G. Data are mean ± SEM (**p<0.01, ***p<0.001 when compared to UNC-13ΔC2A rescue; n.s., nonsignificant; one-way ANOVA).
Figure 4
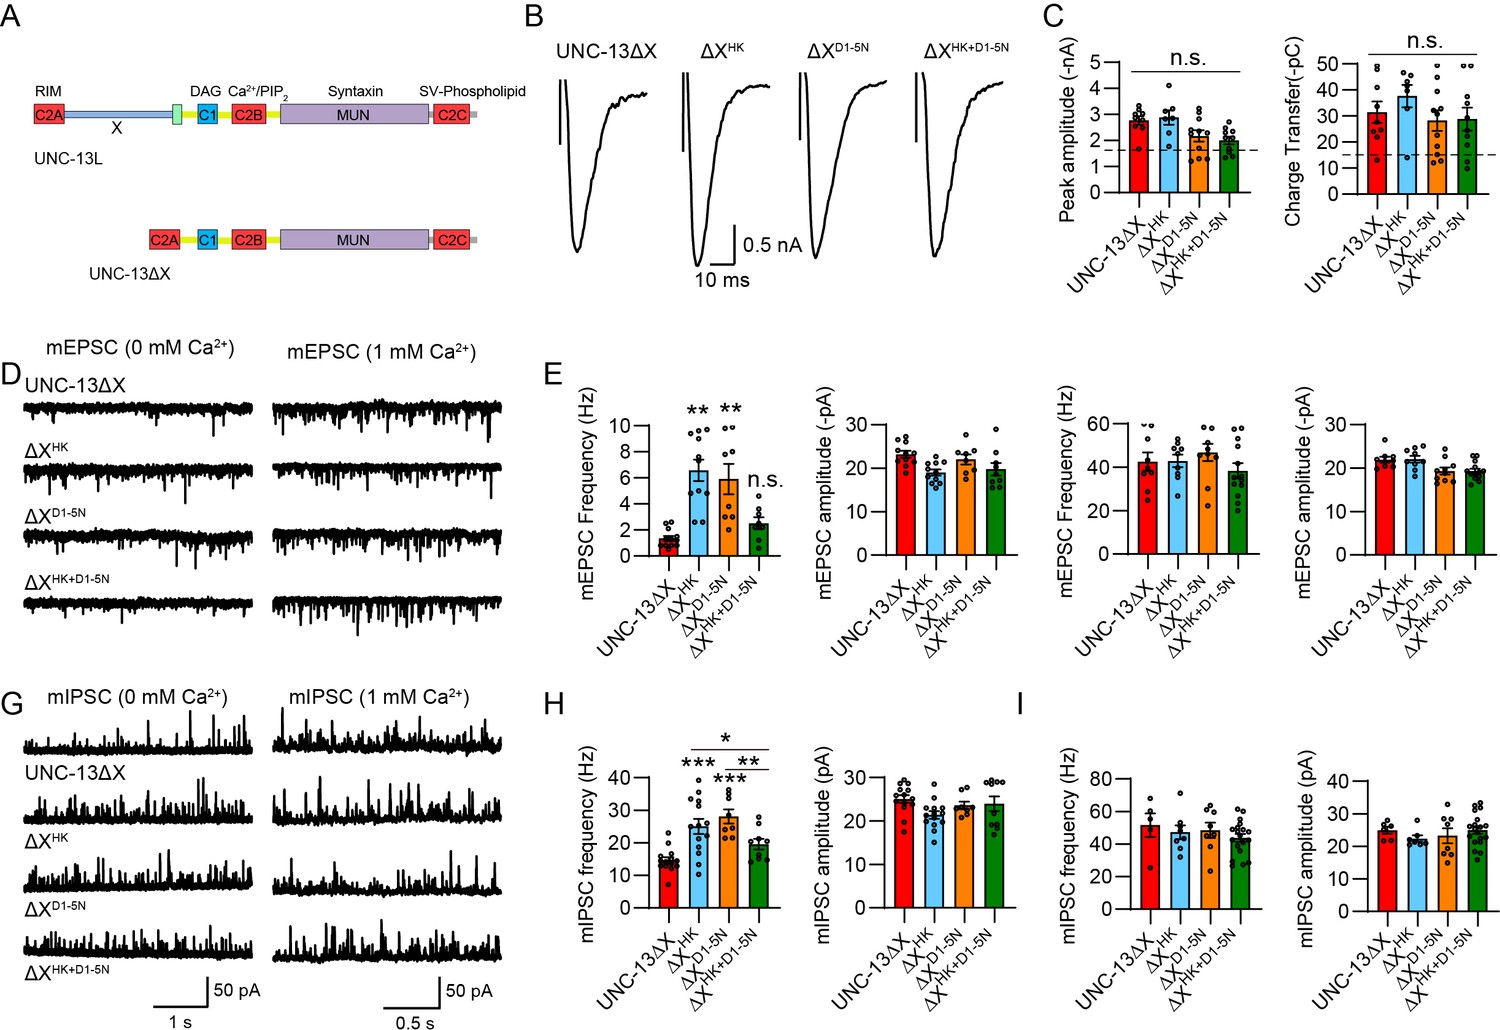
The X domain regulates the functions of C1 and C2B.
(A) Domain structure of UNC-13L and UNC-13ΔX. (B) Example traces of stimulus-evoked excitatory postsynaptic currents (EPSCs) from UNC-13ΔX, ΔXHK, ΔXD1-5N, and ΔXHK+D1-5N rescued animals. (C) Quantification of the evoked EPSC amplitude and charge transfer from the same genotypes as in B. The dashed lines represent the level of wild-type UNC-13L rescue. Data are mean ± SEM (n.s., nonsignificant; one-way ANOVA). (D) Representative miniature EPSC (mEPSC) traces (recorded at 0 mM and 1 mM Ca2+) from the indicated genotypes. (E and F) Quantification of the frequency and amplitude of the mEPSCs from the same genotypes as in D. Data are mean ± SEM (**p<0.01 when compared to UNC-13ΔX rescue; n.s., nonsignificant when compared to UNC-13ΔX rescue; one-way ANOVA). (G) Representative miniature inhibitory postsynaptic current (mIPSC) traces (recorded at 0 mM and 1 mM Ca2+) from the indicated genotypes. (H and I) Quantification of the frequency and amplitude of the mIPSCs from the same genotypes as in G. Data are mean ± SEM (*p<0.05, **p<0.01, ***p<0.001 when compared to UNC-13ΔX rescue; one-way ANOVA).
Figure 5 with 1 supplement
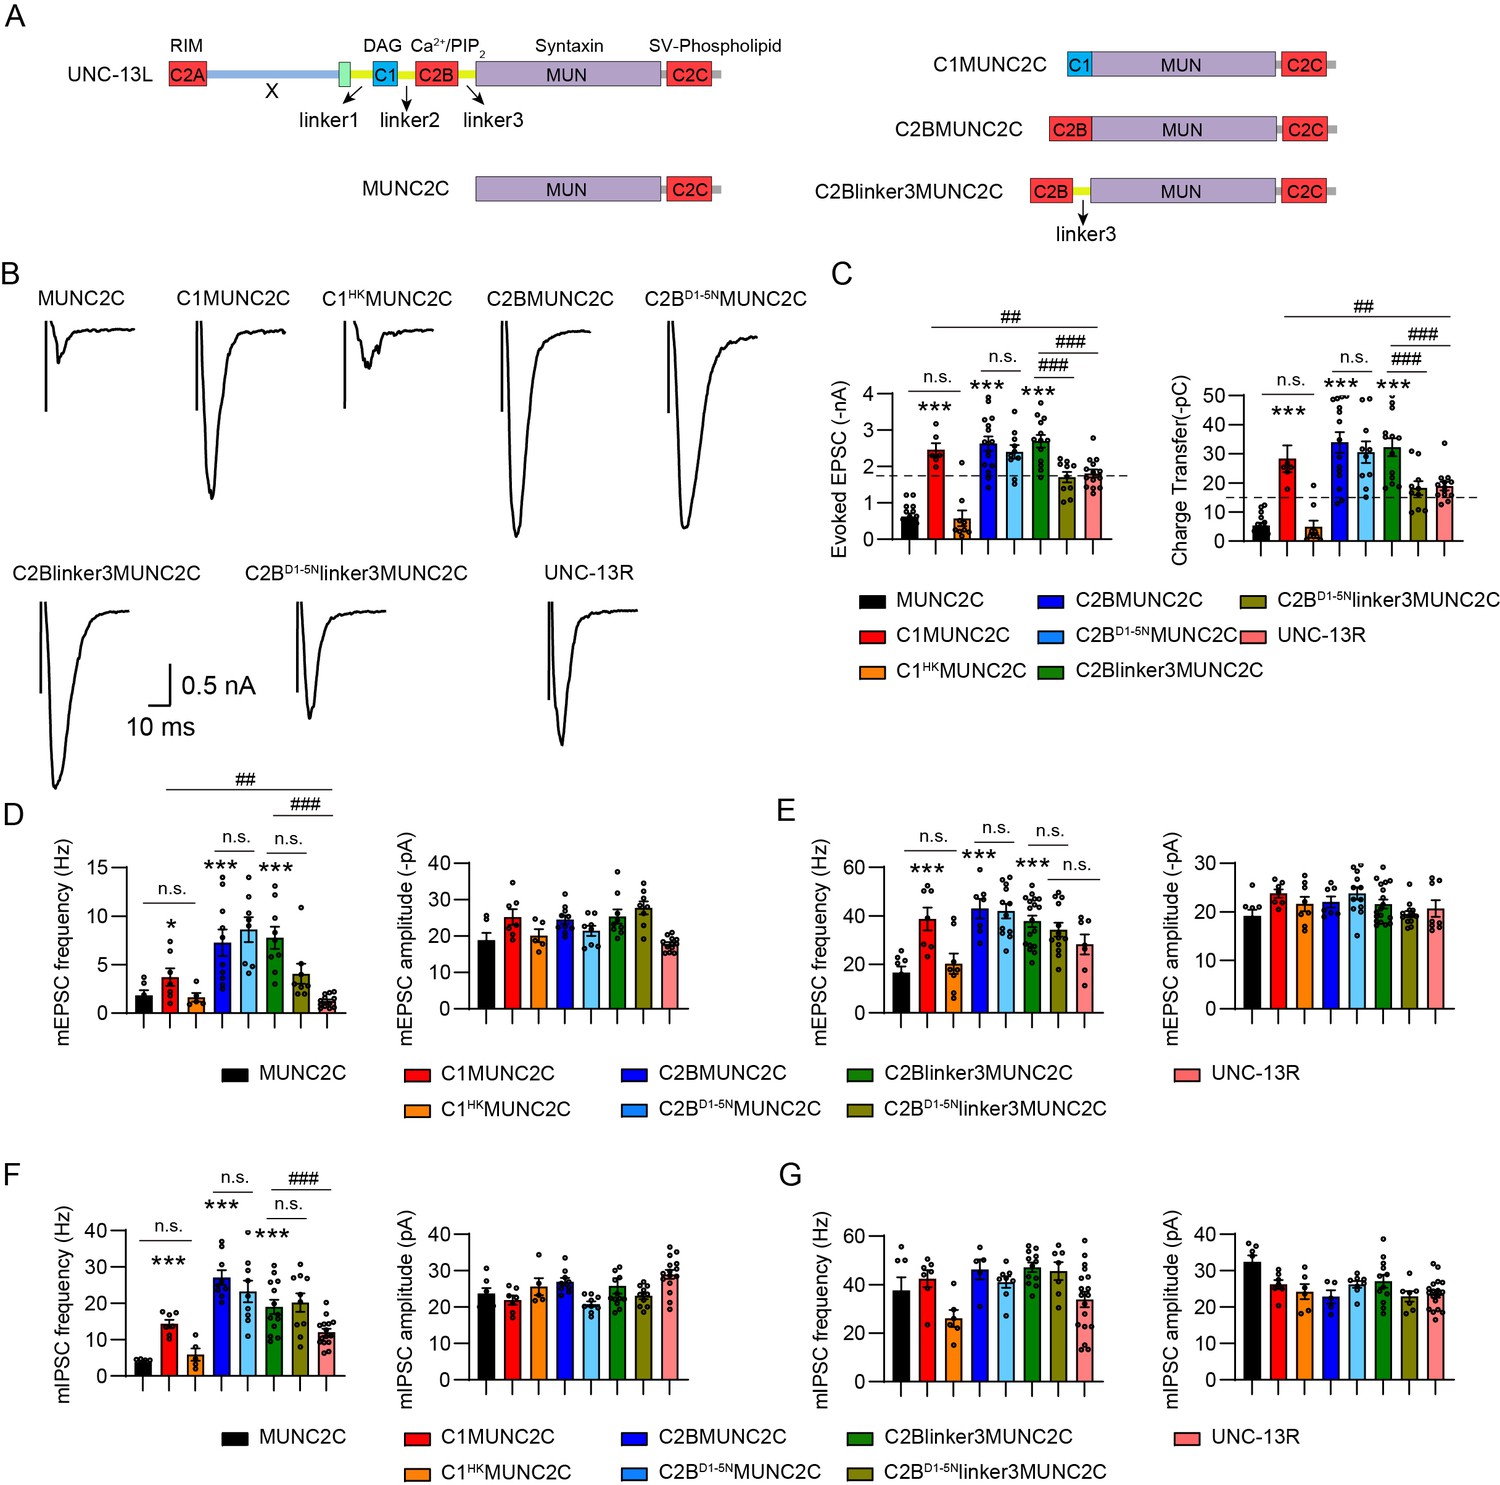
Individual C1 and C2B promotes synaptic vesicle (SV) release in a gain-of-function manner.
(A) Cartoons depicting UNC-13L, MUNC2C, C1MUNC2C, C2BMUNC2C, and C2Blinker3MUNC2C. (B) Example traces of stimulus-evoked excitatory postsynaptic currents (EPSCs) from the indicated genotypes. (C) Quantification of the evoked EPSC amplitude and charge transfer from the same genotypes as in B. The dashed lines represent the level of wild-type UNC-13L rescue. (D and E) Averaged miniature EPSC (mEPSC) frequency and amplitude (recorded at 0 mM and 1 mM Ca2+) from the same genotypes as in B. (F and G) Quantification of the miniature inhibitory postsynaptic current (mIPSC) frequency and amplitude (recorded at 0 mM and 1 mM Ca2+) from the same genotypes as in B. Data are mean ± SEM (*p<0.05, ***p<0.001 when compared to MUNC2C rescue; ##p<0.01, ###p<0.001; n.s., nonsignificant; one-way ANOVA).
Figure 5—figure supplement 1
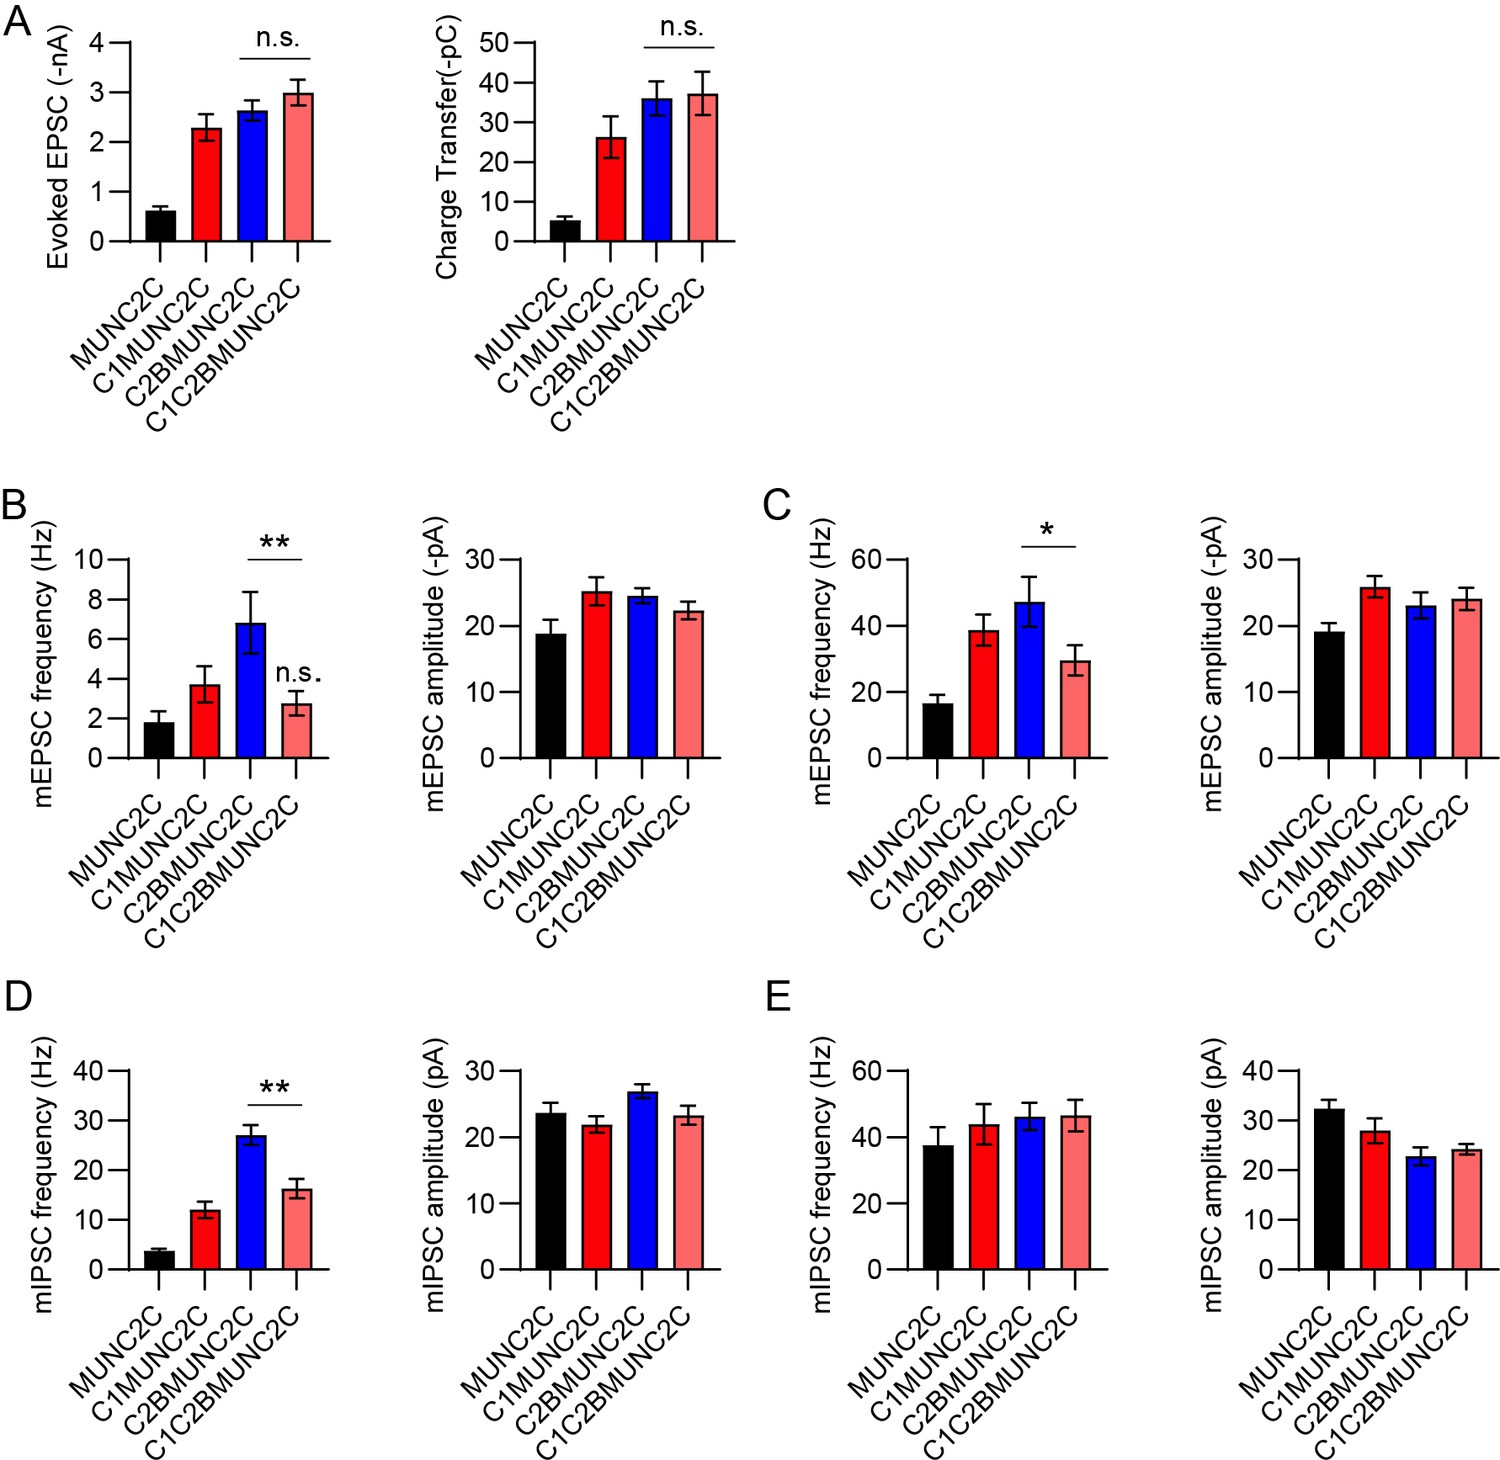
The mutual inhibition between C1 and C2B requires the linkers.
(A) Averaged evoked excitatory postsynaptic current (EPSC) amplitude and charge transfer from unc-13 mutants rescued with MUNC2C, C1MUNC2C, C2BMUNC2C, and C1C2BMUNC2C. (B, C) Quantification of the miniature EPSC (mEPSC) frequency and amplitude in 0 mM Ca2+ and 1 mM Ca2+, respectively. (D, E) Summary of the miniature inhibitory postsynaptic current (mIPSC) frequency and amplitude in 0 mM Ca2+ and 1 mM Ca2+, respectively. Data are mean ± SEM (*p<0.05, **p<0.01; n.s., nonsignificant; one-way ANOVA).
Figure 6 with 2 supplements
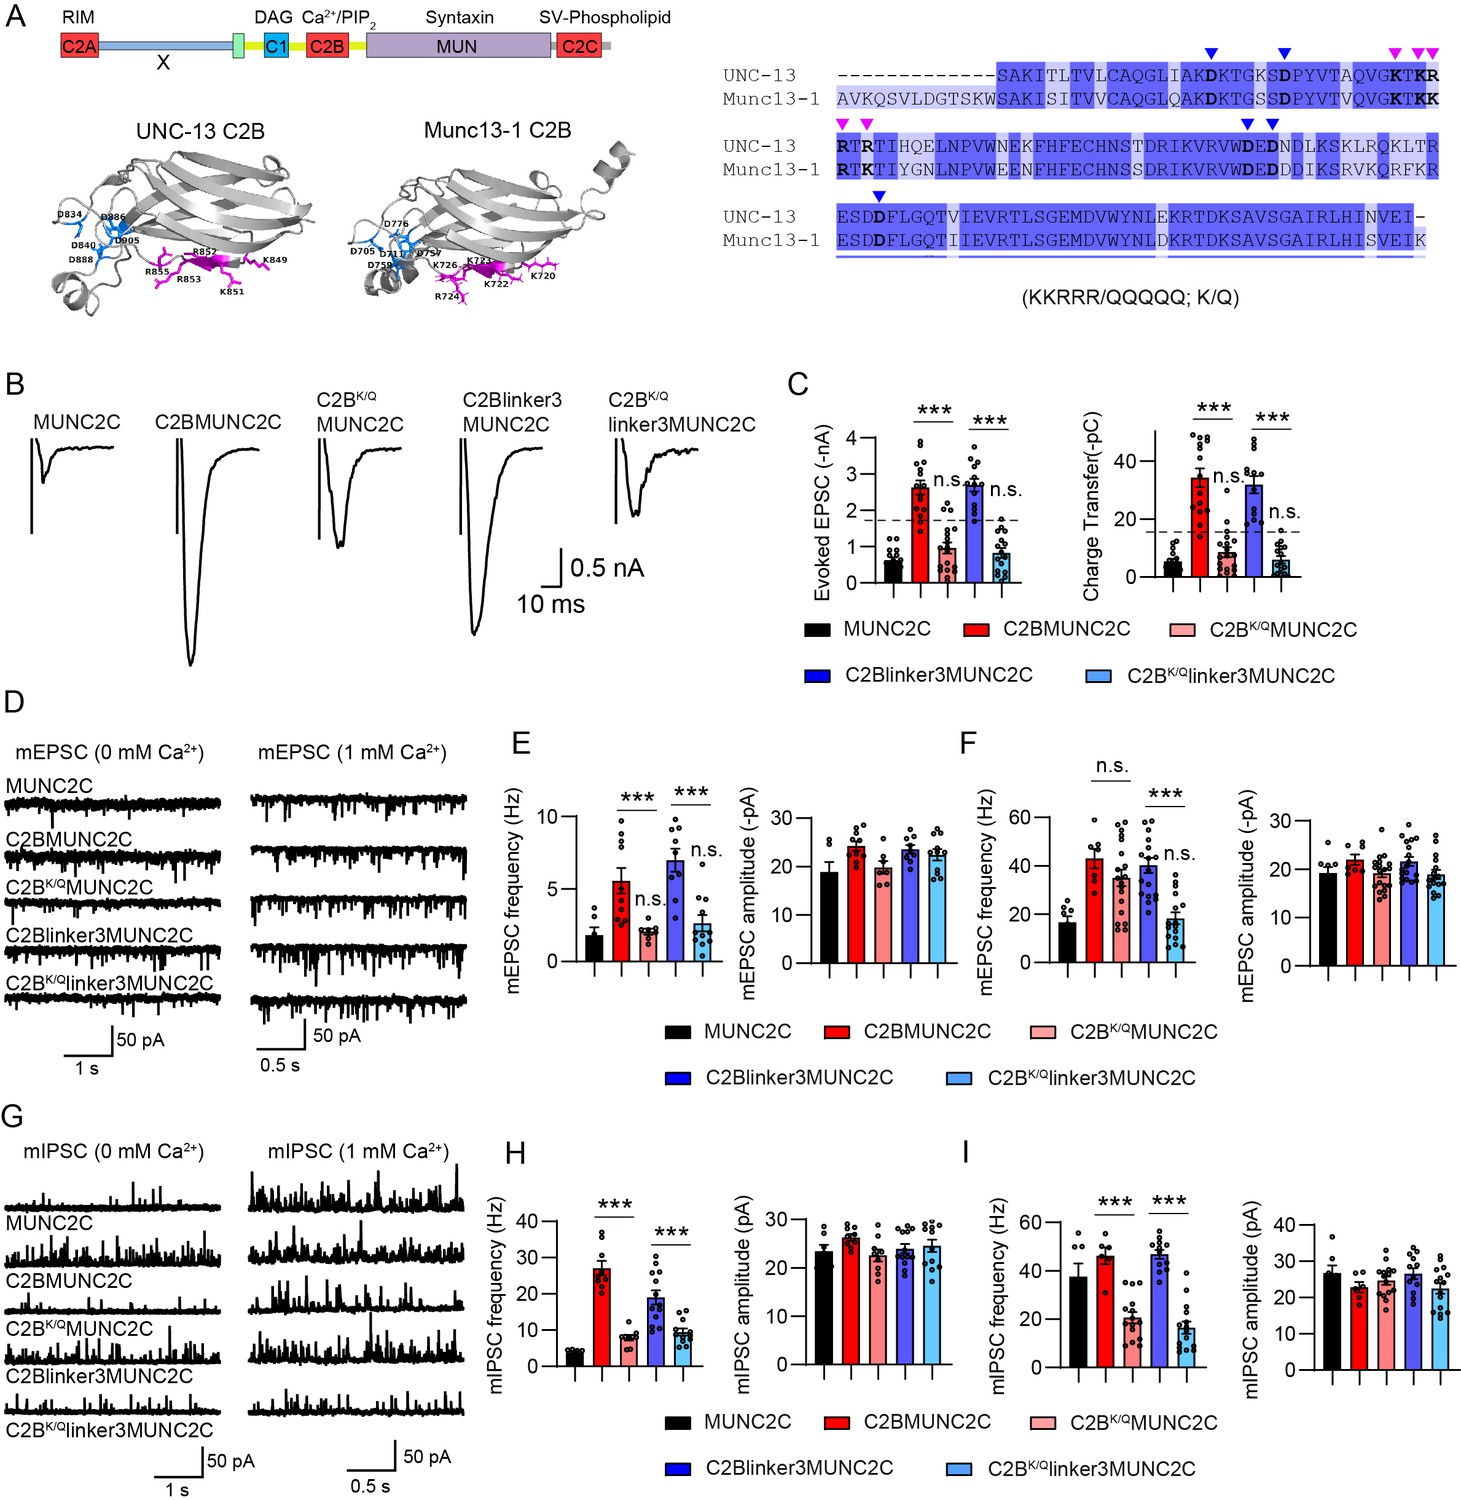
The polybasic motif is critical for the C2B function.
(A) Left, crystal structures of UNC-13 C2B (EBI AlphaFold database, UniProt ID: P27715) and Munc13-1 C2B (from PDB: 7T7V). The polybasic residues in each C2B are labeled in purple, and the five Ca2+-binding sites (aspartates) are labeled in blue. Right, sequence comparison of UNC-13 C2B and Munc13-1 C2B. The polybasic residues are indicated by purple arrowheads, and the five aspartates are indicated by blue arrowheads. (B) Example traces of stimulus-evoked excitatory postsynaptic currents (EPSCs) from MUNC2C, C2BMUNC2C, C2BKQMUNC2C, C2Blinker3MUNC2C, and C2BKQlinker3MUNC2C rescued animals. (C) Quantification of the evoked EPSC amplitude and charge transfer from the same genotypes as in B. The dashed lines represent the level of wild-type UNC-13L rescue. (D) Representative miniature EPSC (mEPSC) traces (recorded at 0 mM and 1 mM Ca2+) from the indicated genotypes. The dashed lines represent the level of wild-type UNC-13L rescue. (E and F) Quantification of the frequency and amplitude of the mEPSCs. (G) Representative miniature inhibitory postsynaptic current (mIPSC) traces (recorded at 0 mM and 1 mM Ca2+) from the indicated genotypes in B. (H and I) Quantification of the frequency and amplitude of the mIPSCs. Data are mean ± SEM (***p<0.001; n.s., nonsignificant when compared to MUNC2C; one-way ANOVA).
Figure 6—figure supplement 1
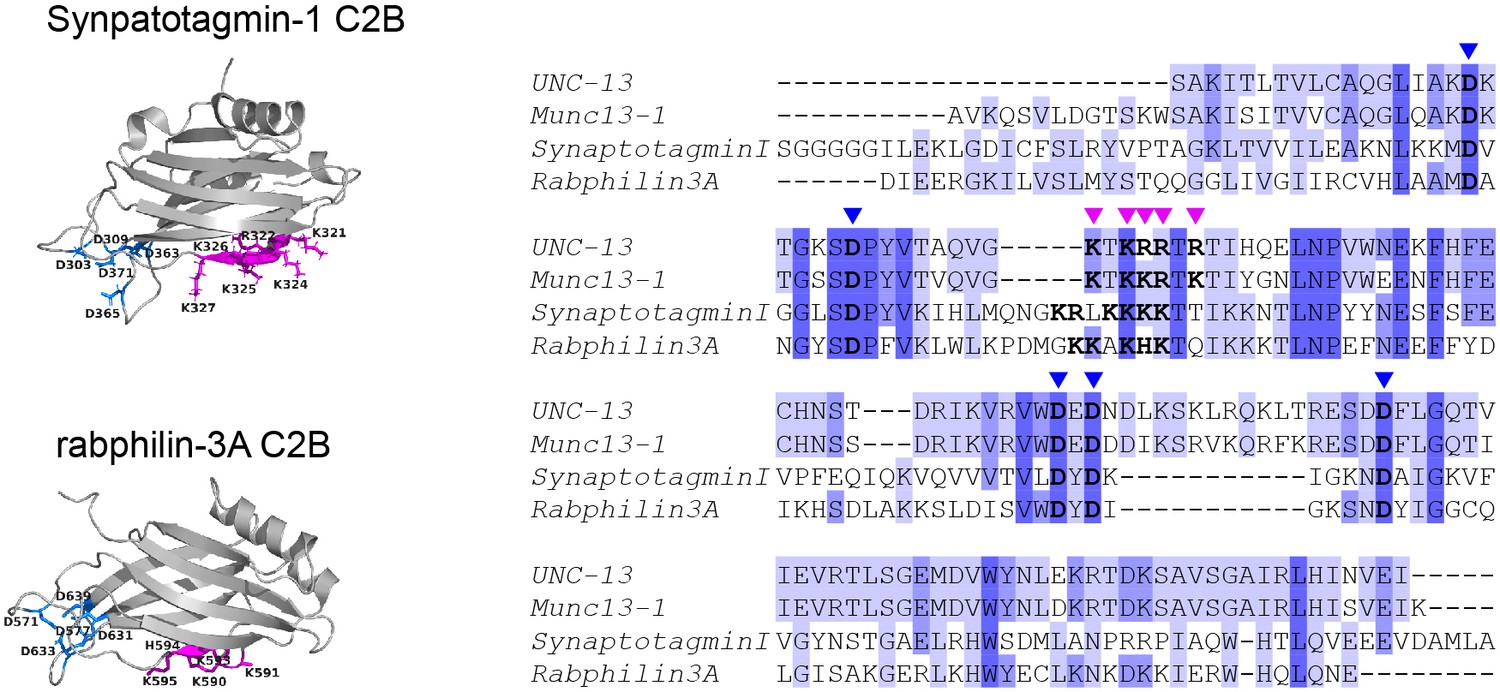
The polybasic motifs in synaptotagmin-1 and rabphilin-3A.
Left, crystal structures of rat synaptotagmin-1 C2B (from PDB: 1TJM) and rat rabphilin-3A C2B (from PDB: 5LO8). The polybasic residues in each C2B are labeled in purple, and the five Ca2+-binding sites (aspartates) are labeled in blue. Right, sequence alignment of the C2B domains in UNC-13, Munc13-1, synaptotagmin-1, and rabphilin-3A. The polybasic residues are indicated by purple arrowheads, and the five aspartates are indicated by blue arrowheads.
Figure 6—figure supplement 2
The polybasic mutations in UNC-13L do not affect synaptic vesicle (SV) release.
(A) Example traces of stimulus-evoked excitatory postsynaptic currents (EPSCs) from unc-13 mutants rescued with wild-type UNC-13L and UNC-13LKQ. (B) Quantification of the evoked EPSC amplitude and charge transfer. (C, F) Representative miniature EPSC (mEPSC) and miniature inhibitory postsynaptic current (mIPSC) traces (recorded at 0 mM and 1 mM Ca2+) from the same genotypes in A. (D, E, G, H) Quantification of the frequency and amplitude of the mEPSCs and mIPSCs in C and F (D and G, 0 mM Ca2+; E and H, 1 mM Ca2+). Data are mean ± SEM (one-way ANOVA).
Figure 7 with 1 supplement
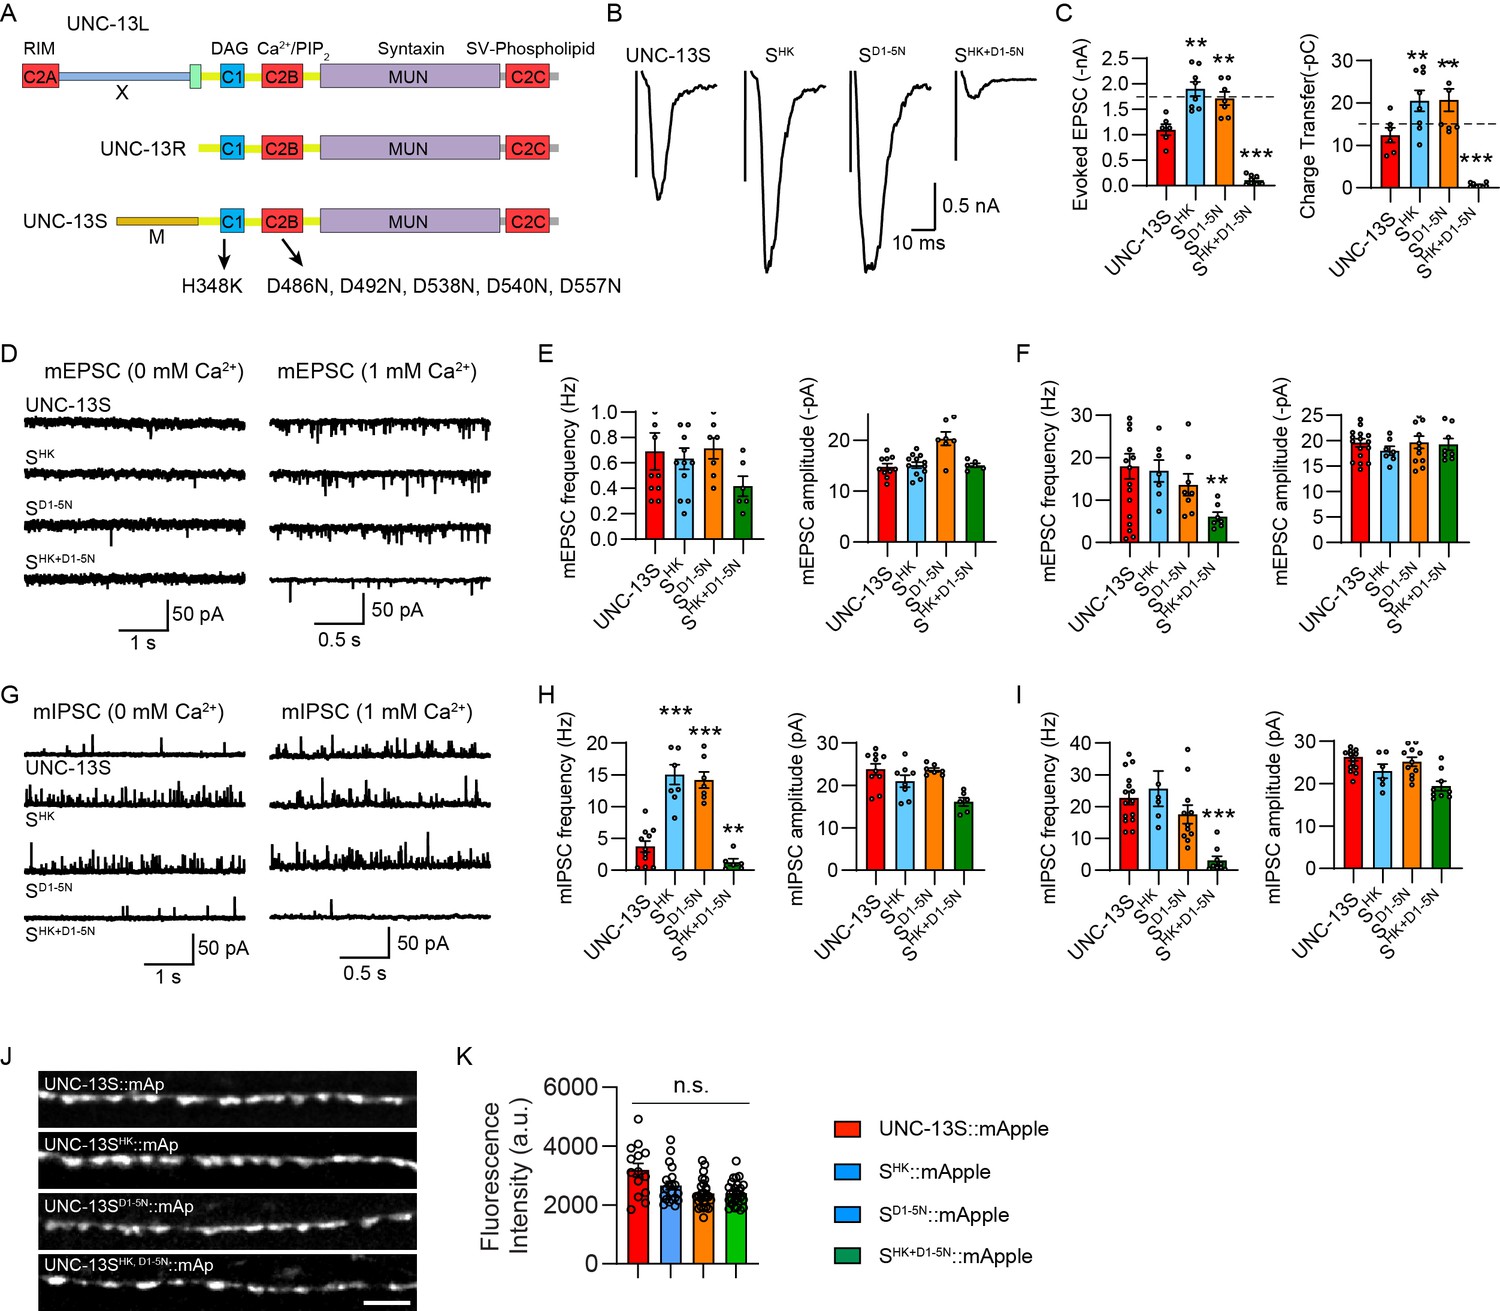
Disrupting C1 and C2B membrane interaction simultaneously results in the inactivation of UNC-13S.
(A) Cartoon depicting the HK and DN mutations in UNC-13L, UNC-13R, and UNC-13S. (B) Example traces of stimulus-evoked excitatory postsynaptic currents (EPSCs) from UNC-13S, SHK, SD1-5N, SHK+D1-5N rescued animals. (C) Averaged evoked EPSC amplitude and charge transfer. The dashed lines represent the level of wild-type UNC-13L rescue. (D) Representative miniature EPSC (mEPSC) traces (recorded at 0 mM and 1 mM Ca2+) from the indicated genotypes in B. (E and F) Quantification of the frequency and amplitude of the mEPSCs. (G) Representative miniature inhibitory postsynaptic current (mIPSC) traces (recorded at 0 mM and 1 mM Ca2+) from the indicated genotypes in B. (H and I) Quantification of the frequency and amplitude of the mIPSCs. (J) Representative confocal z stack images for mApple-tagged UNC-13S, SHK, SDN, and SHK+DN (all driven by the unc-129 promoter). Scale bar, 5 μm. (K) Quantification of the fluorescence intensity. Data are mean ± SEM (**p<0.01, ***p<0.001 when compared to UNC-13S rescue; n.s., nonsignificant; one-way ANOVA).
Figure 7—figure supplement 1

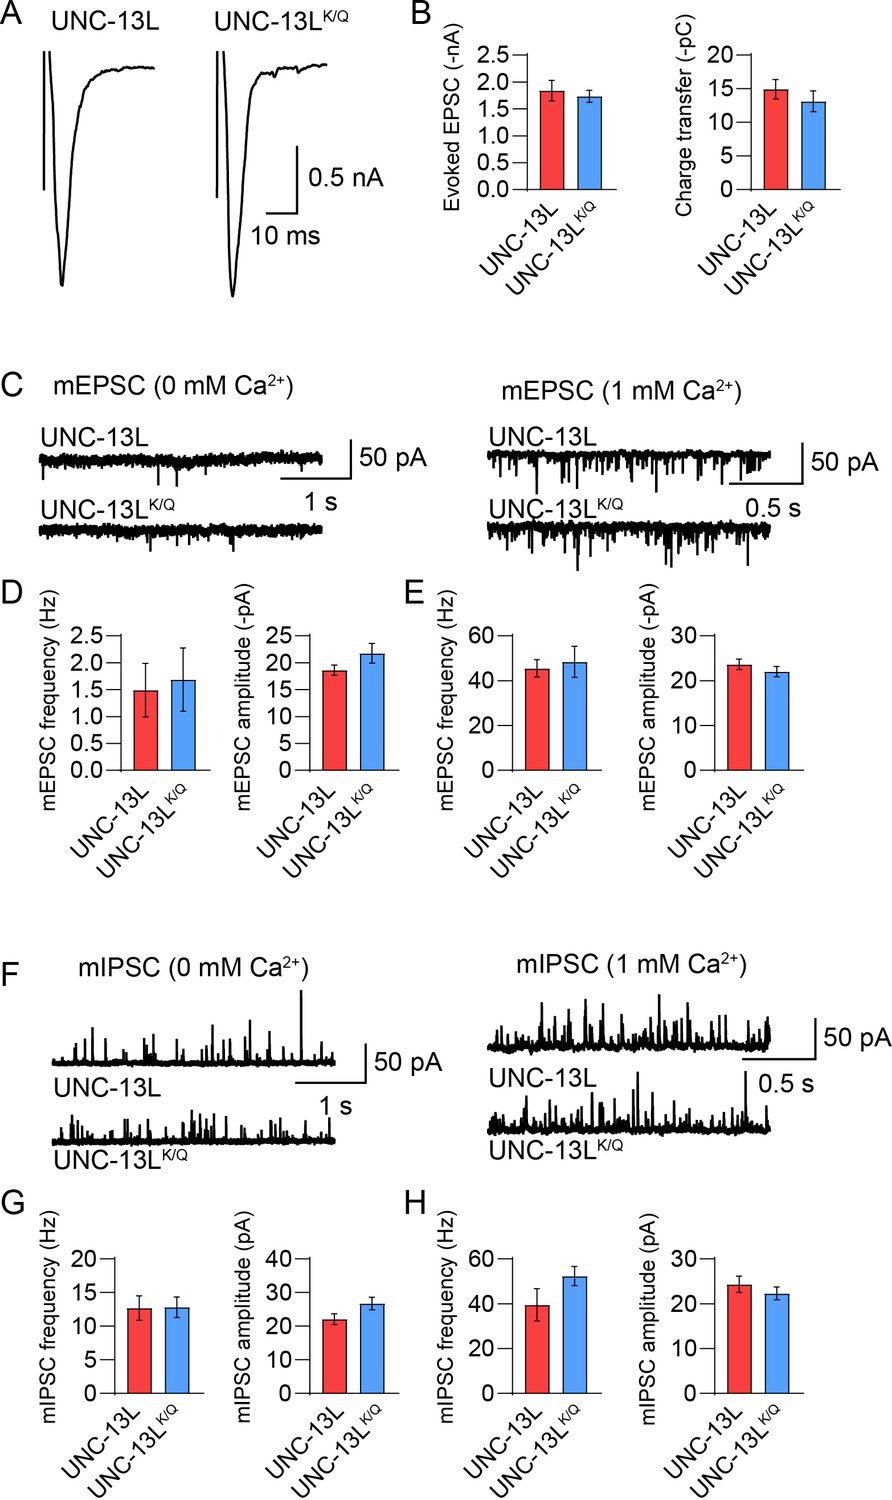
The HK and DN mutations do not alter release kinetics in UNC-13S and UNC-13R.
(A, B) Although evoked excitatory postsynaptic currents (EPSCs) were enhanced in UNC-13S and UNC-13R by the HK and DN mutations, the release kinetics (10–90% risetime and decay) remains unchanged. Data are mean ± SEM (**p<0.01 when compared to wild-type; n.s., nonsignificant; one-way ANOVA).
Figure 8
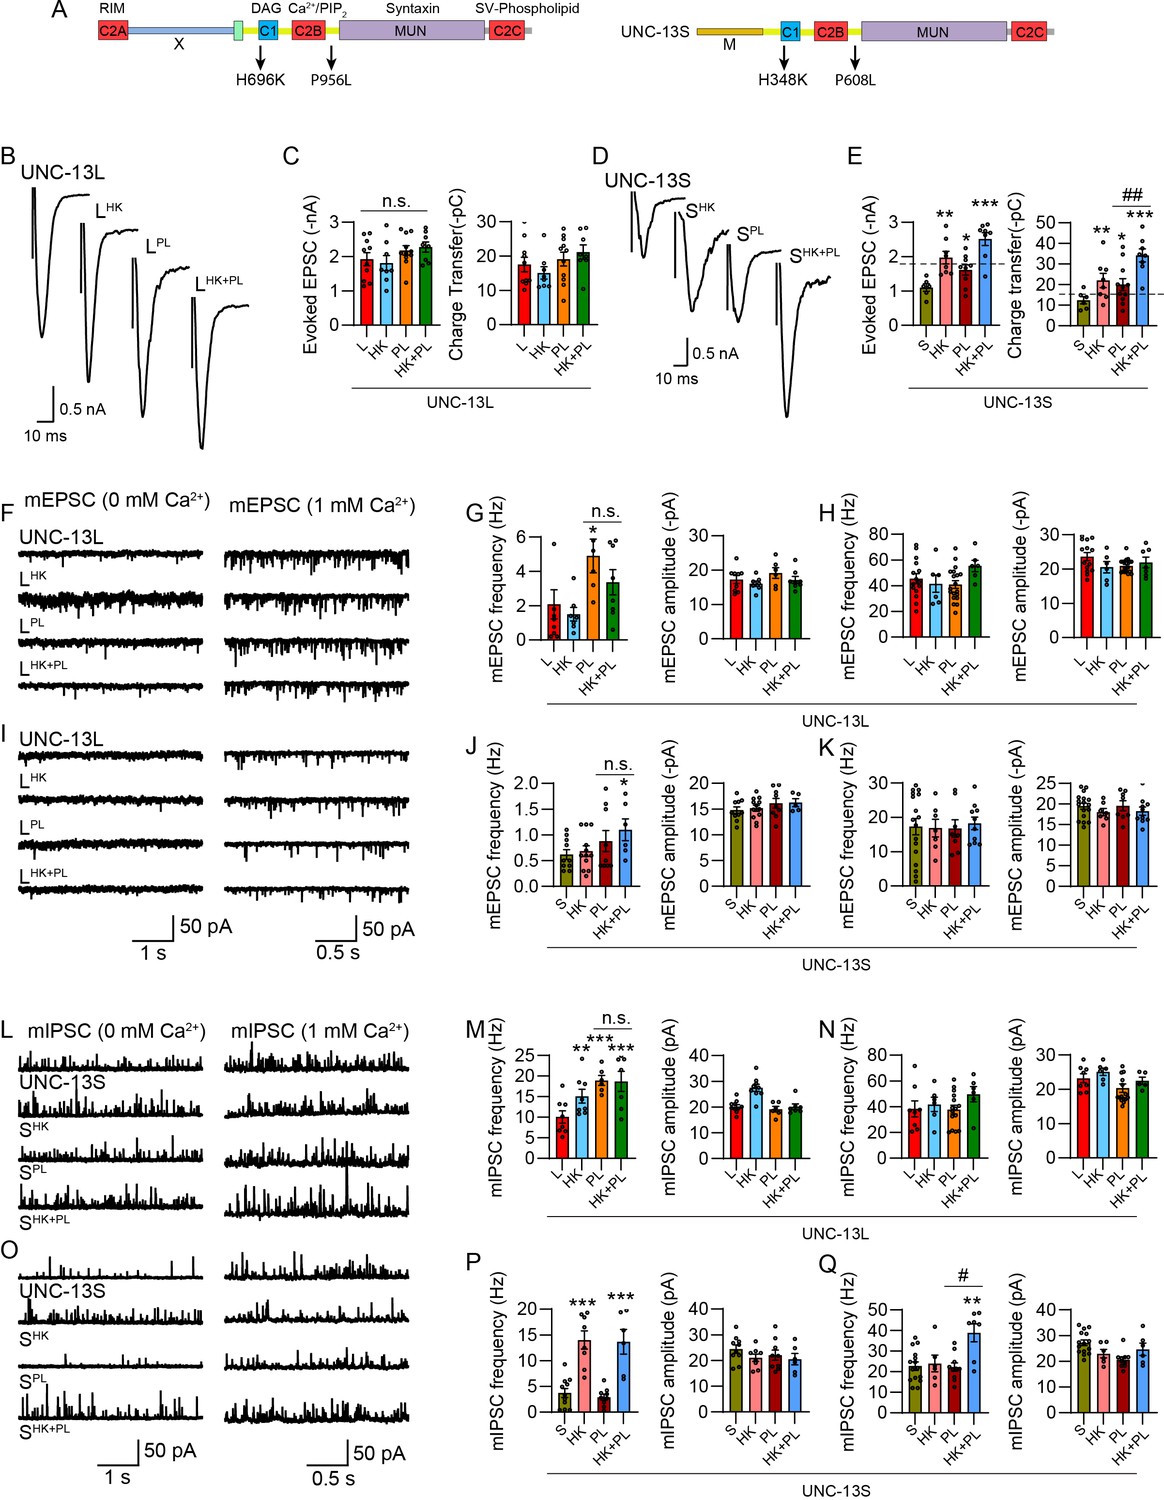
The concurrent mutations of HK and PL in UNC-13L and UNC-13S do not decrease synaptic vesicle (SV) release.
(A) Positions of the PL mutation in UNC-13L and UNC-13S. (B, D) Example traces of stimulus-evoked excitatory postsynaptic currents (EPSCs) from unc-13 mutants rescued with wild-type UNC-13L and S, and UNC-13L or UNC-13S carrying HK, PL, and HK+PL mutations. (C, E) Quantification of the evoked EPSC amplitude and charge transfer from the same genotypes as in B and D. The dashed lines represent the level of wild-type UNC-13L rescue. (F, I) Representative miniature EPSC (mEPSC) traces (recorded at 0 mM and 1 mM Ca2+) from the same genotypes in B and D. (G–K) Quantification of the frequency and amplitude of the mEPSCs (G and J, 0 mM Ca2+; H and K, 1 mM Ca2+). (L, O) Representative miniature inhibitory postsynaptic current (mIPSC) traces (recorded at 0 mM and 1 mM Ca2+) from the indicated genotypes. (M–Q) Averaged mIPSC frequency and amplitude in 0 mM Ca2+ (M, P) and 0 mM Ca2+ (N, Q). Data are mean ± SEM (*p<0.05, **p<0.01, ***p<0.001 when compared to UNC-13L or UNC-13S rescue; #p<0.05, ##p<0.01; n.s., nonsignificant; one-way ANOVA).
Additional files
-
Supplementary file 1
Summary of all electrophysiology data in this study.
The electrophysiology data from all strains used in this study are shown in the table (by mean ± SEM).
- https://cdn.elifesciences.org/articles/105199/elife-105199-supp1-v1.xlsx
-
MDAR checklist
- https://cdn.elifesciences.org/articles/105199/elife-105199-mdarchecklist1-v1.pdf
Download links
A two-part list of links to download the article, or parts of the article, in various formats.
Downloads (link to download the article as PDF)
Open citations (links to open the citations from this article in various online reference manager services)
Cite this article (links to download the citations from this article in formats compatible with various reference manager tools)
Mechanisms that regulate the C1-C2B mutual inhibition control functional switch of UNC-13
eLife 14:RP105199.
https://doi.org/10.7554/eLife.105199.3


