Transcriptional activator TAp63 is upregulated in muscular atrophy during ALS and induces the pro-atrophic ubiquitin ligase Trim63
- Institut national de la santé et de la recherche médicale, France
- Strasbourg University, France
- Sanford Burnham Medical Research Institute, United States
- Institut national de la santé et de la recherche médicale, Laboratoire SMN, France
Figures
Figure 1 with 2 supplements
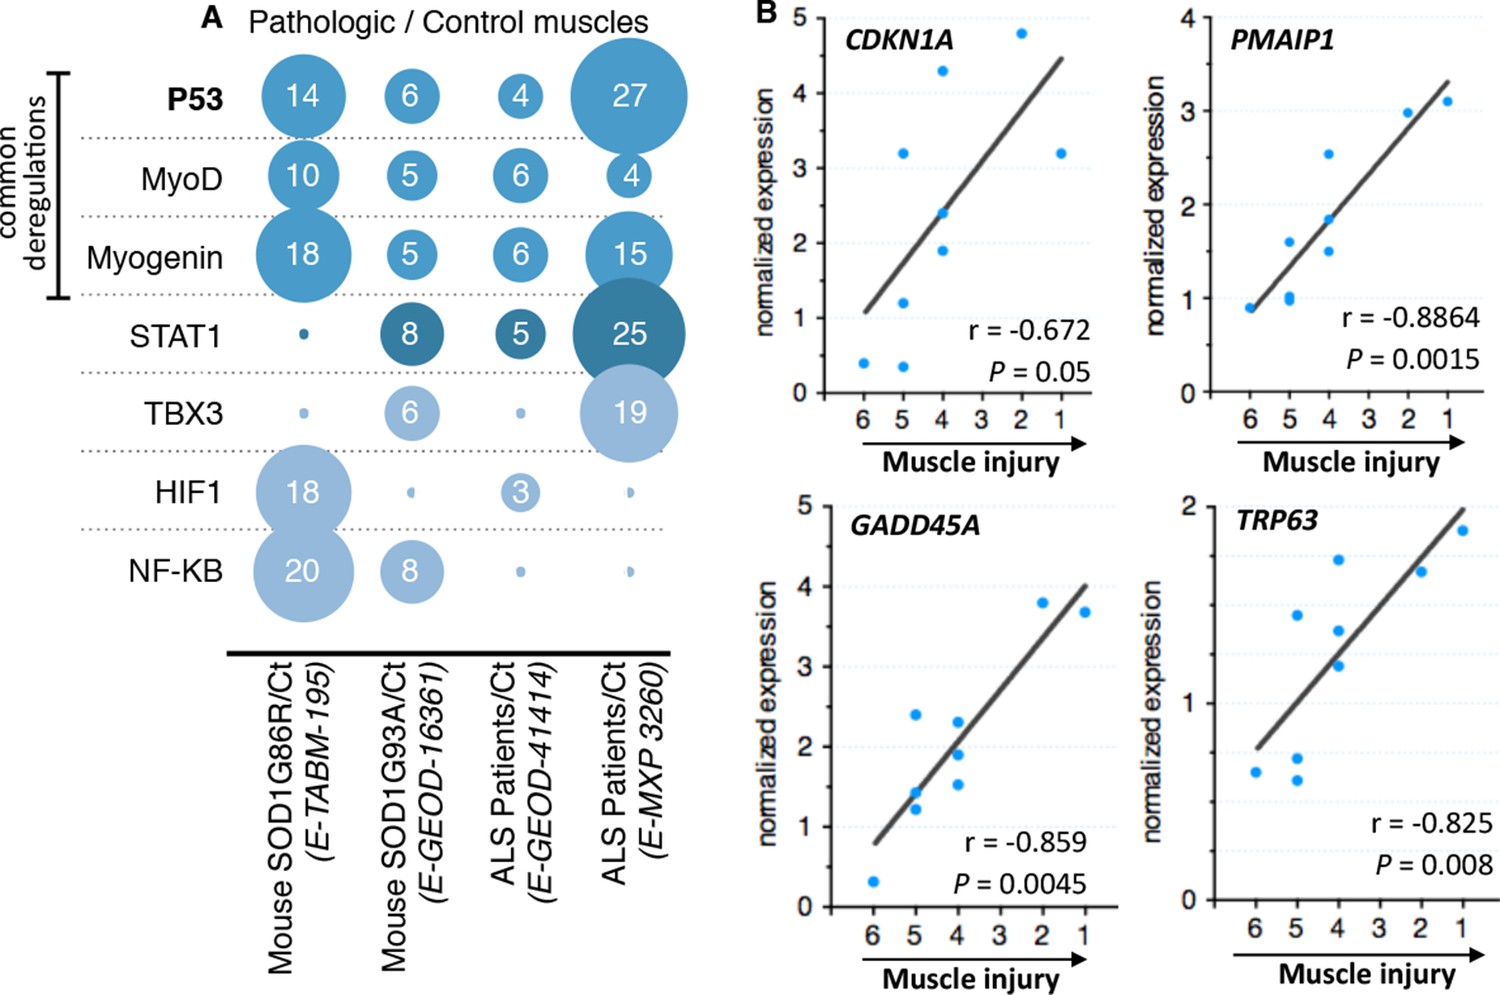
Microarray meta-analysis highlights links between the deregulation of p53 family related genes and ALS.
(A) Representation of the number of deregulated target genes of the indicated transcription factors. Data were obtained using the indicated datasets from the Array Express database (EMBL-EBI) and quantification was carried out from AltAnalyze software analyses on transcription factor databanks (complete data in Supplementary file 2A,B,C,D. (B) mRNA levels from nine ALS patient deltoid muscles as by DNA microarray were correlated with the intensity of muscle injury. Expression data were generated using a murine gene profiling database deposited at ebi.ac.uk/arrayexpress (accession number E-MEXP-3260). In the corresponding study, muscle injury was estimated according to a composite score combining manual testing of strength of shoulder abductors and the degree of myofiber atrophy. This score ranges from 6 (normal strength and very low level of atrophy) to 1 (total paralysis and high level of atrophy). Each point represents an individual. Correlation coefficients (r) and p-values were determined by Spearman correlation test.
Figure 1—figure supplement 1
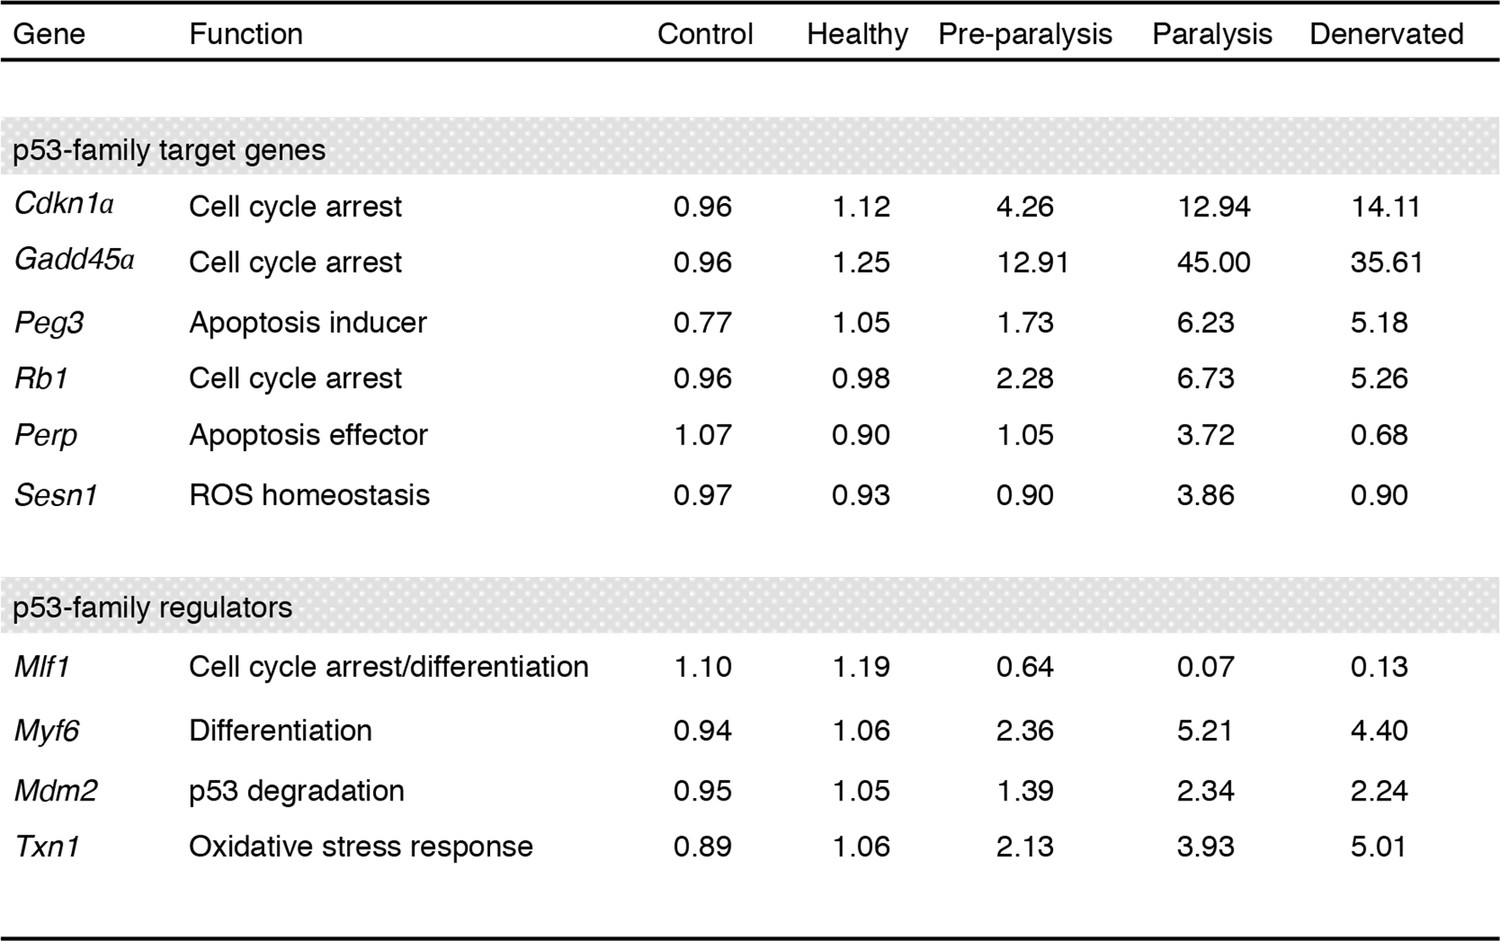
Regulation of p53-family related genes in skeletal muscle of SOD1(G86R) and denervated mice.
Data were generated using a gene expression database deposited at ebi.ac.uk/arrayexpress (accession number E-TABM-195). Gastrocnemius muscle samples from male SOD1(G86R) mice with no symptoms (Healthy, at 75 days of age), altered hind limb extension reflexes (Preparalysis, at 90 days of age), and at the onset of hind limb paralysis (symptomatic mice, at about 105 days of age) were analyzed by DNA microarray. Denervated muscles were obtained from wild-type mice after 7 days of sciatic nerve axotomy. Non-transgenic male littermates served as controls. 3–4 animals were pooled per group, and each condition was done in duplicate. Values are expressed as means of normalized expression levels.
Figure 1—figure supplement 2
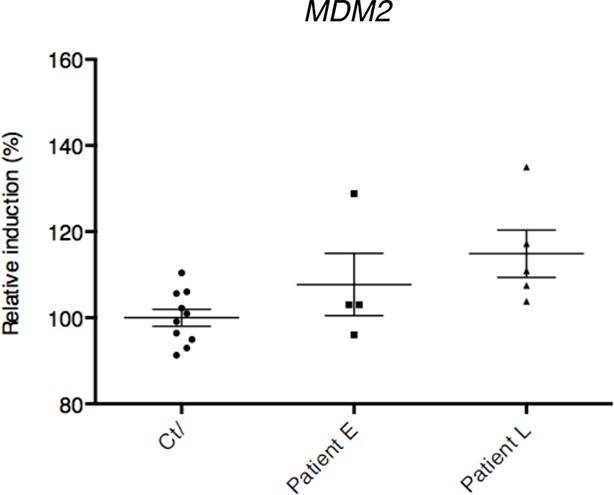
mRNA levels from control and ALS patient deltoid muscles as by DNA microarray were correlated with the intensity of muscle injury.
Expression data were generated using a murine gene profiling database deposited at ebi.ac.uk/arrayexpress (accession number E-MEXP-3260). In the corresponding study, muscle injury was estimated according to a composite score combining manual testing of strength of shoulder abductors and the degree of myofiber atrophy. This score ranges from 6 (normal strength and very low level of atrophy) to 1 (total paralysis and high level of atrophy). Each point represents an individual. In this experiment, patients with high level of atrophy (L, score 1–3) and low degree of atrophy (E, score 4–6) were grouped.
Figure 2 with 1 supplement
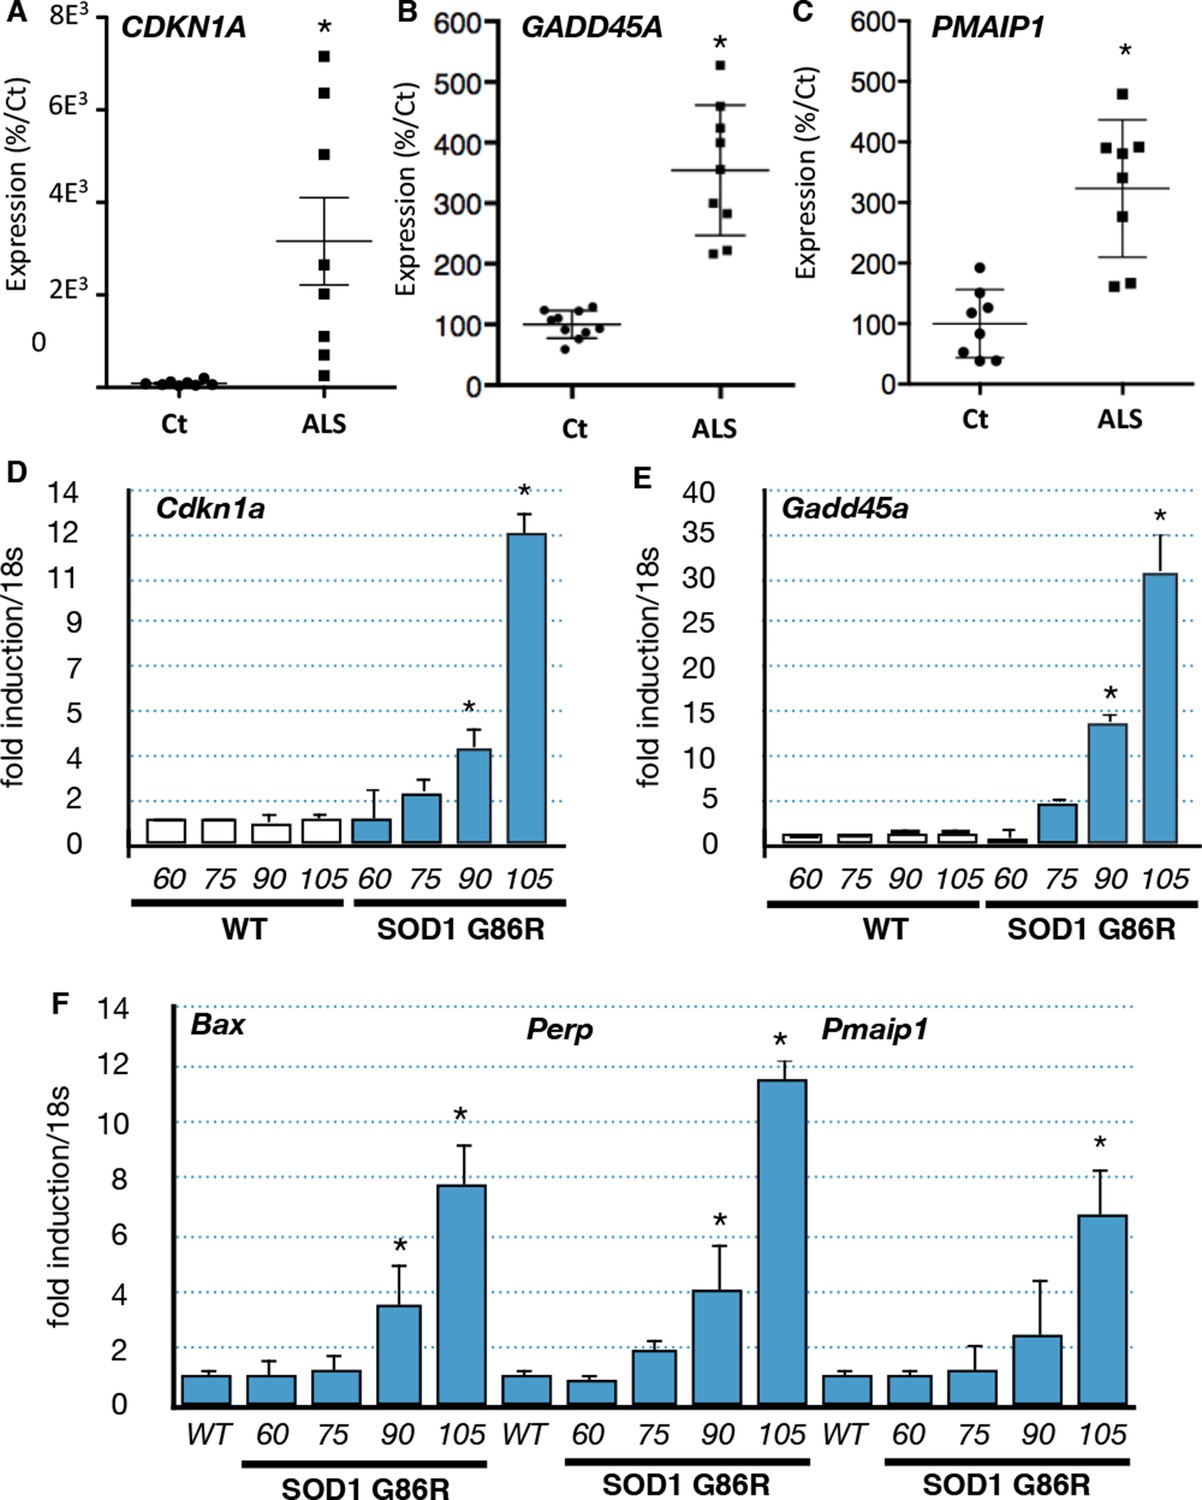
p53-family target gene expression in muscles from ALS patients and in an ALS mouse model correlates with disease intensity.
(A–C) RNA from muscle biopsies of control and ALS patients (n = 8, Neuromuscular Unit [BioBank of Skeletal Muscle, Nerve Tissue, DNA and cell lines]) was extracted and analyzed by RT-qPCR. Absolute levels are normalized against the average of the control group. (D–F) p53 family target genes mRNA levels were assayed in SOD1(G86R) mouse gastrocnemius muscle by RT-qPCR. Graphs are means of fold induction versus 60 days-old WT and of matching age (60, 75, 90, 105-days-old, n = 6) and experimental condition (wild-type, or SOD1(G86R)). *p<0.01 compared to control, as calculated by a one-way ANOVA test followed by a Tukey post-test.
Figure 2—figure supplement 1
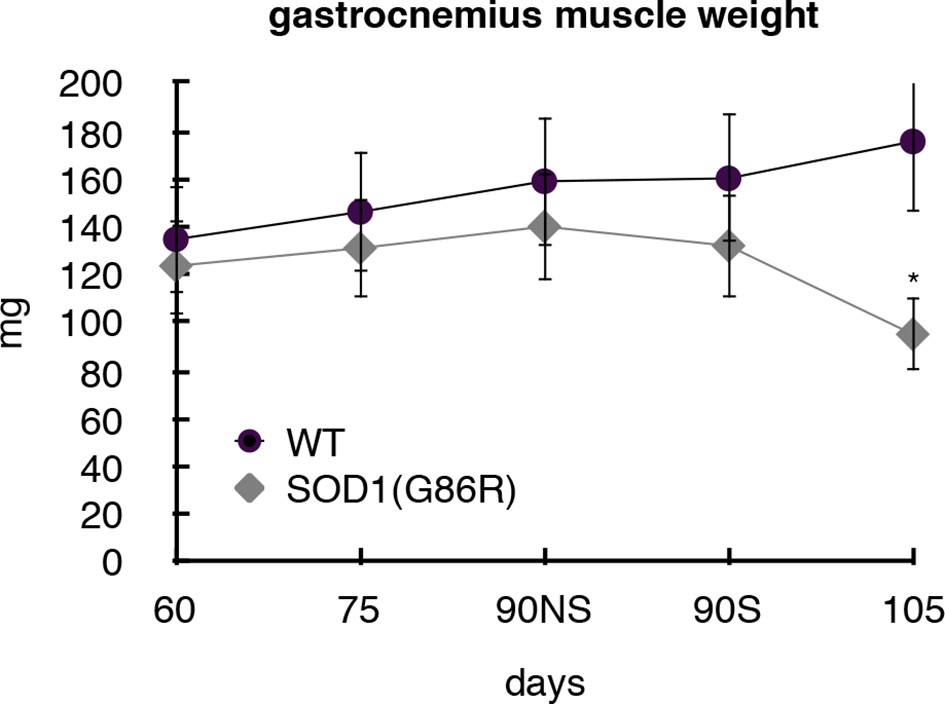
Gastrocnemius muscles from wild-type or symptomatic SOD1(G86R) (105 days) mice were dissected and weighted.
Graph represents the weight (n = 5). *p<0.01 compared to control, as calculated by a one-way ANOVA test followed by a Tukey post-test. NS: non denervated, S: denerveted as assessed by acetylcholine alpha receptor (AchRα) expression.
Figure 3
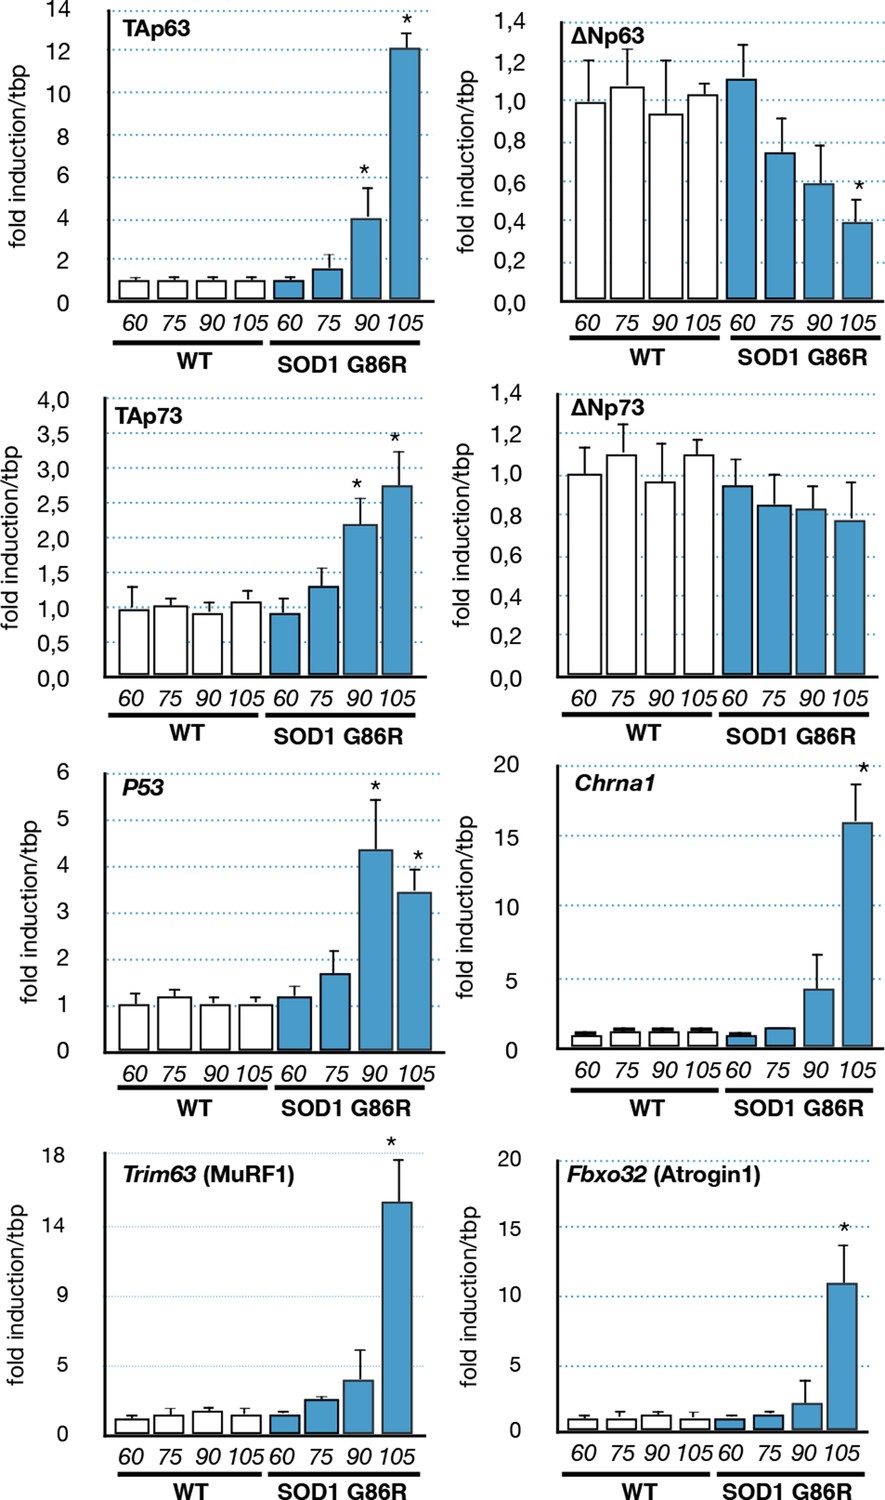
Expression of p53-family members in SOD1(G86R) muscles.
p53 family members, Chrna1 (Acetylcholine receptor subunit alpha) or muscle atrophy effectors Trim63 (MuRF1) and Fbxo32 (Atrogin1) mRNA levels were assayed in SOD1(G86R) mouse gastrocnemius muscle by RT-qPCR. Bars are means of fold induction versus ‘WT 60 days-old’ and of matching age (60, 75, 90, 105 days-old, n = 6) and experimental condition (WT or SOD1(G86R)). *p<0.01 compared to control, as calculated by a one-way ANOVA test followed by a Tukey post-test.
Figure 4 with 3 supplements
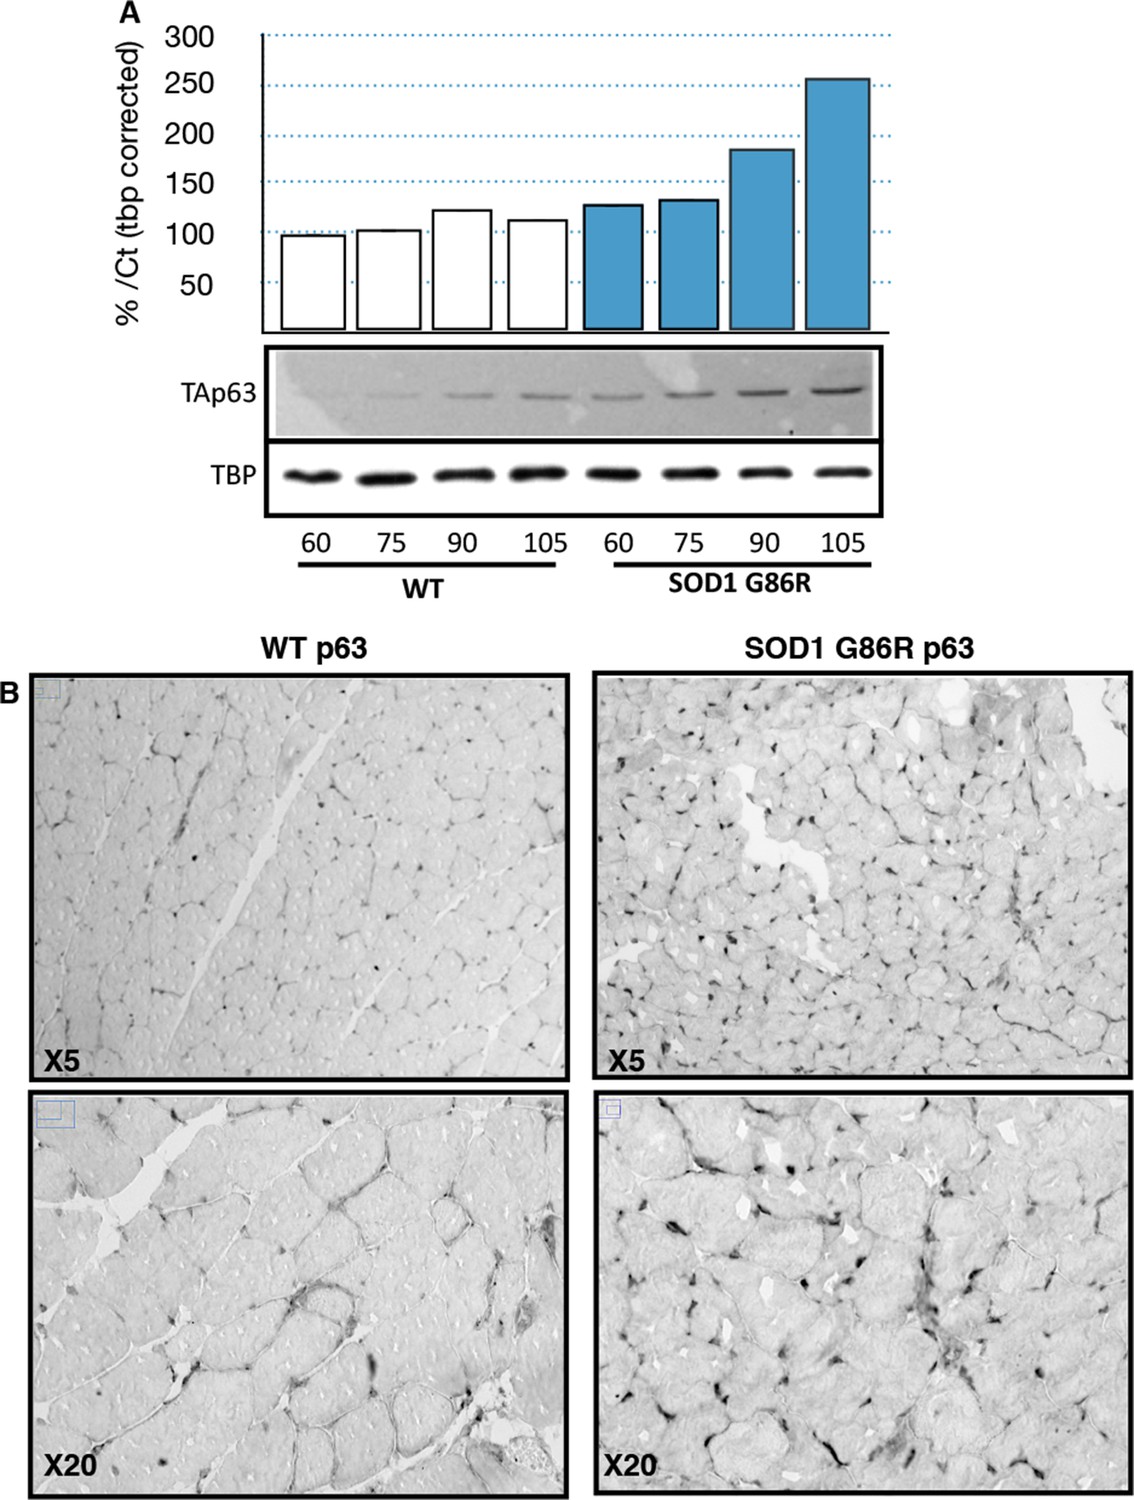
p63 protein expression in SOD1(G86R) muscle.
(A) Proteins from muscles were immuno-precipitated with a p63 antibody and then separated on a 10% SDS PAGE gel. Western blot experiment was performed using an antibody against TAp63. Each experimental point is a pool of proteins from 6 animals. Graph represents quantification of the blot using ImageJ image analyzer software indicated a %/WT 60 day-old animals. (B) Gastrocnemius muscles from wild-type or symptomatic SOD1(G86R) (105 days) mice were cryodissected and probed for total p63 protein.
Figure 4—figure supplement 1
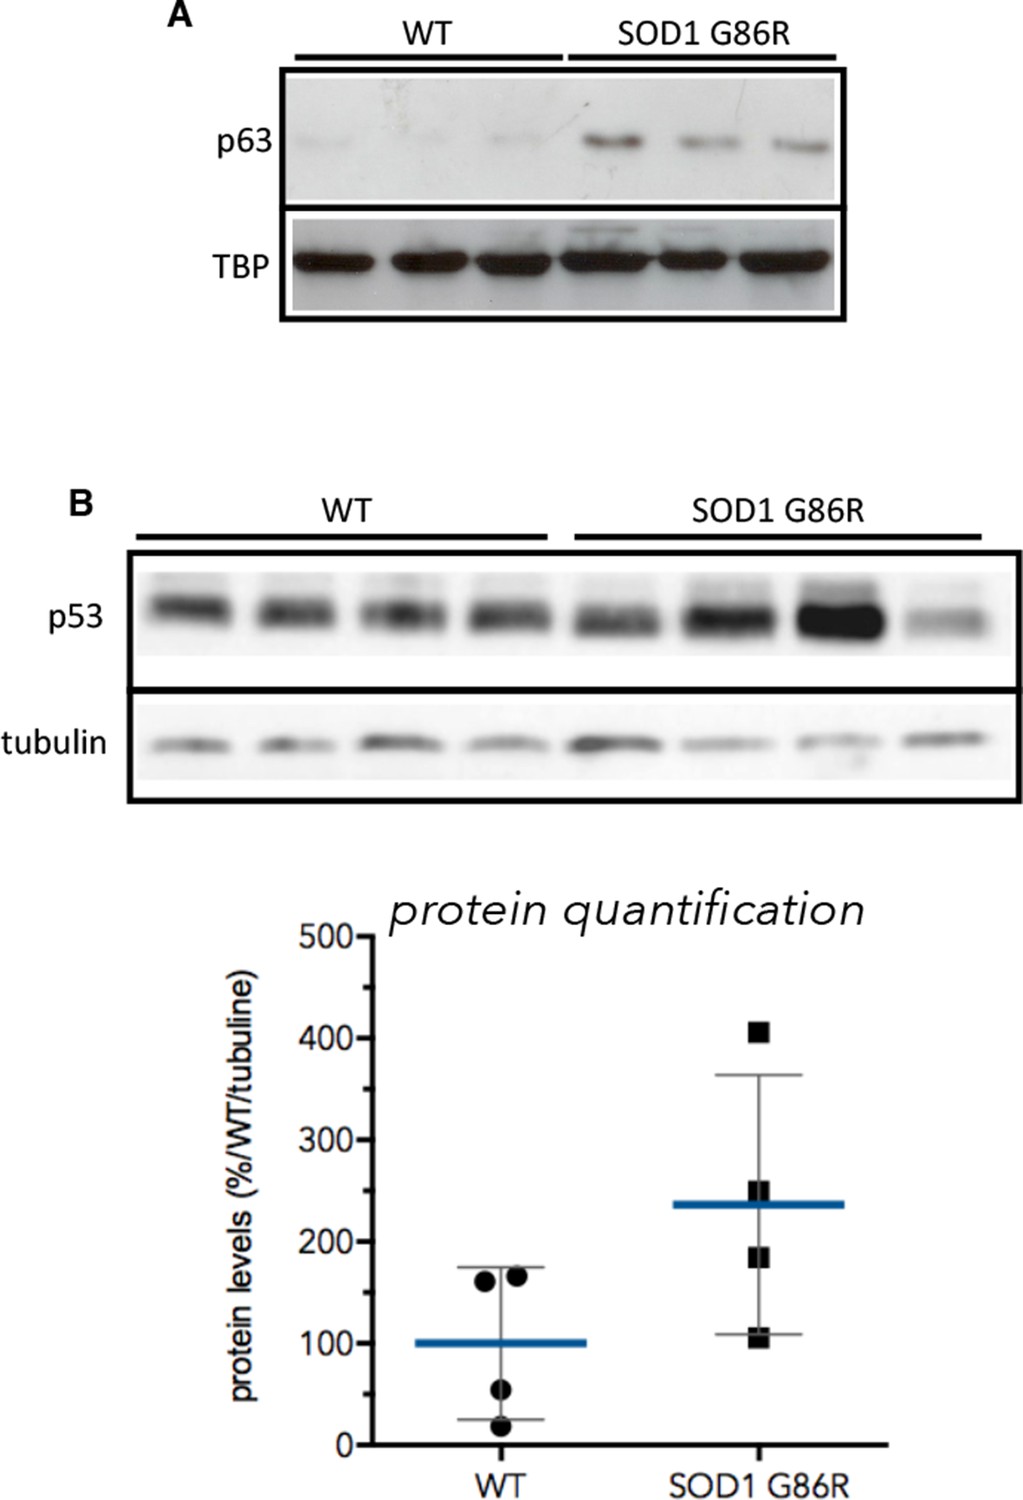
p53 and p63 protein expression in muscles of SOD1(G86R) mice.
(A) Proteins from muscles were immuno-precipitated with a p63 antibody and then separated on a 10% SDS PAGE gel. Western blot experiment was performed using an antibody against p63 total. Shows pools of proteins from 3 animals at 105d. TBP was used as loading control. (B) Proteins (40 µg) from muscles were separated on 10% SDS PAGE gel. Western blot probing was performed with p53 antibody (IC12, 1/2000, Cell Signaling, Danvers, MA) and True Blot (Rockland Immunochemicals, Pottstown, PA) secondary antibody avoiding Ig heavy chain recognition. Tubilin was used as loading control. Graph below shows% of induction relative to the mean of p53 expression level in WT animals normalised with tubulin.
Figure 4—figure supplement 2
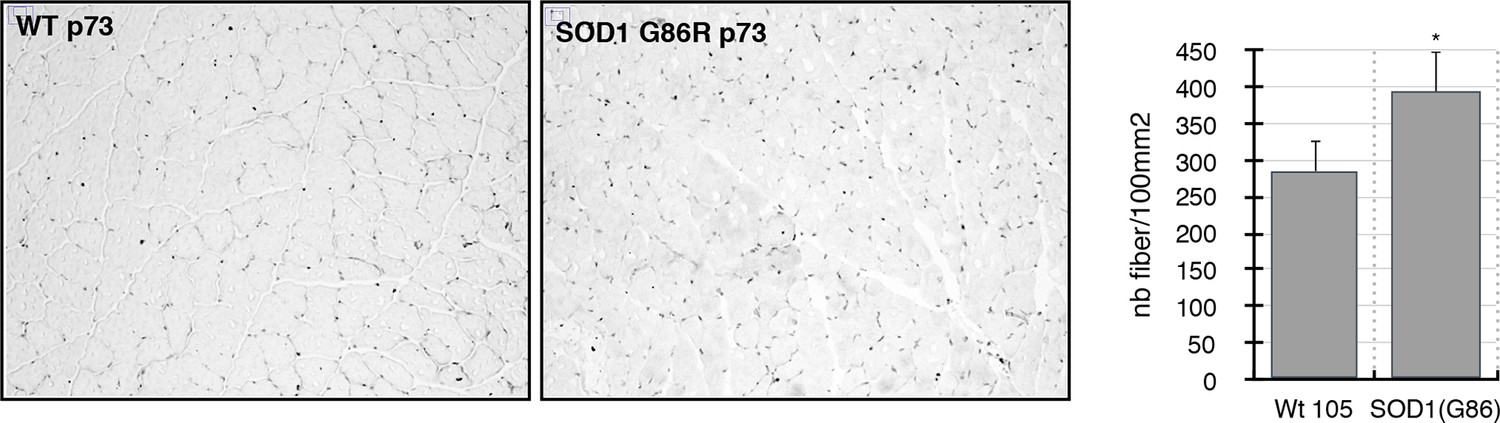
Gastrocnemius muscles from wild-type or symptomatic SOD1(G86R) (105 days) mice were cryodissected and probed for total p73 protein.
Graph represents the number of fibers per surface unit as indicated (n = 5). *p<0.01 compared to control, as calculated by a one-way ANOVA test followed by a Tukey post-test.
Figure 4—figure supplement 3
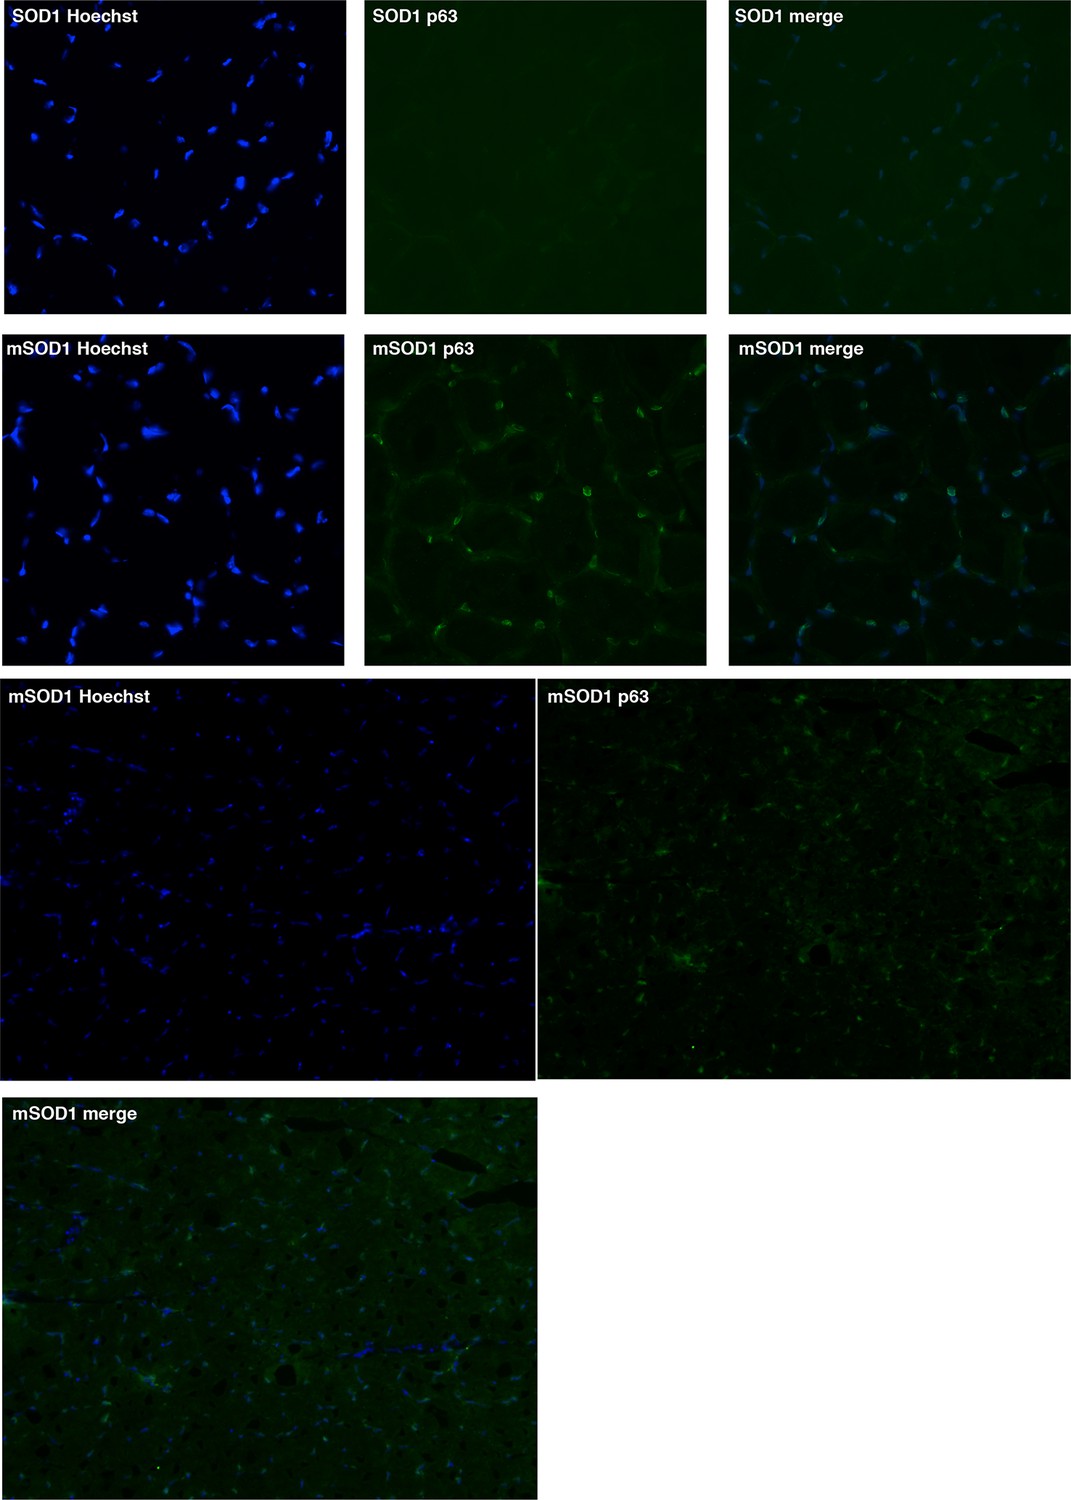
Gastrocnemius muscles from wild-type or symptomatic SOD1(G86R) (105 days) mice were cryodissected and probed for total p63 protein and nuclei (Hoechst).
https://doi.org/10.7554/eLife.10528.013
Figure 5 with 2 supplements
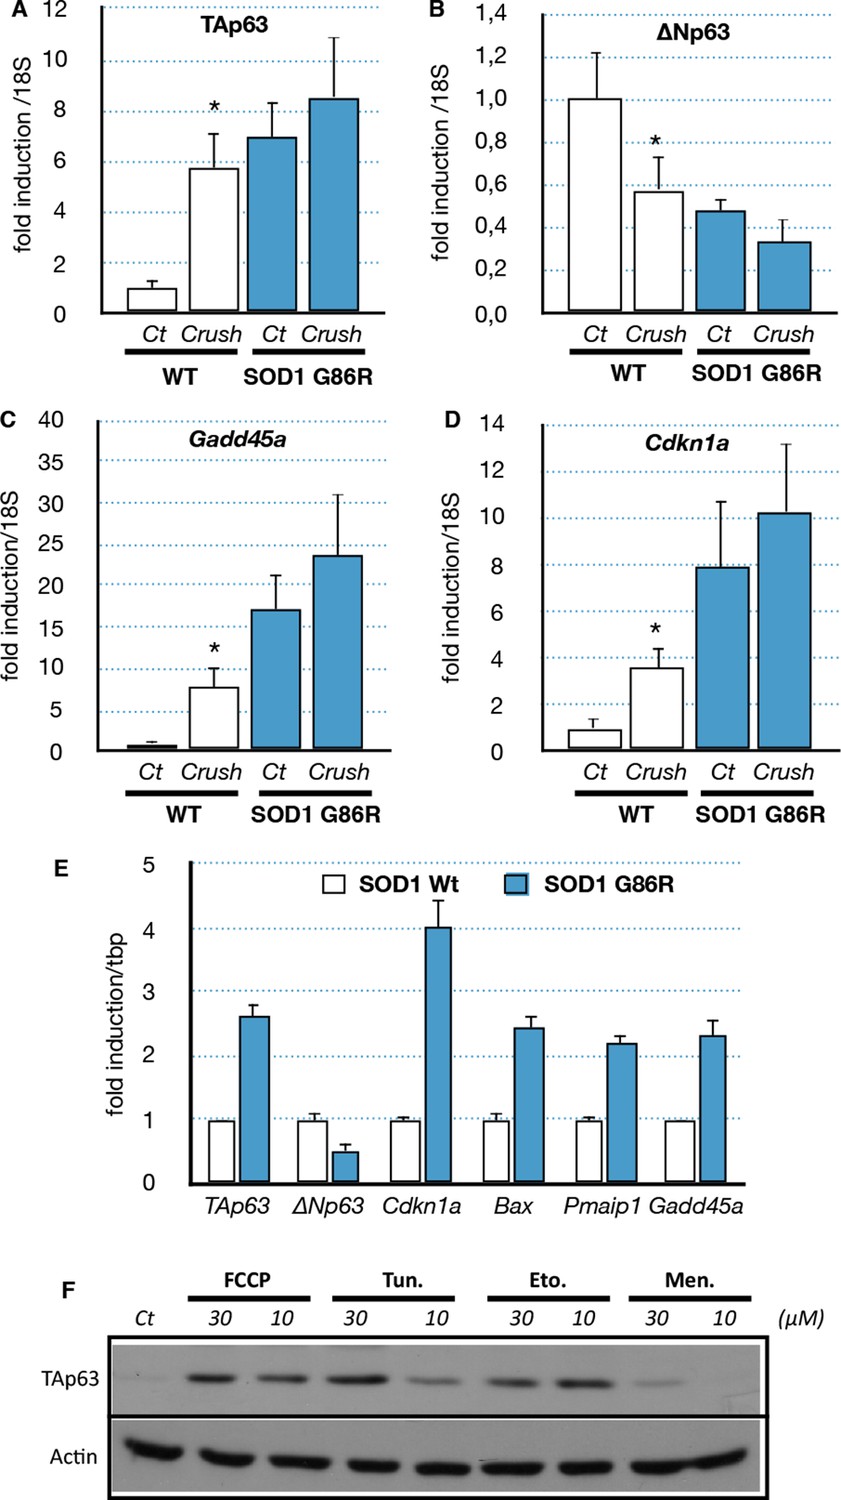
Expression of p63 and p53-family target genes following sciatic nerve crush, SOD1 expression of induction of stress
(A–D) WT and SOD1(G86R) mice (80 days of age) were anesthetized and the sciatic nerve crushed. Sham-operated contra limbs served as control (Ct). After 7 days, expression of TA isoforms of Trp63 (A, TAp63), ∆N isoforms of Trp63 (B, ∆Np63), Gadd45a (C) and Cdkn1a (D) was assayed by RT-qPCR (n = 6). Values were normalized to the value of sham-operated WT muscles/animals. Bars represent means (relative induction versus Ct) with standard deviation (n = 3). *p<0.01 as calculated by a one-way ANOVA test followed by a Tukey post-test. (E) C2C12 myoblasts were transfected with expression vectors for SOD1 variants (WT or G86R). mRNA from SOD1 transfected cells were analyzed by RT-qPCR for p63 and p63 target gene expression. Bars represent means (relative induction versus Ct) with standard deviation (n = 3). *p<0.01 as calculated by a one-way ANOVA test followed by a Tukey post-test. (F) Proteins were extracted from C2C12 myoblasts treated with compounds: FCCP, Tunicamycin (Tun), Etoposide (Eto), menadione (Men). Western blot analysis revealed TAp63 expression.
Figure 5—figure supplement 1
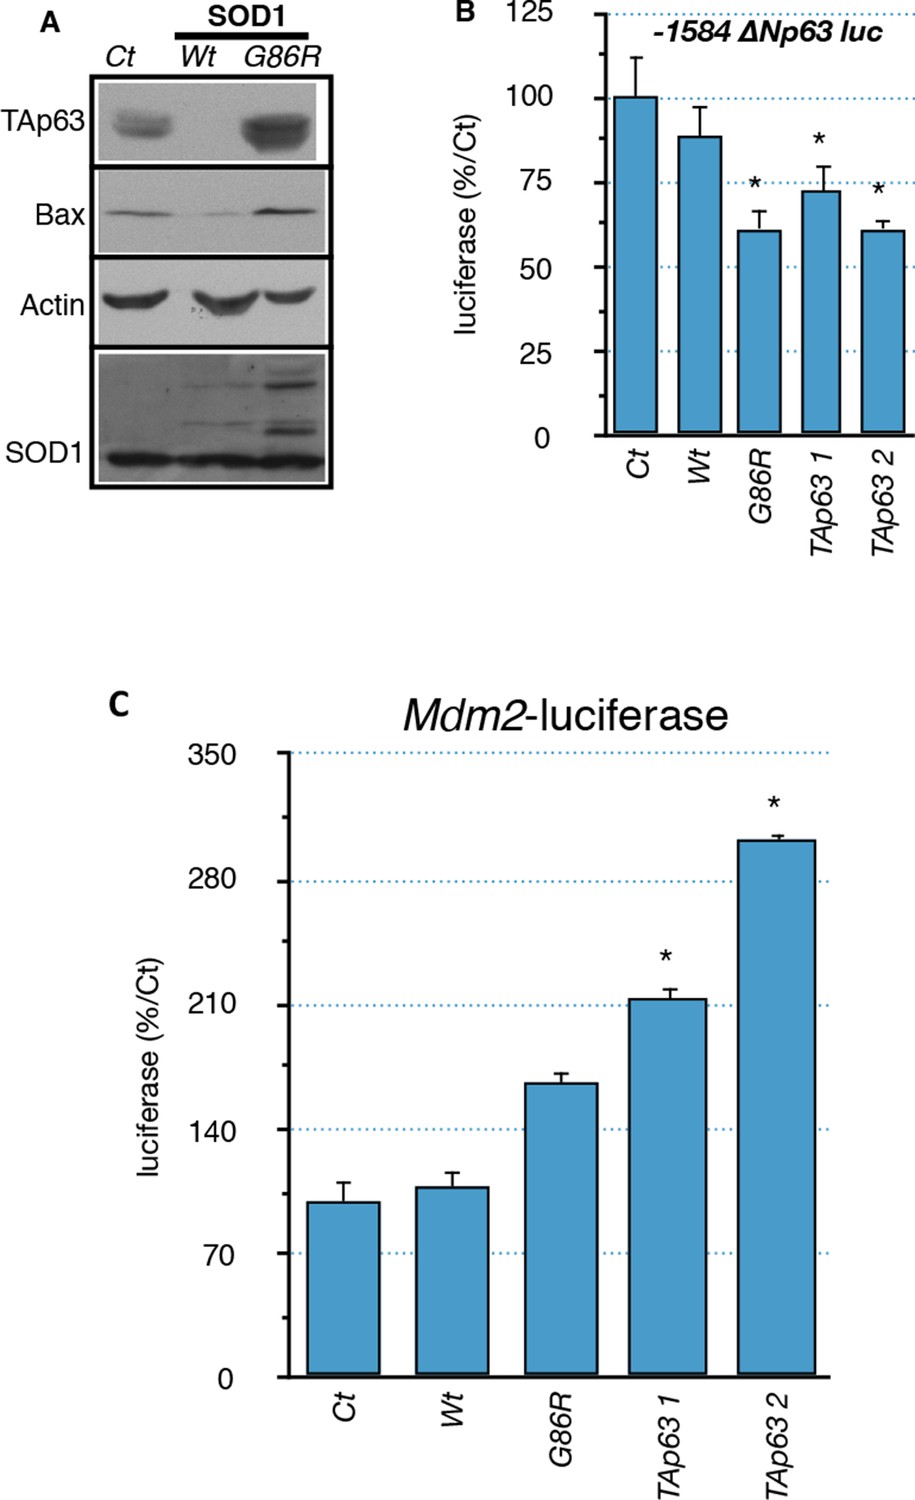
Regulation of p63 and Mdm2 expression by SOD1 (G86R).
(A) Protein were extracted from C2C12 myoblasts expressing WT or SOD1(G86R) after 5-days puromycin selection. Western blot analysis revealed TAp63, Bax or SOD1 expression. Actin was used as loading control. (B, C) C2C12 myoblasts were transfected with expression vectors for SOD1 variants (WT or G86R) or TAp63γ (2 concentrations, 1, 2) and luciferase reporter genes containing deletions of the promoter of the ΔN isoforms of P63 (-1584-+32 or -46/+32) or Mdm2 promoter. Bars represent means (relative induction versus Ct) with standard deviation (n = 3). Results are standardized with the 'minimal' promoter reporter gene -46/+32-luc. Ct = cells transfected with an empty vector. Bars represent means (relative induction versus Ct) with standard deviation (n = 3). *p<0.01.
Figure 5—figure supplement 2
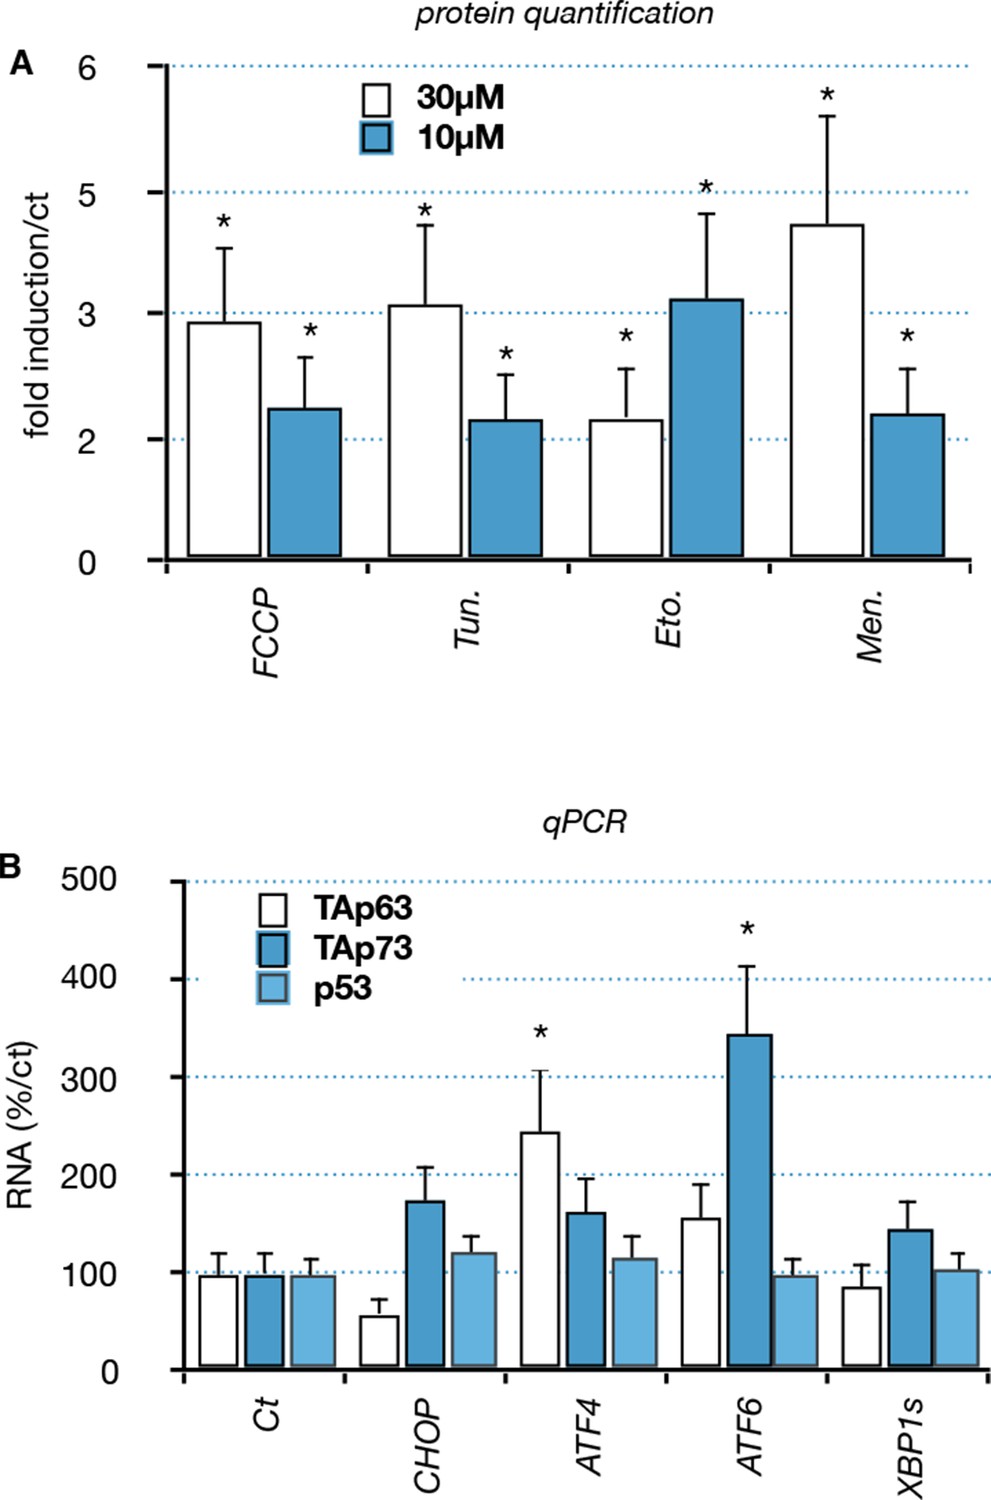
Functional interaction between members of the p53 family and ER or mitochondrial stress.
(A) Quantification: Proteins were extracted from C2C12 myoblasts treated with compounds: FCCP, Tunicamycin (Tun), Etoposide (Eto), menadione (Men). Western blot analysis revealed TAp63 expression. Bars correspond to means with SD (n = 3). *p<0.01. (B) C2C12 myoblasts were transfected with expression vectors encoding transcription factors involved in the ER or mitochondrial stress pathway (CHOP, ATF6, ATF4, XBP1s). RNA levels for TA isoforms of Trp63, TA isoforms of P73 and P53 were followed by RT-qPCR. Bars represent means (relative induction versus Ct) with standard deviation (n = 3).*p<0.01.
Figure 6
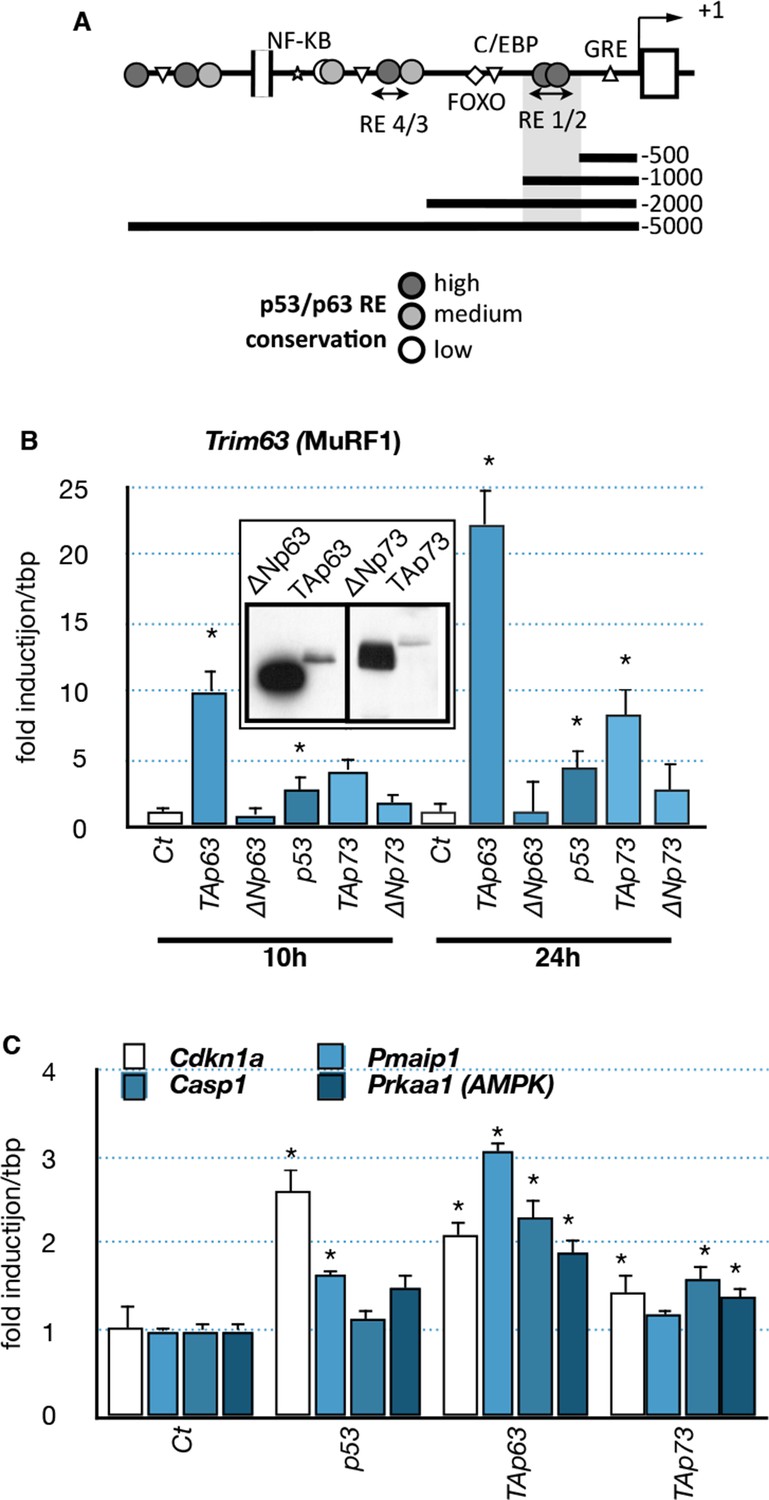
Effects of p53-family expression on Trim63 and p53-family target genes.
(A) Schematic representation of the Trim63 promoter indicating the location of putative p53/p63 binding sites. (B, C) C2C12 myoblasts were transfected (inserted panel: western blot) with various p53-family members (TAp63γ, ΔNp63γ, p53, TAp73β, ΔNp73β). Total C2C12 RNA was subjected to RT-qPCR after 10 hr or 24 hr of transfection and Trim63 (B) or p63 target (C, Cdkn1a, Pmaip1, Casp1, Prkaa1) expressions are shown relative to control-transfected cells. Bars are means of fold induction versus the control (Ct) with SD (n=3). *p<0.01 as calculated by a one-way ANOVA test followed by a Tukey post-test.
Figure 7 with 2 supplements

Regulation of Trim63 promoter by p63.
(A, B) Trim63 promoter reporter constructs were co-transfected with pCDNA3 (Ct) or TAp63 into C2C12 cells and luciferase activity was assessed 16 hr later. pGL3 was used as a negative control. Bars correspond to means with SD (n = 3). *p<0.01 as calculated by a one-way ANOVA test followed by a Tukey post-test. (C) Chromatin immunoprecipitation assay was performed on the Trim63 promoter using RT-qPCR on RE1/2 and RE4 (see Figure 6A). Bars correspond to means with SD (n = 3). *p<0.01 as calculated by a one-way ANOVA test followed by a Tukey post-test. (D) Trim63 mRNA levels were assayed in C2C12 cells by RT-qPCR after TAp63 silencing by siRNA for 36 hr and after treatment with FCCP for 12 hr. Bars correspond to means with SD (n=3). *p<0.01 as calculated by a one-way ANOVA test followed by a Tukey post-test.
Figure 7—figure supplement 1
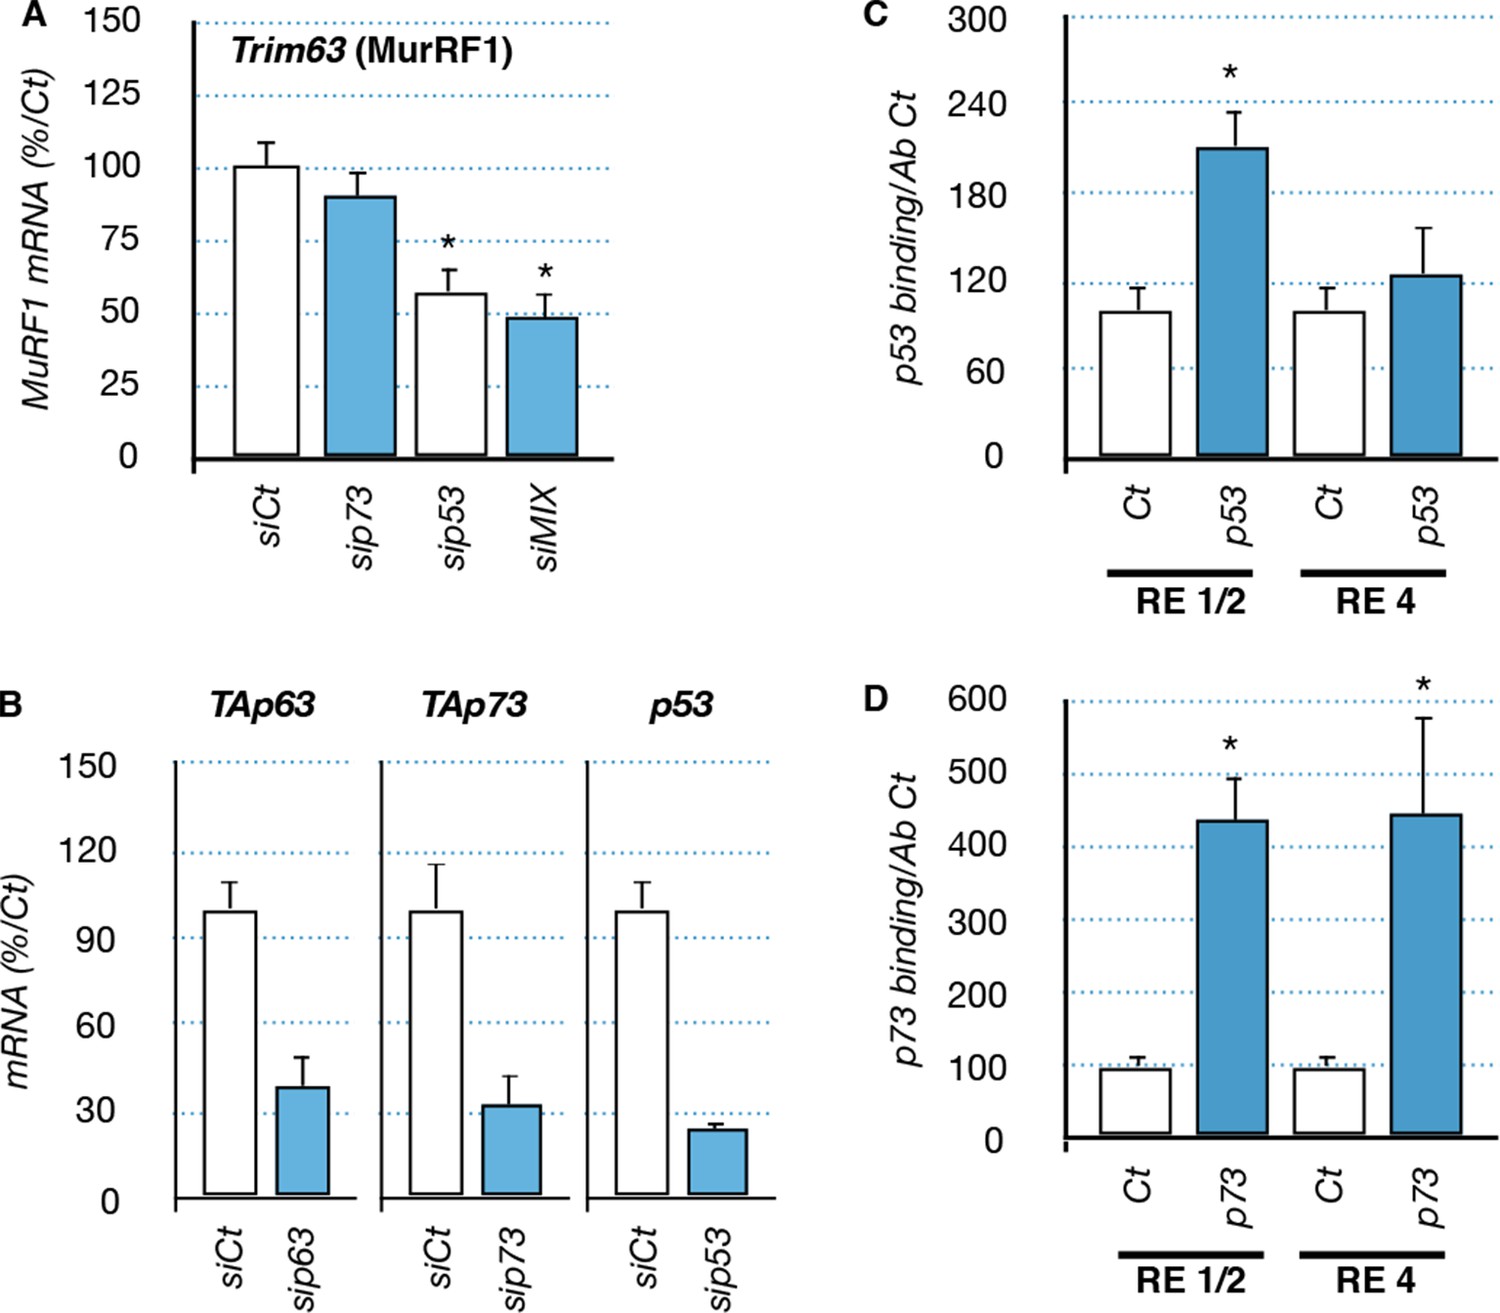
Regulation of Trim63 by p53 and p73 proteins.
(A) mRNA levels of Trim63 in C2C12 cells following transfection with siRNA control and siRNA directed against p73, p53 and a mix of siRNA against P53, and the TA isoforms of Trp63 and P73 (siMIX). Bars represent means (relative induction versus Ct) with standard deviation (n = 3). *p<0.01. (B) mRNA level for TA isoforms of Trp63, TA isoforms of P73 and P53 in C2C12 cells following transfection with siRNA control and siRNA directed against p63, p73, and p53. Bars represent means (relative induction versus Ct) with standard deviation (n = 3). *p<0.01. (C, D) Chromatin immunoprecipitation (ChIP) assay was performed on the Trim63 promoter using RT-qPCR on RE1/2 and RE4. p53 immunoprecipitation (C) was performed using p53 antibody IC12 (Cell Signalling), p73 immunoprecipitation was performed using p73 antibody IMG-259a (Imgenex). Bars correspond to means with SD (n = 3). *p<0.01 as calculated by a one-way ANOVA test followed by a Tukey post-test.
Figure 7—figure supplement 2
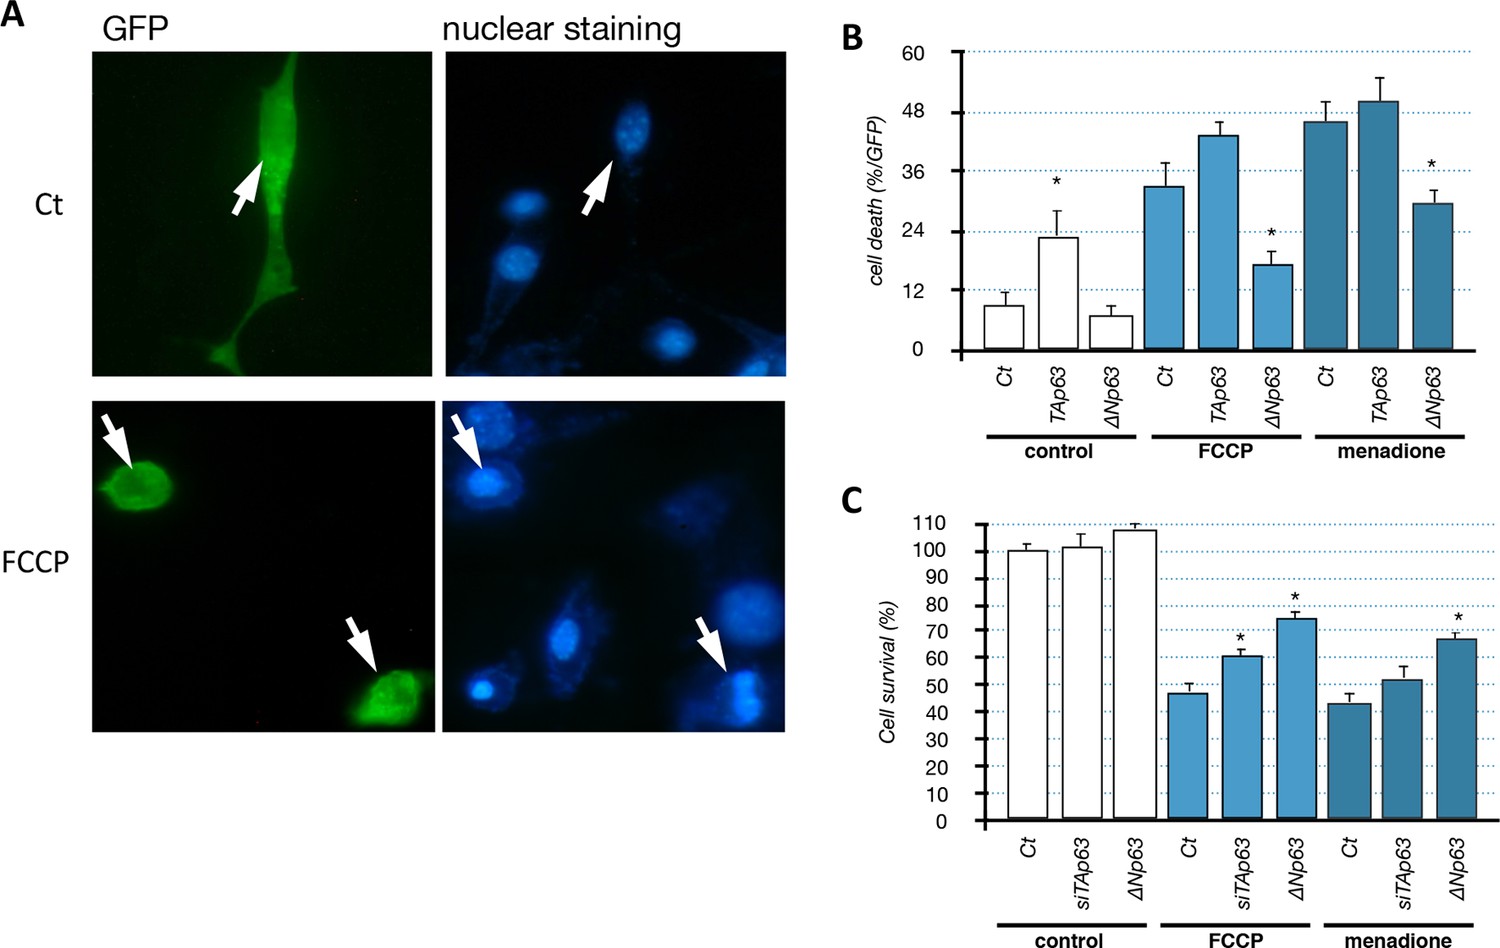
Impact of p63 on C2C12 cell survival.
(A, B) C2C12 were transfected with a GFP expression vector and either TAp63γ or ΔNp63γ expression vectors. After 24 hr, cells were left untreated (Ct) or treated with FCCP (1 µM) or menadione (1 µM) for 24 hr. Cells were stained with Hoechst and examined with a fluorescence microscope (B). Above, GFP-positive control cells (untreated). Below, dead GFP-positive cell treated with FCCP. C2C12 cells were grown on coverslips coated with poly-ornithine in 24-wells plates. Cells were co-transfected with the indicated expression vectors (200 ng/well) and a GFP-expression vector (50 ng/well) as previously described (Broadley and Hartl, 2008). Cells were cultured for 18 hr with the indicated agents. Cells were subsequently washed with PBS and fixed with 4% paraformaldehyde for 15 min. After two washes, cells were incubated for 10 min with the Hoechst 33,342 staining agent (1 µg/ml, Sigma, Germany). GFP positive cells were then observed with an epi-fluorescent microscope (Zeiss, Germany) to assess the nucleus morphology. (C) C2C12 cells were transfected either with the ∆Np63γ expression vector or siRNA directed against the TA isoforms of Trp63. Cell survival was evaluated using MTT assay after 48 hr of treatment with the indicated drugs at 1 µM. *p<0.01 compared to control, as calculated by a one-way ANOVA test followed by a Tukey post-test.
Tables
Table 1
Fold induction of p53-related genes in the ALS model SOD1 (G86R).
| Gene name | Function | 90 d. | 105 d. |
|---|---|---|---|
| p53-family target genes | |||
| Cdkn1a (p21) | Cell cycle arrest | 4 | 13 |
| Gadd45a | Cell cycle arrest | 5,6 | 21 |
| Peg3 | Apoptosis inducing | 3 | 7 |
| Perp | Cell cycle arrest | 4 | 12 |
| Pmaip1 | Apoptosis effector | 5 | 12 |
| Bax | Apoptosis effector | 3 | 8 |
| Siva | Apoptosis inducing | 3 | 5 |
| Zmat3 | Growth regulation | 1,6 | 1,1 |
| Eda2R | NF.Kb/JNK pathway | 3,4 | 9,4 |
| Tigar | Glucose metabolism | 0,75 | 0,2 |
| Sens1 | ROS homeostasis | - | 16,3 |
| Sens2 | ROS homeostasis | 1,27 | 1,46 |
| Sco2 | Glucose metabolism | 1,18 | 0,91 |
| Ddit3 (Chop) | ER stress | 1,14 | 0,35 |
| Bip (Grp78) | ER stress | 1,25 | 1,08 |
| Xbp1 | ER stress | 2 | 2,51 |
| p53-family regulators | |||
| Mlf1 | Cell cycle arrest/differentiation | 0,9 | 0,2 |
| Myf6 | Differentiation | 4 | 7 |
| Mdm2 | p53 degradation | 4 | 6 |
| Txn1 | Oxidative stress response | 4 | 6 |
| Id2 | Inhibition of differentiation | 2 | 3,1 |
| p53-family members | |||
| P53 | 4 | 3 | |
| TAp63 | 4 | 12 | |
| ∆Np63 | 0,5 | 0,3 | |
| TAp73 | 2 | 3 | |
| ∆Np73 | 0,9 | 0,8 | |
| Denervation/atrophy markers | |||
| Chrna1 (ACh Receptor alpha) | Neuromuscular junction | 4,2 | 12,4 |
Additional files
-
Supplementary file 1
- https://doi.org/10.7554/eLife.10528.021
-
Supplementary file 2
- https://doi.org/10.7554/eLife.10528.022
Download links
A two-part list of links to download the article, or parts of the article, in various formats.
Downloads (link to download the article as PDF)
Open citations (links to open the citations from this article in various online reference manager services)
Cite this article (links to download the citations from this article in formats compatible with various reference manager tools)
Transcriptional activator TAp63 is upregulated in muscular atrophy during ALS and induces the pro-atrophic ubiquitin ligase Trim63
eLife 5:e10528.
https://doi.org/10.7554/eLife.10528


