Discovery and validation of sub-threshold genome-wide association study loci using epigenomic signatures
- Massachusetts Institute of Technology, United States
- Broad Institute of MIT and Harvard, United States
- Massachusetts General Hospital, United States
- Hubrecht Institute-KNAW, University Medical Center Utrecht, Netherlands
- University Medical Center Utrecht, Netherlands
- University of Groningen, Netherlands
- Center for Human Genetic Research, Massachusetts General Hospital, United States
Figures
Figure 1 with 3 supplements

GWAS repolarization loci preferentially overlap cardiac enhancers.
(a) Enrichment of human left ventricle enhancers in 112 QT/QRS loci. The number of loci that contain a SNP overlapping an enhancer are computed for the 112 QT/QRS loci, and compared against 100,000 permutations of randomly sampled control loci matched for LD block size (number of SNPs), MAF, distance to nearest gene, number of nearby genes, and presence on genotyping array. (b) Top, Enrichment of enhancers from 127 human tissues in QT/QRS loci. Bottom, Enrichment of enhancers from non-cardiac tissues for QT/QRS loci is substantially weaker following removal of enhancers active in any of the four cardiac tissues. (c) Top, QT/QRS SNPs are more likely to disrupt motifs corresponding to expressed TFs compared to 100,000 sets of matched control loci. Bottom, Weaker enrichment was observed between repolarization and matched control loci when the sequence of the TF motif was randomly shuffled and re-mapped to the genome (10,000 permutations).
Figure 1—figure supplement 1
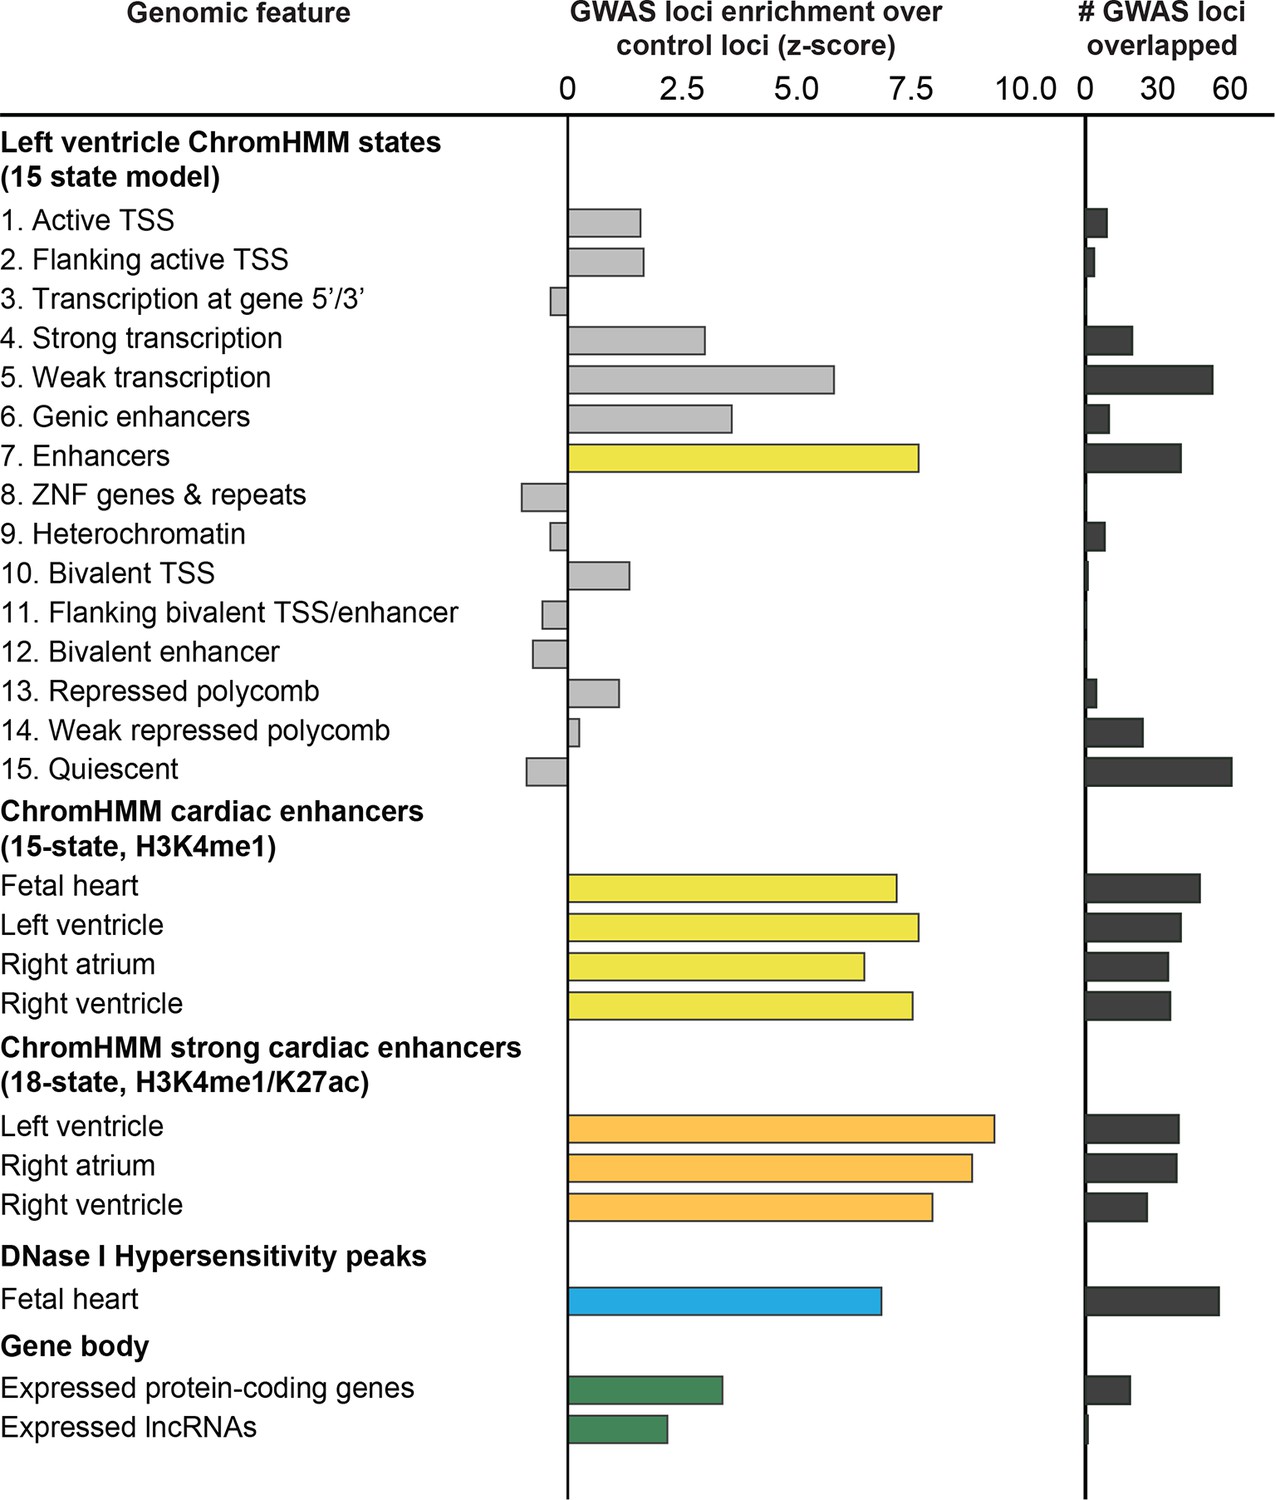
112 QT/QRS loci overlap enhancers more significantly than other genomic regions in adult left ventricle.
Comparison of H3K4me1-enhancers defined by a 15-state model of ChromHMM against other ChromHMM states including protein-coding and non-coding genes and their promoters as well as DNase I hypersensitive (DHS) peaks that broadly mark regulatory regions. The left panel shows the enrichment of features in the 112 GWAS loci compared to randomly sampled control loci; the right panel shows the total number of the 112 GWAS loci overlapped by each feature.
Figure 1—figure supplement 2
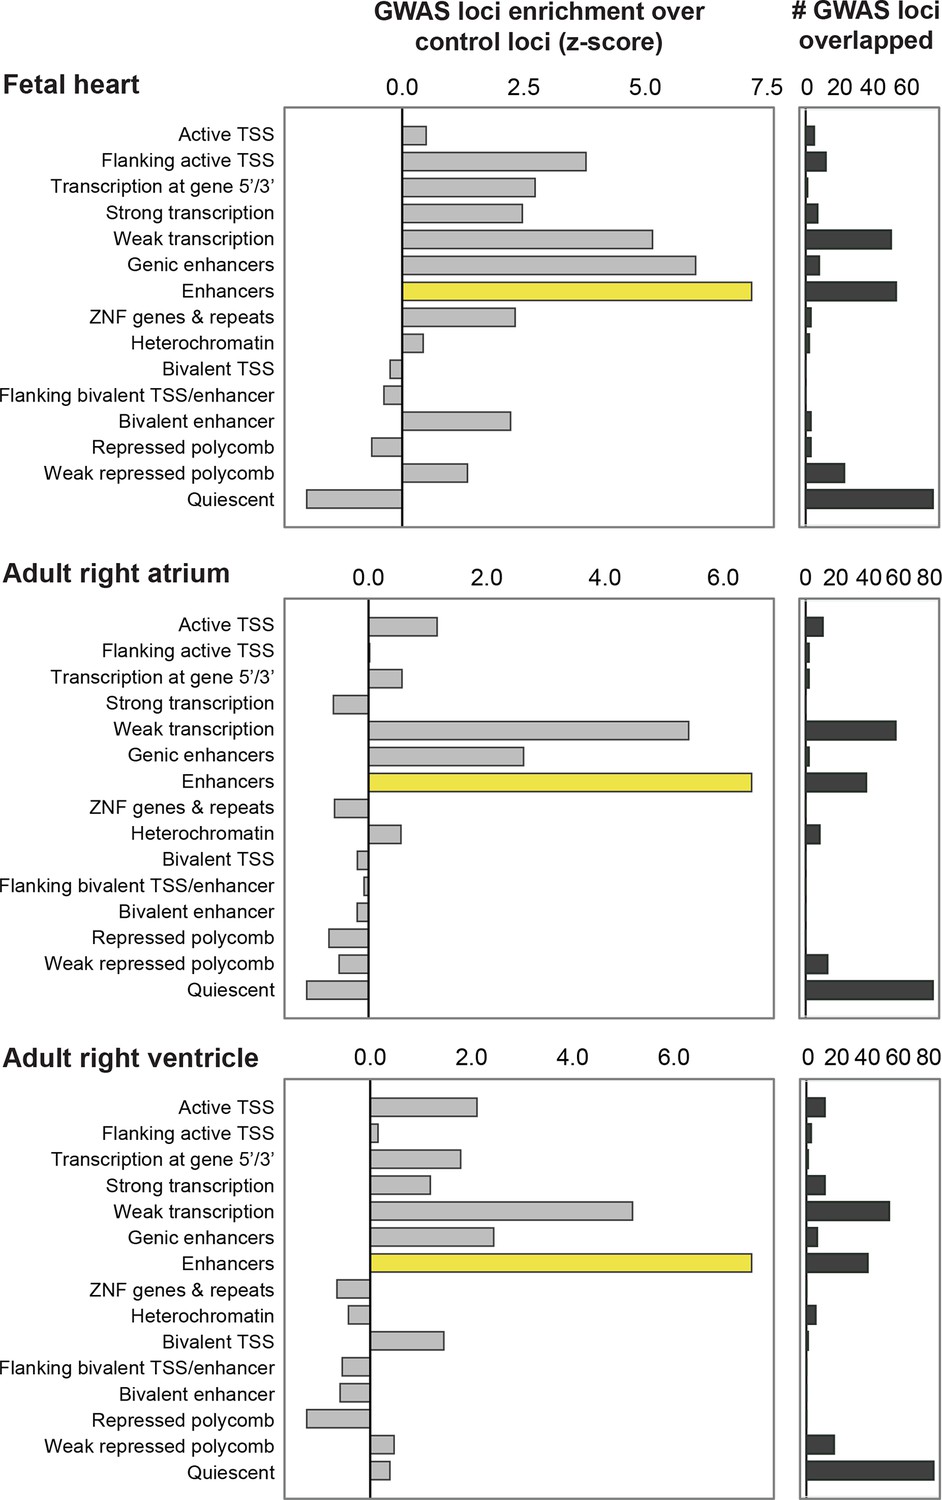
QT/QRS loci overlap enhancers more significantly than other genomic regions in non-LV cardiac tissue.
Comparison of enhancers defined by H3K4me1 against other ChromHMM states in fetal heart, adult right ventricle and adult right atrium. The left panel shows the enrichment of features in the 112 GWAS loci compared to randomly sampled control loci; the right panel shows the total number of the 112 GWAS loci overlapped by each feature.
Figure 1—figure supplement 3
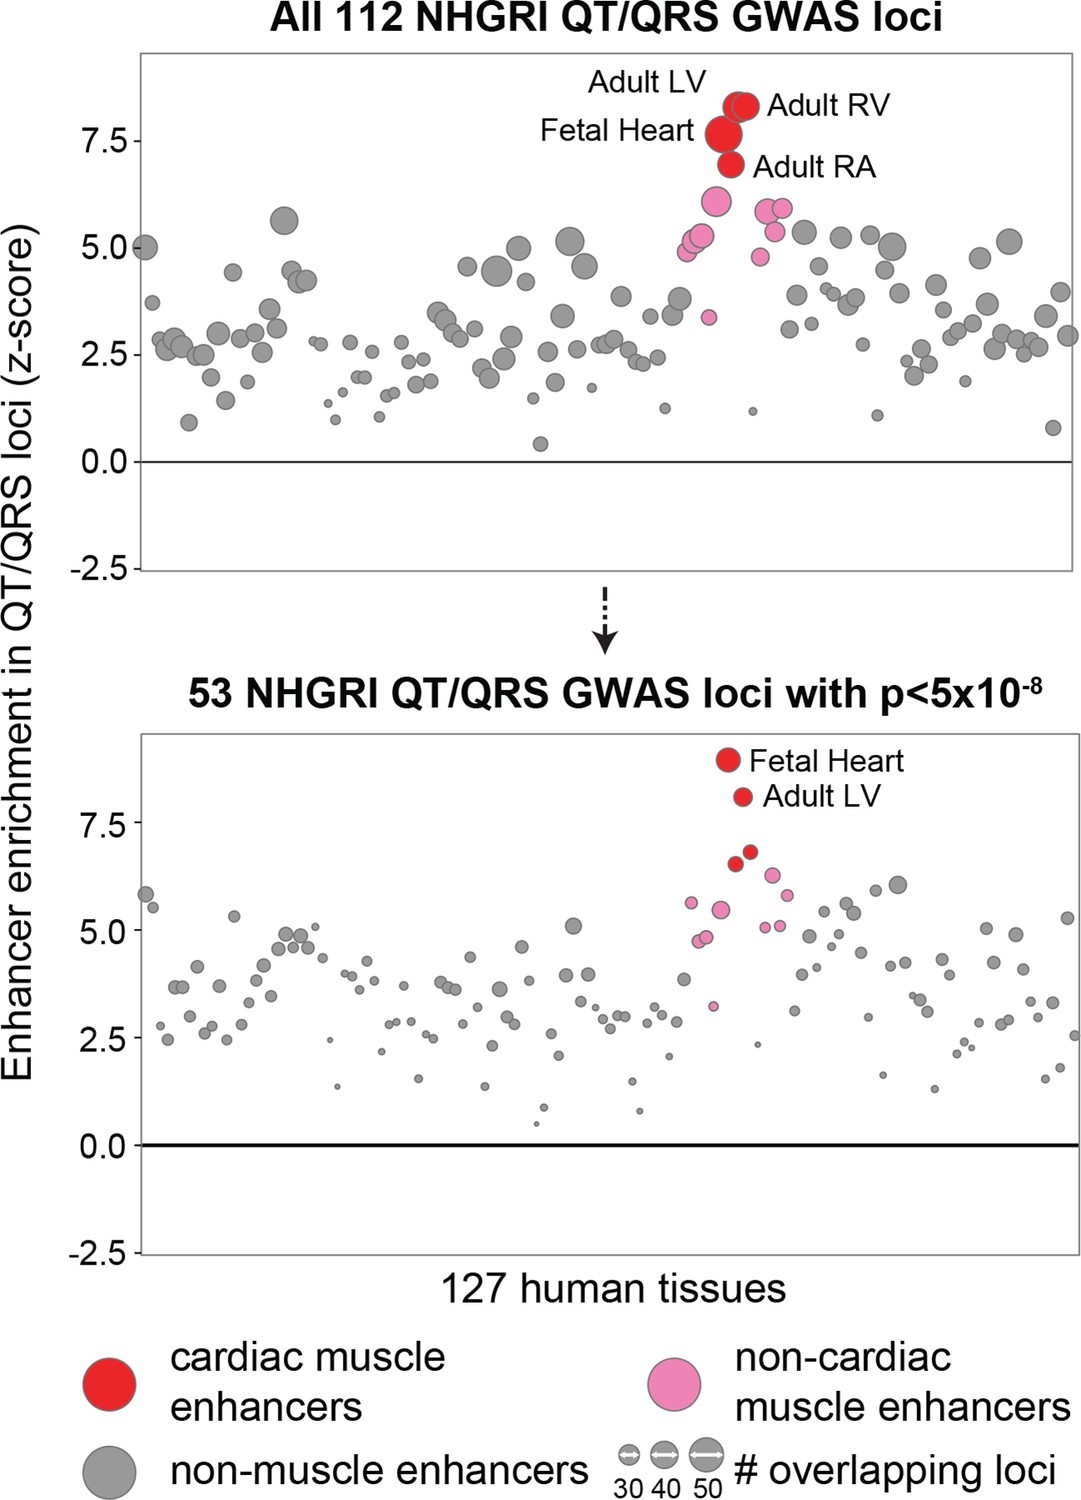
Enrichment of cardiac enhancers remains high in the subset of 53 genome-wide significant (p<5x10⁻⁸) QT/QRS loci.
The number of loci that contain a SNP overlapping an enhancer are computed for the 112 QT/QRS loci, and compared against 100,000 permutations of randomly sampled control loci.
Figure 2
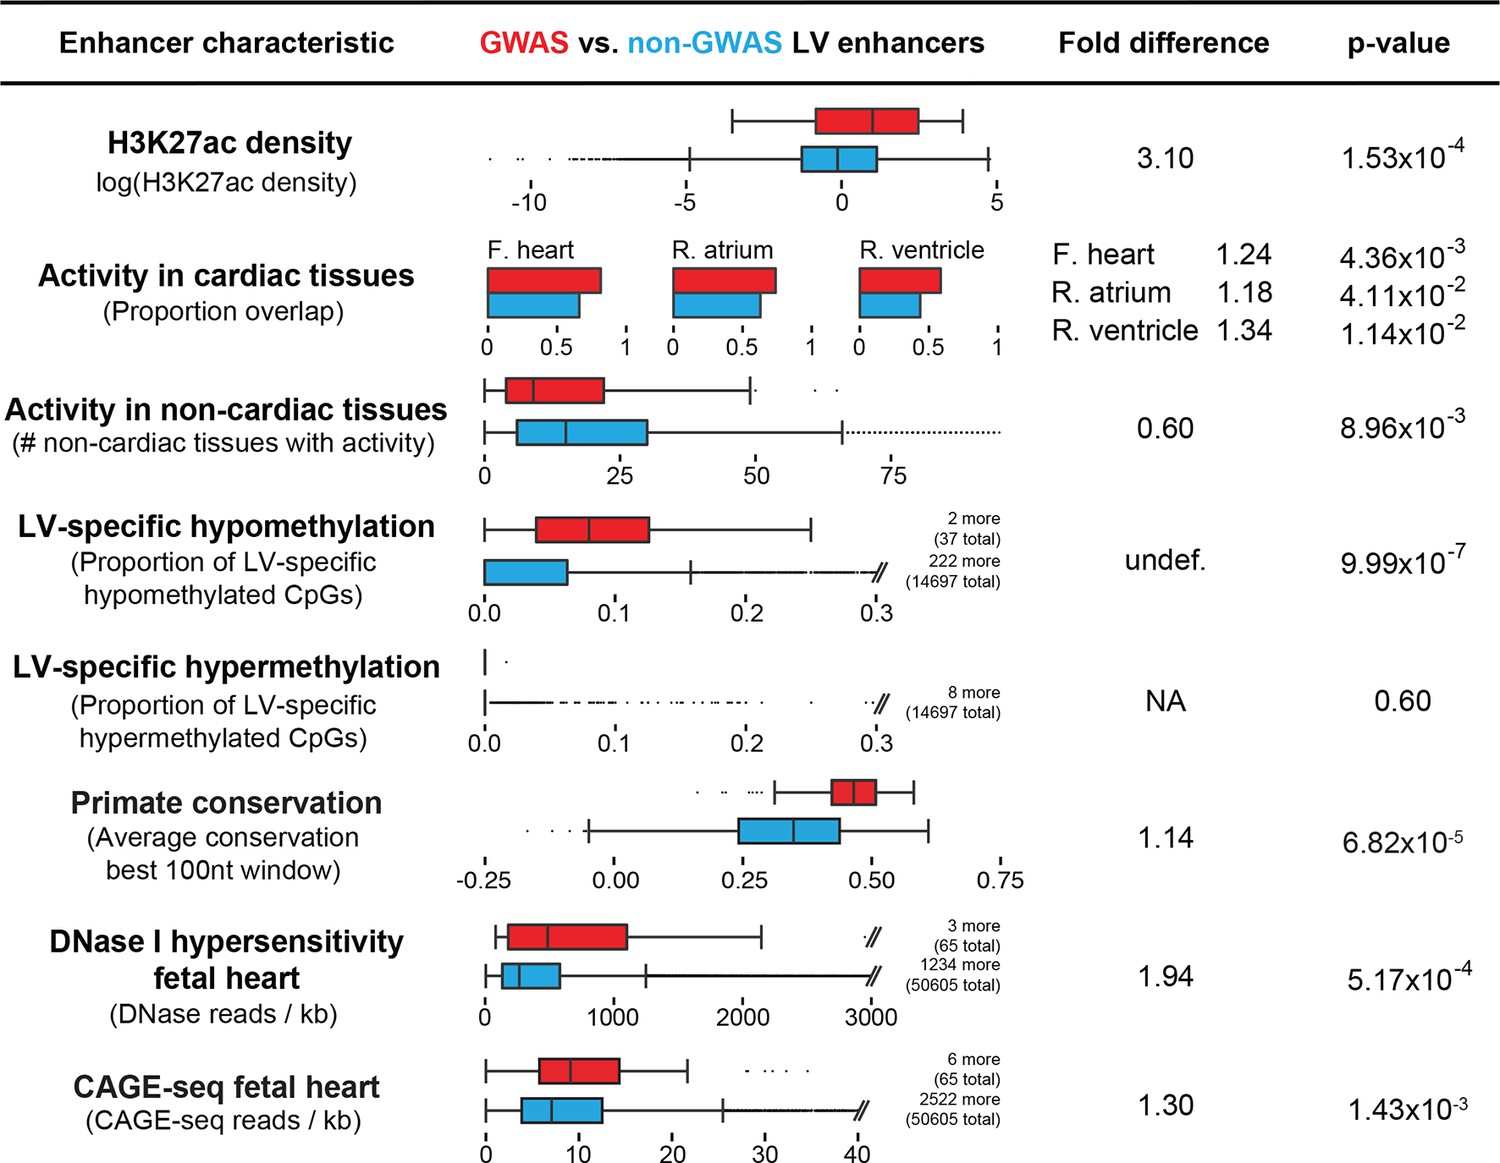
Enhancers overlapping QT/QRS loci differ in functional characteristics from all enhancers.
Several functional characteristics were compared between enhancers overlapping QT/QRS loci (red) and non-GWAS left ventricle enhancers (blue). Fold change represents fold change between median values for the two groups, and p-values were calculated using the Mann-Whitney U test. See Materials and methods for comparison methodology between GWAS QT/QRS enhancers and non-GWAS enhancers for each functional or epigenomic feature. For primate conservation, LV enhancers (blue) were size-matched (+/-1 kb) to GWAS enhancers to control for skewed enrichments driven by larger GWAS enhancer size.
Figure 3 with 4 supplements
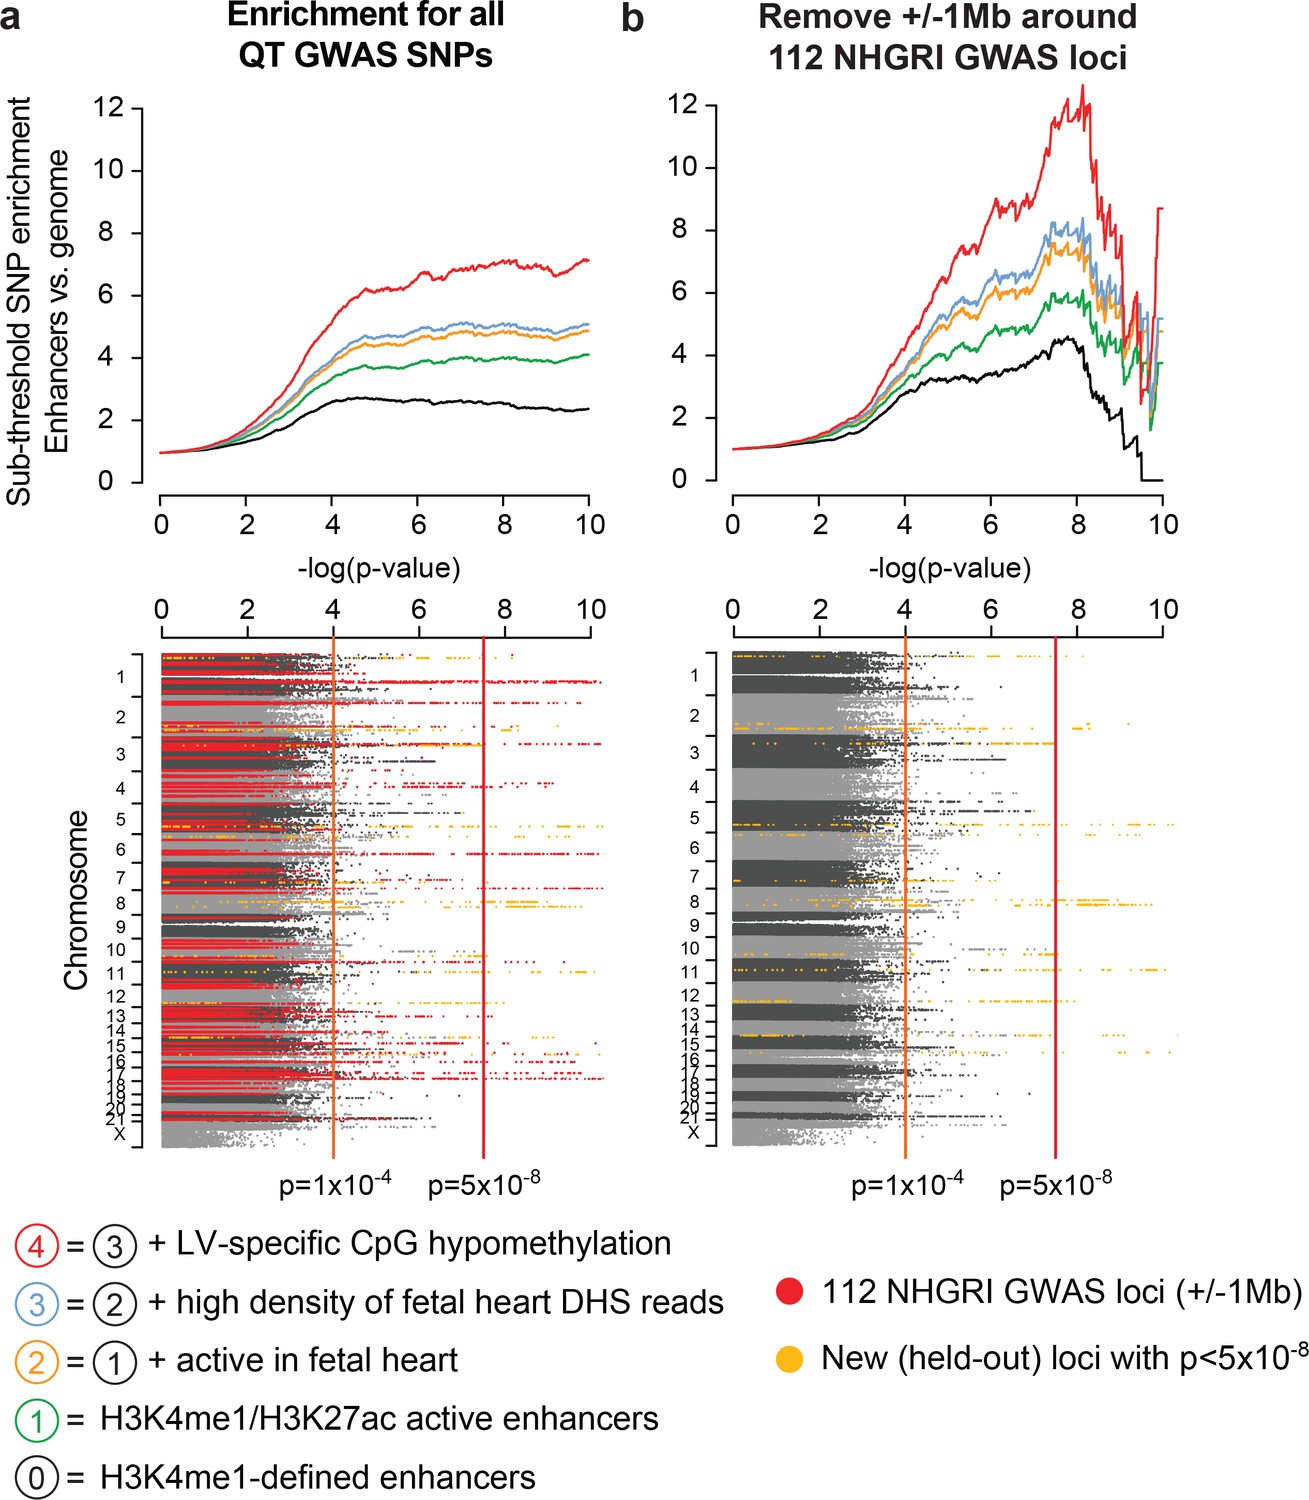
Cardiac enhancers harbor additional sub-threshold QT loci.
(a) Top, Enhancer characteristics learned on above-threshold QT/QRS loci from Figure 2 are predictive for additional sub-threshold loci (colored lines). Each point on a curve represents the fold difference in proportion of SNPs with p-value below the cutoff in the enhancer set versus the whole genome. Bottom, Manhattan plot of p-values for all SNPs from Arking et al. (2014) QT interval GWAS. 112 QT/QRS loci and all SNPs within 1 Mb are highlighted in red. Genome-wide significant loci newly discovered by Arking et al. and not in the 112 QT/QRS loci are highlighted in yellow. (b) Top, Enrichment signals for sub-threshold SNPs in left ventricle enhancers persists following removal of the 112 GWAS loci and nearby SNPs (+/- 1 Mb). Bottom, Manhattan plot of p-values for all SNPs from Arking et al. (2014) QT interval GWAS following removal of 112 QT/QRS loci and all SNPs within 1 Mb. Genome-wide significant loci newly discovered by Arking et al. and not in the 112 QT/QRS loci are highlighted in yellow.
Figure 3—figure supplement 1
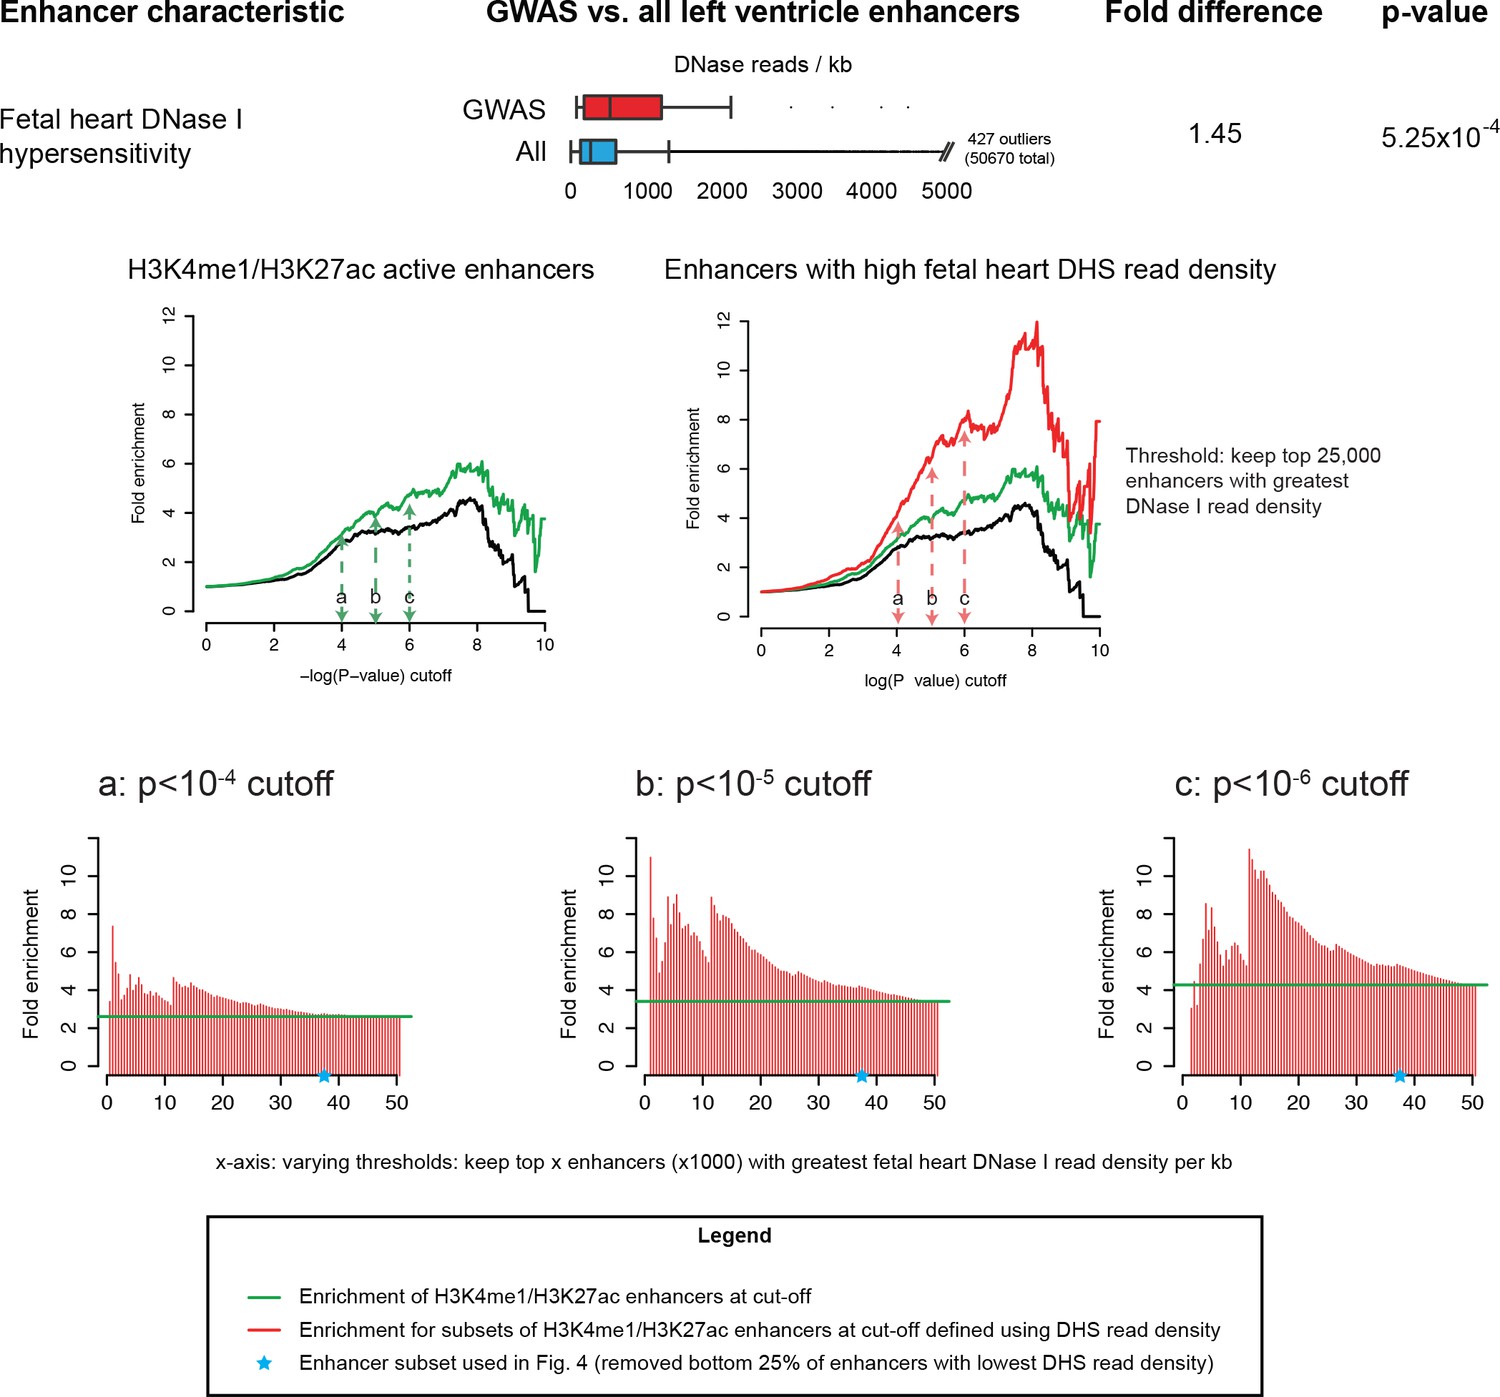
High density of fetal heart DNase I hypersensitivity reads in LV enhancers is robustly informative for identifying enriched sets of sub-threshold loci.
Top: Enrichment of DHS reads in GWAS enhancers. Middle: Example comparison of sub-threshold locus enrichment in active LV enhancers vs. active LV enhancers with high DHS read density. Bottom: Y-axis of graphs corresponds to fold enrichment of sub-threshold loci in enhancers taken at three p-value cutoffs (10-4, 10-5 and 10-6). X-axis represents enrichments plotted for different subsets of enhancers chosen by varying DHS read density cutoffs.
Figure 3—figure supplement 2
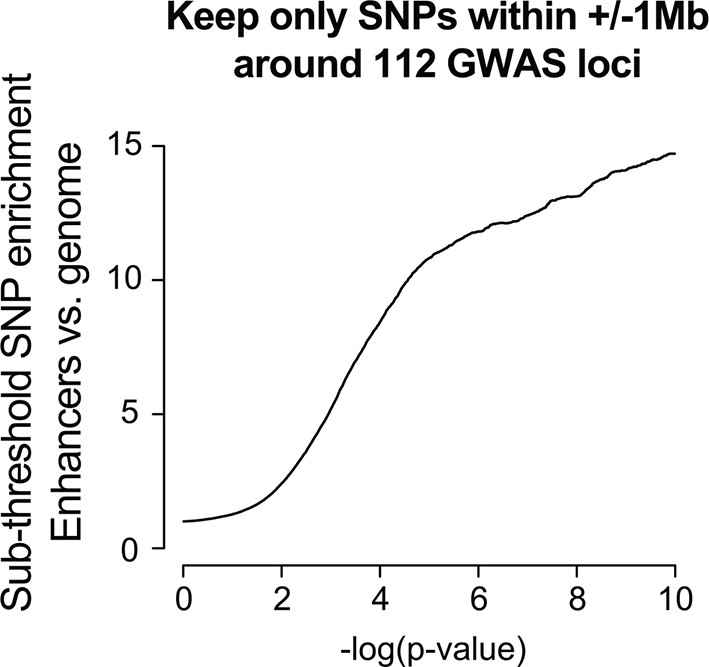
Enrichment in the sub-threshold significance range can be observed using only SNPs nearby known above-threshold loci.
The foreground consisted of only SNPs within +/- 1 Mb of the 112 QT/QRS loci, and was compared against a background of all SNPs in the genome. Enrichment analyses were performed as described for Figure 2.
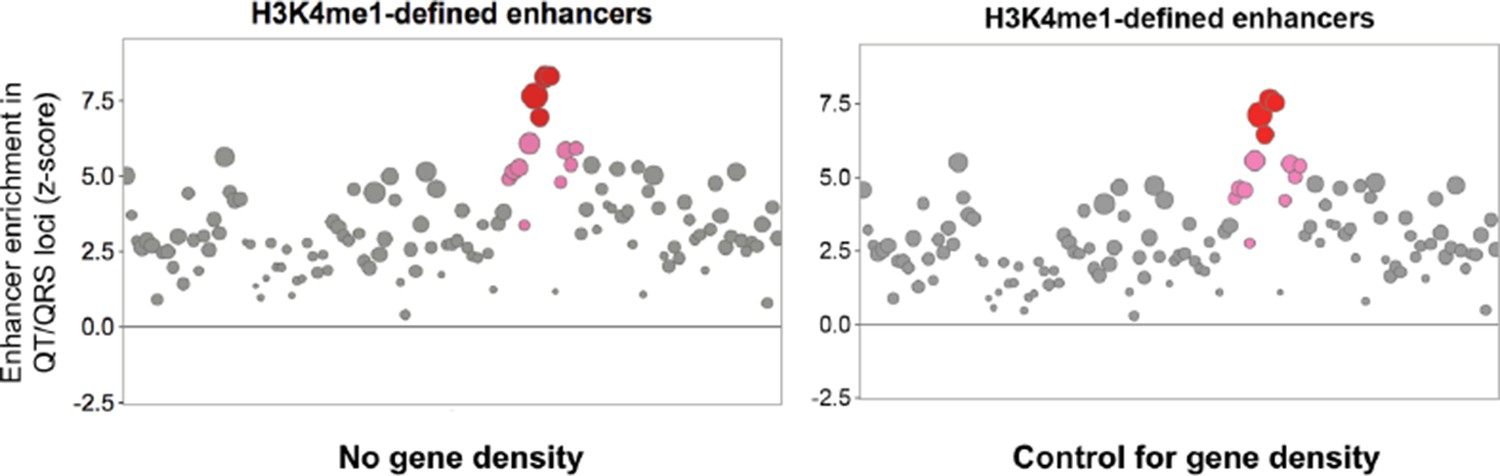
Figure 3—figure supplement 3
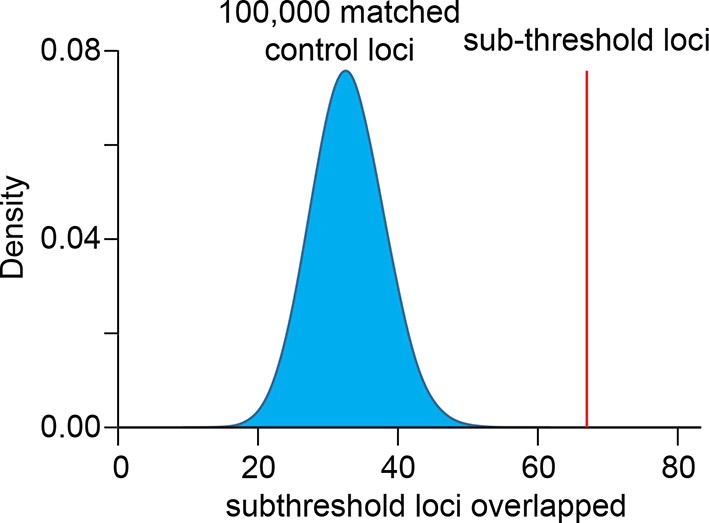
Sub-threshold loci associated with QT interval length are enriched in H3K4me1-defined left ventricle enhancers.
Enrichment was calculated by comparing the number of loci that overlap an enhancer against 100,000 sets of randomly sampled control loci matched for genetic properties (LD block size, MAF, distance to nearest gene, number of nearest genes and presence on genotyping array).
Figure 3—figure supplement 4
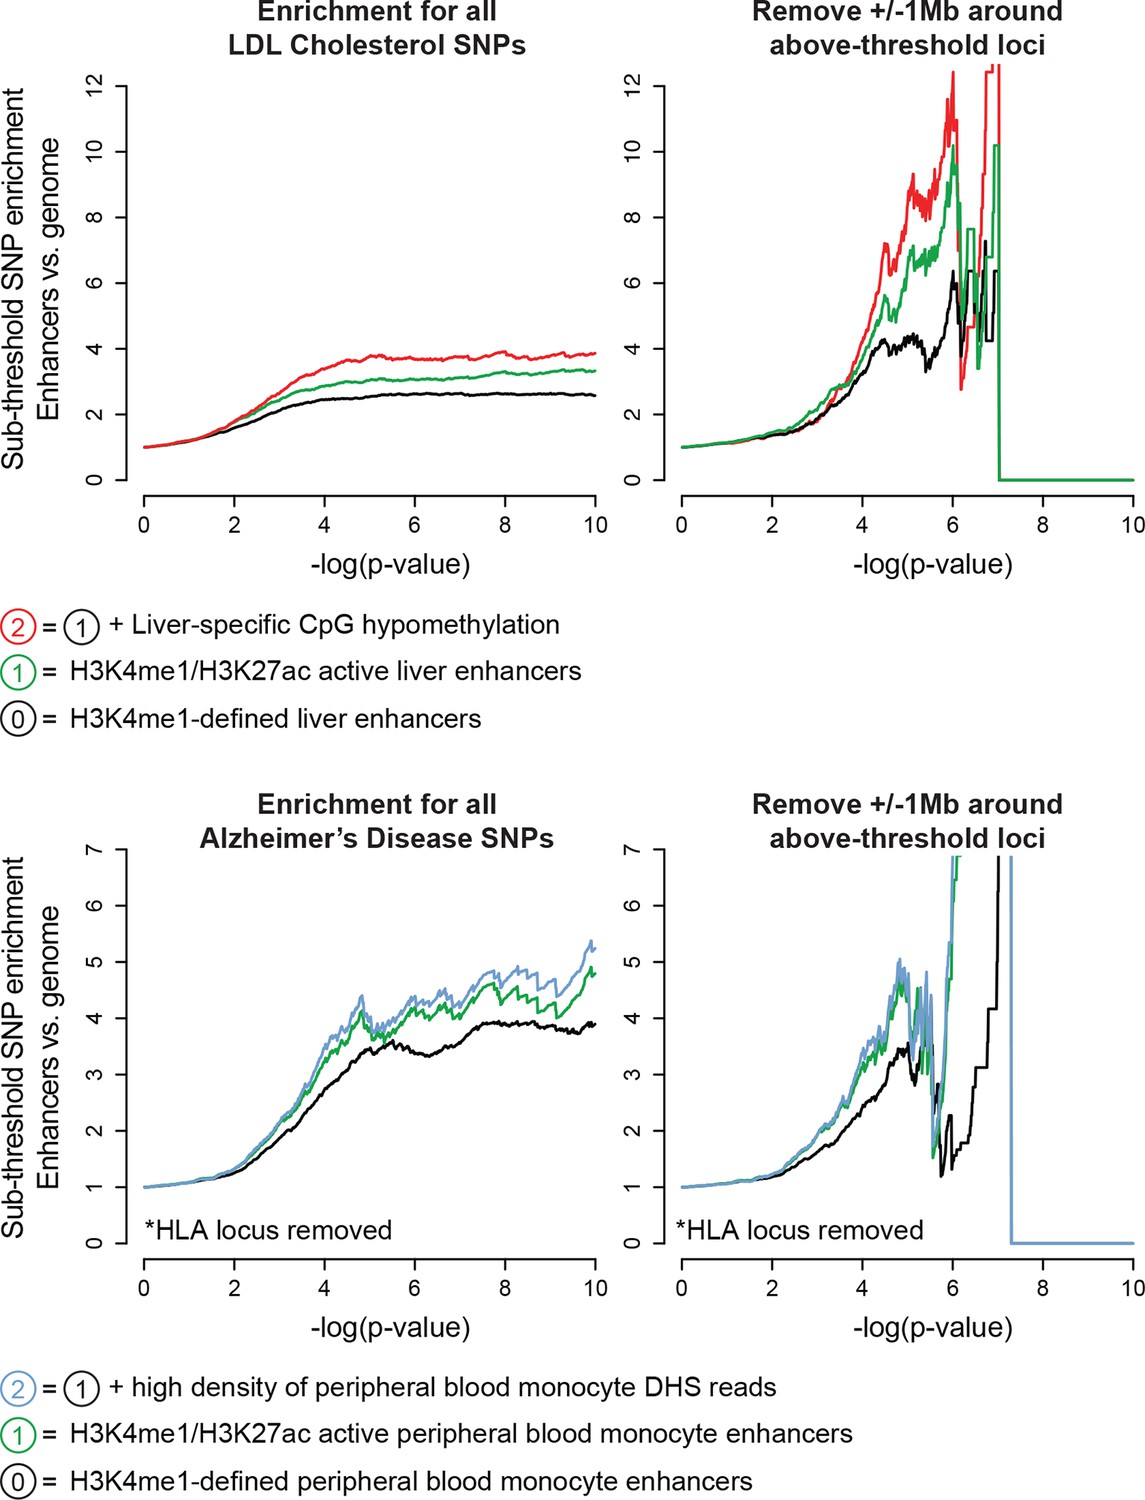
Enhancers harbor additional sub-threshold loci associated with Alzheimer’s disease and LDL cholesterol.
Top, Enhancer characteristics learned for QT/QRS loci (e.g. H3K27ac, CpG hypomethylation) are also effective for enrichment of LDL cholesterol-associated sub-threshold loci in human adult liver enhancers. Bottom, Enrichment of Alzheimer’s disease-associated sub-threshold SNPs in enhancers from peripheral blood monocytes. Tissue type was chosen using results by Gjoneska et al. (2015) computing enrichment of genome-wide significant Alzheimer’s disease loci across enhancers from Roadmap Epigenomics tissues (Gjoneska et al., 2015).
Figure 4 with 3 supplements

Sub-threshold loci prioritized by epigenomics alter enhancer activity.
(a) Model detailing how sub-threshold SNPs overlapping enhancers can affect QT interval. Green text: methods used to test mechanistic step in model. (b) Summary of luciferase enhancer reporter experiments. Left, luciferase enhancer reporter construct. Right, number of loci tested in panel d that exhibits significant allelic activity (p<0.05 between two haplotypes). (c), Left, schematic of a 3-D enhancer-promoter chromatin interaction detectable by 4C-seq. Right, number of loci tested in panel d where an enhancer-promoter interaction is observed in human iPS-derived cardiomyocytes by 4C-seq. (d) Experimental evidence that sub-threshold SNPs alter enhancer activity and that sub-threshold enhancers interact with gene promoters. Fold below GWS column represents degree to which sub-threshold locus is below genome-wide significance (5x10⁻⁸); Luciferase reporter column colored green if significant allelic difference in activity (p<0.05, Figure 4—figure supplement 1); Enhancer-promoter interactions column colored green if there is a detectable enhancer-promoter interaction by 4C-seq (Figure 4—figure supplement 3).
Figure 4—figure supplement 1
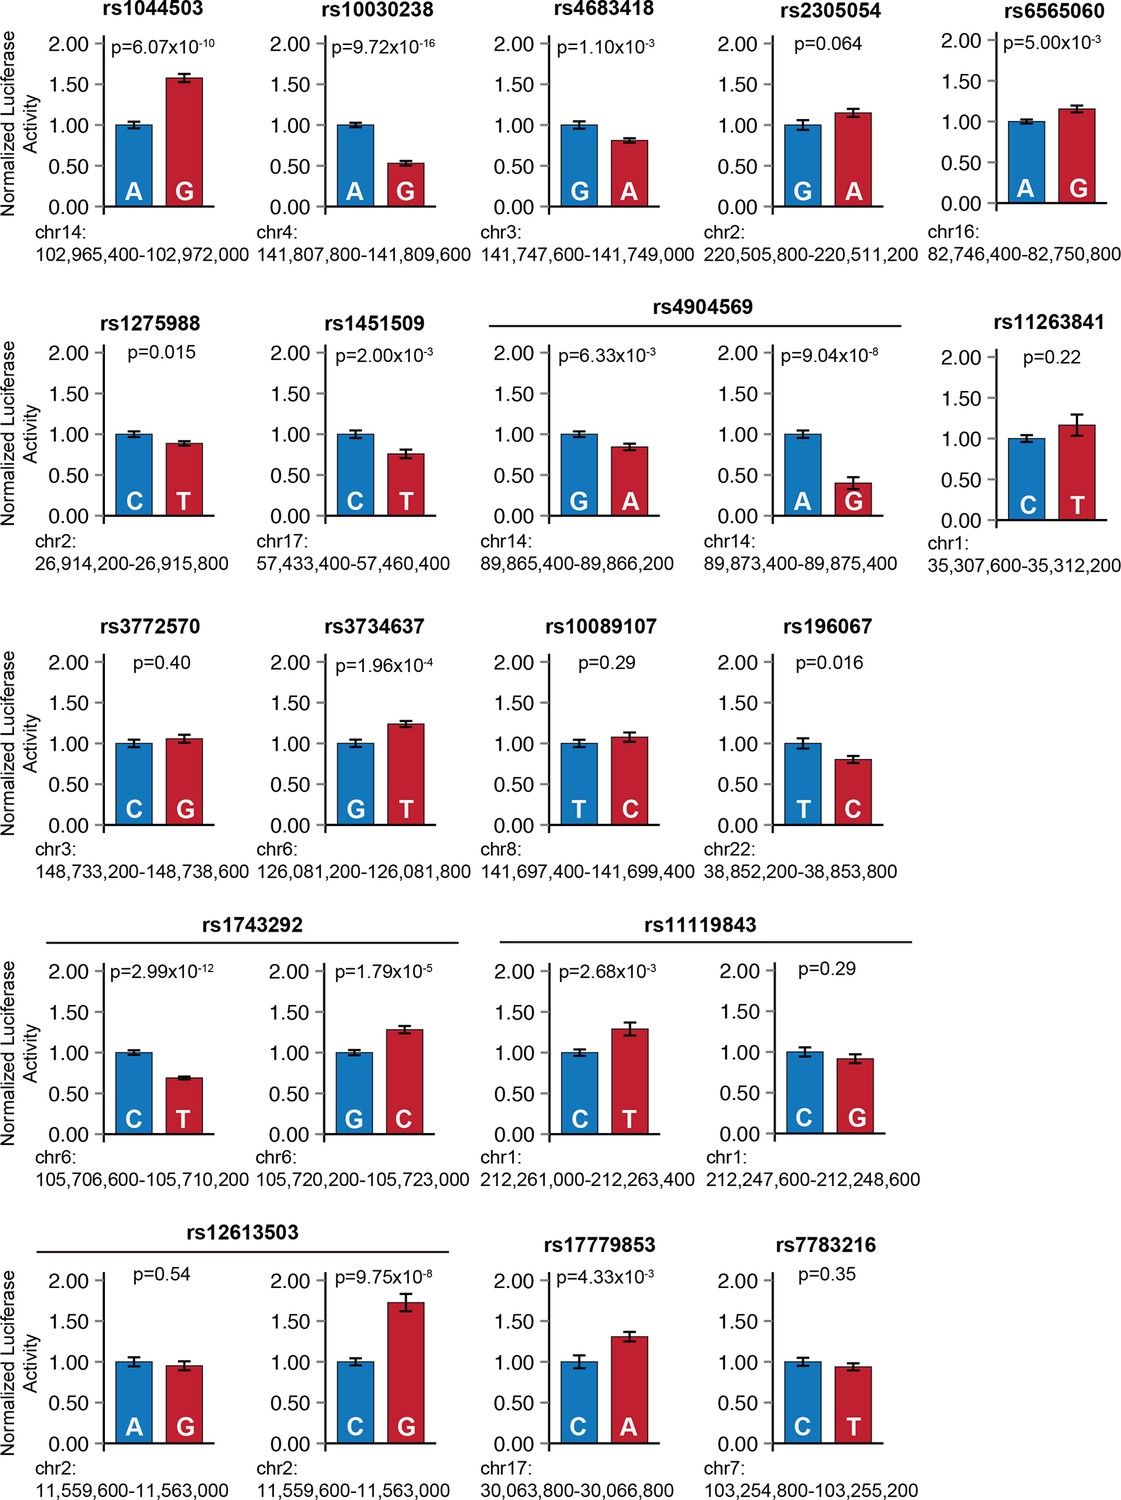
Sub-threshold SNP alleles affect enhancer activity.
For each sub-threshold locus, enhancers carrying one of two haplotypes were cloned upstream of a minimal promoter and firefly luciferase reporter gene. Blue: enhancer carrying reference allele; red: enhancer carrying alternate allele. Error bars represent standard error of the mean.
Figure 4—figure supplement 2
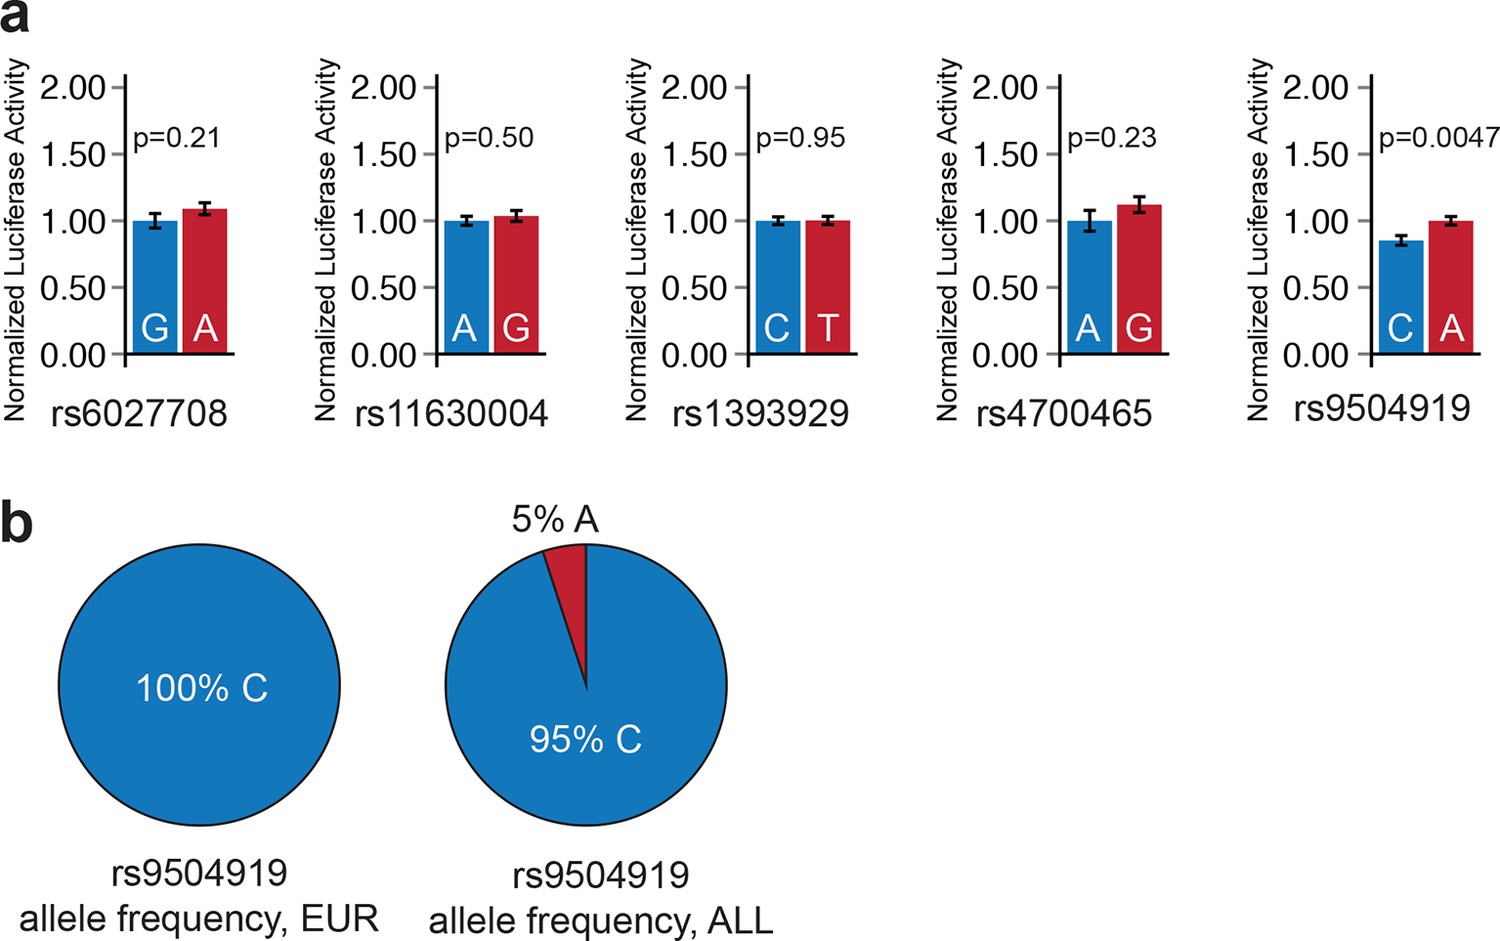
Luciferase enhancer reporter assay for sub-threshold SNPs outside enhancers.
(a) Four of five sub-threshold loci outside enhancers do not drive significant allele-specific enhancer activity (p>0.05). The 1 kilobase window surrounding the sub-threshold SNP was cloned into luciferase enhancer reporter construct. Blue: enhancer carrying reference allele; red: enhancer carrying alternate allele. Error bars represent standard error of the mean. (b) Allele frequency of rs9504919 in human populations. Most human individuals are homozygous for the less active C allele of rs9504919, suggesting that a potential enhancer at rs9504919 could be missed in epigenome profiling studies.
Figure 4—figure supplement 3
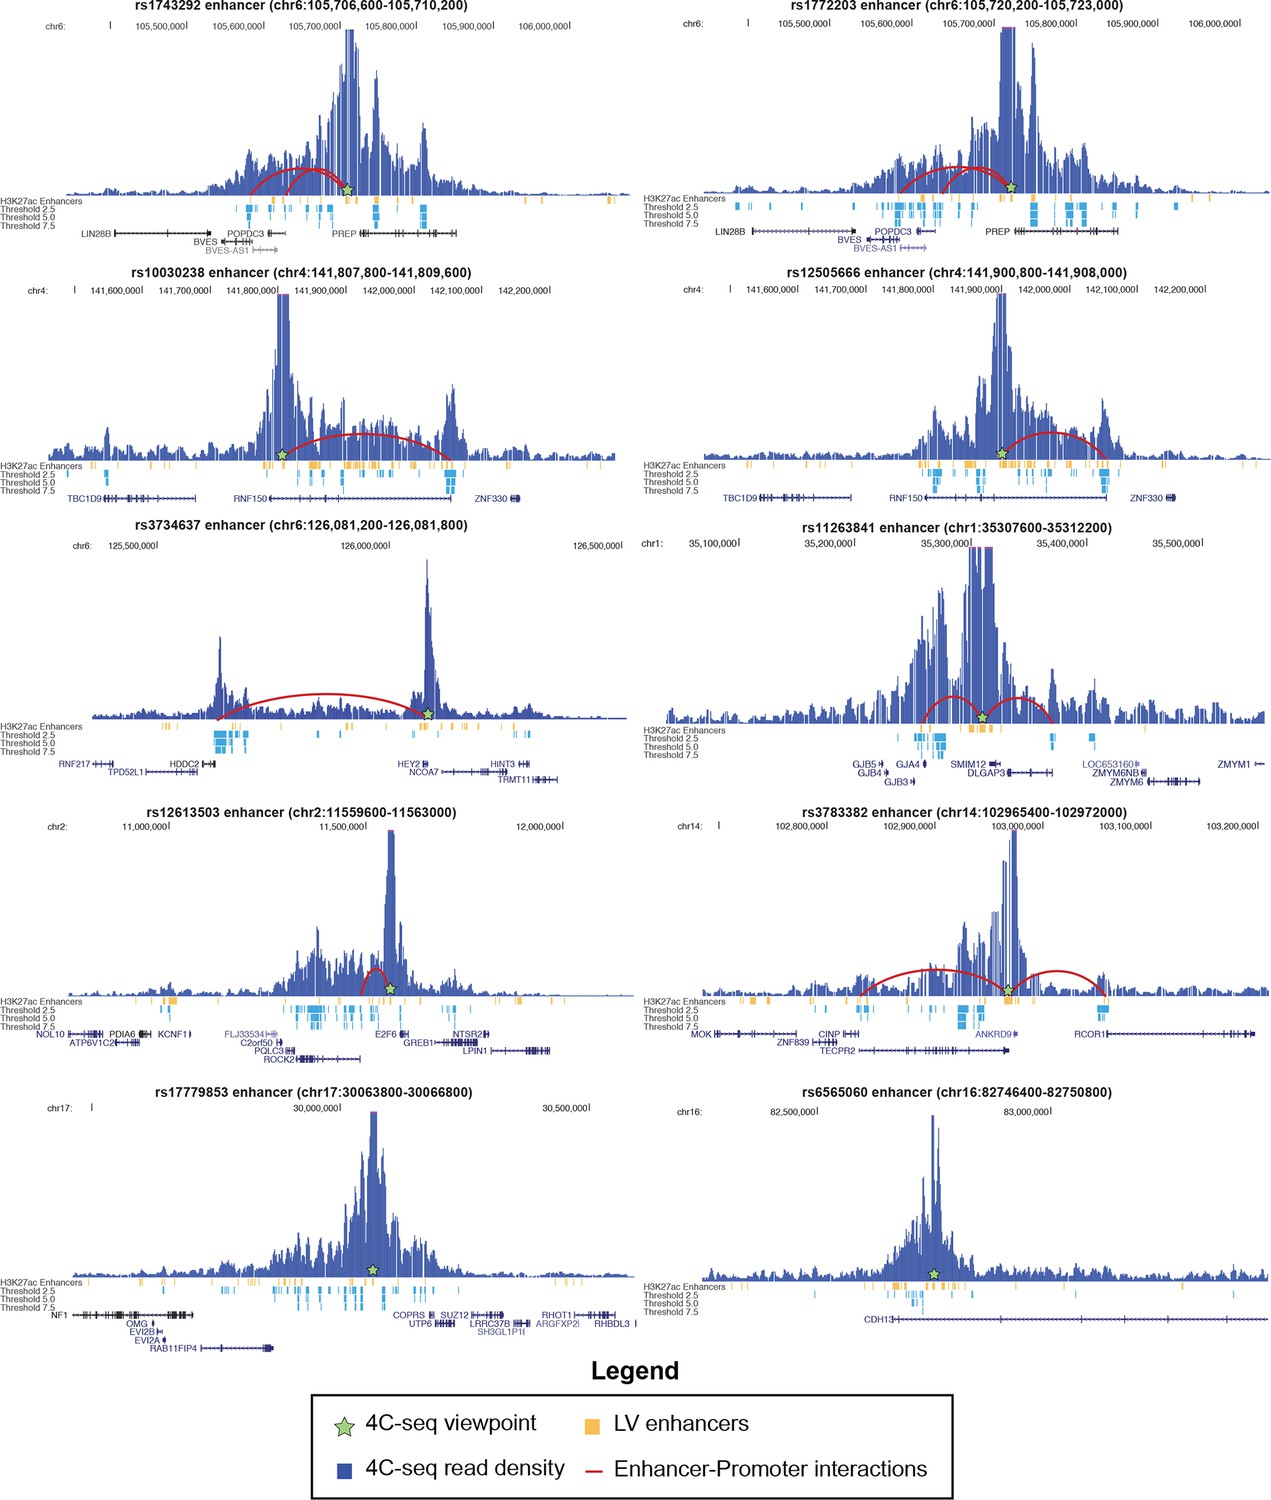
4C-seq interactions with 10 enhancers in 8 sub-threshold loci.
Height of blue bars represents interaction strength with 4C viewpoint. Red curves indicate enhancer-promoter interactions called within an annotated GENCODE promoter (up to 2.5 kb upstream of TSS) at a threshold of 5.0.
Figure 5
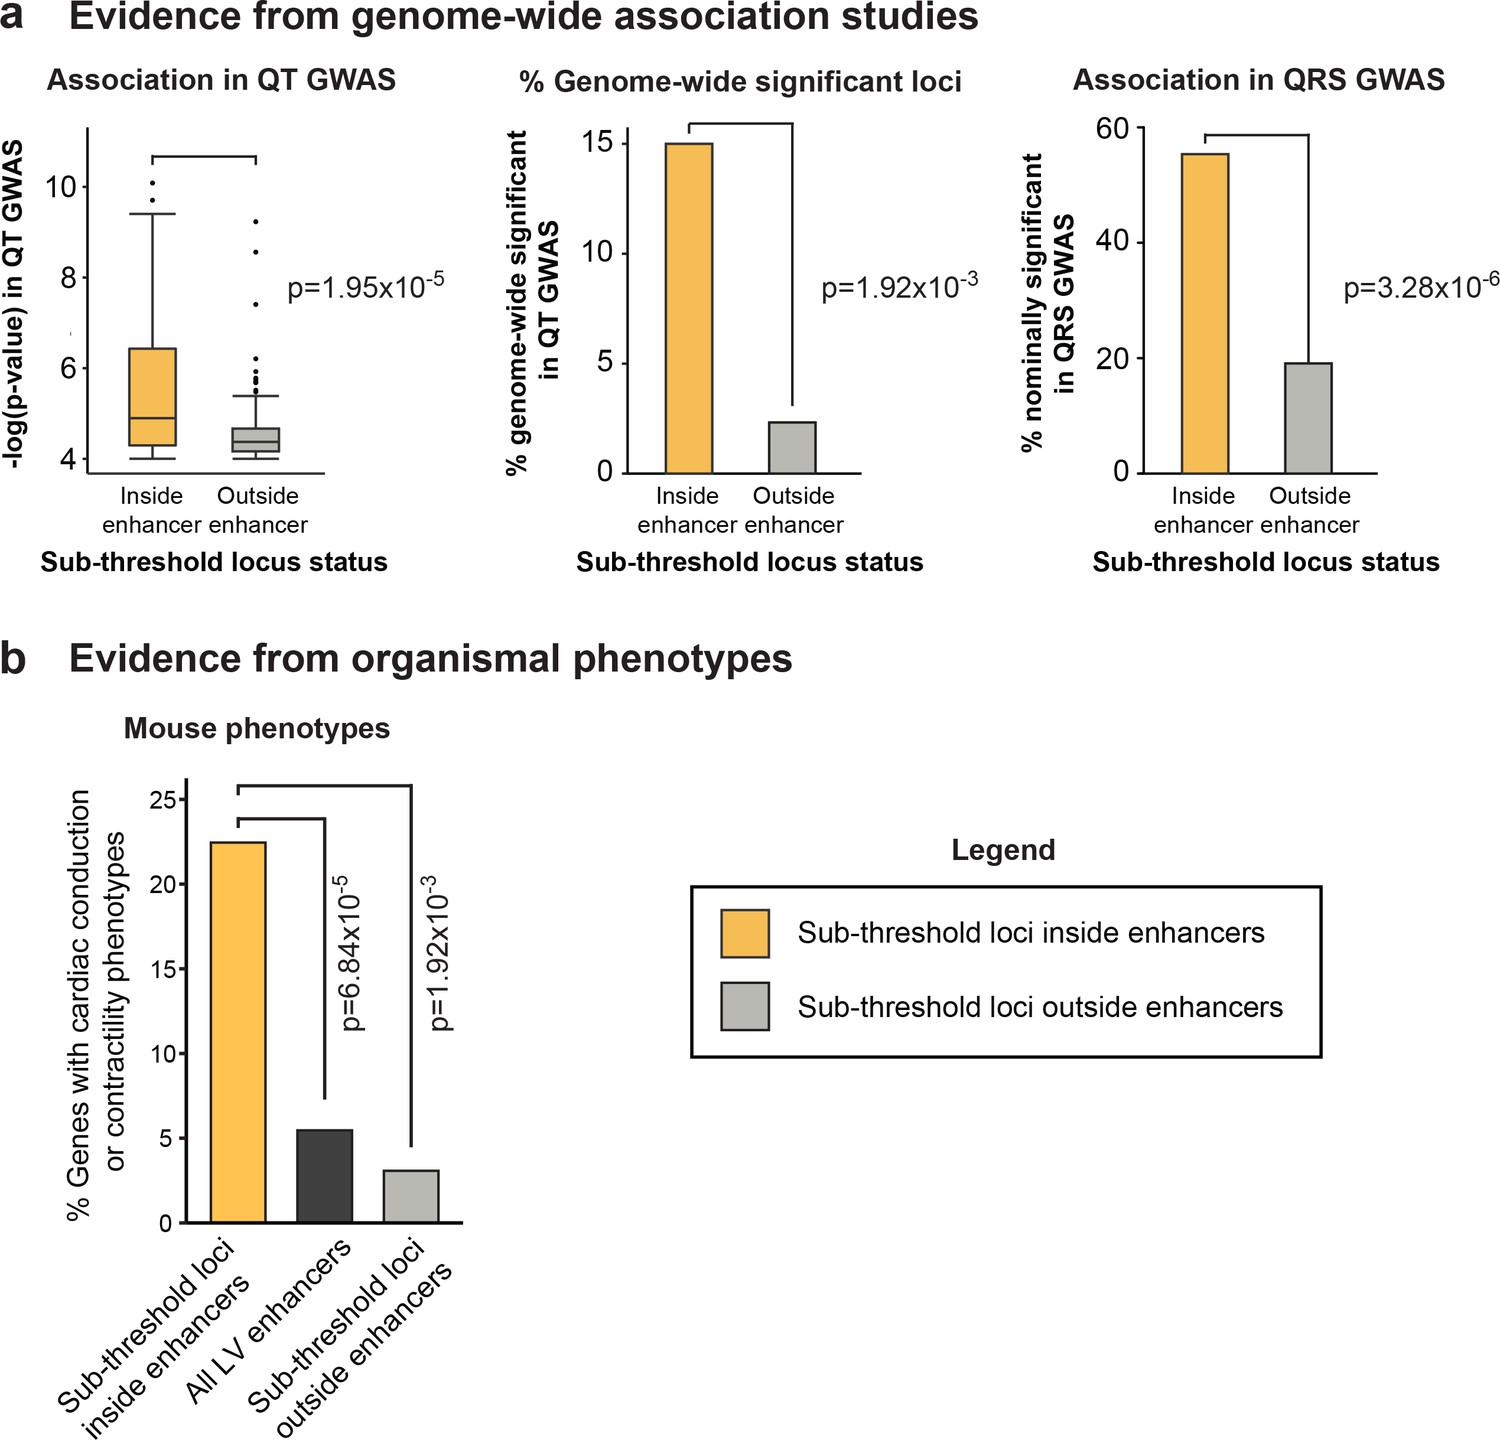
Epigenomic prioritization distinguishes biologically relevant sub-threshold loci
(a) Left, Sub-threshold loci overlapping enhancers have significantly stronger association signals than loci outside enhancers in the QT interval GWAS. Middle, Loci overlapping enhancers have significantly more likely to be newly genome-wide significant in the held-out QT interval GWAS, than loci outside enhancers. Right, Sub-threshold loci overlapping enhancers are significantly more likely to be nominally significant (p<0.05) in QRS GWAS than sub-threshold loci not overlapping enhancers. (b) Genetic perturbation of genes with predicted links to 60 enhancer-overlapping sub-threshold loci are significantly more likely to result cardiac conduction or contractility phenotypes than genes linked to all LV enhancers and genes nearby non-enhancer overlapping sub-threshold loci.
Figure 6 with 2 supplements
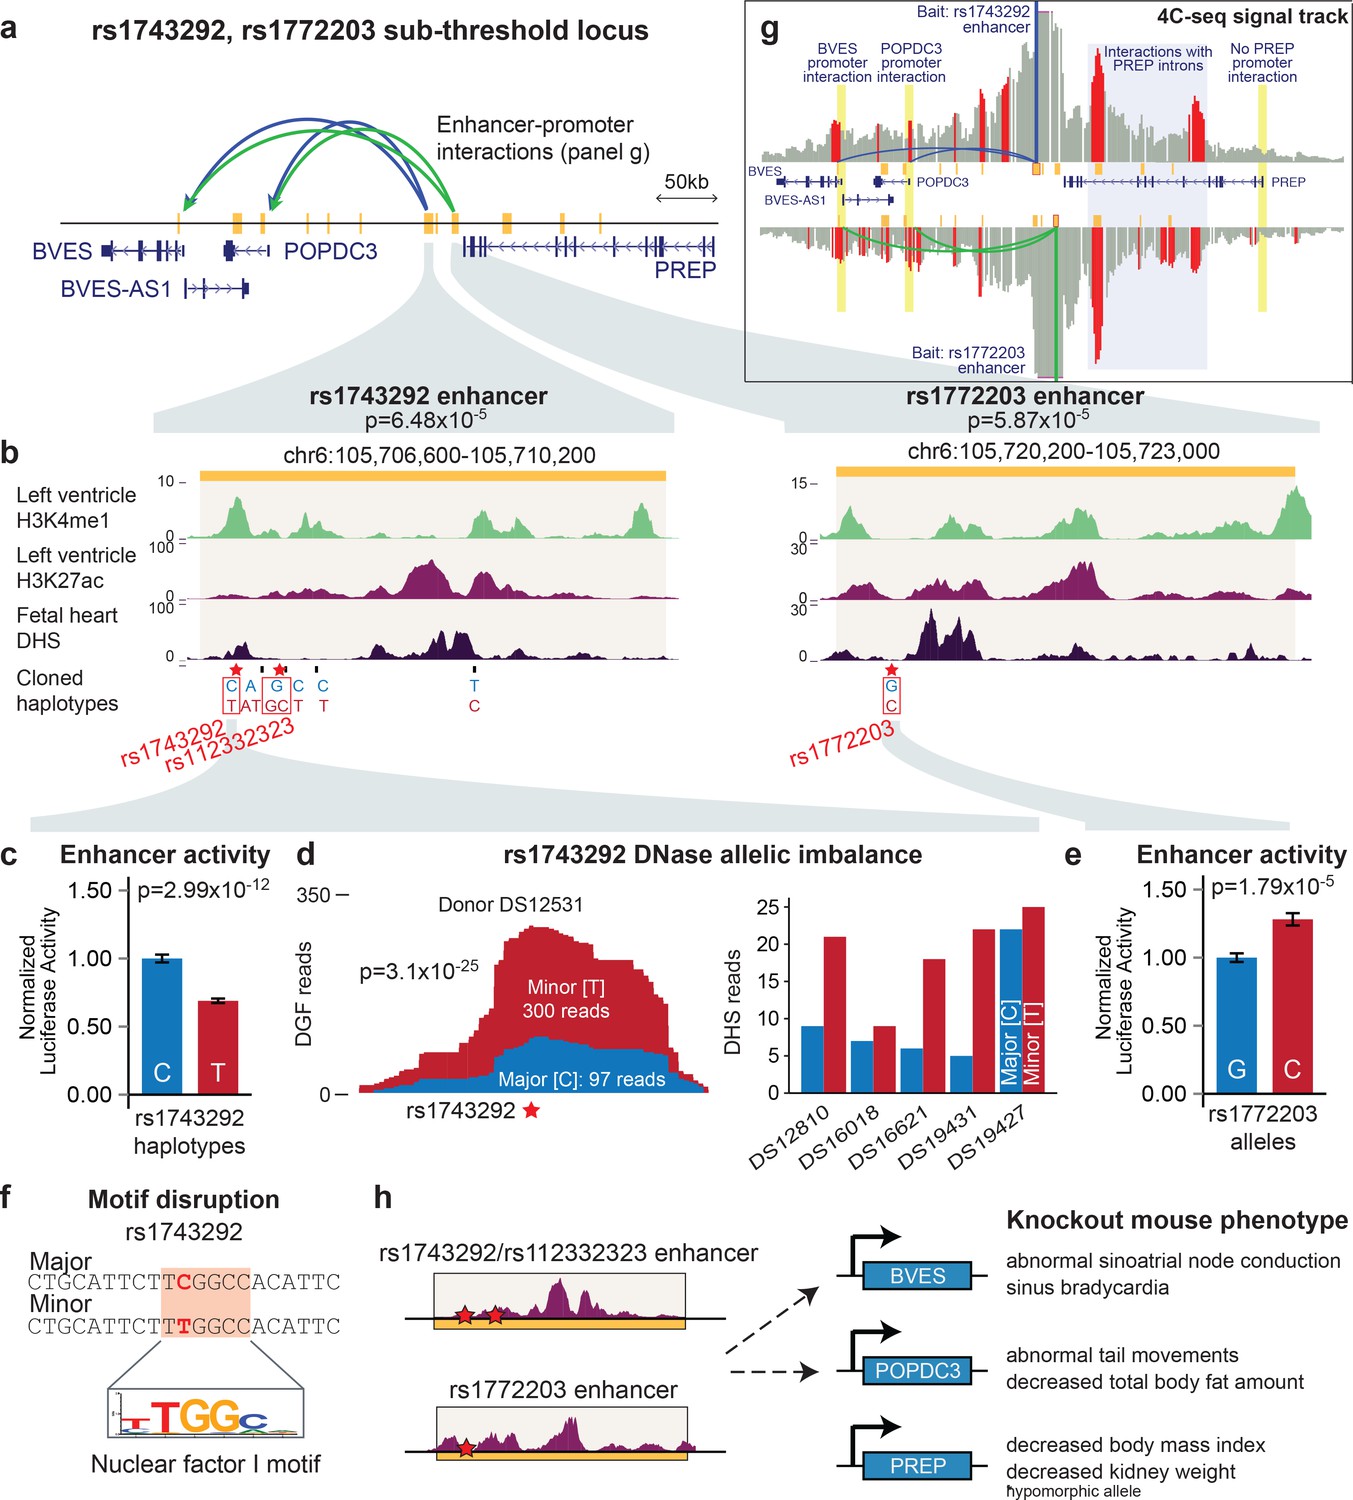
The rs1743292/rs1772203 sub-threshold locus disrupts activity of cardiac enhancers that interact with BVES, a gene important for cardiac electrophysiology.
(a) Overview of rs1743292/rs1772203 sub-threshold locus. Gold rectangles represent predicted active LV enhancers, blue and green lines represent enhancer promoter interactions from the rs1743292 and rs1772203 enhancers, respectively (see panel g). (b) Detailed view of cardiac enhancers overlapping rs1743292 (left) and rs1772203 (right). (c) rs1743292 haplotypes differing at 6 SNPs (listed at bottom of panel b) affect activity of cardiac enhancer in human iPSC-derived cardiomyocytes, n=24 per haplotype. Error bars represent standard error of the mean. (d), Left, rs1743292 alters level of DNase I hypersensitivity in a heterozygous human fetal heart sample. Right, Allelic imbalance of DHS reads at rs1743292 observed for 5 of 5 human individuals. (e) rs1772203 allele affects activity of cardiac enhancer in human iPSC-derived cardiomyocytes, n=16 per allele. Error bars represent standard error of the mean. (f) rs1743292 SNP overlaps a predicted nuclear factor I (NF-I) motif. (g) 4C-seq analysis of the rs1743292 (blue) and rs1772203 (green) enhancers identifies enhancer-promoter interactions with nearby BVES, BVES-AS1 and POPDC3 genes, and additional enhancer-enhancer interactions within introns in PREP. (h) Genetic perturbation of Bves, but not Popdc3 or Prep leads to cardiac electrophysiological defects in mouse models.
Figure 6—figure supplement 1
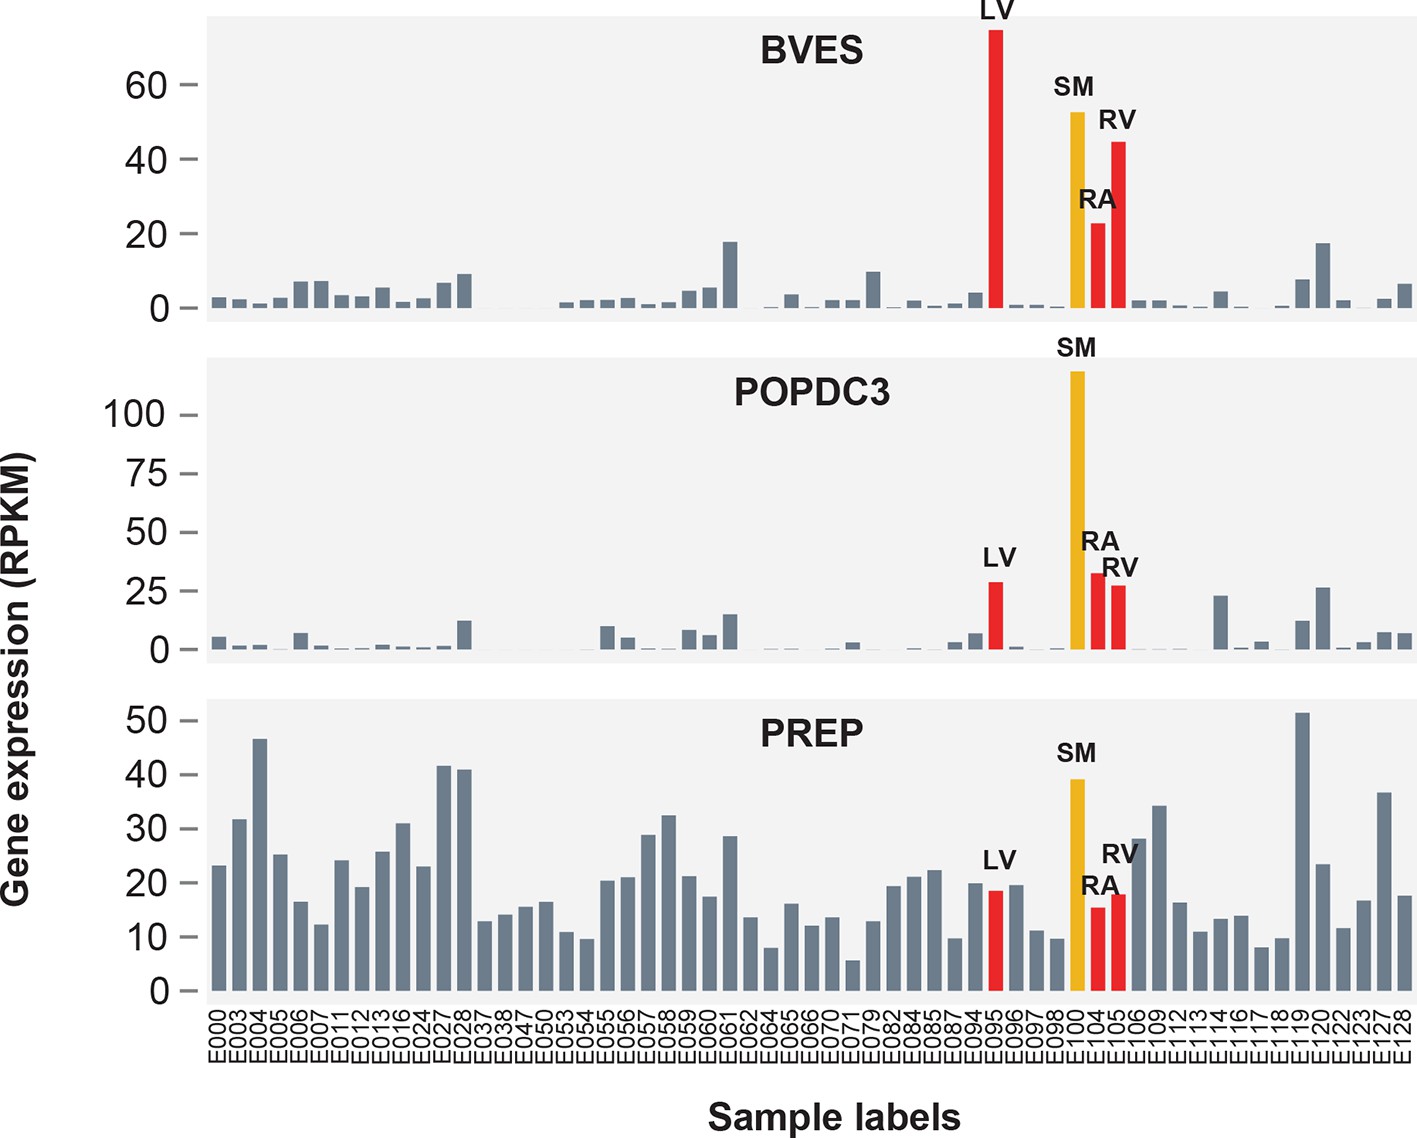
Expression patterns of BVES, POPDC3 and PREP across 59 human tissues.
Red bars correspond to chambers of the adult human heart (LV = left ventricle, RV = right ventricle, RA = right atrium), orange corresponds to skeletal muscle (SM = skeletal psoas muscle). Sample labels (E##) correspond to labels assigned by the Roadmap Epigenomics Consortium anrd available on the Roadmap Epigenomics website <http://egg2.wustl.edu/roadmap/web_portal/meta.html> (Roadmap Epigenomics Consortium, 2015).
Figure 6—figure supplement 2
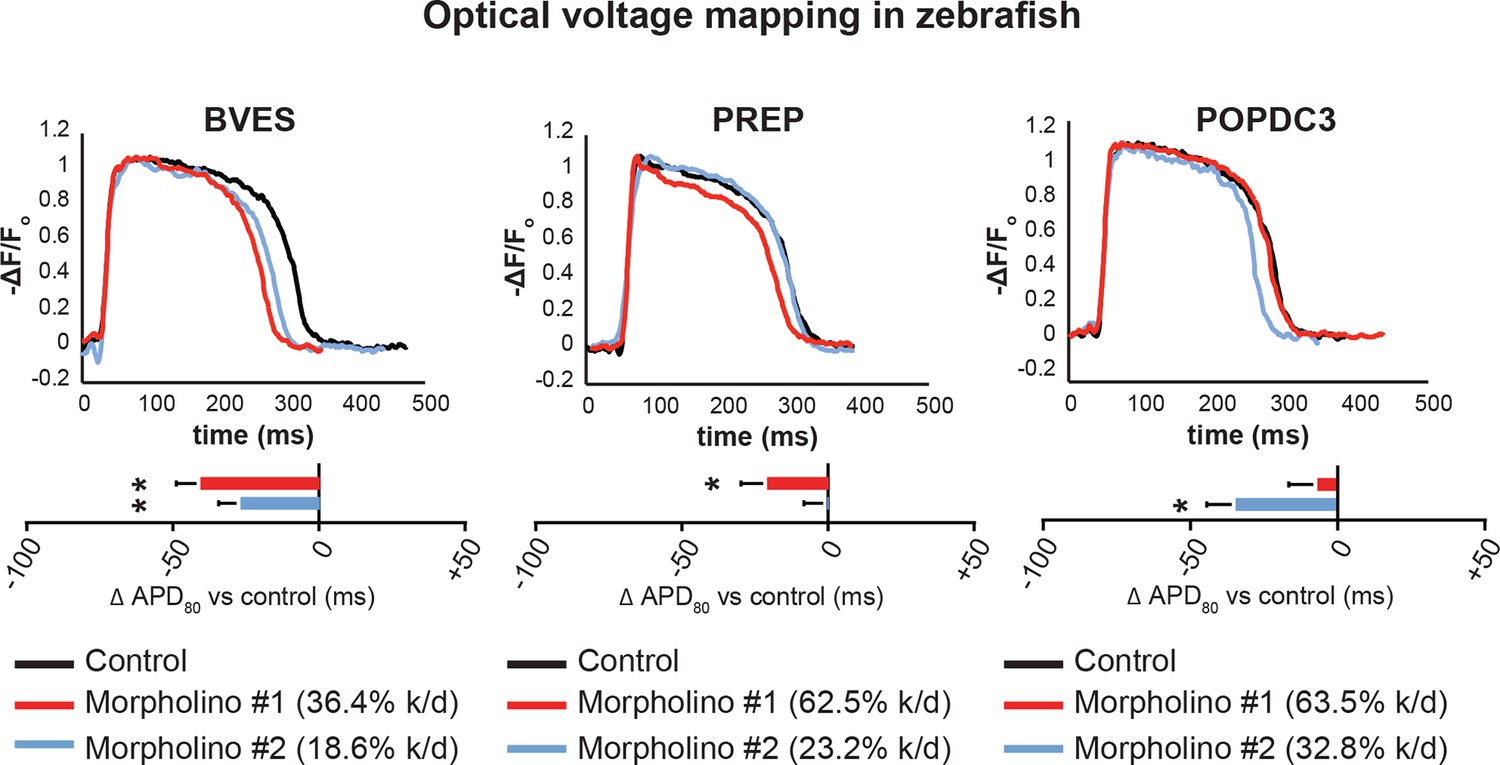
Knockdown of bves in zebrafish leads to ventricular repolarization defects.
Effect of gene knockdown using two independent morpholino sequences (red, blue) on ventricular action potential duration compared against control scrambled morpholino (black). Top: Sample optical voltage mapping traces from one matched morpholino and control knockdown pair. Bottom: Differences in APD80 between control and antisense morpholino oligonucleotide-mediated knockdown zebrafish. * corresponds to p<0.05 from unpaired two-tailed Student’s t-test, n=19 for control scrambled morpholinos, n=20 for each morpholino targeting BVES, POPDC3, or PREP transcripts, error bars represent standard error of the mean.
Author response image 1
Author response image 2

Additional files
-
Supplementary file 1
List of 112 QT/QRS loci compiled from NHGRI GWAS catalog, with corresponding study (sheet 1).
List of 112 QT/QRS loci overlapping enhancers from each of four cardiac samples (sheet 2).
- https://doi.org/10.7554/eLife.10557.021
-
Supplementary file 2
List of sub-threshold SNPs overlapping H3K4me1-defined LV enhancers (left columns) and H3K4me1/H3K27ac-defined active LV enhancers (right columns).
Coordinates correspond to hg19 (sheet 1). List of candidate genes predicted to interact with sub-threshold loci within active LV enhancers by enhancer-gene linking algorithm (sheet 2). The list of sub-threshold SNPs is shorter than in Sheet #1 because some sub-threshold SNPs were excluded if the p-value was weaker than the most statistically significant SNP in LD (r2>0.2, see Materials and methods).
- https://doi.org/10.7554/eLife.10557.022
-
Supplementary file 3
List of primer sequences and enhancer sequences used for generating enhancer reporter constructs (sheet 1) and list of primers used for 4C-seq library construction (sheet 2).
- https://doi.org/10.7554/eLife.10557.023
Download links
A two-part list of links to download the article, or parts of the article, in various formats.
Downloads (link to download the article as PDF)
Open citations (links to open the citations from this article in various online reference manager services)
Cite this article (links to download the citations from this article in formats compatible with various reference manager tools)
Discovery and validation of sub-threshold genome-wide association study loci using epigenomic signatures
eLife 5:e10557.
https://doi.org/10.7554/eLife.10557


