Loss of olfaction reduces caterpillar performance and increases susceptibility to a natural enemy
- Laboratory of Entomology, Wageningen University and Research, Netherlands
- Biosystematics Group, Wageningen University & Research, Netherlands
- Business Unit Bioscience, Wageningen University & Research, Netherlands
Figures
Figure 1 with 4 supplements
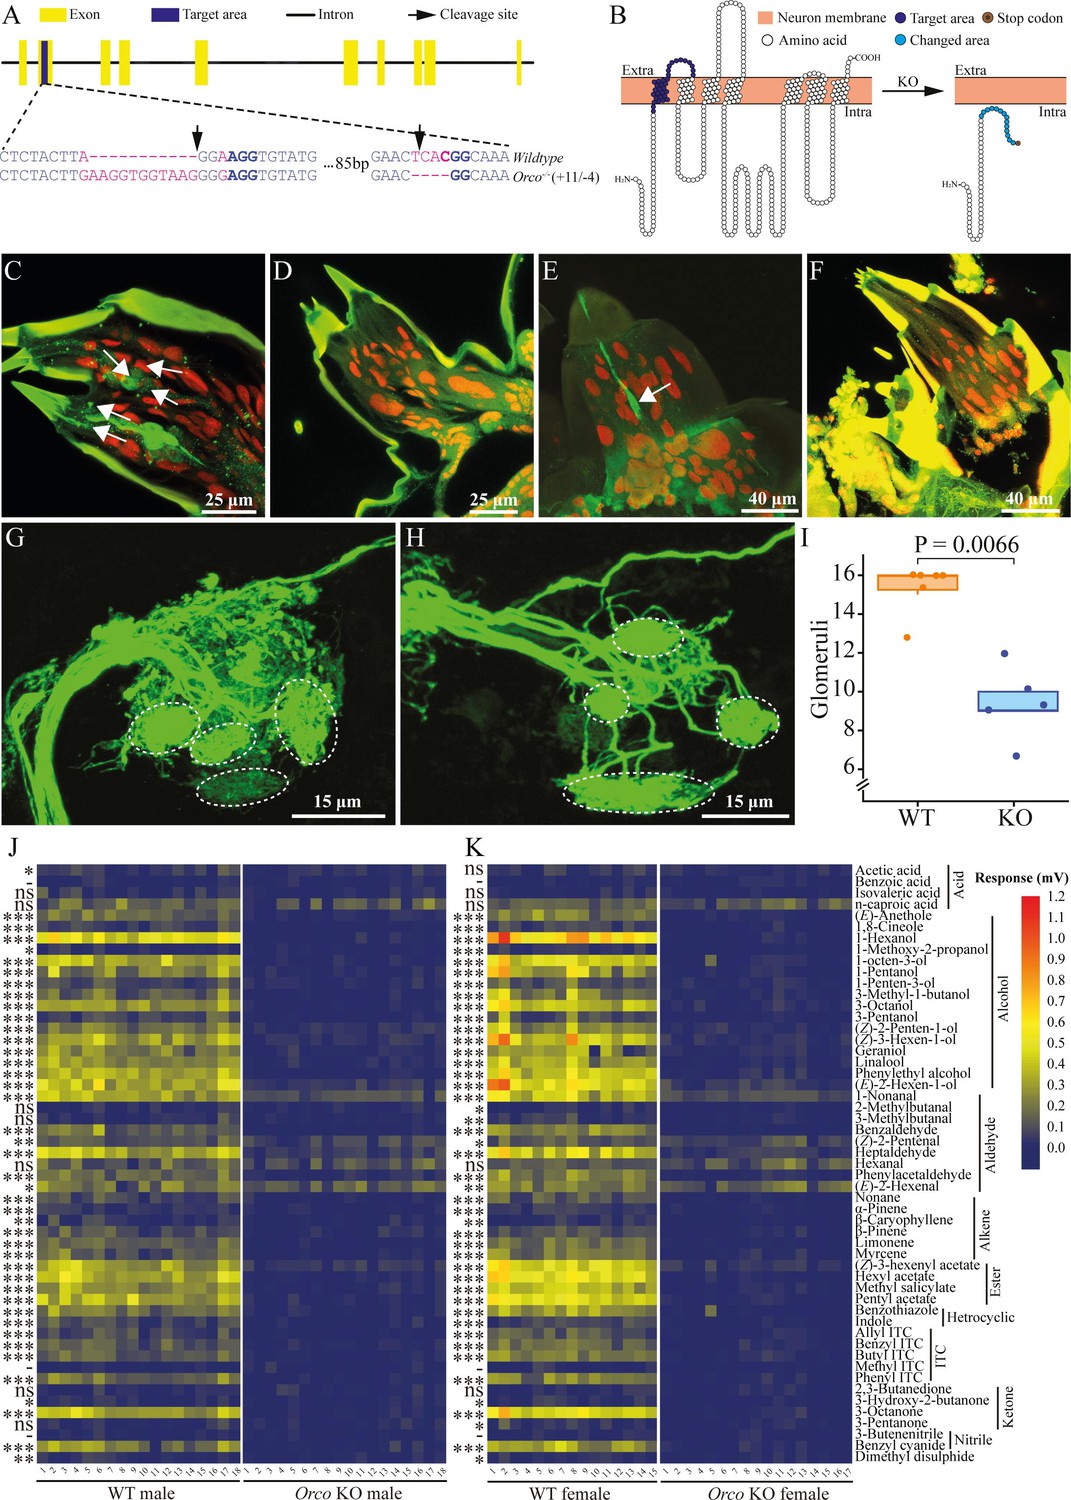
Orco knockout (KO) by CRISPR/Cas9 and verification in Pieris brassicae.
(A) Gene structure of Orco. Yellow blocks indicate exons, and blue blocks indicate target areas in the second exon. Black solid line indicates intron. Black arrows indicate the designated cleavage site of the Cas9 protein. The target KO area is magnified to show the sequence. Blue letters indicate base pairs in the second exon segment, purple letters indicate mutation sites. Protospacer adjacent motif (PAM) sequences are in blue bold. (B) Predicted transmembrane structure of Orco. The left and right panels represent wildtype (WT) Orco and mutated Orco transmembrane domains, respectively. Orange blocks indicate odorant receptor neuron (ORN) membrane, extracellular (Extra), and intracellular (Intra) are shown. White circles indicate amino acids of Orco, blue circles on the left panel indicate the target mutation area. Cyan circles and the brown circle on the right panel indicate the mutated area and the early stop codon, respectively. Orco-positive ORNs and larval antennal center (LAC). P. brassicae larval antennae and LAC staining. (C) ORNs were stained (green cells, several are indicated by white arrows) in WT larval antennae. (D) ORNs were not stained in Orco KO larval antennae. (E) An ORN was stained (green cell, indicated by white arrow) in WT larval palps. (F) ORNs were not stained in KO larval palps. (G) Glomeruli in the LAC of a WT brain. (H) Glomeruli in the LAC of a KO brain. Glomeruli are indicated by white dashed circles in (G) and (H) (not directly corresponding). (I) Number of glomeruli counted in WT caterpillar brain (orange) and Orco KO caterpillar (blue) brain (n = 6 for WT and n = 5 for KO). A significant difference was detected by the Wilcoxon rank-sum test. (J) Electroantennogram (EAG) response of male butterflies (n = 18 for both WT and KO). (K) EAG response of female butterflies (n = 15 for WT and n = 17 for KO). Left panels represent WT butterfly EAG responses, and right panels represent KO butterfly EAG responses. Significant differences between WT and KO butterflies were identified using Student’s t-test when the data were normally distributed and the variances were equal or using a Kruskal–Wallis rank-sum test when these criteria did not apply. Significance levels are indicated by asterisks, ns: p > 0.05; *0.01 < p < 0.05; **0.001 < p < 0.01; ***p < 0.001; -: no response recorded from WT butterfly antennae. Butterfly antennal responses (mV) to the tested chemicals are indicated by a color scale from navy (0 mV) via yellow to red (1.2 mV).
Figure 1—figure supplement 1
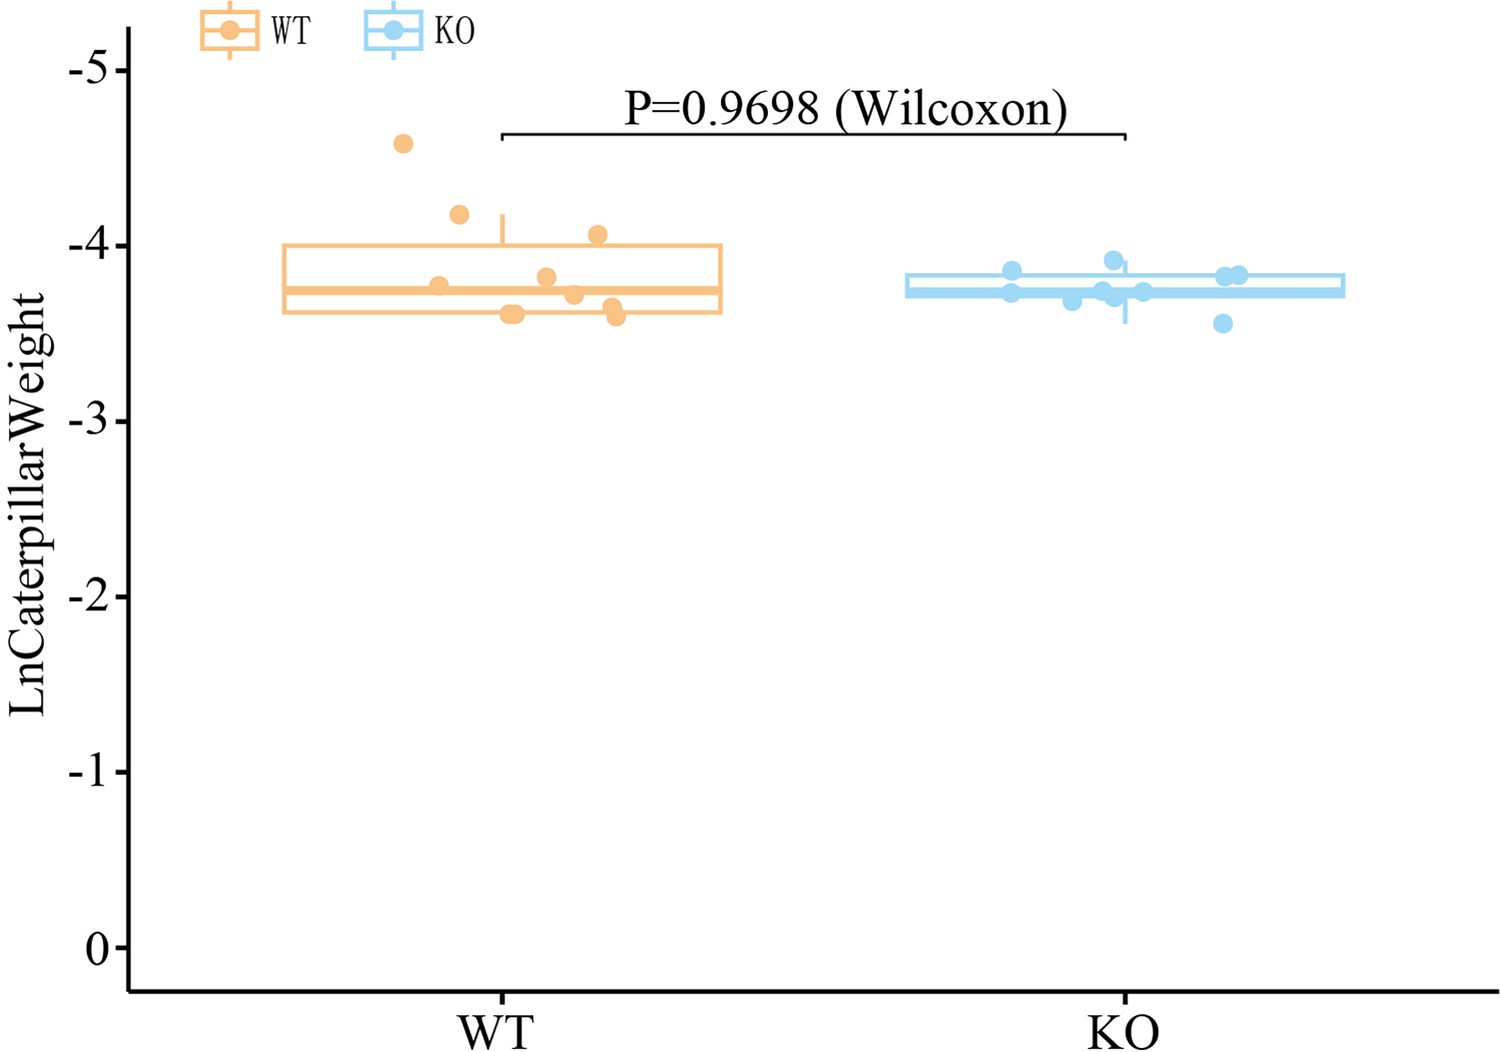
Pieris brassicae caterpillar development in a Petri dish environment.
The x-axis indicates the date since caterpillars have been deposited in the Petri dish. y-axis indicates the weight of caterpillars (Ln Weight). Caterpillar weight (n = 10 for both genotypes) in this figure is presented by the median of a group of caterpillars weight in each Petri dish on day 6. Differences were tested by using a Wilcoxon rank-sum test.
Figure 1—figure supplement 2

Egg-hatching rates by wildtype (n = 11), Orco−/−_fert (n = 4), and Orco−/−_unfert (n = 10) butterflies.
Orco−/−_fert represents mated Orco female butterflies, Orco−/−_unfert represents unmated female butterflies. Differences were tested using a Kruskal-Wallis test fowolled by a Holm-corrected Wilcoxon rank-sum test.
Figure 1—figure supplement 3
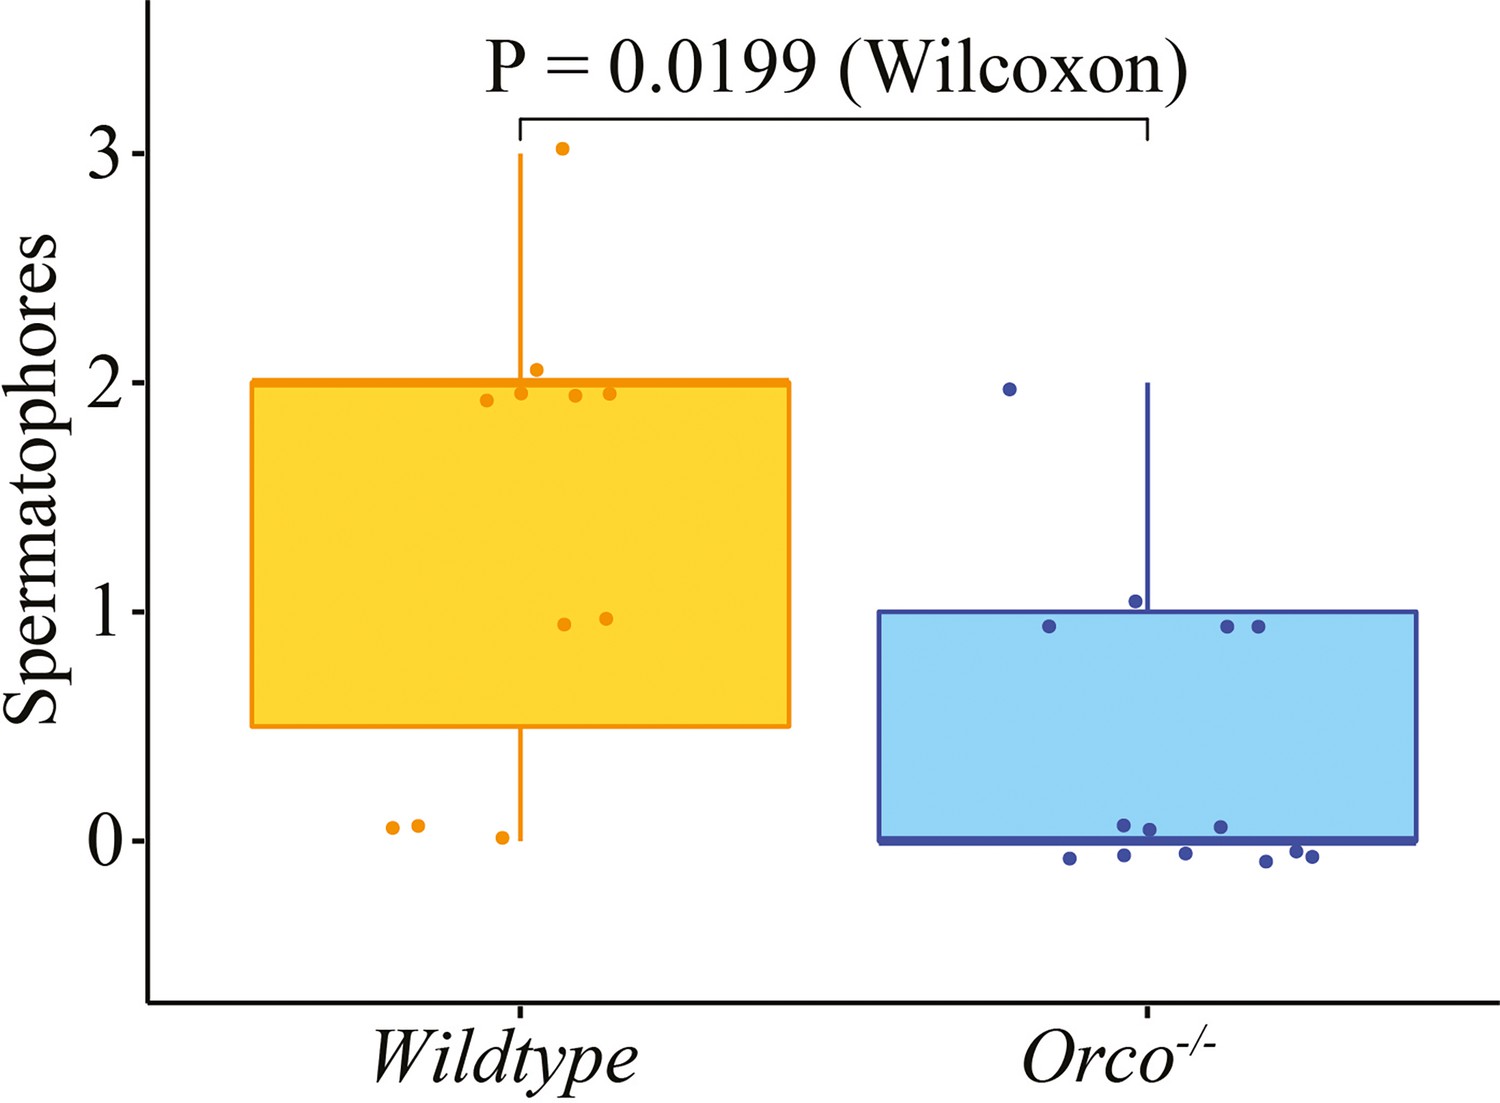
Mating frequency of Pieris brassicae butterflies.
The boxplots indicate the number of spermatophores in wildtype (WT) female butterflies (n = 11) and in knockout (KO) butterflies (Orco−/−) (n = 14), and the difference was tested by using the Wilcoxon rank-sum test. WT and Orco KO butterfly spermatophores are indicated in orange and blue, respectively.
Figure 1—figure supplement 4
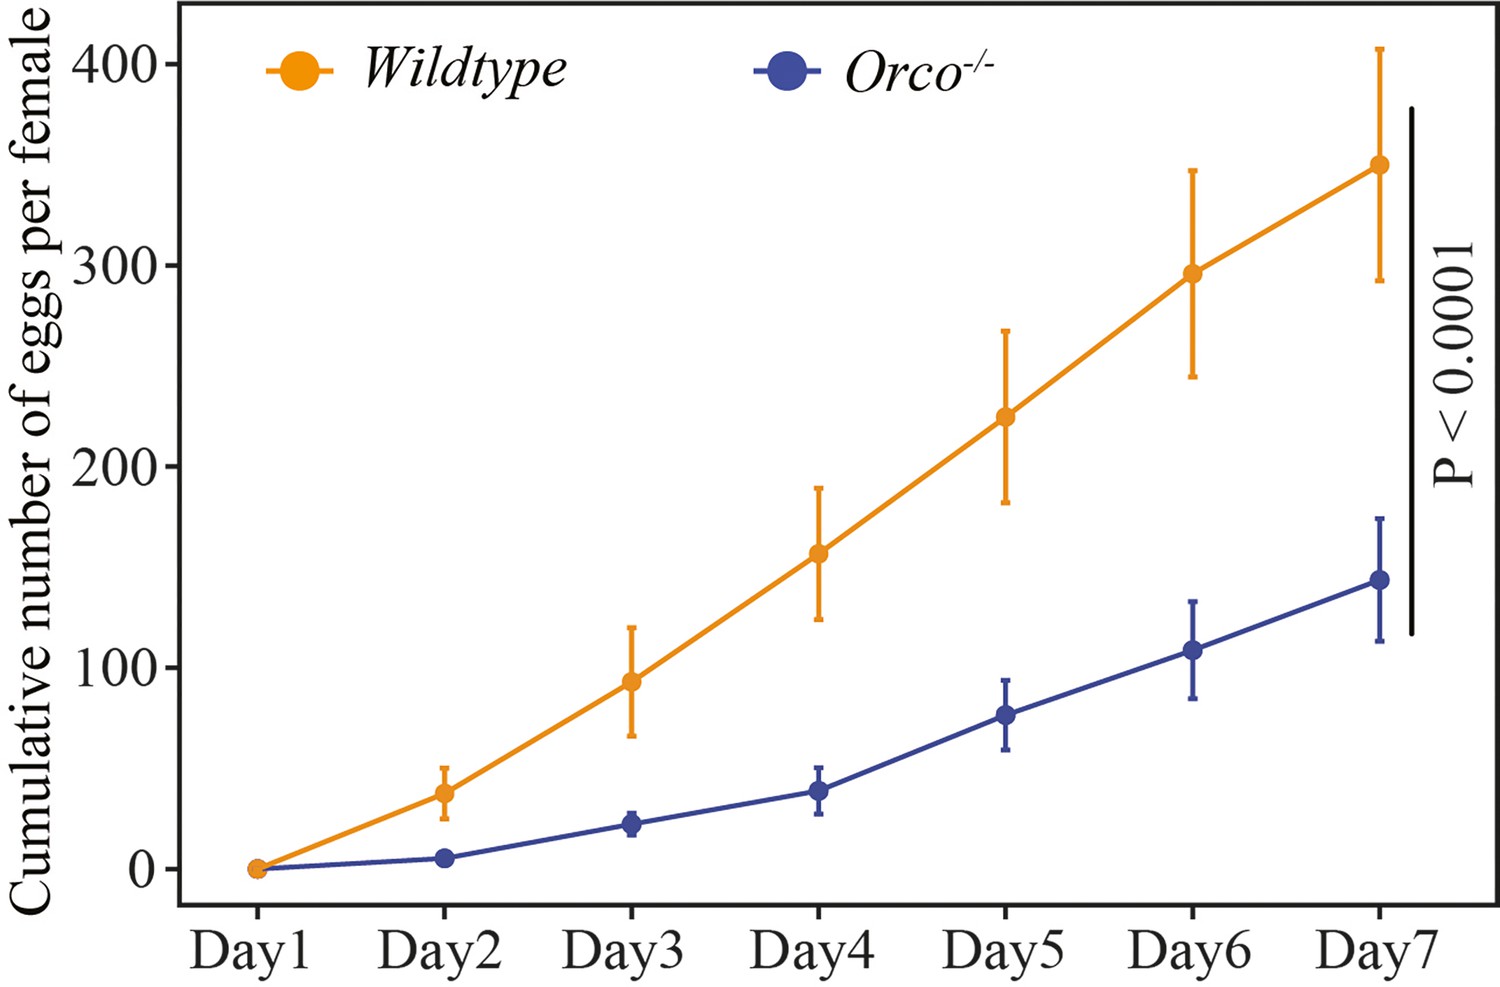
Pieris brassicae wildtype (WT) and Orco knockout (KO; Orco−/−) butterfly oviposition dynamics.
The orange line indicates the number of eggs per female (mean ± SE) laid by WT butterflies (n = 11), the blue line indicates the number of eggs laid by Orco KO butterflies (n = 14). Differences were analyzed using a generalized linear model (GLM) with negative binomial distribution, and difference test results are shown in the line chart.
Figure 2
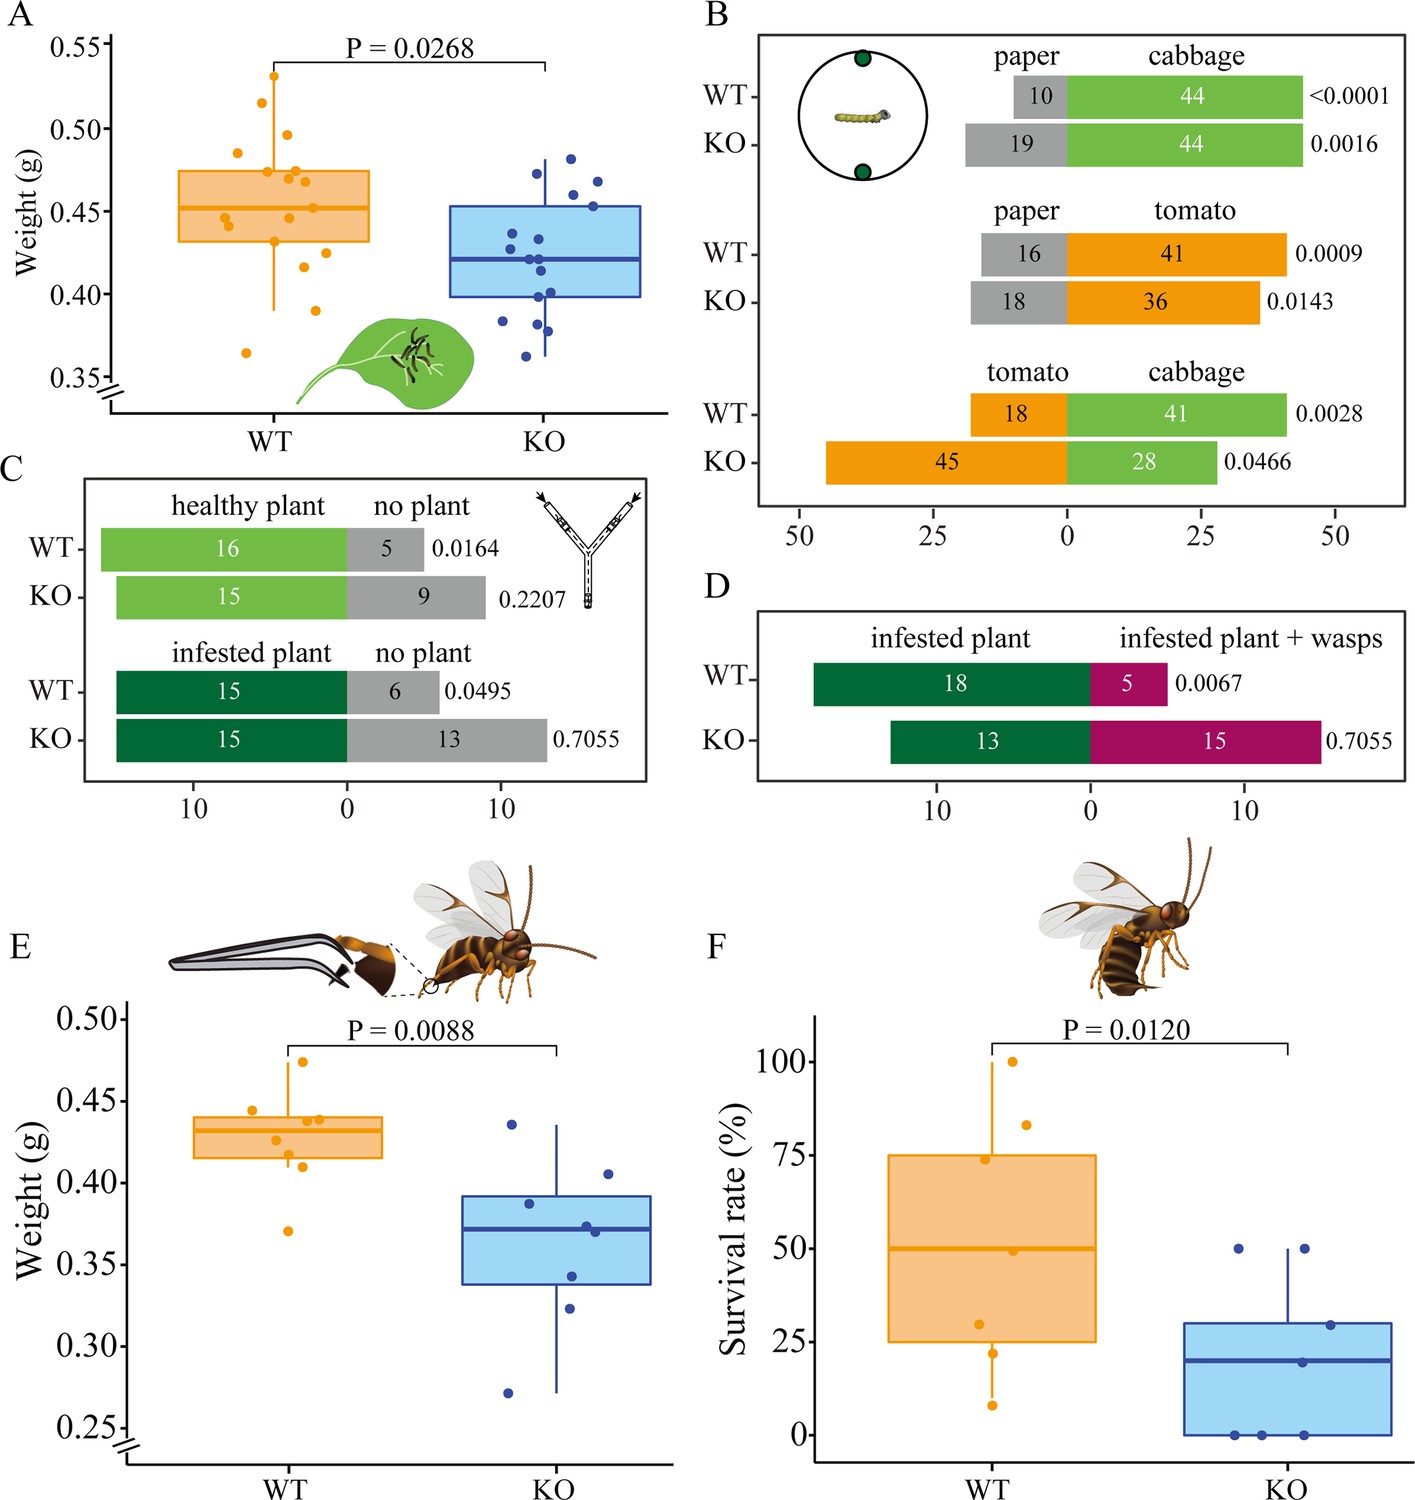
Pieris brassicae caterpillar growth and foraging behavior.
(A) P. brassicae caterpillar growth on cabbage plants, y-axis shows weight (g) of wildtype (WT) and knockout (KO) caterpillars after 10 days of feeding, n = 17. (B) Caterpillar behavioral choices in a Petri dish. The numbers of caterpillars that chose one of the two discs are shown in the respective bars (n = 54–73). Schematic drawing shows behavioral setup. Petri dish diameter was 188 mm, disc diameters were 13 mm. Discs in the Petri dish represent cabbage, paper, and tomato leaf discs. Gray bars indicate paper disc choices, light green indicates cabbage leaf disc choices, and orange indicates choices for tomato leaf discs. (C) Caterpillar behavioral choices in Y-tube olfactometer without parasitoid wasps. A schematic drawing shows the Y-tube olfactometer. The dashed line indicates a black metal Y wire in the center of glass Y-tube olfactometer. The main arm of the Y-olfactometer is 200 mm length, the lateral arms are 275 mm length, and the angle between the lateral arms is 80°. Light green, dark green, and gray bars represent choices for healthy plant, infested plant, and no plant, respectively. Healthy plant, plants were not treated; no plant, an empty jar without any insect or plant; infested plant, plants were infested by early L3 caterpillars. (D) Caterpillar behavioral choices in Y-tube olfactometer with parasitoid wasps. Different treatments are in different colors. Dark green, infested plant − wasps; magenta, infested plant + wasps. Significant differences were tested between WT and KO caterpillars or between two discs by Chi-square test in panels B–D, p-values are shown on the right side of each bar. (E) P. brassicae caterpillar growth when exposed to disarmed C. glomerata female parasitoids, y-axis shows weight (g) of caterpillars after 10 days of feeding, n = 8 for both genotypes. Schematic drawing shows disarmed female C. glomerata (ovipositor removed). (F) P. brassicae caterpillar survival rate when exposed to healthy C. glomerata female wasps, n = 7 for both genotypes. Significant differences in development and survival rate were assessed using a one-tailed Student’s t-test, p-values are indicated above boxplots. A schematic drawing shows a healthy female C. glomerata (unmanipulated). In both panels, orange boxplots indicate WT caterpillars, and blue boxplots indicate Orco KO caterpillars.
Figure 3 with 7 supplements
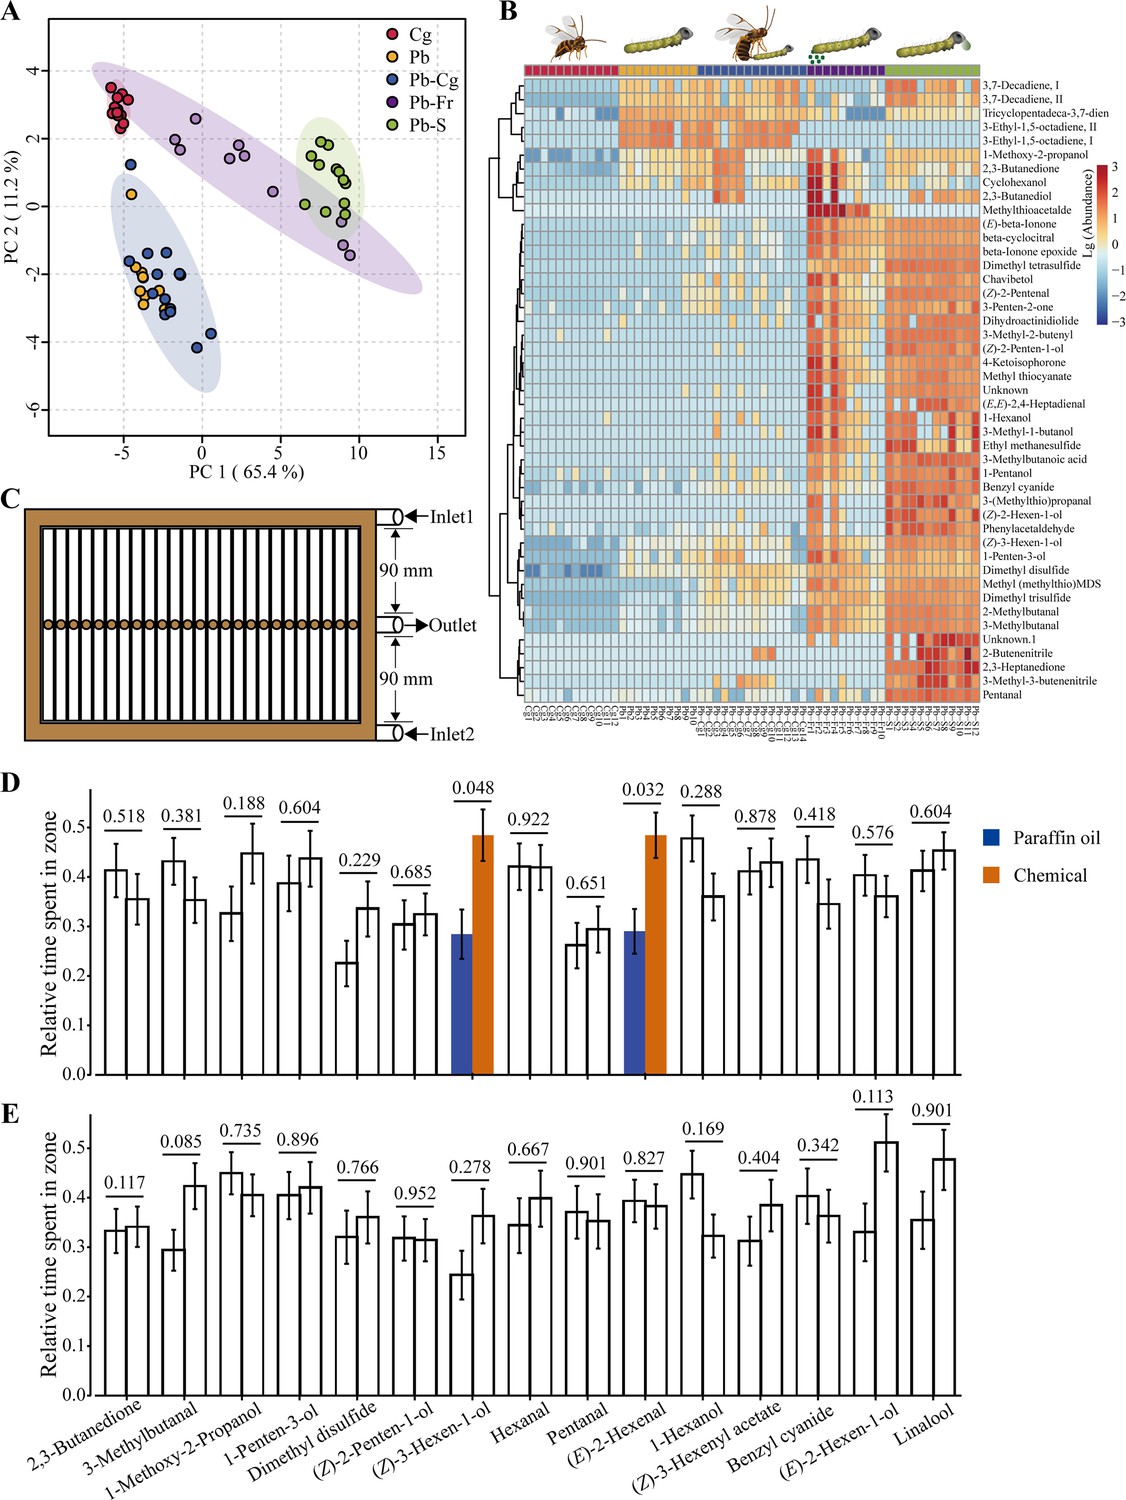
Overview of caterpillar- (Pieris brassicae) and parasitoid wasp- (Cotesia glomerata) associated volatile compounds.
(A) PCA (principal component analysis) two-dimensional score plot of five treatment groups: Cg, Cotesia glomerata female parasitoid wasps (n = 12); Pb, Pieris brassicae caterpillars (n = 10); Pb–Cg, P. brassicae caterpillars in the presence of C. glomerata female parasitoid wasps (n = 14); Pb-Fr, P. brassicae caterpillar frass (n = 10); and Pb-S, P. brassicae spit (n = 12), based on their volatile blend composition. (B) Hierarchical clustering heatmap showing the abundance of each identified volatile compound of each treatment. Clustering chemicals in the heatmap indicates higher correlation. (C) Schematic drawing of the custom-designed multichannel arena. (D) Wildtype (WT) caterpillar behavioral preference to the tested 15 odorants. (E) Orco knockout (KO) caterpillar behavioral preference to the tested 15 chemicals. Unfilled bars represent tests that exhibit no difference between paraffin oil and the odorant of interest. Blue bars indicate the cumulative duration ratio that caterpillars stayed in the paraffin oil zone, dark orange bars indicate the cumulative duration ratio that caterpillars stayed in the odorant zone. Relative time spent in odorant zone = Cumulative duration in a specific zone/Cumulative duration in the arena. Error bars indicate standard errors. In (D) and (E), differences were tested between the two zones using a Wilcoxon rank-sum test, p-values are presented above bars (n = 31–50). For each comparison, the left bar represents paraffin oil and the right bar represents chemical compound.
Figure 3—figure supplement 1
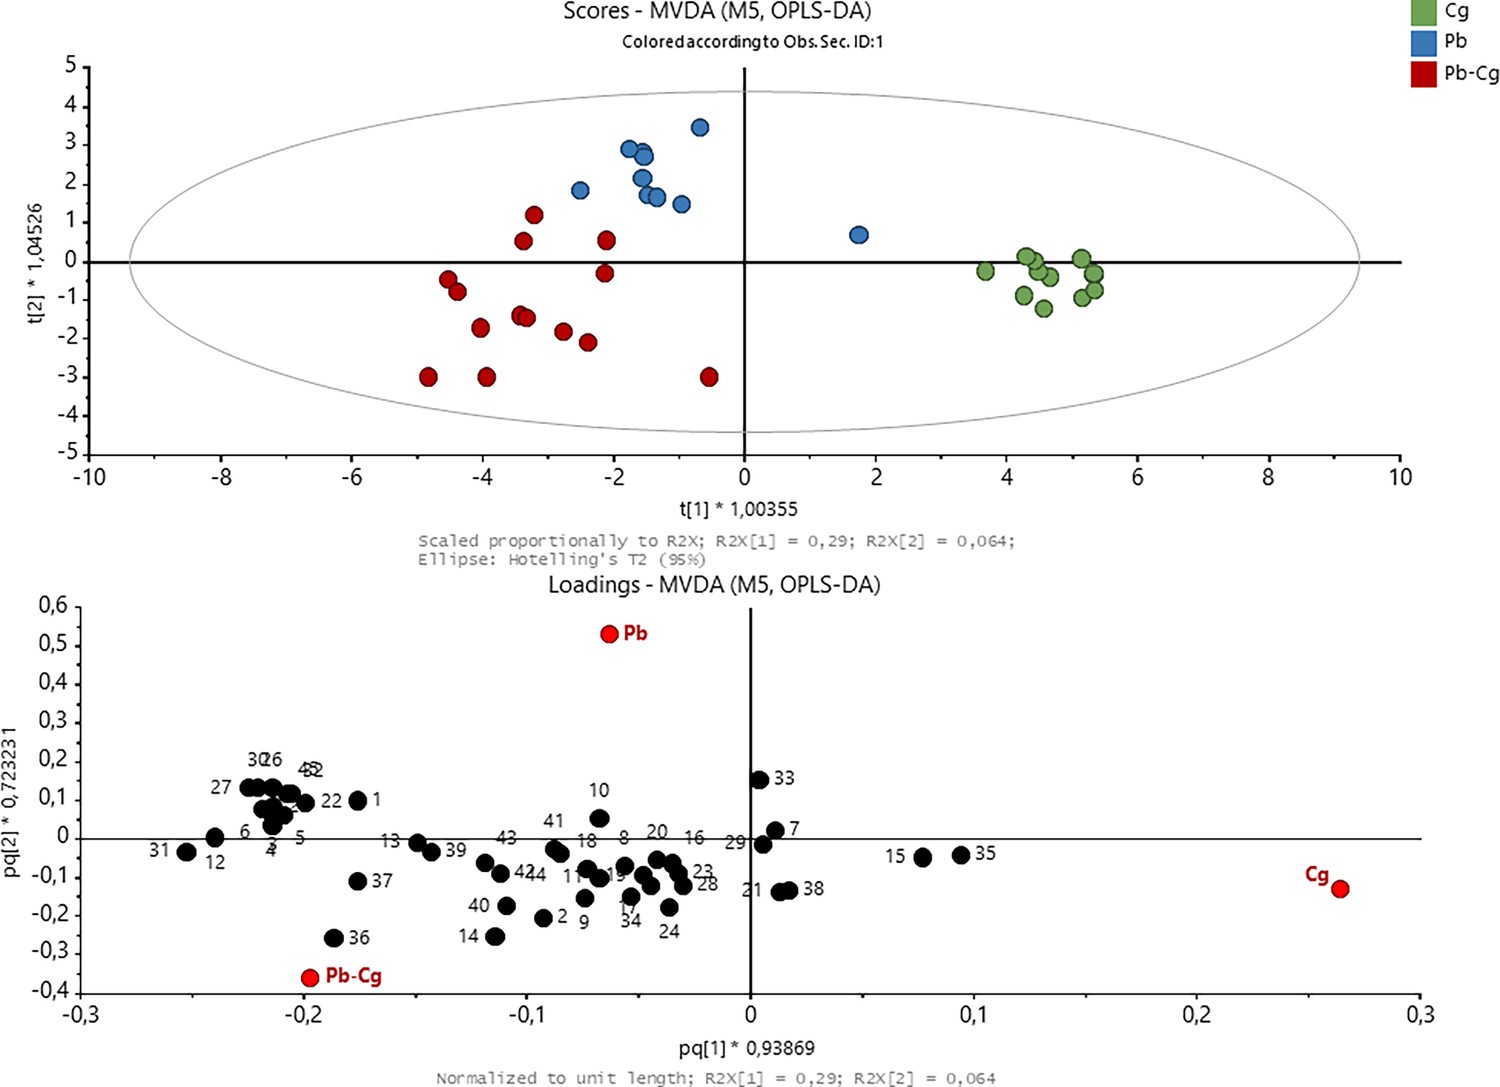
Overview of volatile blends of Pieris brassicae caterpillars, Cotesia glomerata parasitoid wasps, and caterpillars-parasitoid in interaction.
(Upper panel) OPLS-DA (Orthogonal Projection to Latent Structures Discriminant Analysis) two-dimensional score plot of treatment groups: Cg, Cotesia glomerata female parasitoid wasps (n = 12), based on their volatile content; Pb, Pieris brassicae caterpillars (n = 10); Pb–Cg, P. brassicae caterpillars in the presence of C. glomerata female parasitoid wasps (n = 14). (Lower panel) Loading plot showing the contribution of each identified volatile compound to the separation of the different treatments. Volatiles closer to the treatment in the plot indicate higher correlation. Numbers in the loading plot refer to the volatile compounds listed in Supplementary file 1A.
Figure 3—figure supplement 2
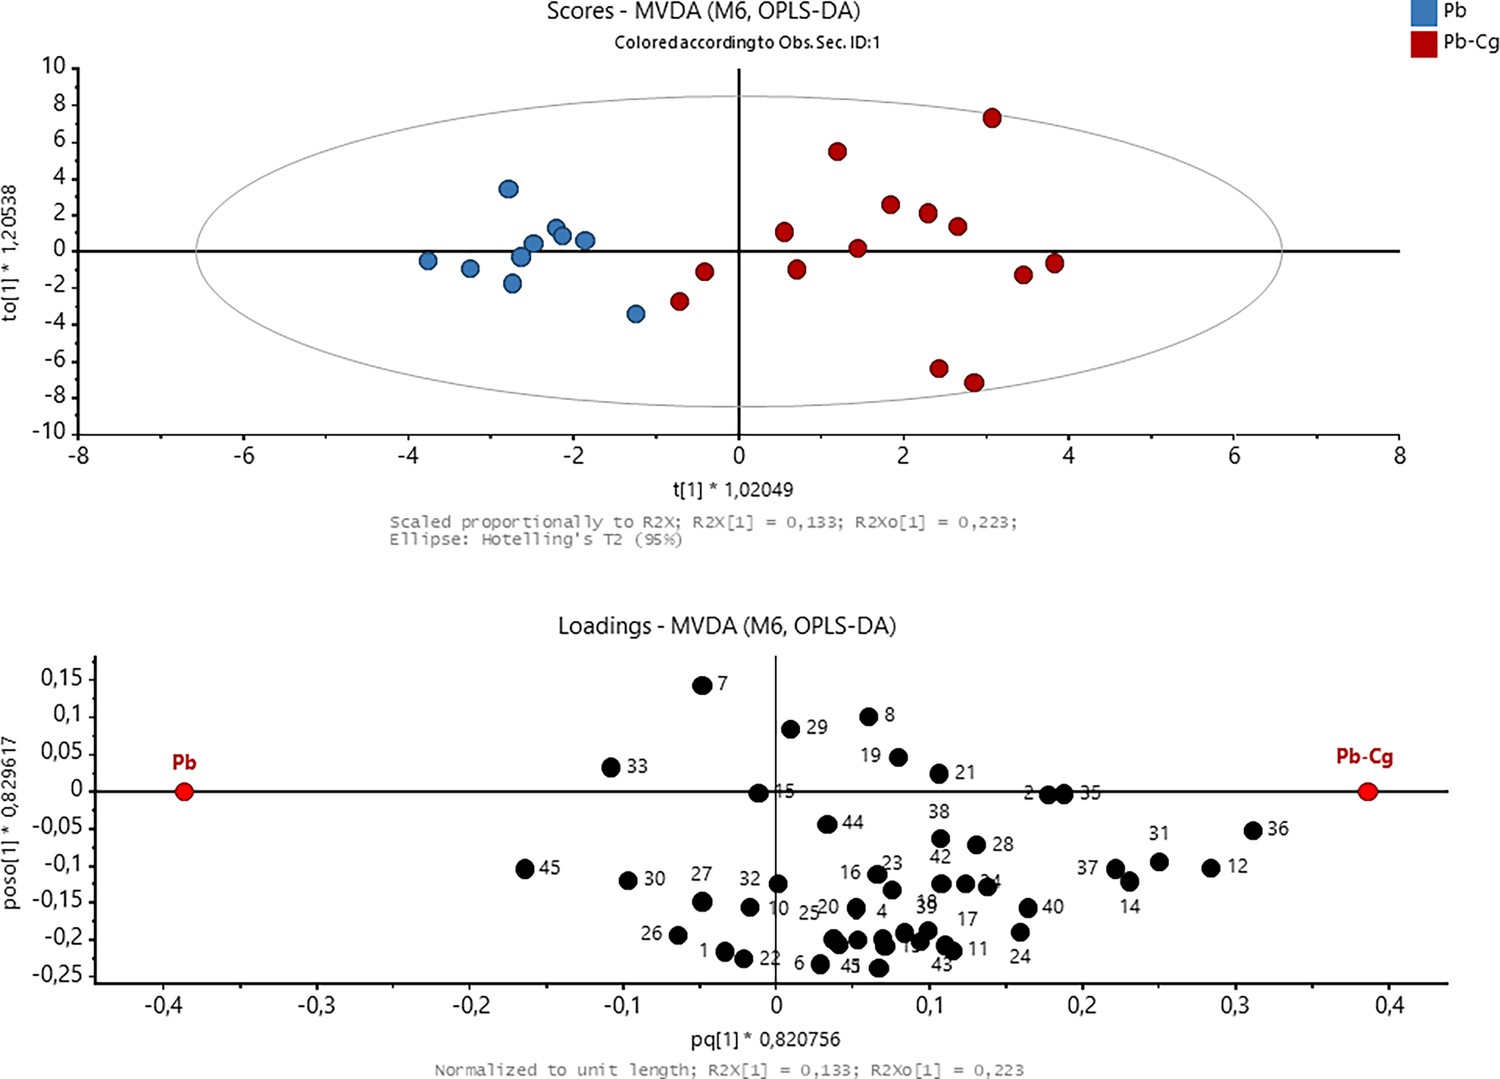
Overview of volatile blends of Pieris brassicae caterpillars and caterpillars-parasitoid (Cotesia glomerata) in interaction.
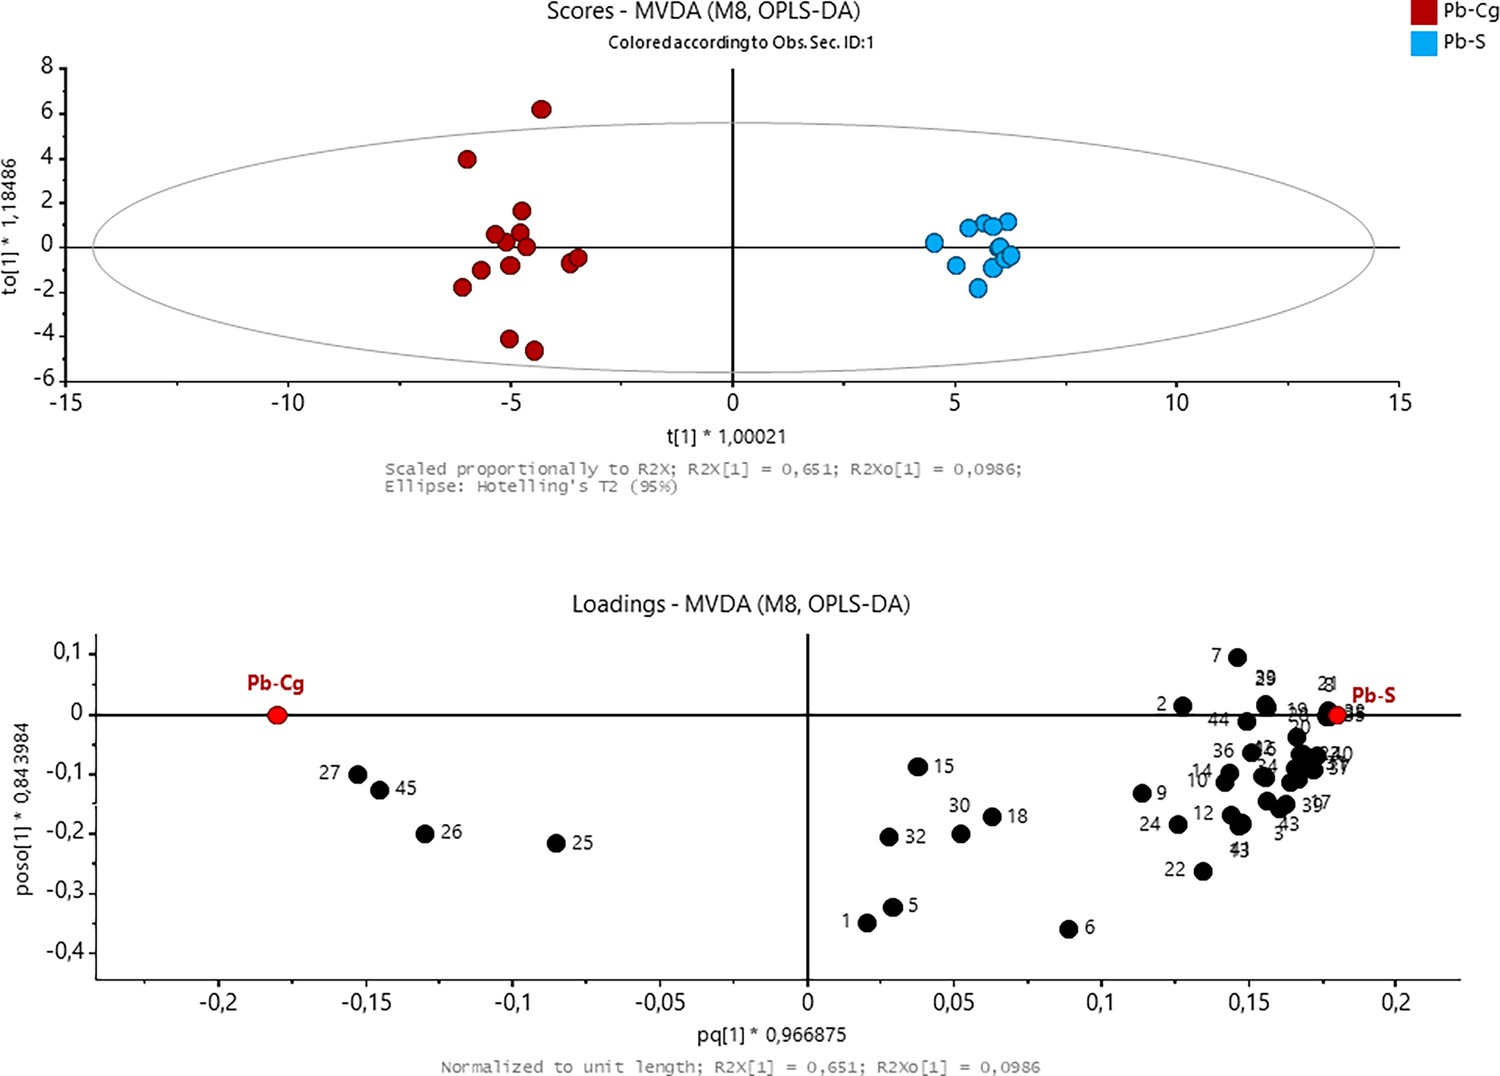
(Upper panel) OPLS-DA (Orthogonal Projection to Latent Structures Discriminant Analysis) two-dimensional score plot of treatment groups: Pb, Pieris brassicae caterpillars (n = 10); Pb–Cg, P. brassicae caterpillars in the presence of C. glomerata female parasitoid wasps (n = 14), based on their volatile content. (Lower panel) Loading plot showing the contribution of each identified volatile compound to the separation of the different treatments. Volatiles closer to the treatment in the plot indicate higher correlation. Numbers in the loading plot refer to the volatile compounds listed in Supplementary file 1A.
Figure 3—figure supplement 3
Overview of volatile blends of Pieris brassicae caterpillar spit and caterpillars-parasitoid wasp (Cotesia glomerata) in interaction.
(Upper panel) OPLS-DA (Orthogonal Projection to Latent Structures Discriminant Analysis) two-dimensional score plot of treatment groups: P. brassicae spit (n = 12), Pb–Cg, P. brassicae caterpillars in the presence of C. glomerata female parasitoid wasps (n = 14), based on their volatile content. (Lower panel) Loading plot showing the contribution of each identified volatile compound to the separation of the different treatments. Volatiles closer to the treatment in the plot indicate higher correlation. Numbers in the loading plot refer to the volatile compounds listed in Supplementary file 1A.
Figure 3—figure supplement 4
Overview of volatile blends of Pieris brassicae caterpillar spit and P. brassicae caterpillar frass.
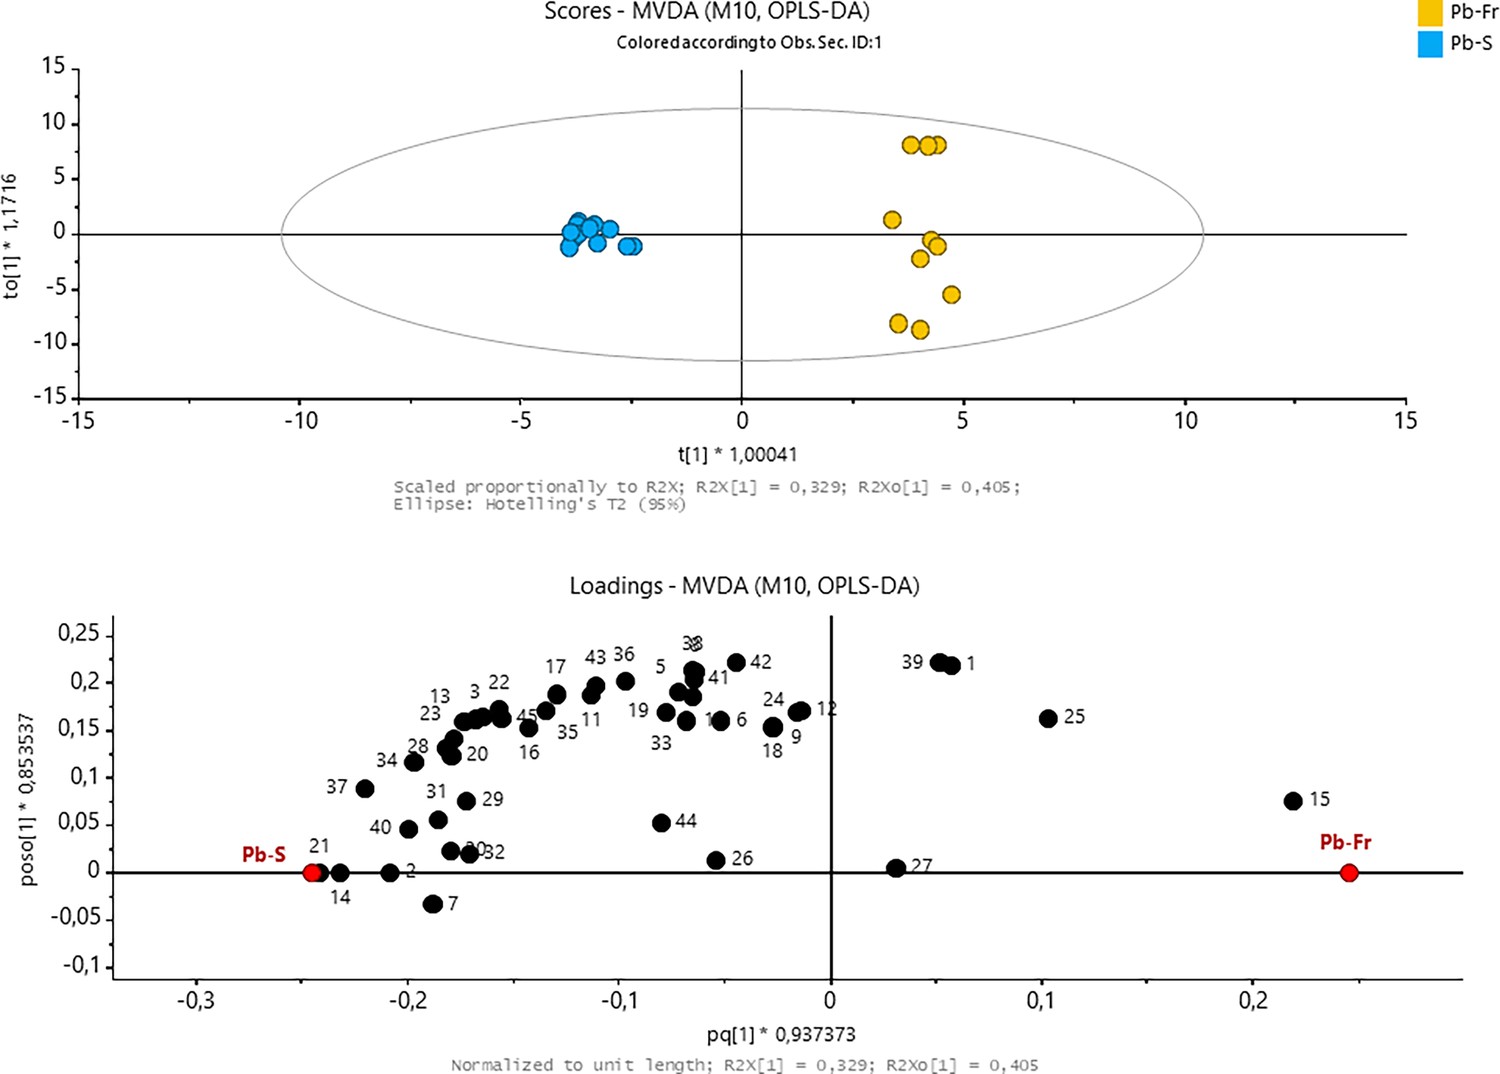
(Upper panel) OPLS-DA (Orthogonal Projection to Latent Structures Discriminant Analysis) two-dimensional score plot of treatment groups: Pb-Fr, P. brassicae caterpillar frass (n = 10); and Pb-S, P. brassicae spit (n = 12), based on their volatile content. (Lower panel) Loading plot showing the contribution of each identified volatile compound to the separation of the different treatments. Volatiles closer to the treatment in the plot indicate higher correlation. Numbers in the loading plot refer to the volatile compounds listed in Supplementary file 1A.
Figure 3—figure supplement 5
Overview of volatile blends of Pieris brassicae caterpillars, caterpillars (P. brassicae) - parasitoids (Cotesia glomerata) in interaction, and Pieris brassicae caterpillar frass.
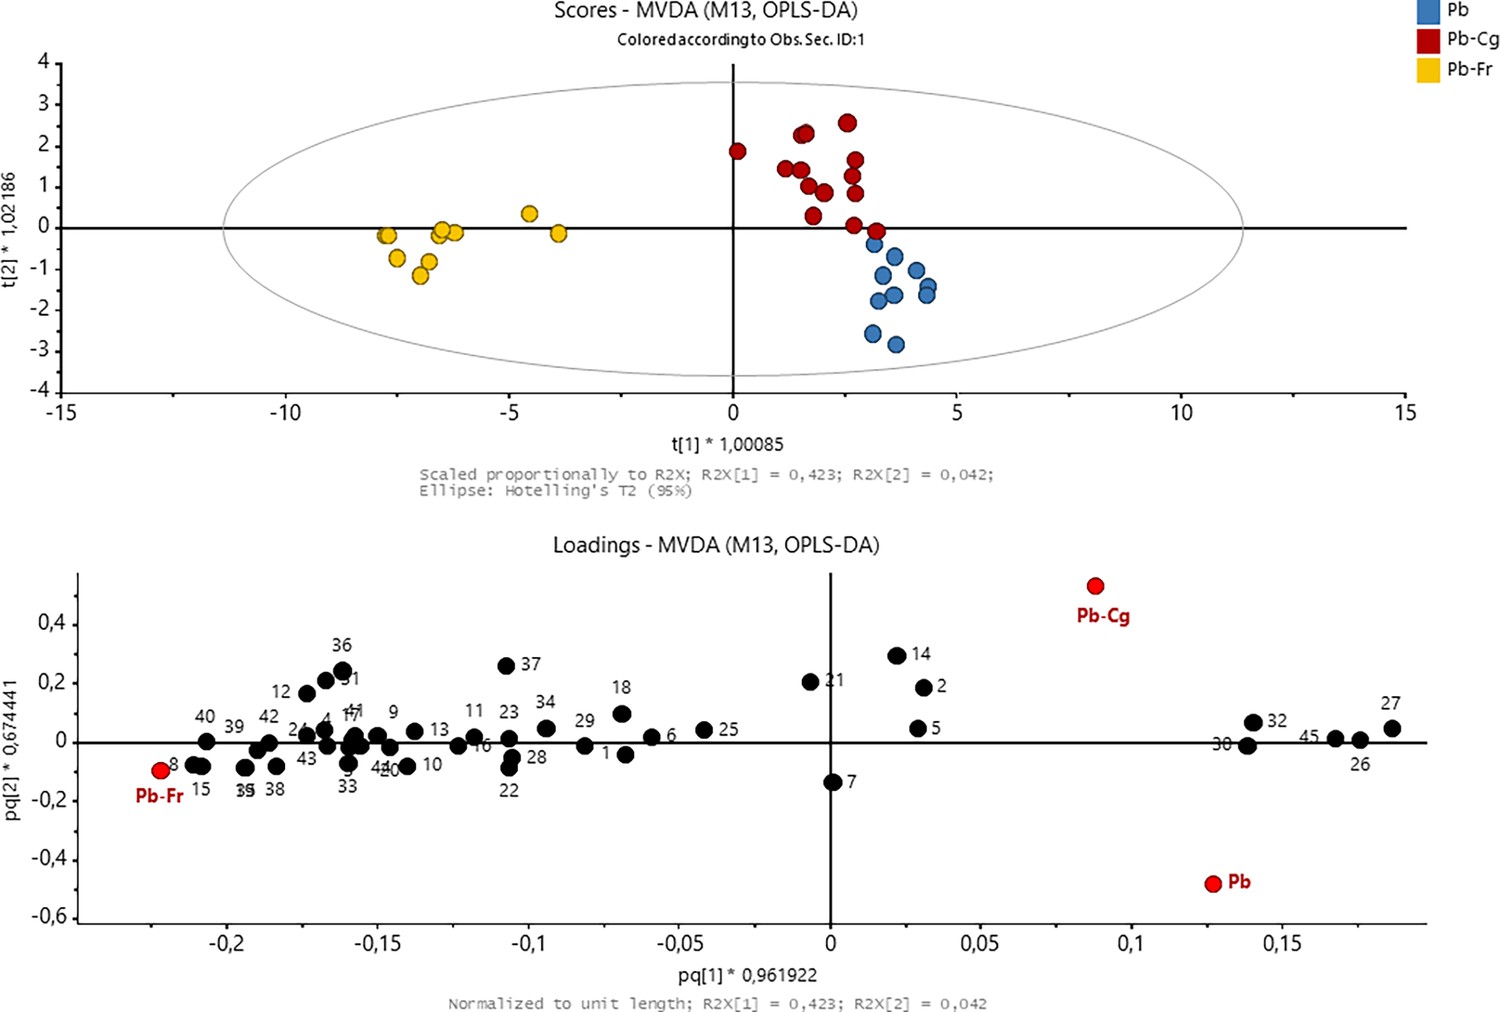
(Upper panel) OPLS-DA (Orthogonal Projection to Latent Structures Discriminant Analysis) two-dimensional score plot of treatment groups: Pb, Pieris brassicae caterpillars (n = 10); Pb-Fr, P. brassicae caterpillar frass (n = 10); Pb–Cg, P. brassicae caterpillars in the presence of C. glomerata female parasitoid wasps (n = 14), based on their volatile content. (Lower panel) Loading plot showing the contribution of each identified volatile compound to the separation of the different treatments. Volatiles closer to the treatment in the plot indicate higher correlation. Numbers in the loading plot refer to the volatile compounds listed in Supplementary file 1A.
Figure 3—figure supplement 6
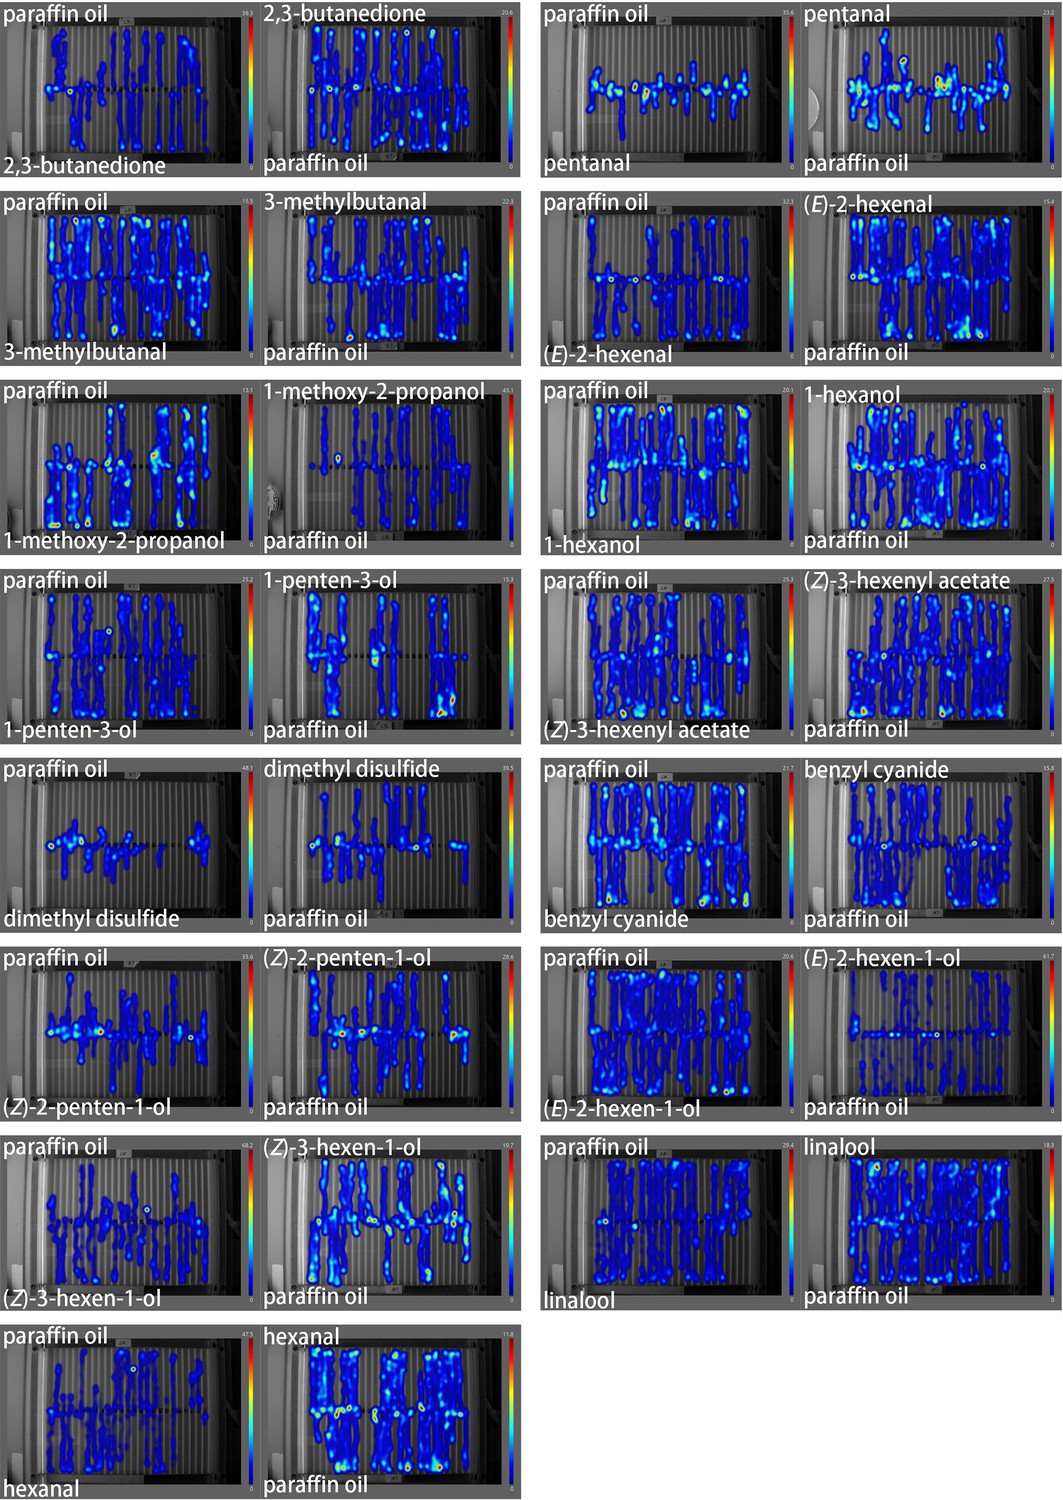
Heatmaps of wildtype (WT) caterpillar movement in response to the tested chemicals.
The chemical compounds are indicated in the figures, and the color legend indicates the time (s) that each caterpillar stayed at certain locations.
Figure 3—figure supplement 7
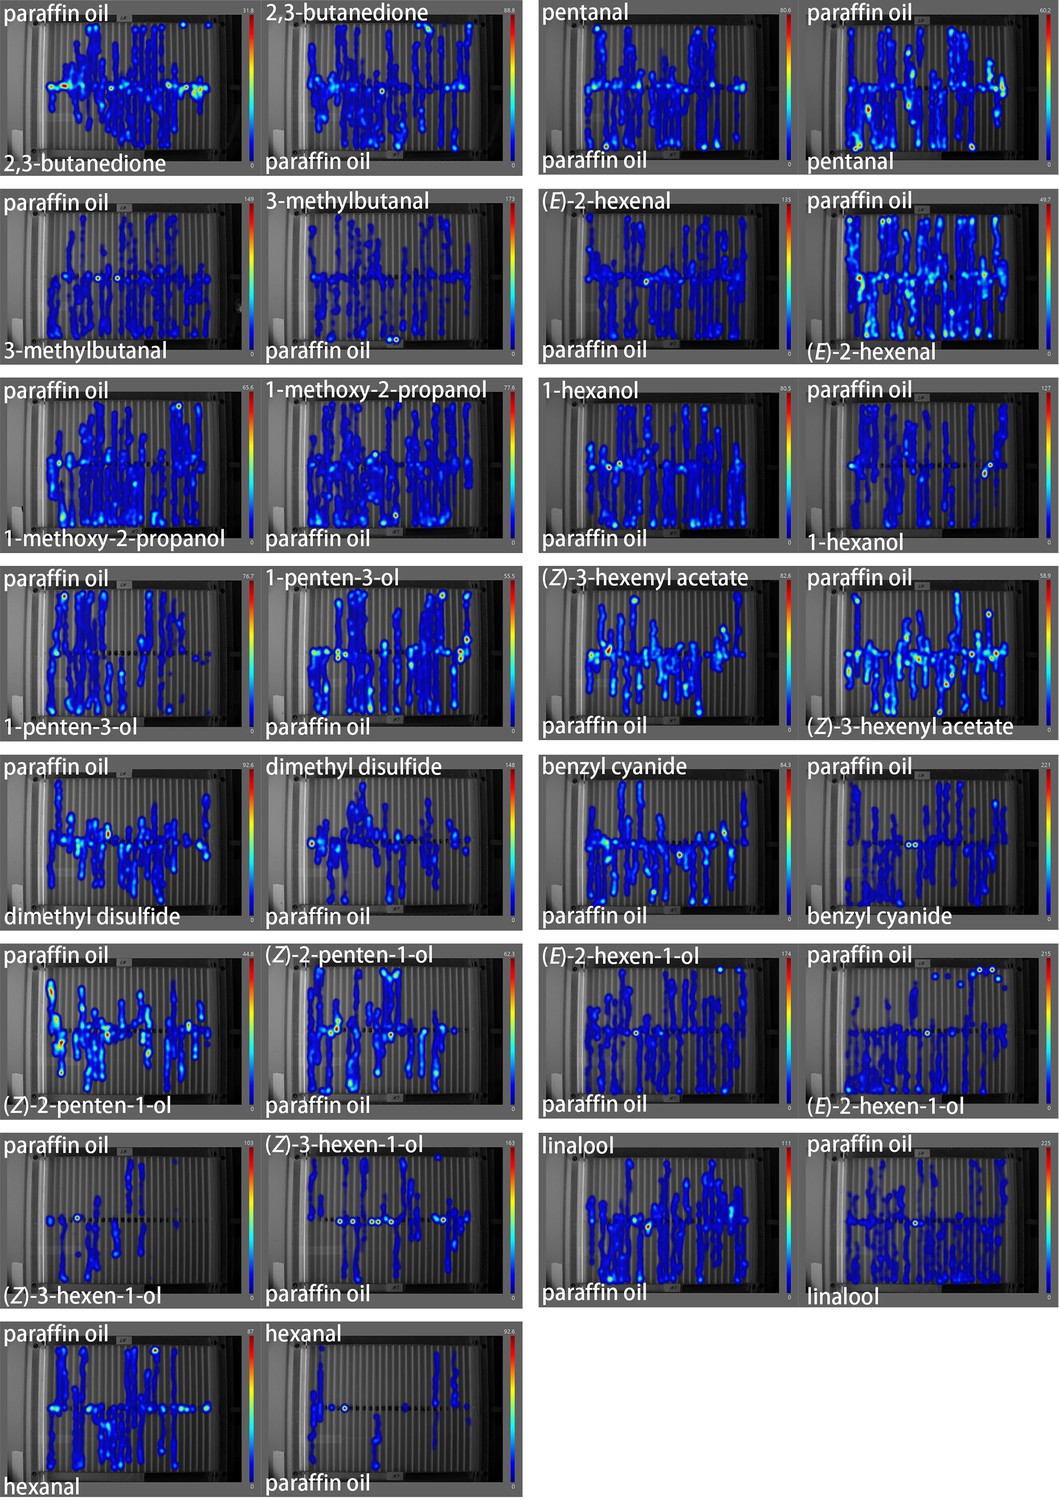
Heatmaps of Orco knockout (KO) caterpillar movement in response to the tested chemicals.
The chemical compounds are indicated in the figures, and the color legend indicates the time (s) that each caterpillar stayed at certain locations.
Additional files
-
MDAR checklist
- https://cdn.elifesciences.org/articles/105585/elife-105585-mdarchecklist1-v1.pdf
-
Supplementary file 1
Analysis of volatile compounds in the headspace of Cotesia glomerata wasps, Pieris brassicae caterpillars, caterpillars and wasps in the presents of each other, caterpillar frass and caterpillar spit.
(A) Volatile compounds detected in the headspace of the different treatment samples. Cg, Cotesia glomerata female parasitoid wasps (n = 12); Pb, Pieris brassicae caterpillars (n = 10); Pb–Cg, P. brassicae caterpillars in the presence of C. glomerata female parasitoid wasps (n = 14); Pb-Fr, P. brassicae caterpillar frass (n = 10); and Pb-S, P. brassicae spit (n = 12), are listed. Relative amounts of volatiles are presented as average peak height (SE)/104. The volatiles are listed according to their elution order in a chromatographic window. Volatiles with variable importance in the projection (VIP) scores equal to or higher than 1.0 (presented in bold) are considered important in separating the different treatment groups of the given analysis. Significant differences among the five treatments detected by the Kruskal–Wallis test with Dunn’s post hoc test for multiple comparisons are indicated by letters in the table. Different letters indicate significant difference (p < 0.05). NF, not found. (B) Volatiles used in separating C. glomerata female wasps (Cg, n = 12), P. brassicae caterpillars (Pb, n = 10), and the interaction of P. brassicae caterpillars with C. glomerata female wasps (Pb–Cg, n = 14) sample treatments (Figure 3—figure supplement 1). Volatiles are listed according to ranking order of their VIP score values, where those with VIP scores of equal to or higher than 1.0 are considered important in separating the treatment groups of the given analysis. (C) Volatiles used in separating P. brassicae caterpillars (Pb, n = 10) and the interaction of P. brassicae caterpillars with C. glomerata female wasps (Pb–Cg, n = 14) sample treatments (Figure 3—figure supplement 2). Volatiles are listed according to ranking order of their VIP score values, where those with VIP scores of equal to or higher than 1.0 are considered important in separating the treatment groups of the given analysis. (D) Volatiles used in separating the interaction of P. brassicae caterpillars with C. glomerata female wasps (Pb–Cg, n = 14) and P. brassicae caterpillar spit (Pb-S, n = 12), sample treatments (Figure 3—figure supplement 3). Volatiles are listed according to ranking order of their VIP score values, where those with VIP scores of equal to or higher than 1.0 are considered important in separating the treatment groups of the given analysis. (E) Volatiles used in separating the P. brassicae caterpillar spit (Pb-S, n = 12), and P. brassicae caterpillar frass (Pb-Fr, n = 10) sample treatments (Figure 3—figure supplement 4). Volatiles are listed according to ranking order of their VIP score values, where those with VIP scores of equal to or higher than 1.0 are considered important in separating the treatment groups of the given analysis. (F) Volatiles used in separating the P. brassicae caterpillars (Pb, n = 10), the interaction of P. brassicae caterpillars with C. glomerata female wasps (Pb–Cg, n = 14), and P. brassicae caterpillar frass (Pb-Fr, n = 10) sample treatments (Figure 3—figure supplement 5). Volatiles are listed according to ranking order of their VIP score values, where those with VIP scores of equal to or higher than 1.0 are considered important in separating the treatment groups of the given analysis. (G) Chemical compounds that were used for the electroantennographical test. (H) Chemical compounds that were used for the behavioral test in multichannel arena.
- https://cdn.elifesciences.org/articles/105585/elife-105585-supp1-v1.pdf
Download links
A two-part list of links to download the article, or parts of the article, in various formats.
Downloads (link to download the article as PDF)
Open citations (links to open the citations from this article in various online reference manager services)
Cite this article (links to download the citations from this article in formats compatible with various reference manager tools)
Loss of olfaction reduces caterpillar performance and increases susceptibility to a natural enemy
eLife 14:RP105585.
https://doi.org/10.7554/eLife.105585.3


