Structural evolution of nitrogenase over 3 billion years
- Department of Bacteriology, University of Wisconsin-Madison, United States
- Centro de Biotecnología y Genómica de Plantas, Universidad Politécnica de Madrid (UPM)—Instituto Nacional de Investigación y Tecnología Agraria y Alimentaria-CSIC (INIA/CSIC), Campus de Montegancedo, Spain
- Institute of Biochemistry, University of Freiburg, Germany
- Department of Chemistry and Biochemistry, Utah State University, United States
Figures
Figure 1 with 2 supplements

Overview of the methodological pipeline for massive protein structure prediction and experimental crystallographic analysis of extant and ancestral nitrogenase enzymes.
(A) Nitrogenase phylogeny built from concatenated Nif/Vnf/AnfHDK protein sequences. Clades are labeled according to the nomenclature used by Raymond et al., 2004. (Nif-I: Group I Nif, Nif-II: Group II Nif, Nif-III: Group III Nif). Nif, Vnf, or Anf homologs from select model organisms are labeled with dashed lines (Avin: Azotobacter vinelandii, Cpas: Clostridium pasteurianum, Kpne: Klebsiella pneumoniae, Mace: Methanosarcina acetivorans, Rpal: Rhodopseudomonas palustris). Anc1A/B and Anc2 ancestors targeted for crystallographic analysis are labeled with stars. (B) Graphical overview of the pipeline for nitrogenase protein structure prediction and crystallization (see ‘Materials and methods’ for further details). Colored rectangles correspond to protein sequences for H, D, and K subunits. For each ancestral node, protein structures were predicted for the most likely ancestral sequence (‘ML’) and five alternative sequences (‘Alt’) reconstructed based on the site-wise posterior probability distributions in the ancestral sequence. Ancestors Anc1A and Anc2 hybrid enzymes were crystallized containing an ancestral NifD subunit and WT NifH and NifK subunits (WT subunits indicated by lighter color). All predicted structures are publicly available at https://nsdb.bact.wisc.edu.
Figure 1—figure supplement 1

AlphaFold prediction confidence for extant and ancestral nitrogenases.
(A) Histograms plot counts of individual chain predictions (5378 total structures (DDKK + HH) for 769 tree nodes, including six alternative ancestors for each ancestral node), demonstrated for each nitrogenase subunit, colored by the protocol that was employed to produce the structures. (B) Same data as in panel A, but structures are colored based on whether they represent extant or ancestral nitrogenases. (C) Histograms of individual chain predictions specifically for extant nitrogenases and their most likely ancestors. This subset includes 1,538 total structures (DDKK + HH) corresponding to the same 769 tree nodes.
Figure 1—figure supplement 2

Expanded nitrogenase protein sequence phylogeny (adapted from Garcia et al., 2020).
Figure 2 with 4 supplements

Global analyses of nitrogenase DDKK sequence and structural diversity.
(A) Root mean squared deviation (RMSD) distribution on paired nitrogenase alignments across extant and ML-ancestor pairs. (B) Sequence identity and structural similarity (quantified by root mean square deviation (RMSD) of aligned predicted structures) distribution of paired nitrogenase alignments. (C) Hierarchical clustering of predicted nitrogenase structures based on structural similarity (RMSD). Each tile in the heatmap corresponds to the RMSD between two nitrogenase structures.
-
Figure 2—source code 1
Global analysis of nitrogenase DDKK sequence and structural diversity.
- https://cdn.elifesciences.org/articles/105613/elife-105613-fig2-code1-v1.zip
-
Figure 2—source data 1
Pairwise alignment distances between DDKK tetramers after alignment with US-align.
- https://cdn.elifesciences.org/articles/105613/elife-105613-fig2-data1-v1.csv
Figure 2—figure supplement 1

DDKK RMSD100 relationships.
(A) RMSD100 histogram. RMSD100 consists of a normalization of the RMSD values shown in Figure 2 multiplied by a factor that accounts for alignment length. (B) Bi-dimensional histogram relating RMSD100 and sequence identity. (C) Hierarchical clustering of predicted nitrogenase structures based on structural similarity (RMSD100). The colors on the heatmap correspond to the phylogenetic groups represented on Figure 2C.
Figure 2—figure supplement 2

DDKK TM-score relationships.
(A) TM-score histogram. TM-score can range from 0 (no similarity) to 1 (identical). The lowest TM-score in this histogram is above 0.85. (B) Bi-dimensional histogram relating TM-score and sequence identity. (C) Hierarchical clustering of predicted nitrogenase structures based on structural similarity (TM-score). The colors on the heatmap correspond to the phylogenetic groups represented on Figure 2C.
Figure 2—figure supplement 3

Structural variability among sequence variants of ancestral nodes.
Structural similarity is measured as the average RMSD for the backbone Cα-atoms of all the alternative (“alt”) variants against the maximum-likelihood ancestral variant. (A) Histogram of the RMSD (Å) for both component 1 (DDKK structures) and 2 (HH structures). (B) Distance to root versus RMSD (Å) for each ancestral node.
Figure 2—figure supplement 4

Residues surrounding metal cofactors and RMSD analysis in nitrogenase.
(A) Selected residues around the M-site (FeMo-co) metal cofactor. Structural snapshot obtained from 3U7Q (Nif Azotobacter vinelandii). (B) Selected residues around the P-site (Fe8S7) metal cofactor. Structural snapshot obtained again from 3U7Q. Residues highlighted in pink correspond to the D subunit, while those in purple correspond to the K subunit. (C) Alpha-Carbon RMSD for the selected residues in panels A and B.
Figure 3

Nitrogenase structure variation in a phylogenetic context.
(A) Nitrogenase protein phylogeny. Branches and ancestral nodes corresponding to structural insertion events, as well as representative extant variants conserving those insertions, are highlighted and/or labeled. Clade and node colors correspond to the subunit for which an insertion is observed (i.e., blue for the D subunit, red for the K subunit). (B) Elongation of the NifD C-terminus coincident with the origin of the Anf clade. (C) Progressive elongation of the NifK N-terminus through the early evolution of the Nif-I clade. (D) Insertion within NifD coincident with the origin of the Nif-II clade. (B–D) All visualized structures are predicted unless otherwise specified with the corresponding Protein Data Bank identifier. Bound G- and H-subunit structures were not predicted together with the NifDK structures and are thus indicated with an asterisk. The binding positions of the G- and H-subunit structures are inferred based on alignment with PDB 8BOQ (Trncik et al., 2023) and PDB 1M34 (Schmid et al., 2002), respectively.
Figure 4 with 1 supplement

Phylogenetic patterns of nitrogenase structural attributes calculated across DDKK proteins.
(A) Node taxonomy overview. (B) Binding affinity prediction for extant and ancestral nitrogenase nodes mapped to the nitrogenase phylogeny. (C) Structure overview of the D and K subunit interactions around the N-terminal insertion in Nif-I nitrogenases. Structure corresponding to Azotobacter vinelandii NifDK (PDB code: 3U7Q). Note: We reduced the number of displayed phylogenetic nodes to mitigate visual overcrowding; refer to Figure 4—figure supplement 1 for a complete visualization of all nodes.
-
Figure 4—source code 1
Phylogenetic tree representation of sequence relationships (provided as source data).
- https://cdn.elifesciences.org/articles/105613/elife-105613-fig4-code1-v1.zip
-
Figure 4—source code 2
Source code for phylogenetic tree representation of nitrogenase attributes.
- https://cdn.elifesciences.org/articles/105613/elife-105613-fig4-code2-v1.zip
-
Figure 4—source data 1
Nitrogenase phylogenetic tree.
- https://cdn.elifesciences.org/articles/105613/elife-105613-fig4-data1-v1.zip
-
Figure 4—source data 2
Phylogenetic tree annotations.
- https://cdn.elifesciences.org/articles/105613/elife-105613-fig4-data2-v1.zip
-
Figure 4—source data 3
Nitrogenase DDKK structural data.
- https://cdn.elifesciences.org/articles/105613/elife-105613-fig4-data3-v1.zip
Figure 4—figure supplement 1

Phylogenetic mapping of structural features in nitrogenase DDKK proteins.
(A) Overview of structural attributes calculated from predicted nitrogenase structures. (B-G) Structural attributes of extant and ancestral nitrogenases mapped to the nitrogenase phylogeny in A.
Figure 5 with 3 supplements

Crystal structures of targeted ancestral nitrogenases.
(A) Nitrogenase protein phylogeny from which nitrogenase ancestral proteins were reconstructed and crystallized for structural characterization. Major clades are labeled following Garcia et al., 2023. (B) Residue-level root mean squared deviation (RMSD) between the crystallized ancestral and wild-type (A. vinelandii) NifDK/NifH structures. (C) Spatial distribution of ancestral amino acid substitutions relative to WT. Crystallized protein complexes for Anc1A and Anc2 contain ancestral NifD and WT NifH and NifK. Therefore, ancestral substitutions are only in the NifD subunit for these structures. (D) Ancestral amino acid substitutions within the NifH-NifDK interface of Anc1B. Bound positions of NifH are inferred by alignment with either the nucleotide-free (PDB 2AFH; Tezcan et al., 2005) or MgATP-bound (PDB 7UT8; Rutledge et al., 2022) structures. (E–G) Close views of specific, ancestral amino acid substitutions that are inferred to impact NifH-NifDK interactions.
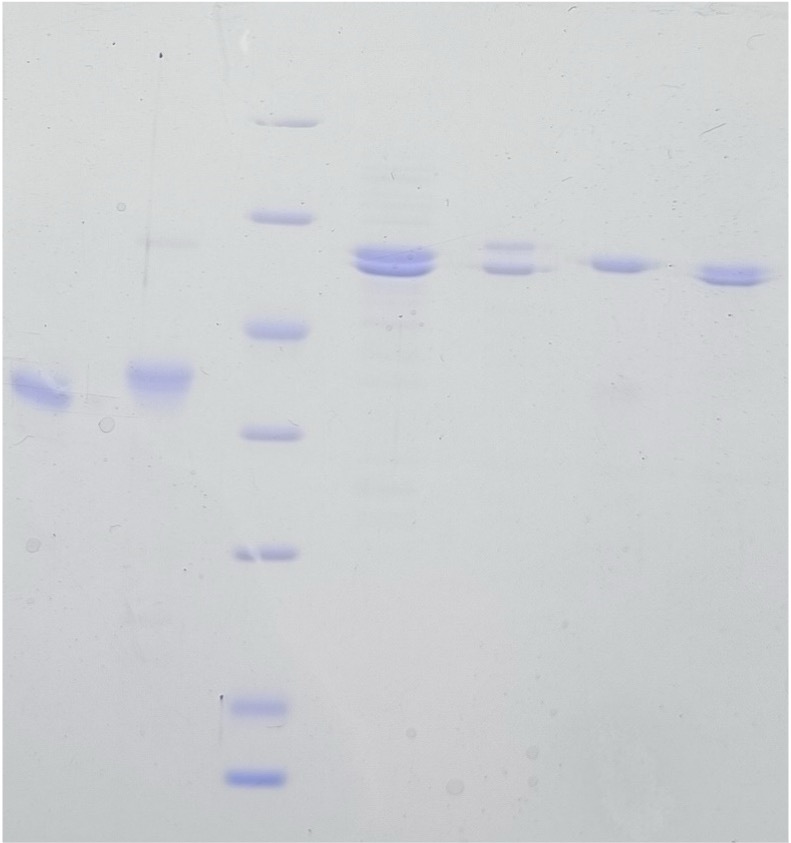
Figure 5—figure supplement 1

SDS-PAGE analysis of purified proteins.
WT H and DK from A. vinelandii are shown for comparison. M indicates marker.
-
Figure 5—figure supplement 1—source data 1
Raw, uncropped image for Figure 5—figure supplement 1.
- https://cdn.elifesciences.org/articles/105613/elife-105613-fig5-figsupp1-data1-v1.jpg
-
Figure 5—figure supplement 1—source data 2
Uncropped, labelled image for Figure 5—figure supplement 1.
- https://cdn.elifesciences.org/articles/105613/elife-105613-fig5-figsupp1-data2-v1.pdf
Figure 5—figure supplement 2

Twofold symmetry axis shift between Anc1B and WT.
Polypeptide chain of WT (colored grey) and Anc1B (colored blue and red) are aligned on the left D subunit (in blue), showing the shift of twofold symmetry axis relating the two DK heterotetramer for the right half of the heterotetramer.
Figure 5—figure supplement 3

Sequence alignments between Anc1a, Anc1B, Anc2 and WT A. vinelandii.
(A) Sequence alignment for D-subunit from crystallized ancestral nitrogenases. (B) Sequence identity matrix for D-subunit of crystallized ancestral nitrogenases. All other sequence characteristics of ancestral nitrogenase “Anc” variants are available at Garcia et al., 2022.
Figure 6

Comparison between crystallographic/cryo-EM and AlphaFold-predicted nitrogenase structures.
(A) Root mean squared deviation (RMSD) between crystallographic/cryo-EM structures available in the Protein Data Bank (PDB) and AlphaFold predictions. Each data point represents a comparison between one of five AlphaFold replicates and each PDB structure. (B) RMSD between experimental structures obtained in this work and their AlphaFold predictions. Each data point represents a comparison between one AlphaFold replicate and the experimental structure (C) C⍺-C⍺ distance between the Anc1A structural prediction and its crystallographic reference, mapped on the nitrogenase structure through a colormap. Blue residues denote larger distances C⍺-C⍺ distance, which indicate lower prediction fidelity on these regions.
-
Figure 6—source code 1
Code to display RMSD differences between experimental and reconstructed nitrogenase structures.
- https://cdn.elifesciences.org/articles/105613/elife-105613-fig6-code1-v1.zip
-
Figure 6—source code 2
Labels for figure display.
- https://cdn.elifesciences.org/articles/105613/elife-105613-fig6-code2-v1.zip
-
Figure 6—source data 1
Alignment distances between experimental and predicted DDKK tetramers using US-align.
- https://cdn.elifesciences.org/articles/105613/elife-105613-fig6-data1-v1.csv
Tables
Key resources table
| Reagent type (species) or resource | Designation | Source or reference | Identifiers | Additional information |
|---|---|---|---|---|
| Strain, strain background (Azotobacter vinelandii) | DJ | DOI:10.1128/JB. 00504–09 | Dennis Dean, Virginia Tech; Wild-type (WT); Nif+ | |
| Genetic reagent (A. vinelandii) | DJ2102 | DOI:10.1016/bs.mie.2018.10.007 | Dennis Dean, Virginia Tech; Strep-tagged WT NifD; Nif+ | |
| Genetic reagent (A. vinelandii) | DJ2278 | Other | Dennis Dean, Virginia Tech; ΔnifD::KanR; Nif- | |
| Genetic reagent (A. vinelandii) | AK013 | DOI:10.7554/eLife.85003 | ‘Anc1A’; ΔnifD::nifDAnc1A; Nif+ | |
| Genetic reagent (A. vinelandii) | AK023 | DOI:https://doi.org/10.7554/eLife.85003 | ‘Anc1B’;ΔnifHDK::nifHDKAnc1B; Nif+ | |
| Genetic reagent (A. vinelandii) | AK014 | DOI:https://doi.org/10.7554/eLife.85003 | ‘Anc2’;ΔnifD::nifDAnc2; Nif+ | |
| Software, algorithm | MAFFT | MAFFT | RRID:SCR_011811 | |
| Software, algorithm | trimAI | trimAI | ||
| Software, algorithm | RAxML | RAxML | RRID:SCR_006086 | |
| Software, algorithm | ModelFinder | ModelFinder | ||
| Software, algorithm | IQ-Tree | IQ-Tree | RRID:SCR_017254 | |
| Software, algorithm | PAML | PAML | RRID:SCR_014932 | |
| Software, algorithm | MOLREP | MOLREP | ||
| Software, algorithm | BUSTER | BUSTER | RRID:SCR_015653 | |
| Software, algorithm | REFMAC5 | REFMAC5 | ||
| Software, algorithm | ColabFold | ColabFold | RRID:SCR_025453 | |
| Software, algorithm | HH-suite | HH-suite | RRID:SCR_016133 | |
| Software, algorithm | US-Align | US-Align | ||
| Software, algorithm | Prody | Prody | ||
| Software, algorithm | FreeSASA | FreeSASA | ||
| Software, algorithm | RING | RING | ||
| Software, algorithm | ChimeraX | ChimeraX | RRID:SCR_015872 |
Additional files
-
Supplementary file 1
Crystallographic or cryo-EM nitrogenase structures presently available in the Protein Data Bank (https://www.rcsb.org/), accessed September 2023.
H, D, K, and G refer to the respective H, D, K, and G-subunits of nitrogenase. The numbering refers to the oligomeric state for each of the subunit in the complex.
- https://cdn.elifesciences.org/articles/105613/elife-105613-supp1-v1.docx
-
Supplementary file 2
Data collection and refinement statistics for Anc2.
- https://cdn.elifesciences.org/articles/105613/elife-105613-supp2-v1.docx
-
Supplementary file 3
Data collection and refinement statistics for Anc1A.
- https://cdn.elifesciences.org/articles/105613/elife-105613-supp3-v1.docx
-
Supplementary file 4
Data collection and refinement statistics for Anc1B HH.
- https://cdn.elifesciences.org/articles/105613/elife-105613-supp4-v1.docx
-
Supplementary file 5
Data collection and refinement statistics for Anc1B DDKK.
- https://cdn.elifesciences.org/articles/105613/elife-105613-supp5-v1.docx
-
Supplementary file 6
Structural features analyzed in the massive nitrogenase structure prediction, with their respective programs.
- https://cdn.elifesciences.org/articles/105613/elife-105613-supp6-v1.docx
-
MDAR checklist
- https://cdn.elifesciences.org/articles/105613/elife-105613-mdarchecklist1-v1.docx
Download links
A two-part list of links to download the article, or parts of the article, in various formats.
Downloads (link to download the article as PDF)
Open citations (links to open the citations from this article in various online reference manager services)
Cite this article (links to download the citations from this article in formats compatible with various reference manager tools)
Structural evolution of nitrogenase over 3 billion years
eLife 14:RP105613.
https://doi.org/10.7554/eLife.105613.4


