Pu.1/Spi1 dosage controls the turnover and maintenance of microglia in zebrafish and mammals
- Biomedical Research Institute, Shenzhen Peking University-the Hong Kong University of Science and Technology Medical Center, China
- Division of Life Science, The Hong Kong University of Science and Technology, China
- Greater Bay Biomedical Innocenter, Shenzhen Bay Laboratory, China
Figures
Figure 1
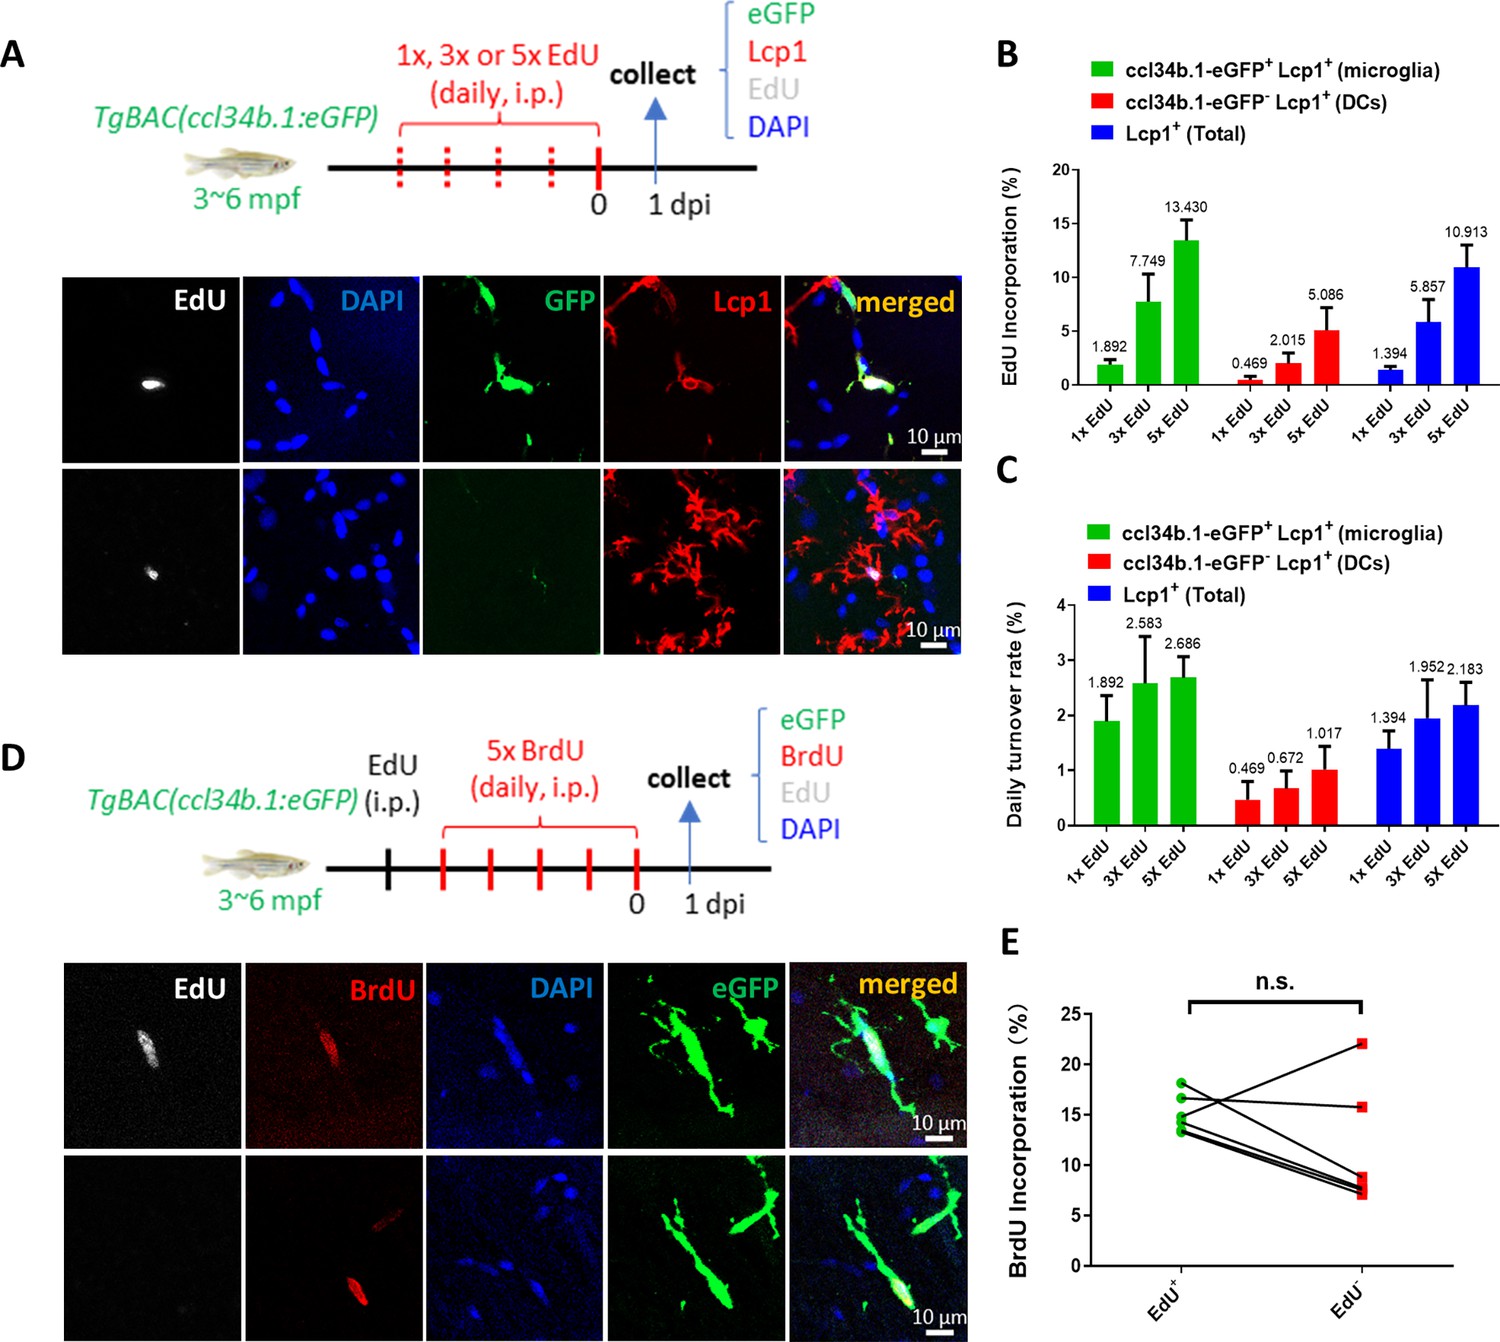
Adult microglia in zebrafish undergo rapid turnover and random proliferation to replenish and maintain their pool.
(A) Schematic diagram shows the workflow of EdU pulse experiment in adult TgBAC(ccl34b.1:eGFP) zebrafish and the representative images of proliferating microglia (ccl34b.1-eGFP+ Lcp1+EdU+) and dendritic cells (DCs) (ccl34b.1-eGFP-Lcp1+EdU+) in the midbrain. (B) Quantification of the EdU incorporation proportions in microglia and dendritic cells (DCs) with different dosages of EdU pulses. (n=4 for each group) (C) The daily turnover rate of microglia and DCs was calculated by dividing the EdU incorporation rate with EdU pulses. (D) Schematic diagram shows the experimental setup for EdU-BrdU double-pulse in adult wild-type fish and the representative images show two BrdU+ microglia with or without EdU incorporation. (E) Comparison of BrdU incorporation proportions in EdU+eGFP+ and EdU-eGFP+ microglia (n=6). n.s.=not significant, p>0.05.
Figure 2 with 1 supplement
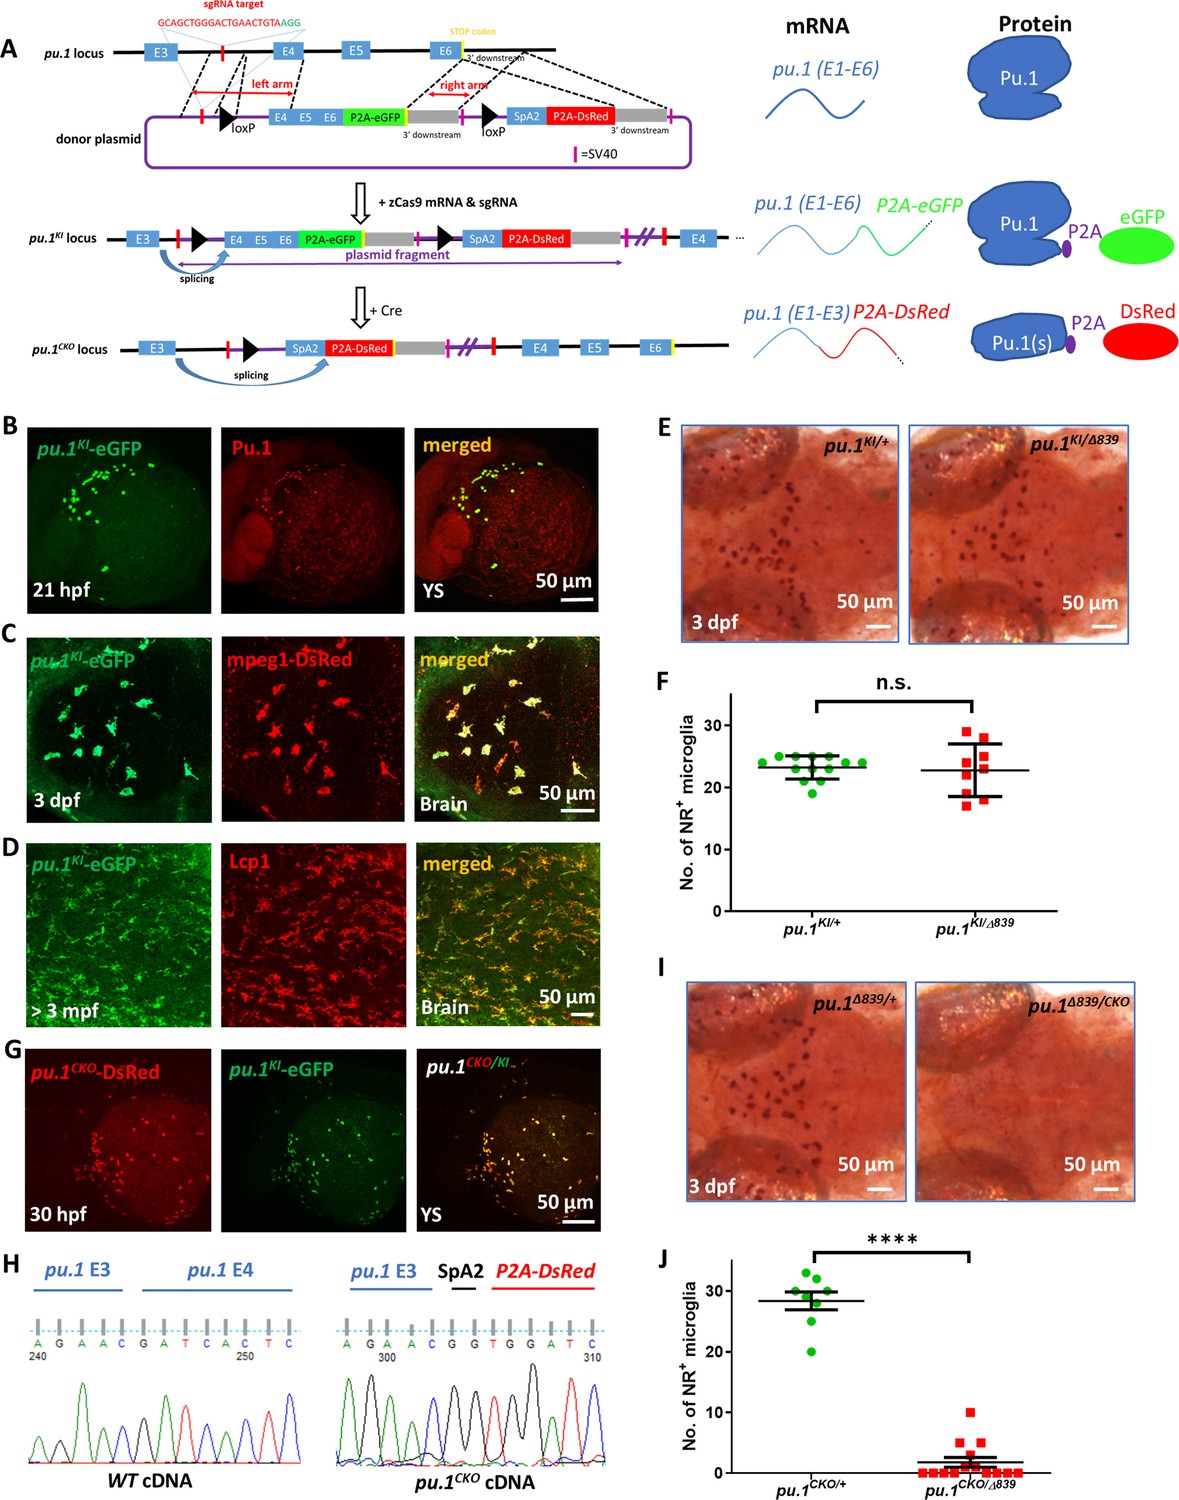
Generation and characterization of the visible conditional knockout allele pu.1KI.
(A) Schematic diagrams show the generation of pu.1KI allele and the principle for pu.1 visible conditional knockout. Briefly, the donor plasmid, which contains: (1) the sgRNA target sequence in pu.1 intron 3~4; (2) the loxP-flanked pu.1 coding sequence (exon 4-6) followed by P2A-eGFP; (3) the splicing acceptor site followed by P2A-DsRed sequence was knocked into the endogenous pu.1 locus via non-homologous end joining (NHEJ) to generate pu.1KI. In principle, the splicing event occurring between E3 and E4 in pu.1KI would produce intact Pu.1 and eGFP concurrently. After Cre-mediated recombination, removal of pu.1 E4-6 and splicing of P2A-DsRed sequence in pu.1CKO allele leads to the disruption of Pu.1 and fluorescent color change. (B) Co-staining of anti-eGFP and anti-Pu.1 antibodies on the yolk sac (YS) of 21-hpf pu.1KI embryos. (C) Fluorescent imaging of the optic tectum (OT) region of 3-dpf pu.1KI;Tg(mpeg1:LRLG) embryos. (D) Co-staining of anti-eGFP and anti-Lcp1 antibodies on the midbrain cross section of adult pu.1KI fish. (E) Neutral red staining of pu.1KI/+ and pu.1KI/Δ839 embryos at 3 dpf. (F) Quantification of NR+ microglia in pu.1KI/+ (n=13) and pu.1 KI/Δ839 (n=9) embryos at 3 dpf. (G) Fluorescent imaging of the YS region of 30-hpf pu.1KI/CKO embryos. (H) Chromogram of cDNA sequence from wildtype and pu.1CKO embryos shows the precise splicing of pu.1 E4 and P2A-DsRed cassette to pu.1 E3. (I) Neutral red staining of pu.1CKO/+ and pu.1CKO/Δ839 embryos at 3 dpf. (J) Quantification of NR+ microglia in pu.1CKO/+ (n=8) and pu.1CKO/Δ839 embryos at 3 dpf (n=14). n.s.=not significant, p>0.05; ****p<0.0001.
Figure 2—figure supplement 1

Characterization of pu.1KI and pu.1CKO alleles.
(A) Summary of the efficiency for the generation and screening of pu.1KI. (B) Gel image shows the amplified 5‘- and 3’-junction of the donor plasmid integration site in pu.1KI allele. (C) Summary of the genomic DNA sequences of the 5’- and 3’-junction in pu.1KI allele from different F0 founders. (D) Quantitative RT-PCR shows the relative expression of DsRed and pu.1 from pu.1CKO allele.
-
Figure 2—figure supplement 1—source data 1
Original file for blots of Figure 2—figure supplement 1B.
- https://cdn.elifesciences.org/articles/105788/elife-105788-fig2-figsupp1-data1-v1.zip
-
Figure 2—figure supplement 1—source data 2
Original blots of Figure 2—figure supplement 1B indicating the relevant bands.
- https://cdn.elifesciences.org/articles/105788/elife-105788-fig2-figsupp1-data2-v1.zip
Figure 3 with 6 supplements
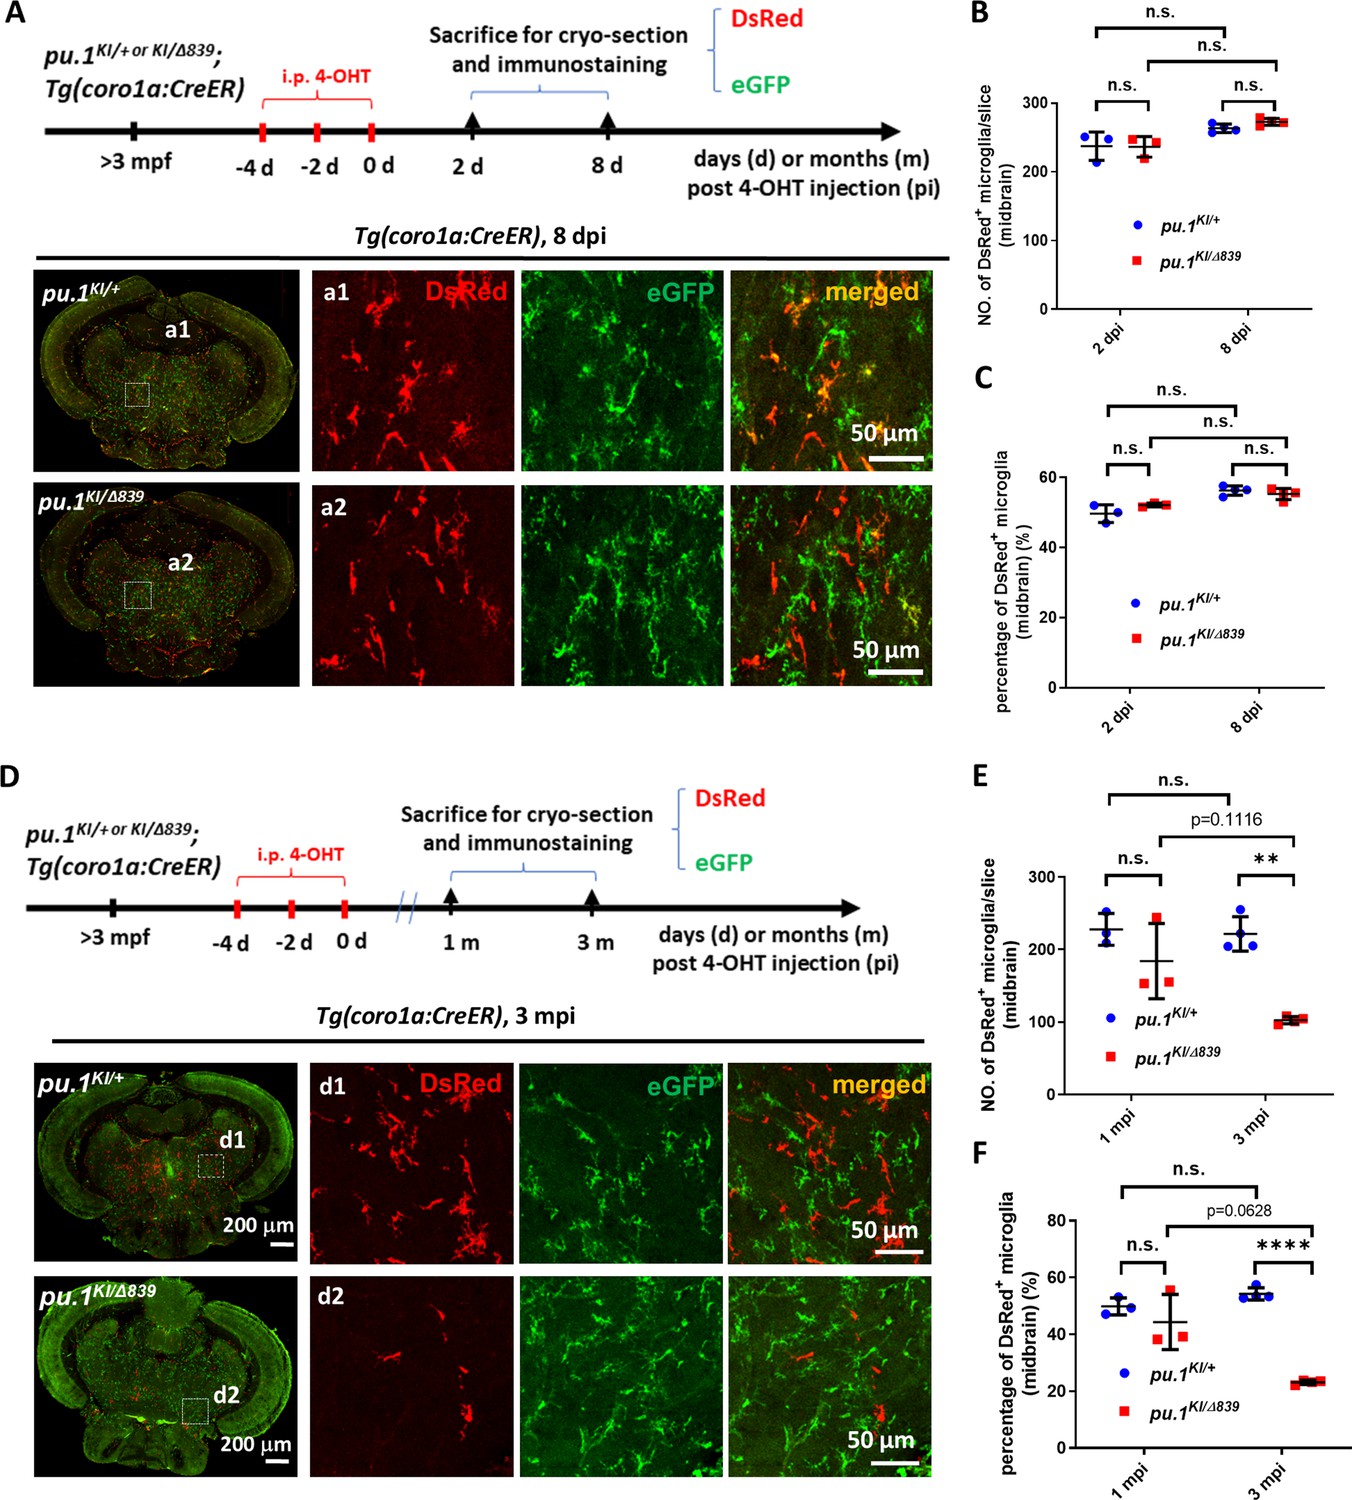
pu.1-deficient microglia were chronically eliminated in mosaic condition.
(A) The experimental setup for pu.1 conditional knockout in adult zebrafish and the representative images of midbrain cross section of pu.1KI/+;Tg(coro1a:CreER) and pu.1KI/Δ839;Tg(coro1a:CreER) fish at 8 days post 4-OHT injection (dpi). (B) Quantification of the number of DsRed+ microglia on the midbrain cross section of pu.1KI/+;Tg(coro1a:CreER) and pu.1KI/Δ839;Tg(coro1a:CreER) fish at 2 dpi (n=3) and 8 dpi (n=4). (C) Quantification of the proportion of DsRed+ microglia on the midbrain cross section of pu.1KI/+;Tg(coro1a:CreER) and pu.1KI/Δ839;Tg(coro1a:CreER) fish at 2 dpi (n=3) and 8 dpi (n=4). (D) The experimental setup for pu.1 conditional knockout in adult zebrafish and the representative images of midbrain cross section of pu.1KI/+;Tg(coro1a:CreER) and pu.1KI/Δ839;Tg(coro1a:CreER) fish at 3 months post 4-OHT injection (mpi). (E) Quantification of the number of DsRed+ microglia on the midbrain cross section of pu.1KI/+;Tg(coro1a:CreER) and pu.1KI/Δ839;Tg(coro1a:CreER) fish at 1 mpi (n=3) and 3 mpi (n=4). (F) Quantification of the proportion of DsRed+ microglia on the midbrain cross section of pu.1KI/+;Tg(coro1a:CreER) and pu.1KI/Δ839;Tg(coro1a:CreER) fish at 1 mpi (n=3) and 3 mpi (n=4). n.s.=not significant, p>0.05; **p<0.01; ****p<0.0001.
Figure 3—figure supplement 1

Conditional depletion of Pu.1 in embryonic microglia had no effect on their short-term survival.
(A) Schematics of 4-OHT treatment for pu.1KI/WT Tg(coro1a:CreER) and pu.1KI/Δ839 Tg(coro1a:CreER) at embryonic stage. (B) Representative images of DsRed+ microglia in pu.1KI/WT and pu.1KI/Δ839 at 5 dpf.
Figure 3—figure supplement 2

Microglia number is not affected in pu.1Δ839 null mutants.
(A) Representative images show the co-staining of eGFP and Lcp1 antibodies on the midbrain cross section of adult pu.1Δ839/+;TgBAC(ccl34b.1:eGFP) and pu.1Δ839/Δ839;TgBAC(ccl34b.1:eGFP) fish. eGFP+ cells represent microglia, whereas eGFP-Lcp1+ cells are dendritic cells (DCs). (B) Quantification of the number of eGFP+ microglia and eGFP-Lcp1+ DCs on the midbrain cross section of adult pu.1Δ839/+;TgBAC(ccl34b.1:eGFP) (n=6) and pu.1Δ839/Δ839;TgBAC(ccl34b.1:eGFP) (n=5) fish. n.s.=not significant, p>0.05.
Figure 3—figure supplement 3

Simultaneous inactivation of Pu.1 and Spi-b leads to rapid elimination of microglia in zebrafish.
(A) The experimental setup for pu.1 conditional knockout in adult spi-bΔ232/Δ232 mutants and the representative images of the midbrain cross section of adult pu.1KI/+;spi-bΔ232/Δ232;Tg(coro1a:CreER) and pu.1KI/Δ839;spi-bΔ232/Δ232;Tg(coro1a:CreER) fish at 2 dpi and 8 dpi. The white arrow indicates microglia with blebbing morphology. (B–C) Quantification of the number (B) and percentage (C) of DsRed+ microglia in adult pu.1KI/+;spi-bΔ232/Δ232;Tg(coro1a:CreER) and pu.1KI/Δ839;spi-bΔ232/Δ232;Tg(coro1a:CreER) fish at 2 and 8 dpi (n=3 for all groups). (D) The experimental setup for pu.1 conditional knockout in spi-bΔ232/Δ232 mutant embryos and the representative images show the DsRed +microglia in pu.1KI/+;spi-bΔ232/Δ232;Tg(coro1a:CreER) and pu.1KI/Δ839;spi-bΔ232/Δ232;Tg(coro1a:CreER) embryos at 3 and 5 dpf. (E) Quantification of the number of DsRed +microglia in pu.1KI/+;spi-bΔ232/Δ232;Tg(coro1a:CreER) and pu.1KI/Δ839;spi-bΔ232/Δ232;Tg(coro1a:CreER) embryos at 3 and 5 dpf after 4-OHT treatment from 48 to 60 hpf. (pu.1KI/+;spi-bΔ232/Δ232;Tg(coro1a:CreER) n=4 and 6 for 3 and 5 dpf, respectively. pu.1KI/Δ839;spi-bΔ232/Δ232;Tg(coro1a:CreER) n=8 for both 3 and 5 dpf) n.s.=not significant, p>0.05;***p<0.001;****p<0.0001.
Figure 3—figure supplement 4

Pu.1/Spi-b-deficient microglia undergo apoptosis in zebrafish.
(A) Time-lapse live imaging shows the blebbing and fragmentation of DsRed+ microglia between 3 dpf and 5 dpf in pu.1KI/Δ839;spi-bΔ232/Δ232;Tg(coro1a:CreER) embryos treated with 4-OHT from 48 hpf to 60 hpf. The blue arrows indicate the formation of apoptotic cell bodies. (B) Fluorescent live imaging of Annexin V, DsRed and eGFP signals in 4-dpf pu.1KI/+;spi-bΔ232/Δ232;Tg(coro1a:CreER) and pu.1KI/Δ839;spi-bΔ232/Δ232;Tg(coro1a:CreER) embryos treated with 4-OHT from 48 hpf to 60 hpf and subjected to brain injection of Annexin V-647. (C) Quantification of DsRed+Annexin+ microglia in (B). (pu.1KI/+;spi-bΔ232/Δ232;Tg(coro1a:CreER) n=11, pu.1KI/Δ839;spi-bΔ232/Δ232;Tg(coro1a:CreER) n=12) ***p<0.001.
Figure 3—figure supplement 5

Conditional inactivation of Pu.1 leads to chronic elimination of microglia in the spinal cord and retina of adult zebrafish.
(A) Representative images of the retina cross section of adult pu.1KI/+;Tg(coro1a:CreER) and pu.1KI/Δ839;Tg(coro1a:CreER) fish at 3 mpi. (B) Quantification of the percentage of DsRed+ microglia in the retina of adult pu.1KI/+;Tg(coro1a:CreER) (n=4) and pu.1KI/Δ839;Tg(coro1a:CreER) (n=4) fish at 3 mpi. (C) Representative images of the spinal cord cross section of adult pu.1KI/+;Tg(coro1a:CreER) and pu.1KI/Δ839;Tg(coro1a:CreER) fish at 3 mpi. (D) Quantification of the percentage of DsRed+ microglia in the spinal cord of adult pu.1KI/+;Tg(coro1a:CreER) (n=4) and pu.1KI/Δ839;Tg(coro1a:CreER) (n=4) fish at 3 mpi. **p<0.01; ****p<0.0001.
Figure 3—figure supplement 6

Conditional inactivation of Pu.1 leads to chronic elimination of microglia in the brain of adult zebrafish.
(A) Representative images showing different morphology of microglia (ccl34b.1-eGFP+Lcp1+) and DCs (ccl34b.1-eGFP-Lcp1+) in two midbrain regions of TgBAC(ccl34b.1:eGFP) fish. The amoeboid and ramified cells were indicated accordingly. (B) Quantification of the proportion of microglia (ccl34b.1-eGFP+Lcp1+) (n=3) and DCs (n=3) (ccl34b.1-eGFP-Lcp1+) in total amoeboid and ramified Lcp1+ cells in the midbrain of TgBAC(ccl34b.1:eGFP) fish. (C) Quantification of the number of DsRed+ microglia and dendritic cells (DCs) on the midbrain cross section of pu.1KI/+;Tg(coro1a:CreER) (n=4) and pu.1KI/Δ839;Tg(coro1a:CreER) (n=4) fish at 3 mpi by amoeboid and ramified morphologies. (D) Quantification of the proportion of DsRed+ microglia and DCs on the midbrain cross section of pu.1KI/+;Tg(coro1a:CreER) (n=4) and pu.1KI/Δ839;Tg(coro1a:CreER) (n=4) fish at 3 mpi by amoeboid and ramified morphologies. **p<0.01; ***p<0.001;****p<0.0001.
Figure 4
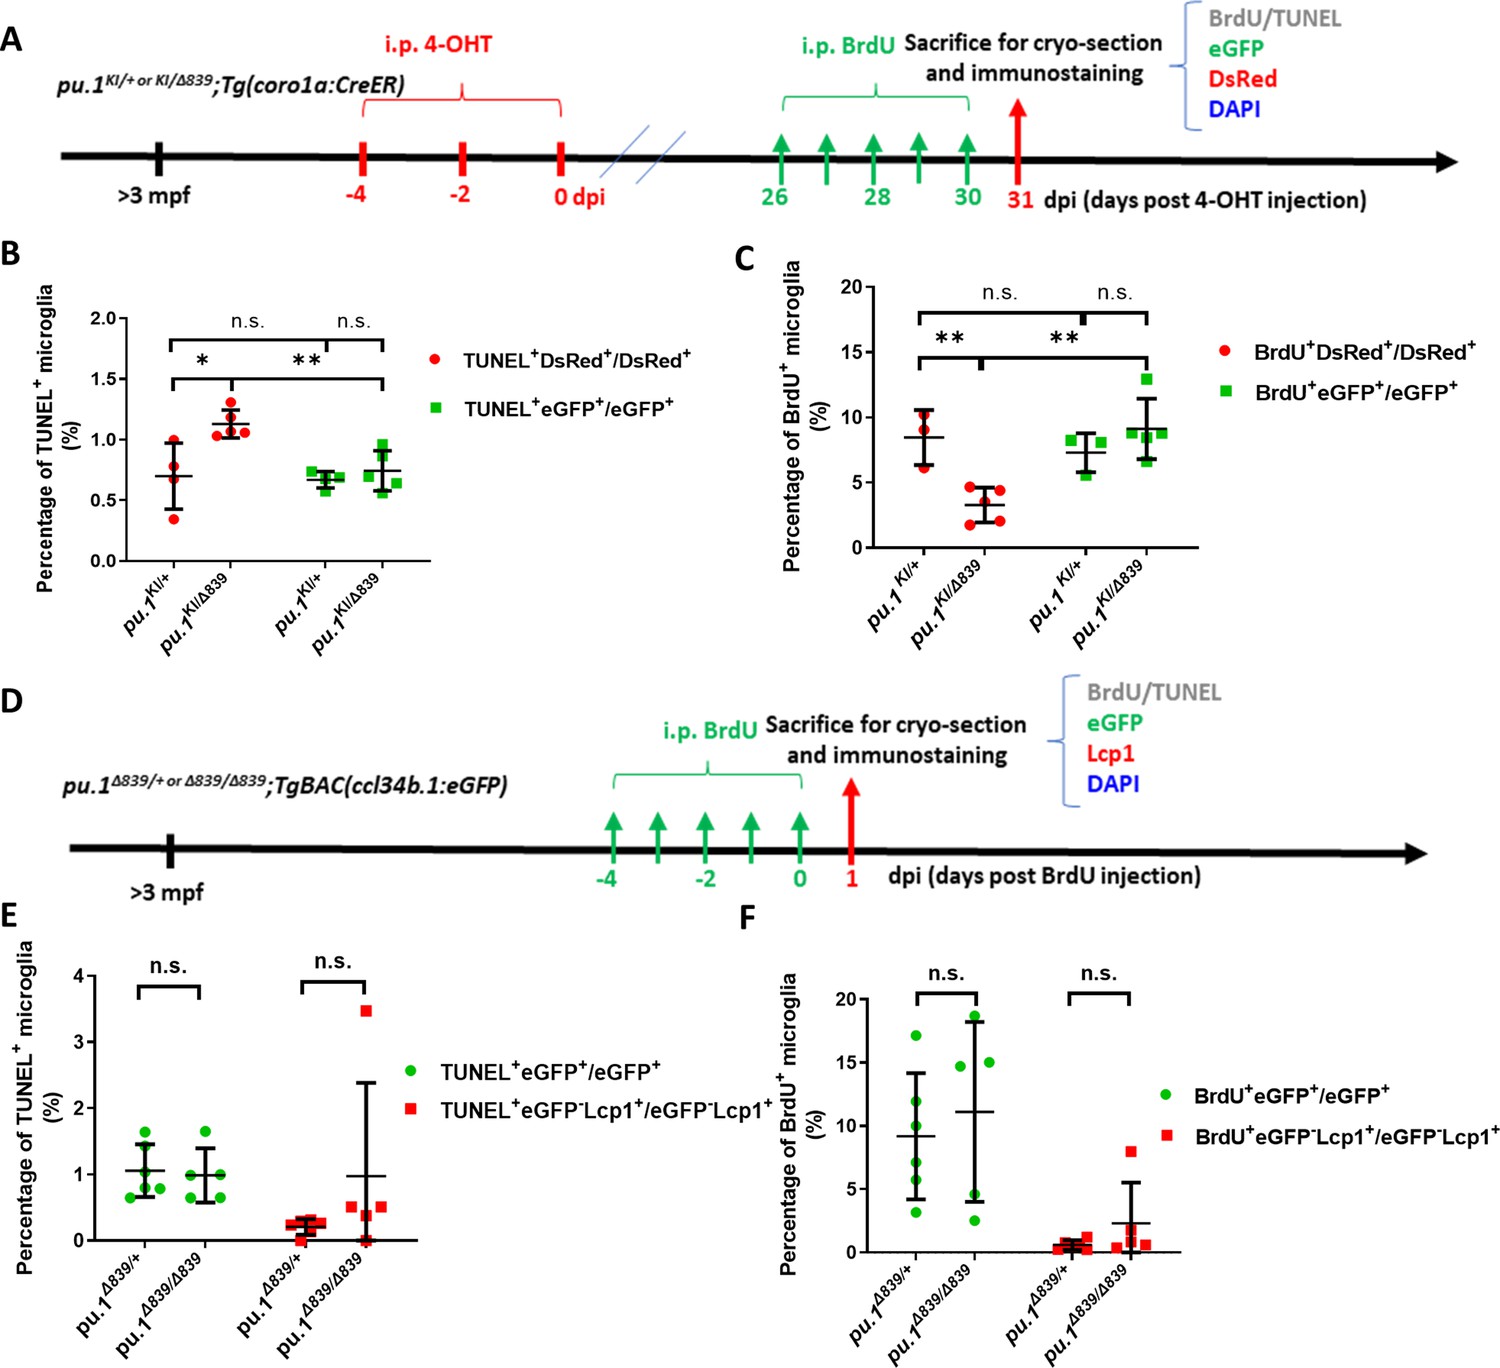
pu.1-deficient microglia in mosaic condition were eliminated by cell competition.
(A) The experimental setup for BrdU incorporation and TUNEL assays in adult pu.1KI/+;Tg(coro1a:CreER) and pu.1KI/Δ839;Tg(coro1a:CreER) fish at 1 mpi. (B) Quantification of the percentage of TUNEL+ cells in eGFP+ and DsRed+ microglia in pu.1KI/+;Tg(coro1a:CreER) (n=4) and pu.1KI/Δ839;Tg(coro1a:CreER) (n=5) fish at 1 mpi. (C) Quantification of the percentage of BrdU+ cells in eGFP+ and DsRed+ microglia in adult pu.1KI/+;Tg(coro1a:CreER) (n=4) and pu.1KI/Δ839;Tg(coro1a:CreER) fish at 1 mpi. (D) The experimental setup for BrdU incorporation and TUNEL assays in adult pu.1Δ839/+;TgBAC(ccl34b.1:eGFP) and pu.1Δ839/Δ839;TgBAC(ccl34b.1:eGFP) fish. (E) Quantification of the percentage of TUNEL+eGFP+ microglia in adult pu.1Δ839/+;TgBAC(ccl34b.1:eGFP) and pu.1Δ839/Δ839;TgBAC(ccl34b.1:eGFP) fish. (F) Quantification of the percentage of BrdU+eGFP+ microglia in adult pu.1Δ839/+;TgBAC(ccl34b.1:eGFP) (n=6) and pu.1Δ839/Δ839;TgBAC(ccl34b.1:eGFP) (n=5) fish. n.s.=not significant, p>0.05; *p<0.05; **p<0.01.
Figure 5 with 3 supplements
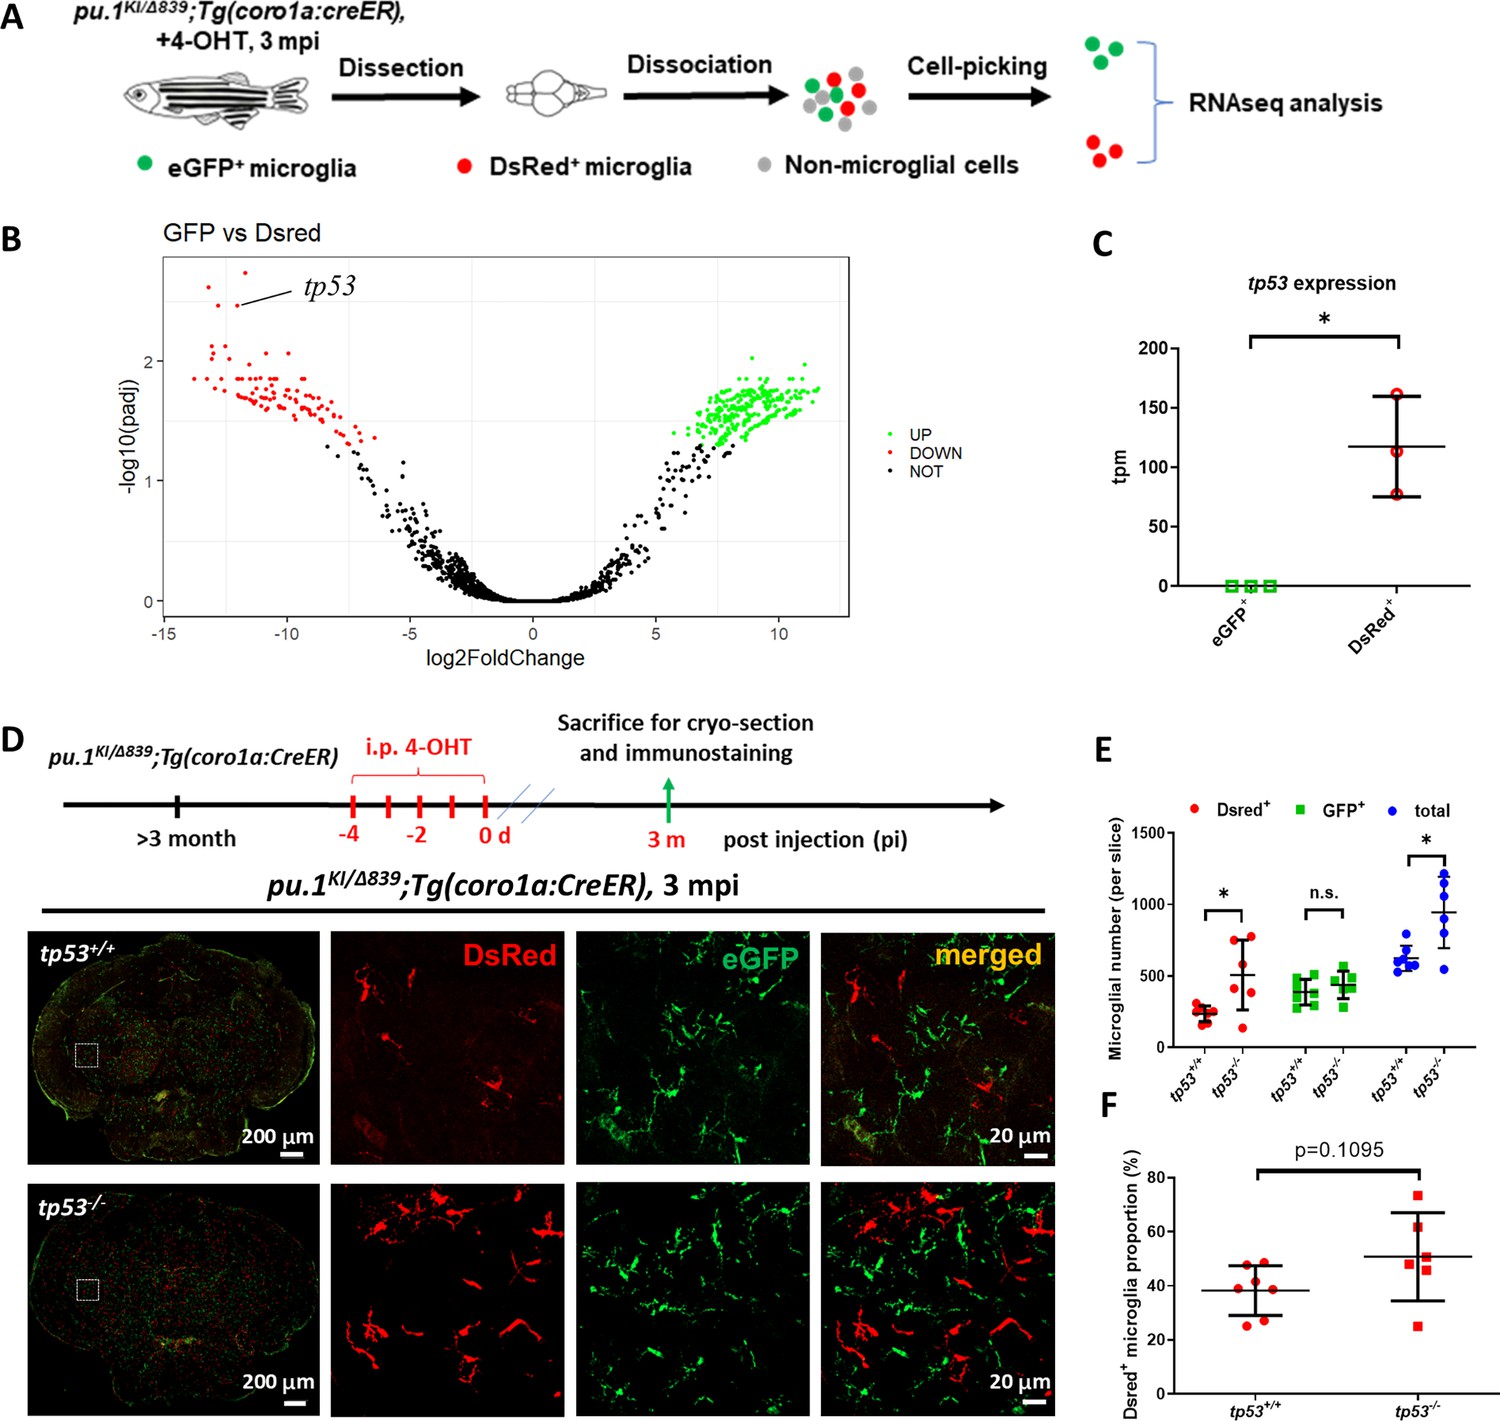
Inactivation of Tp53 largely restored the number of pu.1-deficient microglia in mosaic condition.
(A) The experimental setup for the isolation of eGFP+ and DsRed+ microglia from pu.1KI/Δ839;Tg(coro1a:CreER) adult brain at 3 mpi for transcriptomic analysis. (B) The volcano plot of differentially expressed genes (DEG) between eGFP+ and DsRed+ microglia at 3 mpi. (C) Relative expression of tp53 in eGFP+ (n=3) and DsRed+ (n=3) microglia at 3 mpi by transcripts per million (TPM). (D) The experimental setup for pu.1 conditional knockout in wild-type and tp53-/- adult zebrafish, and the representative images of midbrain cross section of pu.1KI/Δ839;Tg(coro1a:CreER) and pu.1KI/Δ839;tp53-/-;Tg(coro1a:CreER) fish at 3 mpi. (E) Quantification of the number of DsRed+, eGFP+, and total (DsRed + eGFP) microglia in pu.1KI/Δ839;Tg(coro1a:CreER) (n=7) and pu.1KI/Δ839;tp53-/-;Tg(coro1a:CreER) (n=6) fish at 3 mpi. (F) Quantification of the proportion of DsRed+ microglia in pu.1KI/Δ839;Tg(coro1a:CreER) (n=7) and pu.1KI/Δ839;tp53-/-;Tg(coro1a:CreER) (n=6) fish at 90 dpi. n.s.=not significant, p>0.05; *p<0.05.
Figure 5—figure supplement 1
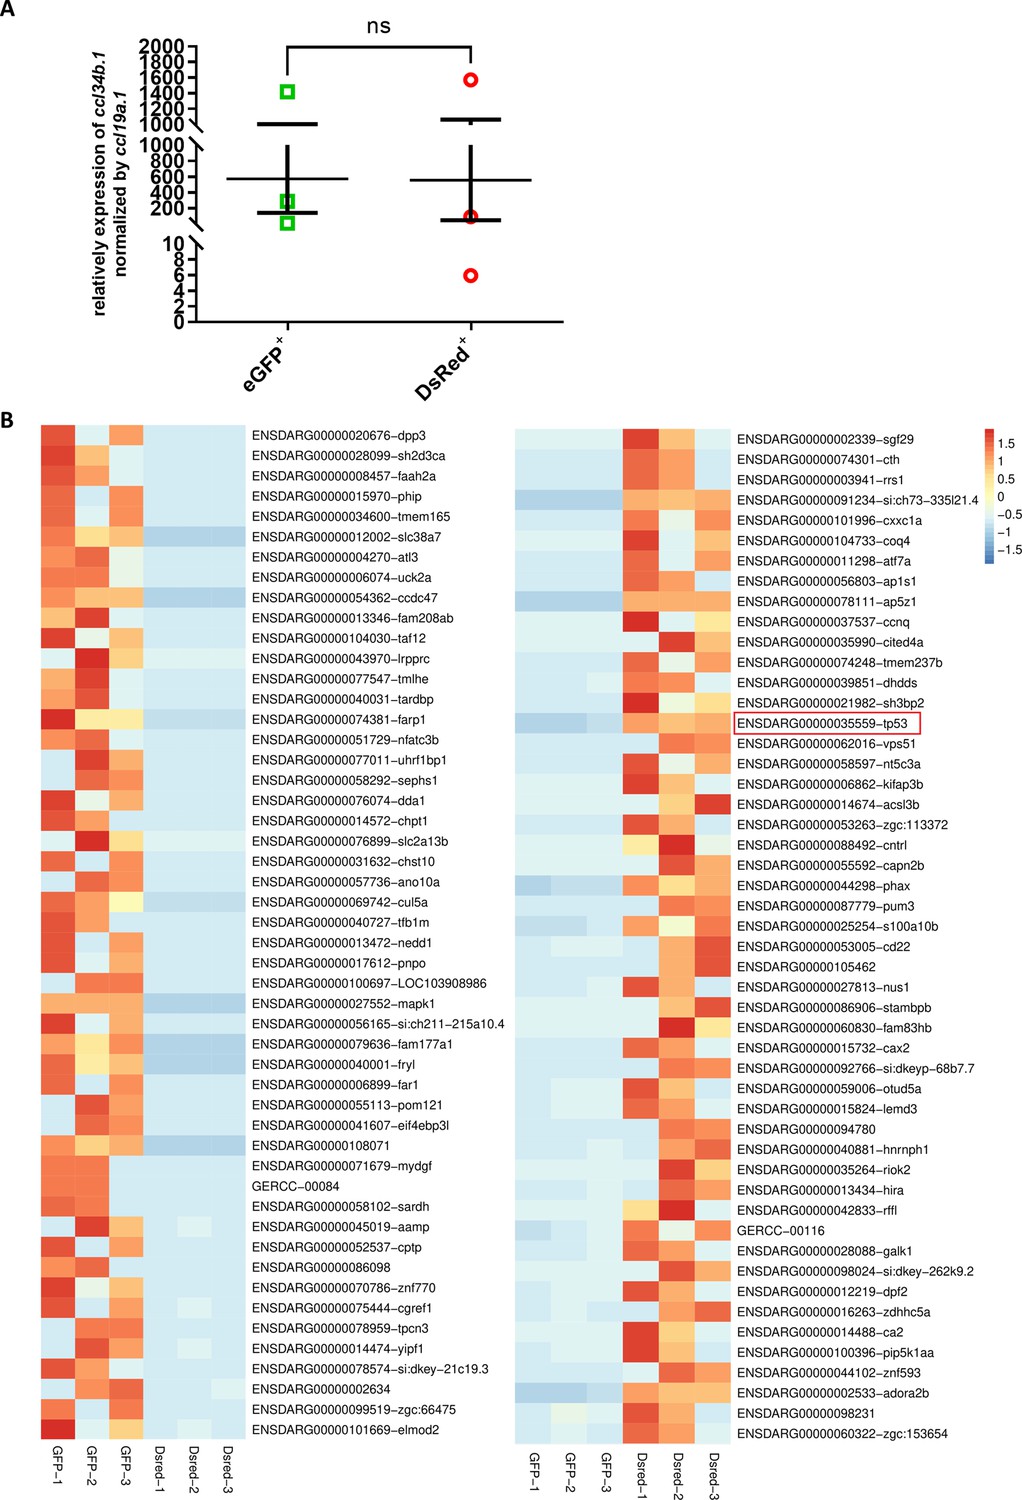
RNA-seq analysis of pu.1-deficient microglia.
(A) Relative expression of ccl34b.1 normalized by ccl19a.1 in the picked samples for RNA-seq analysis. (B) Transcripts per million (TPM) heatmap of the top 50 differentially expressed genes in eGFP+ and Dsred+ microglia. Values in the heatmap are centered and scaled in the row direction. The red color represents high expression, while the blue color represents low expression.
Figure 5—figure supplement 2

In-silico analysis of Pu.1 binding sites on the promoter region of tp53.
Three Pu.1 binding sites (GAGGAA) located on the antisense strand from position –1423 to –1418, –1098 to –1093, and –1047 to –1042 relative to the transcriptional start site of tp53 were indicated by red box.
Figure 5—figure supplement 3

csf1ra expression does not decrease after conditional inactivation of Pu.1.
Relative expression of csf1ra in eGFP+ (n=3) and DsRed+ (n=3) microglia at 3 mpi by transcripts per million (TPM).
Figure 6 with 1 supplement
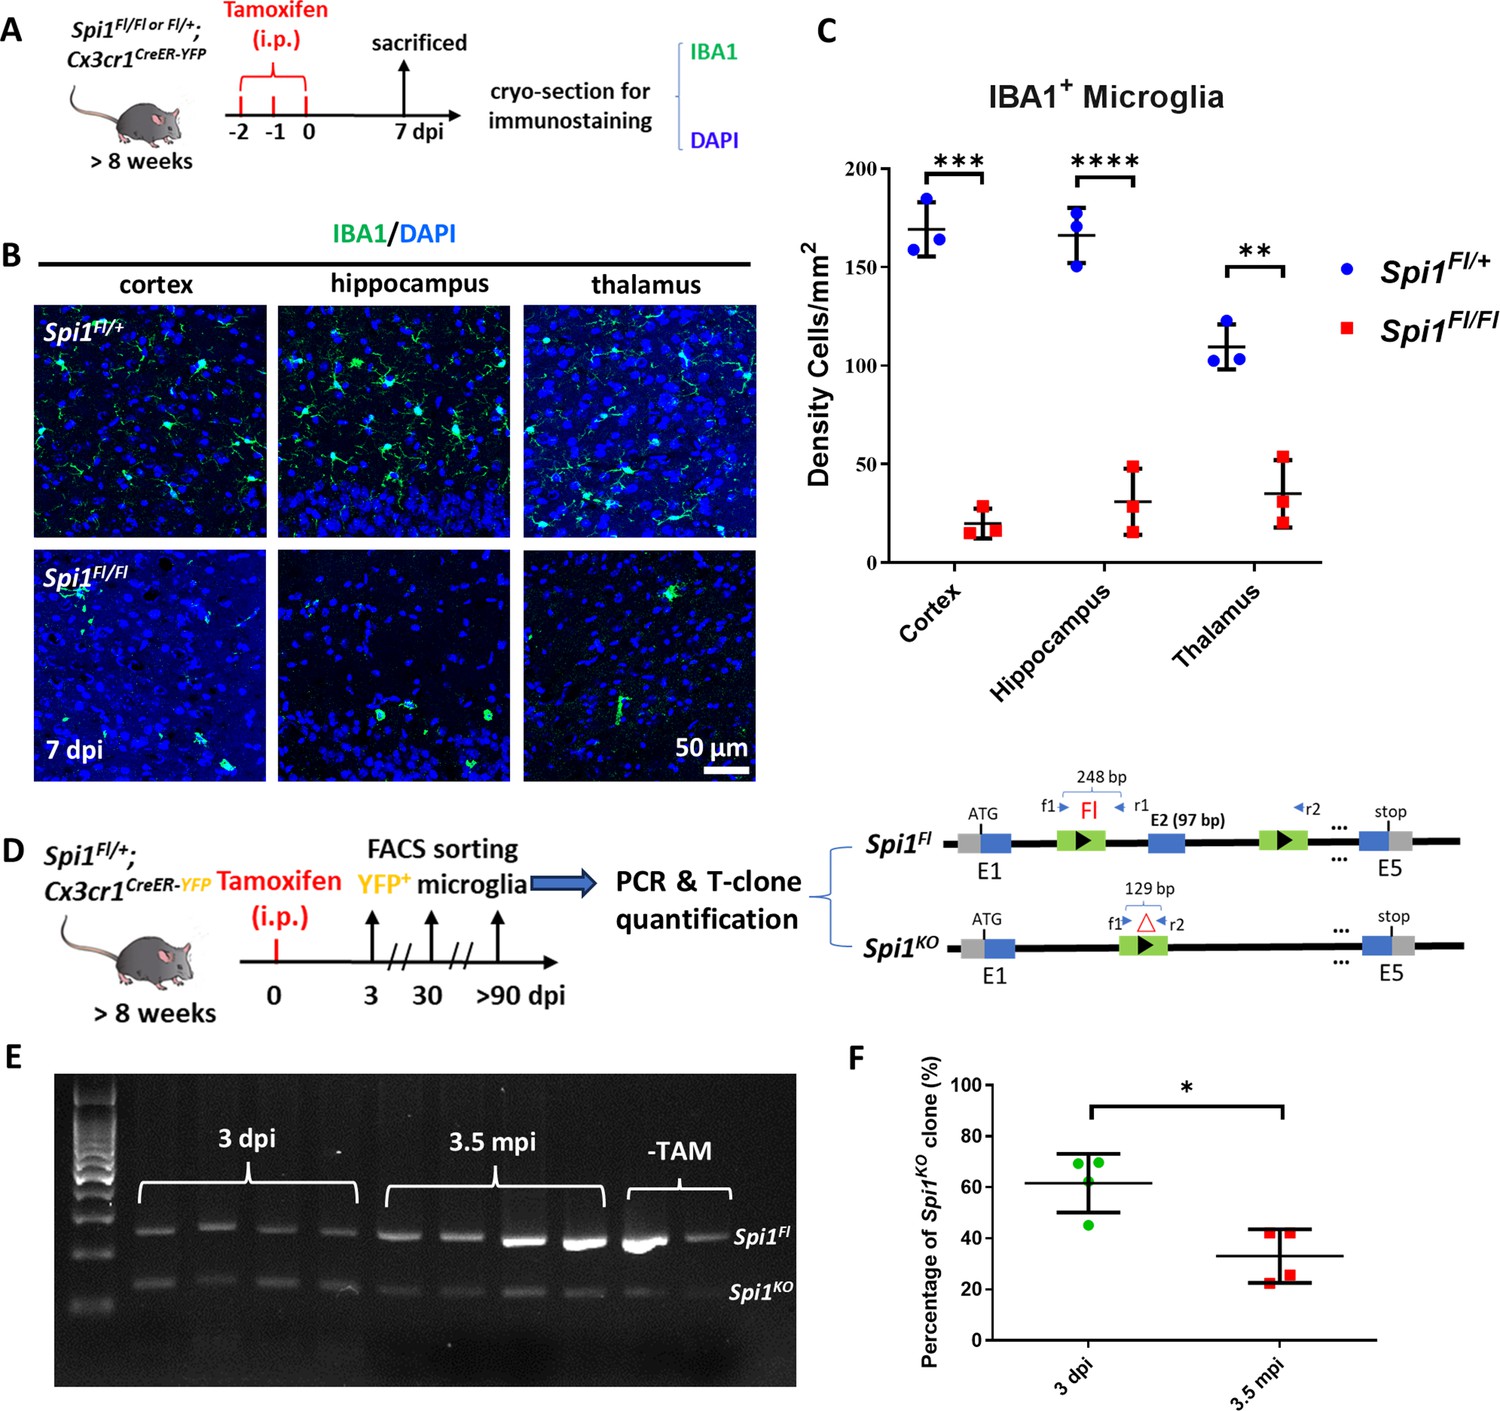
Dosage-dependent regulation of microglia maintenance by Pu.1/Spi1 is evolutionary conserved in mice.
(A) The experimental setup for Spi1 conditional knockout in adult mice. (B) Representative images of IBA1 and DAPI co-staining in the cortex, hippocampus, and thalamus of Spi1Fl/+;Cx3cr1CreER and Spi1Fl/Fl;Cx3cr1CreER mice at 7 dpi. (C) Quantification of the density of IBA1+ microglia in the cortex, hippocampus, and thalamus of Spi1Fl/+;Cx3cr1CreER (n=3) and Spi1Fl/Fl;Cx3cr1CreER (n=3) mice at 7 dpi. (D) The experimental setup for conditional knockout of Spi1 in Spi1Fl/+;Cx3cr1CreER mice, and the subsequent PCR detection and T-clone quantification of Spi1Fl and Spi1KO alleles in sorted YFP+ microglia. (E) Gel image shows the relative intensity of amplified DNA bands of Spi1Fl and Spi1KO alleles in microglia sorted from Spi1Fl/+;Cx3cr1CreER mice at different stages post-tamoxifen (TAM) injection. (F) Quantification of the percentage of Spi1KO allele at 3 dpi (n=4) and 3.5 mpi (n=4) by T-clone assay. *p<0.05; **p<0.01; ***p<0.001; ****p<0.0001.
-
Figure 6—source data 1
Original file for blots of Figure 6E.
- https://cdn.elifesciences.org/articles/105788/elife-105788-fig6-data1-v1.zip
-
Figure 6—source data 2
Original blots of Figure 6E indicating the relevant bands and treatments.
- https://cdn.elifesciences.org/articles/105788/elife-105788-fig6-data2-v1.zip
Figure 6—figure supplement 1

Adult microglia are not affected in Spi1Fl/Fl;Cx3cr1CreER mice.
(A) Quantitative RT-PCR result shows the relative expression of Spi1 (n=3) and Spi-b (n=3) (normalized to Gapdh expression) in sorted microglia from adult mouse brain. (B) Schematic diagram shows the genomic loci of Spi1WT, Spi1Fl, and Spi1KO alleles, respectively. (C) Gel image shows the genotyping result of Spi1WT and Spi1Fl alleles (The image has been updated in the version of record). (D) Representative images of IBA1 and DAPI co-staining in the cortex, hippocampus, and thalamus regions of adult Spi1Fl+/;Cx3cr1CreER and Spi1Fl/ Fl;Cx3cr1CreERmice without tamoxifen (TAM) injection. (E) Quantification of the density (number) of IBA1+ microglia in the cortex, hippocampus, and thalamus regions of adult Spi1Fl/+;Cx3cr1CreER (n=5) and Spi1Fl/Fl;Cx3cr1CreER (n=4) mice. n.s.=not significant, p>0.05. *p<0.05.
-
Figure 6—figure supplement 1—source data 1
Original file for blots of Figure 6—figure supplement 1C.
- https://cdn.elifesciences.org/articles/105788/elife-105788-fig6-figsupp1-data1-v1.zip
-
Figure 6—figure supplement 1—source data 2
Original blots of Figure 6—figure supplement 1C indicating the relevant bands.
- https://cdn.elifesciences.org/articles/105788/elife-105788-fig6-figsupp1-data2-v1.zip
Additional files
-
Supplementary file 1
The table generated by Deseq2 shows read counts, fold changes, and adjusted p-values of RNA-seq results.
- https://cdn.elifesciences.org/articles/105788/elife-105788-supp1-v1.xlsx
Download links
A two-part list of links to download the article, or parts of the article, in various formats.
Downloads (link to download the article as PDF)
Open citations (links to open the citations from this article in various online reference manager services)
Cite this article (links to download the citations from this article in formats compatible with various reference manager tools)
Pu.1/Spi1 dosage controls the turnover and maintenance of microglia in zebrafish and mammals
eLife 14:RP105788.
https://doi.org/10.7554/eLife.105788.3


