Phage-displayed synthetic library and screening platform for nanobody discovery
- Department of Genetics, Blavatnik Institute, Harvard Medical School, United States
- Department of Immunobiology, Yale School of Medicine, United States
- Department of Microbiology and Immunology, Dalhousie University, Canada
- Drosophila RNAi Screening Center, Harvard Medical School, Canada
- Division of Translational Science and Therapeutics, Fred Hutchinson Cancer Center, United States
- Howard Hughes Medical Institute, United States
Figures
Figure 1
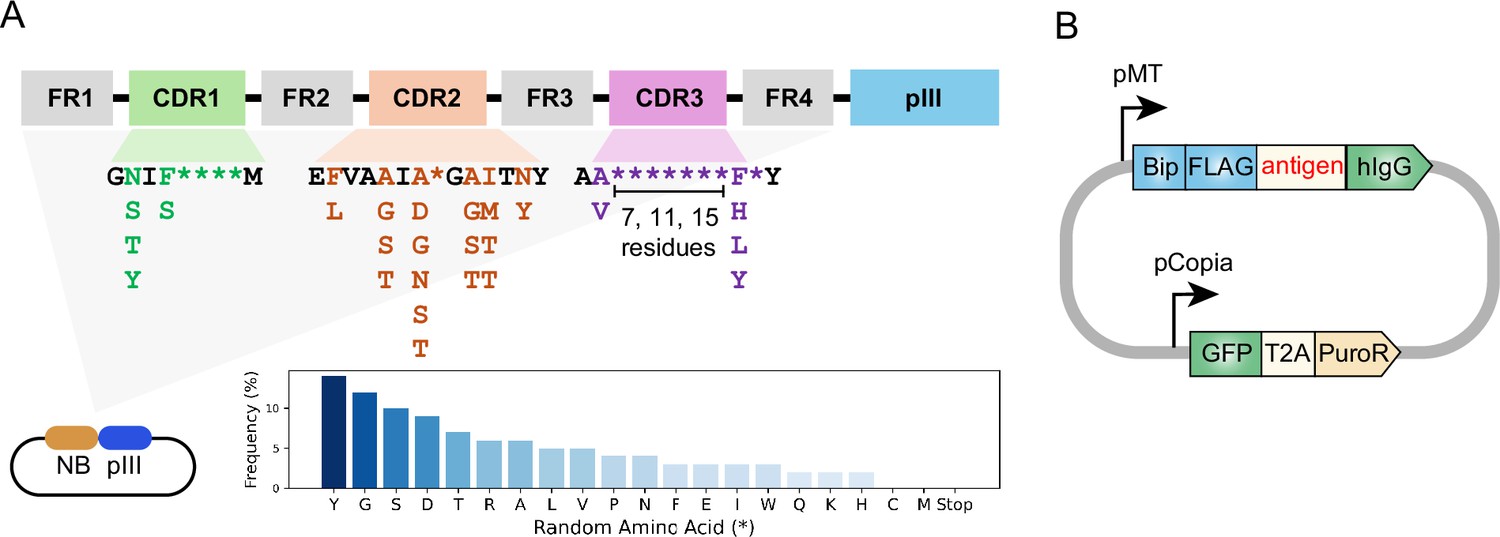
Design of synthetic nanobody library and antigen-expressing vector.
(A) Schematic of synthetic nanobody library design. Nanobody sequences were inserted at the 5’ end of pIII sequence in the phagemid. Nanobody sequences contain constant framework (FR1-FR4) and randomized regions within the CDRs. The randomization in highly variable positions is indicated as asterisks (*). The frequencies of amino acids in the variable positions are indicated in the bar chart. Cysteine and methionine were eliminated from design to avoid chemical reactivity. The CDR3 region was designed with varying lengths (7, 11, or 15 residues). (B) Schematic of antigen-expressing vector. Antigen expression was driven by an inducible metallothionein (MT) promoter. The antigen is fused to an N-terminal BiP signal peptide and FLAG-tag, as well as a C-terminal human Immunoglobulin G (hIgG) Fc domain. GFP-T2A-PuroR cassette is driven by Copia promoter for fluorescence labeling and antibiotics selection.
Figure 2 with 5 supplements
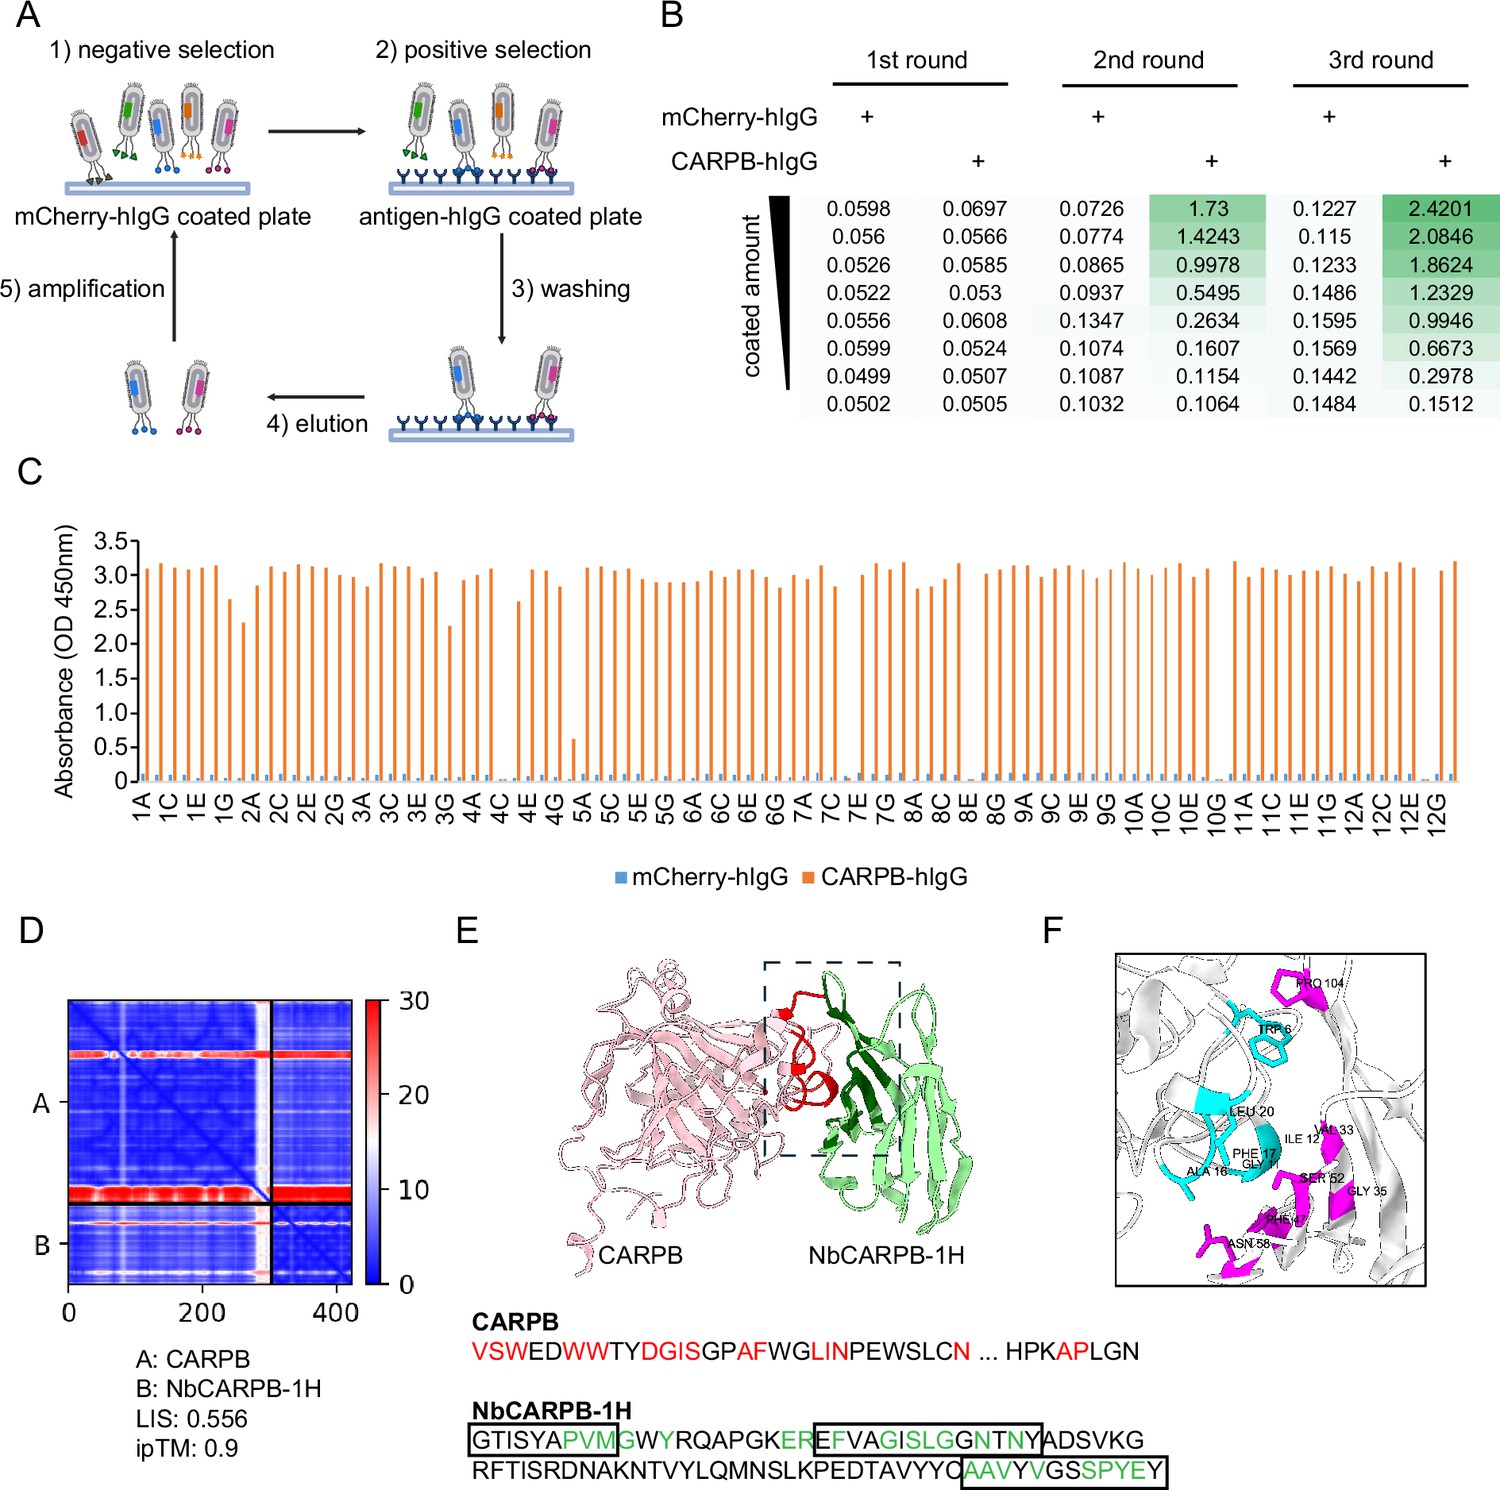
Nanobody screen for CARPB.
(A) Schematic of nanobody screening. The mCherry-hIgG-coated plate was used for negative selection and the antigen-hIgG-coated plate was used for positive selection. Three iterative rounds of screening were performed for each antigen. (B) ELISA with polyclonal phages from three rounds of selection in CARPB screen campaign. The mCherry-hIgG and CARPB-hIgG were coated in decreasing amounts across different rows. The intensity of green color represents the ELISA signal strength. (C) ELISA with monoclonal phages from the third round of selection in the CARPB screen campaign. 96 monoclonal phages were tested against mCherry-hIgG and CARPB-hIgG. (D) Predicted Aligned Error (PAE) map generated using AlphaFold-Multimer for the CARPB-NbCARPB-1H complex. Low PAE values, shown in blue, indicate accurate predictions for the interaction interfaces, depicted in the top right and bottom left quadrants. High Local Interaction Score (LIS) and interface TM-score (ipTM) values confirm the structural reliability of the interface. (E) Predicted 3D structure of the CARPB-NbCARPB-1H complex, showing the interaction interface. The region enclosed by the dotted box corresponds to the interaction interface visualized in panel F. Residues involved in the interaction (within 8 Å distance) are marked in red (CARPB) and green (NbCARPB-1H) in the structure and protein sequences. CDRs in the protein sequence are marked by boxes. The interaction predominantly occurs within these CDR regions. (F) Neighboring residues between CARPB and NbCARPB-1H, showing residues within a 5 Å distance. Cyan indicates residues of CARPB, and magenta indicates residues of NbCARPB-1H. Each residue is labeled with its residue name and number.
Figure 2—figure supplement 1
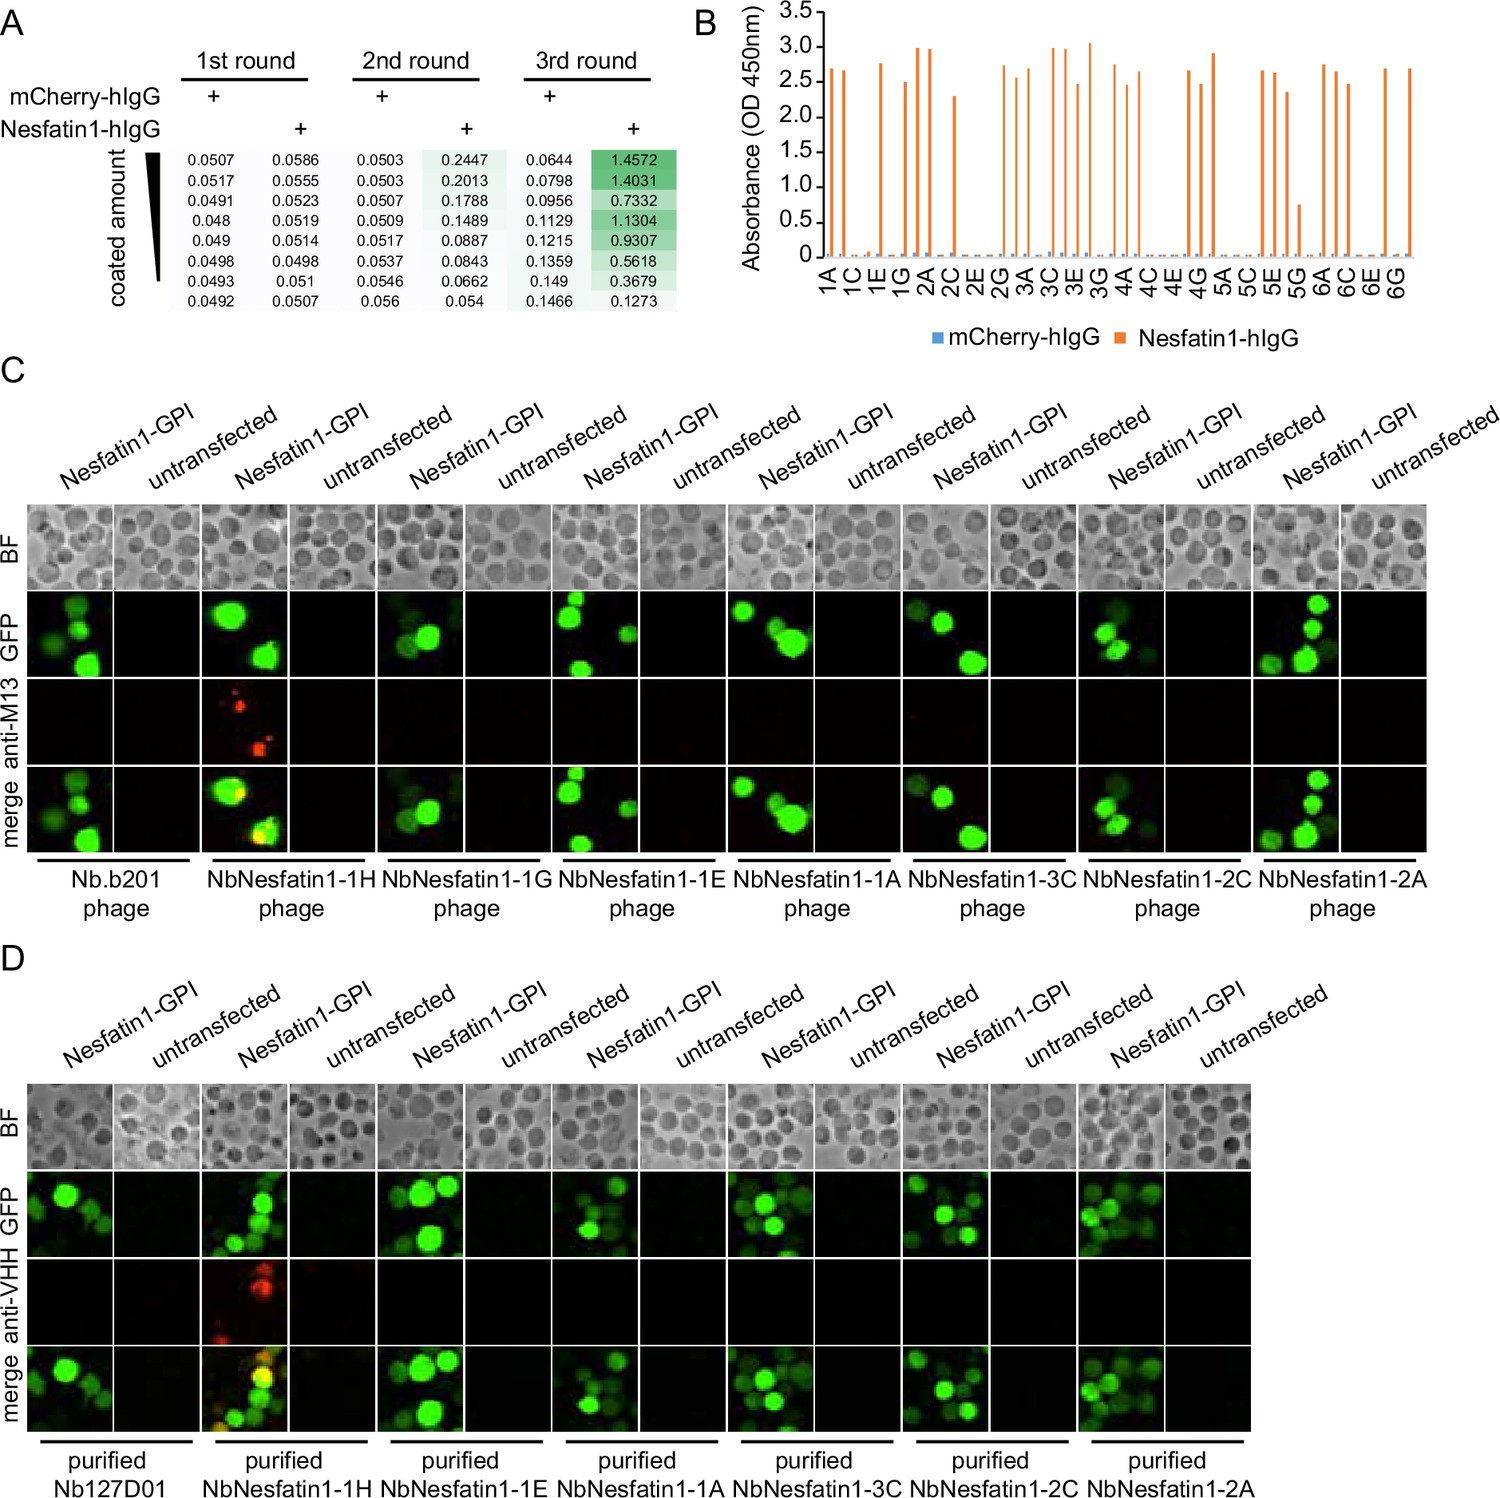
Nanobody screen for Nesfatin-1.
(A) ELISA with polyclonal phages from three rounds of selection in Nesfatin-1 screen campaign. The mCherry-hIgG and Nesfatin1-hIgG were coated in decreasing amounts across different rows. The intensity of green color represents the ELISA signal strength. (B) ELISA with monoclonal phages from the third round of selection in Nesfatin1 screen campaign. 48 monoclonal phages were tested against mCherry-hIgG and Nesfatin1-hIgG. (C) Nesfatin1-expressing cells stained with nanobody-displaying phages. GFP signals mark cells expressing membrane-tethered Nesfatin-1. Nb.b201 phage, an irrelevant nanobody displaying phage, was used as negative control. BF, bright field. (D) Nesfatin1-expressing cells stained with purified nanobodies. GFP signals label the cells expressing membrane-tethered Nesfatin-1. Nb127D01 is an irrelevant nanobody used as negative control. BF, bright field.
Figure 2—figure supplement 2
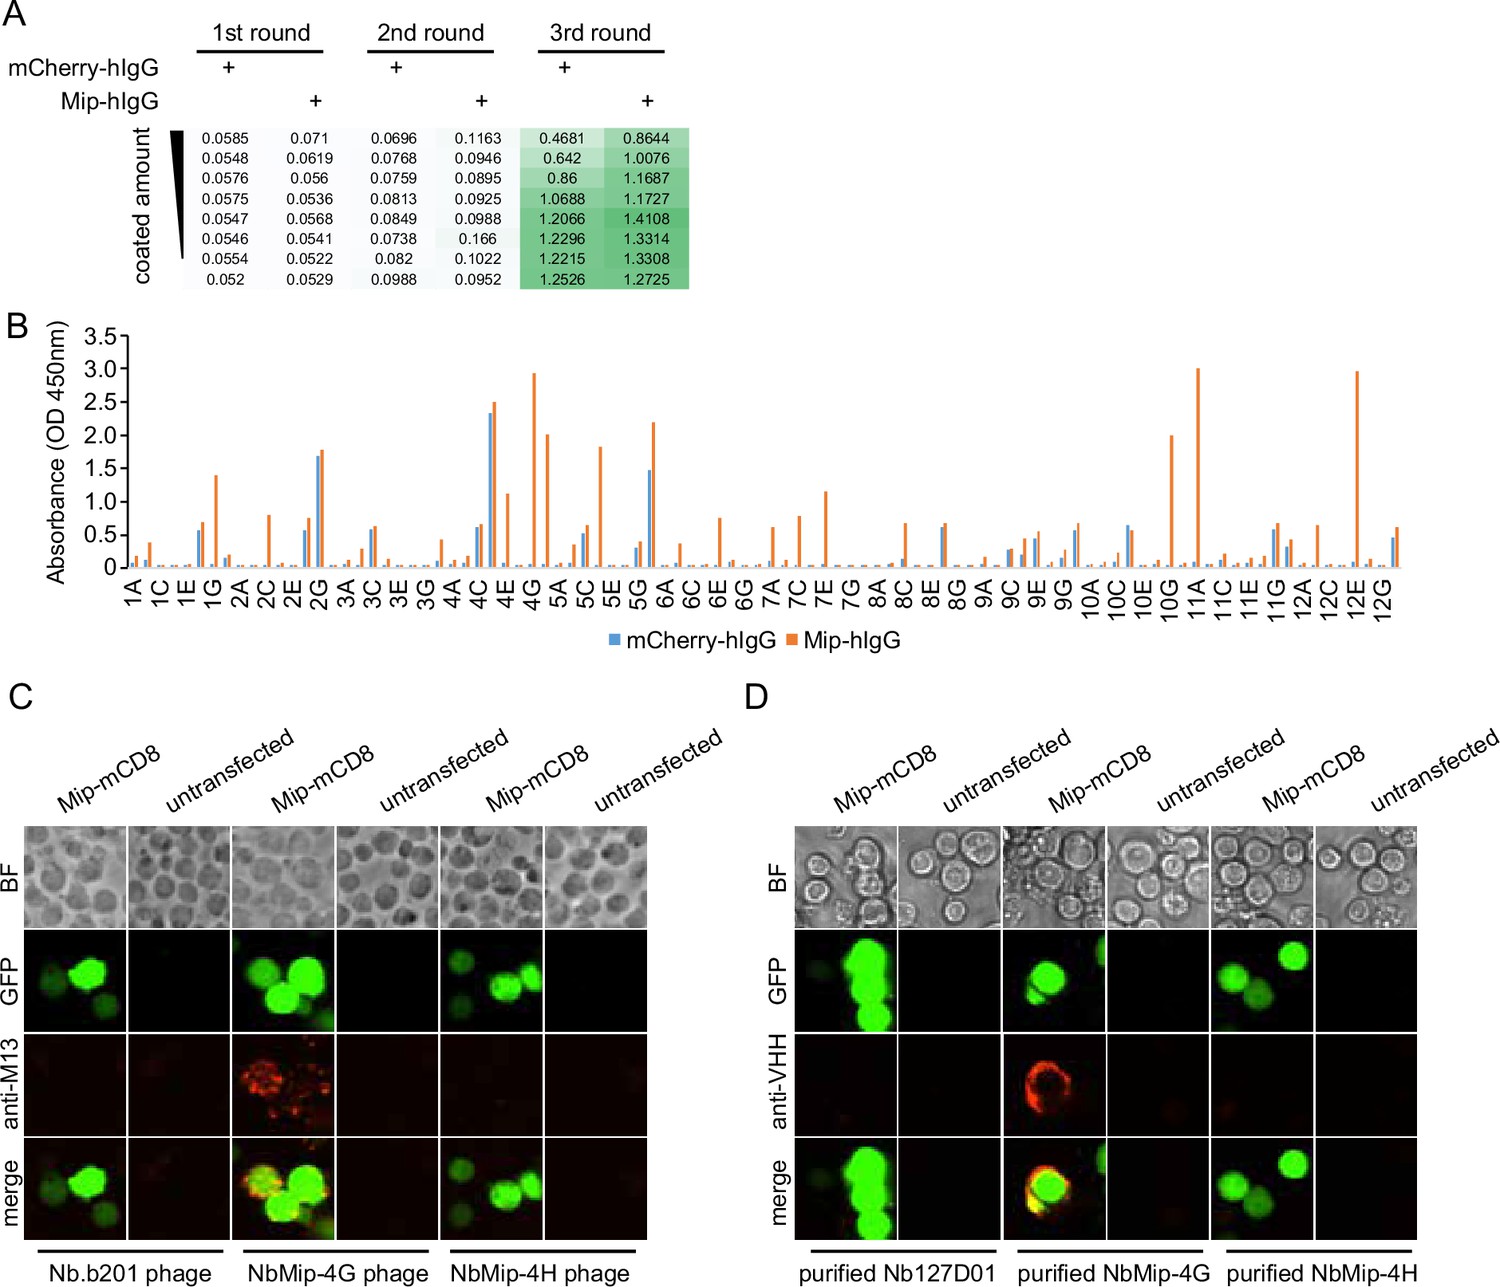
Nanobody screen for Mip.
(A) ELISA with polyclonal phages from three rounds of selection in Mip screen campaign. The mCherry-hIgG and Mip-hIgG were coated in decreasing amounts across different rows. The intensity of green color represents the ELISA signal strength. (B) ELISA with monoclonal phages from the third round of selection in Mip screen campaign. 96 monoclonal phages were tested against mCherry-hIgG and Mip-hIgG. (C) Mip-expressing cells stained with nanobody-displaying phages. GFP signals mark cells expressing membrane-tethered Mip. Nb.b201 phage, an irrelevant nanobody displaying phage, was used as negative control. BF, bright field. (D) Mip-expressing cells stained with purified nanobodies. GFP signals label the cells expressing membrane-tethered Mip. Nb127D01 is an irrelevant nanobody used as a negative control. BF, bright field.
Figure 2—figure supplement 3
Nanobody screen for CG9849.
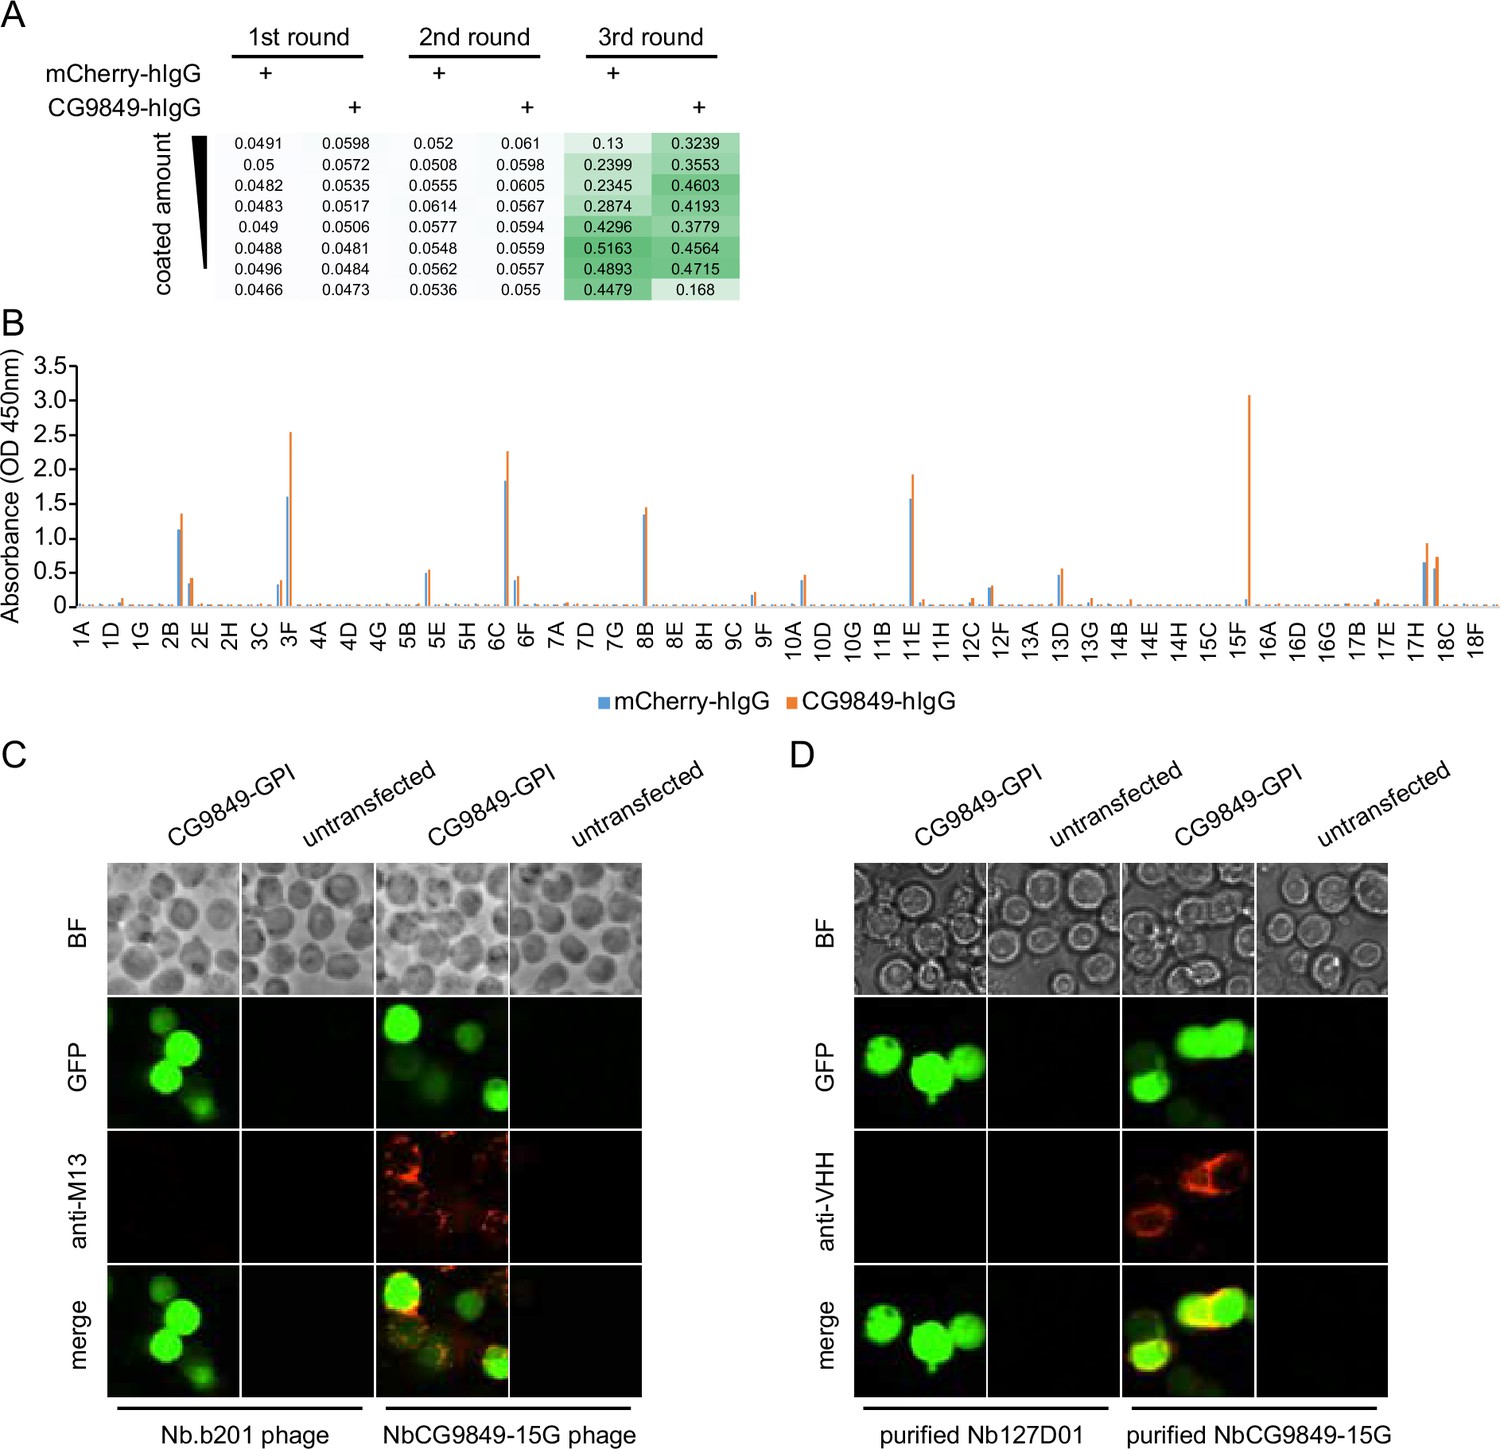
(A) ELISA with polyclonal phages from three rounds of selection in CG9849 screen campaign. The mCherry-hIgG and CG9849-hIgG were coated in decreasing amounts across different rows. The intensity of green color represents the ELISA signal strength. (B) ELISA with monoclonal phages from the third round of selection in the CG9849 screen campaign. 144 monoclonal phages were tested against mCherry-hIgG and CG9849-hIgG. (C) CG9849-expressing cells stained with nanobody-displaying phages. GFP signals mark cells expressing membrane-tethered CG9849. Nb.b201 phage, an irrelevant nanobody displaying phage, was used as negative control. BF, bright field. (D) CG9849-expressing cells stained with purified nanobodies. GFP signals label the cells expressing membrane-tethered CG9849. Nb127D01 is an irrelevant nanobody used as negative control. BF, bright field.
Figure 2—figure supplement 4
Nanobody screen for Amn.
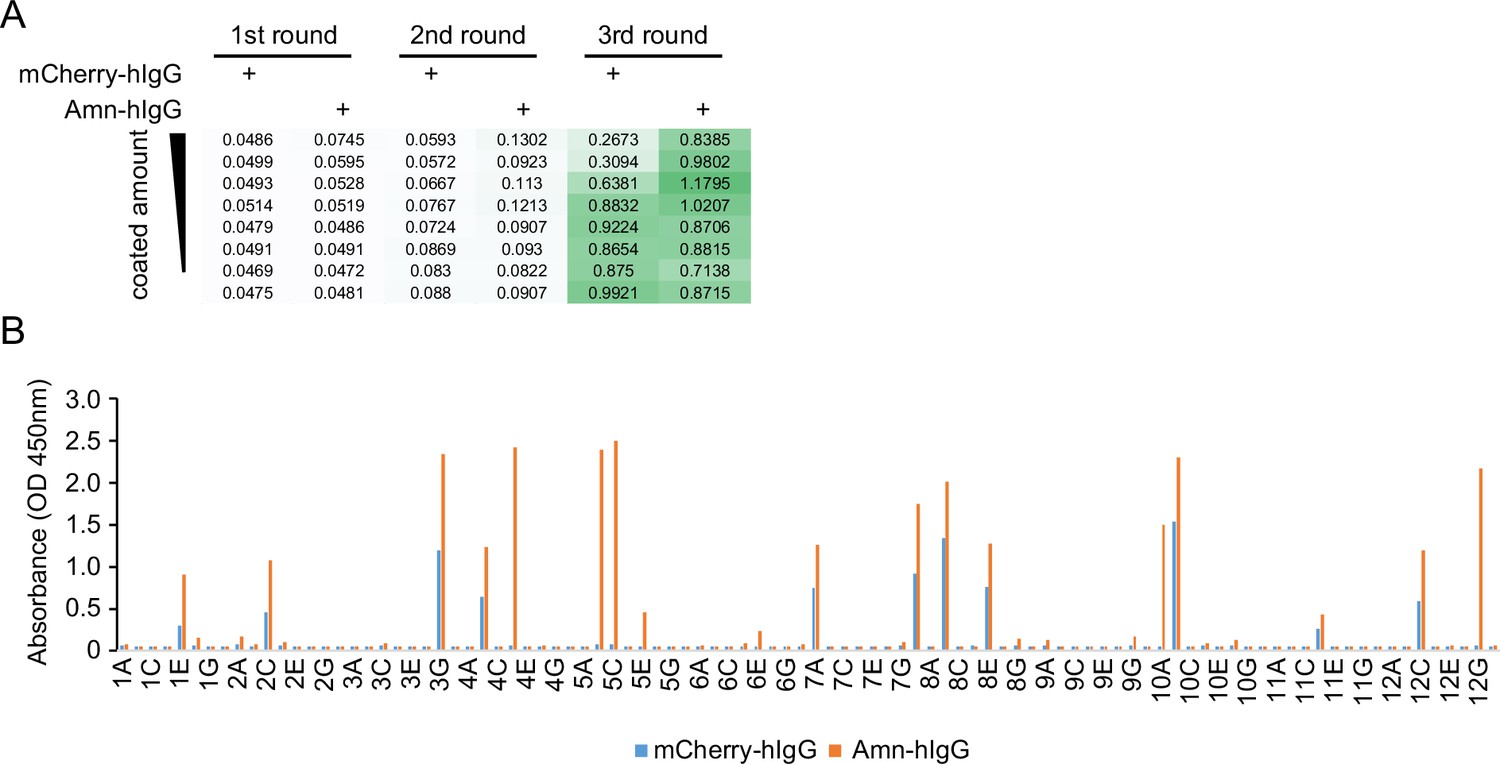
(A) ELISA with polyclonal phages from three rounds of selection in Amn screen campaign. The mCherry-hIgG and Amn-hIgG were coated in decreasing amounts across different rows. The intensity of green color represents the ELISA signal strength. (B) ELISA with monoclonal phages from the third round of selection in Amn screen campaign. 96 monoclonal phages were tested against mCherry-hIgG and Amn-hIgG.
Figure 2—figure supplement 5
Failed nanobody screens for Sgsf, Miple1, and CG13965.
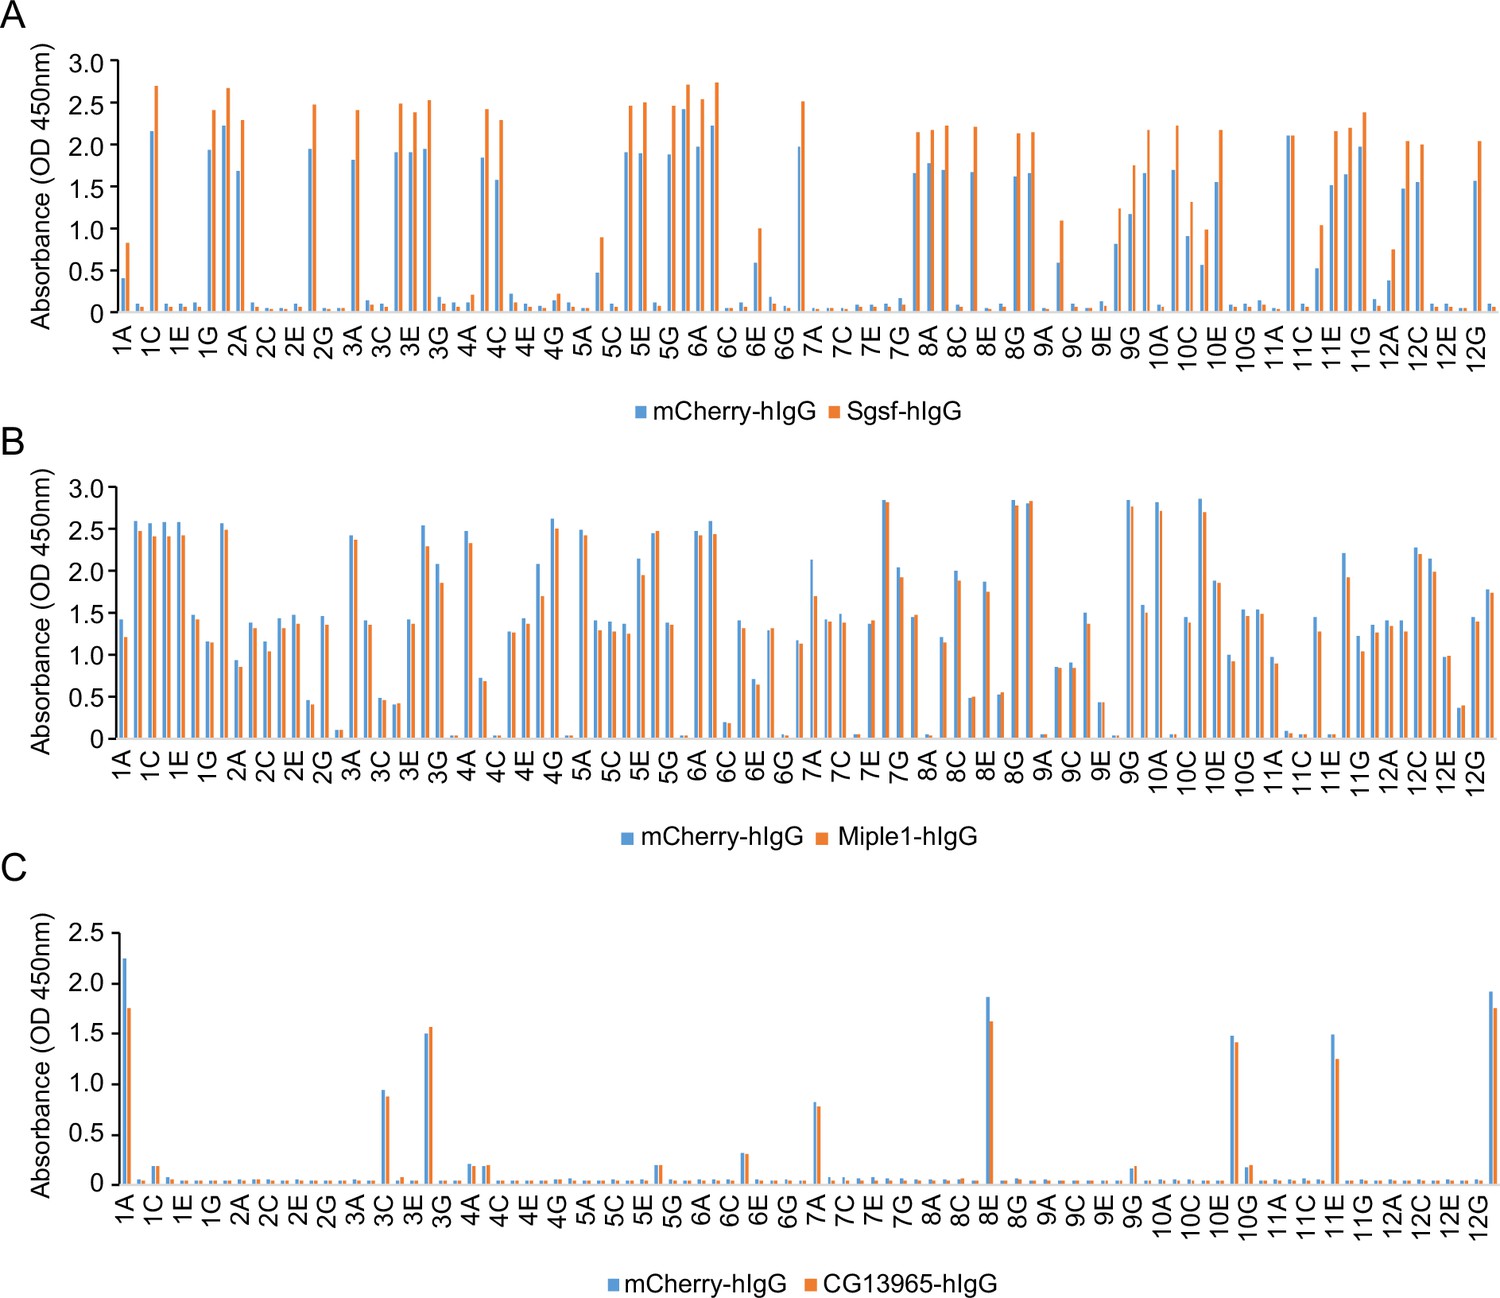
(A) ELISA with monoclonal phages from the third round of selection in Sgsf screen campaign. 96 monoclonal phages were tested against mCherry-hIgG and Sgsf-hIgG. (B) ELISA with monoclonal phages from the third round of selection in Miple1 screen campaign. 96 monoclonal phages were tested against mCherry-hIgG and Miple1-hIgG. (C) ELISA assay with monoclonal phages from the third round of selection in the CG13965 screen campaign. 96 monoclonal phages were tested against mCherry-hIgG and CG13965-hIgG.
Figure 3
Immunostaining of membrane-tethered CARPB with nanobodies.
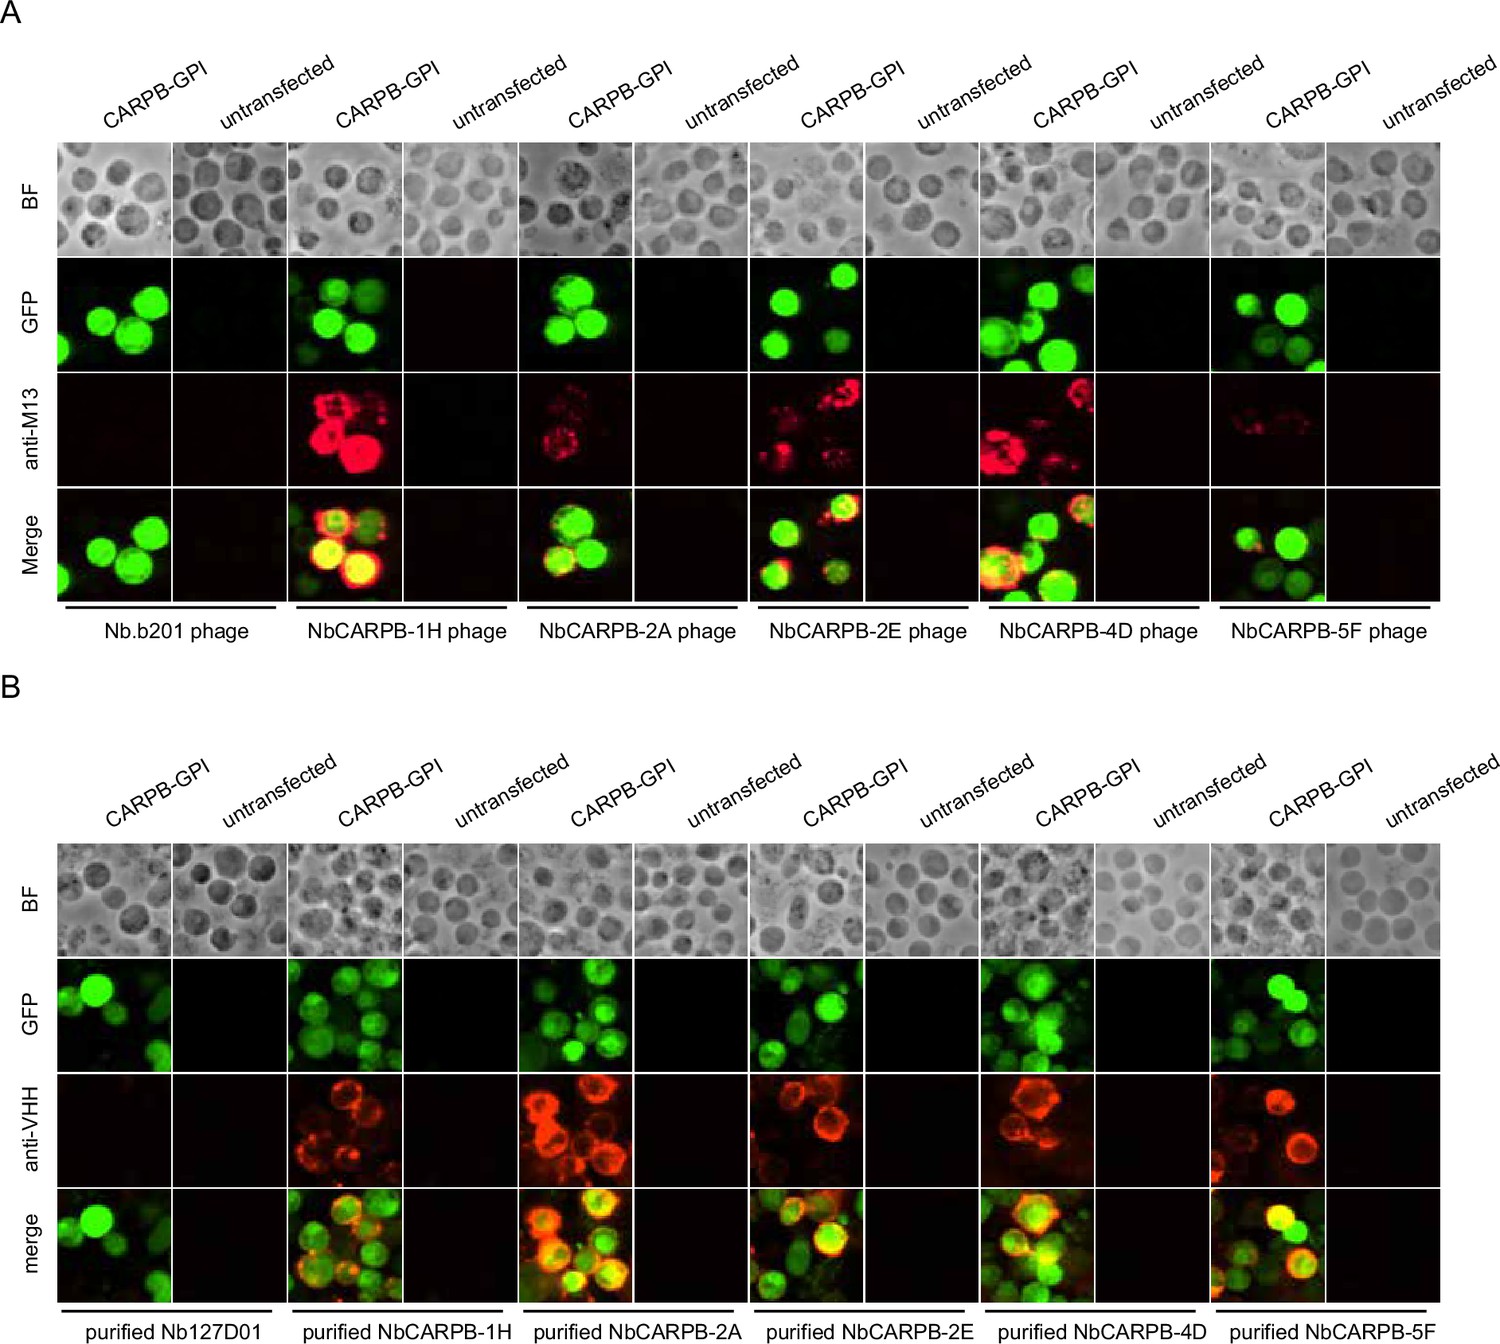
(A) CARPB-expressing cells stained with nanobody-displaying phages. GFP signals mark cells expressing membrane-tethered CARPB. Nb.b201 phage, an irrelevant nanobody displaying phage, was used as negative control. BF, bright field. (B) CARPB-expressing cells stained with purified nanobodies. GFP signals label the cells expressing membrane-tethered CARPB. Nb127D01 is an irrelevant nanobody used as a negative control. BF, bright field.
Figure 4
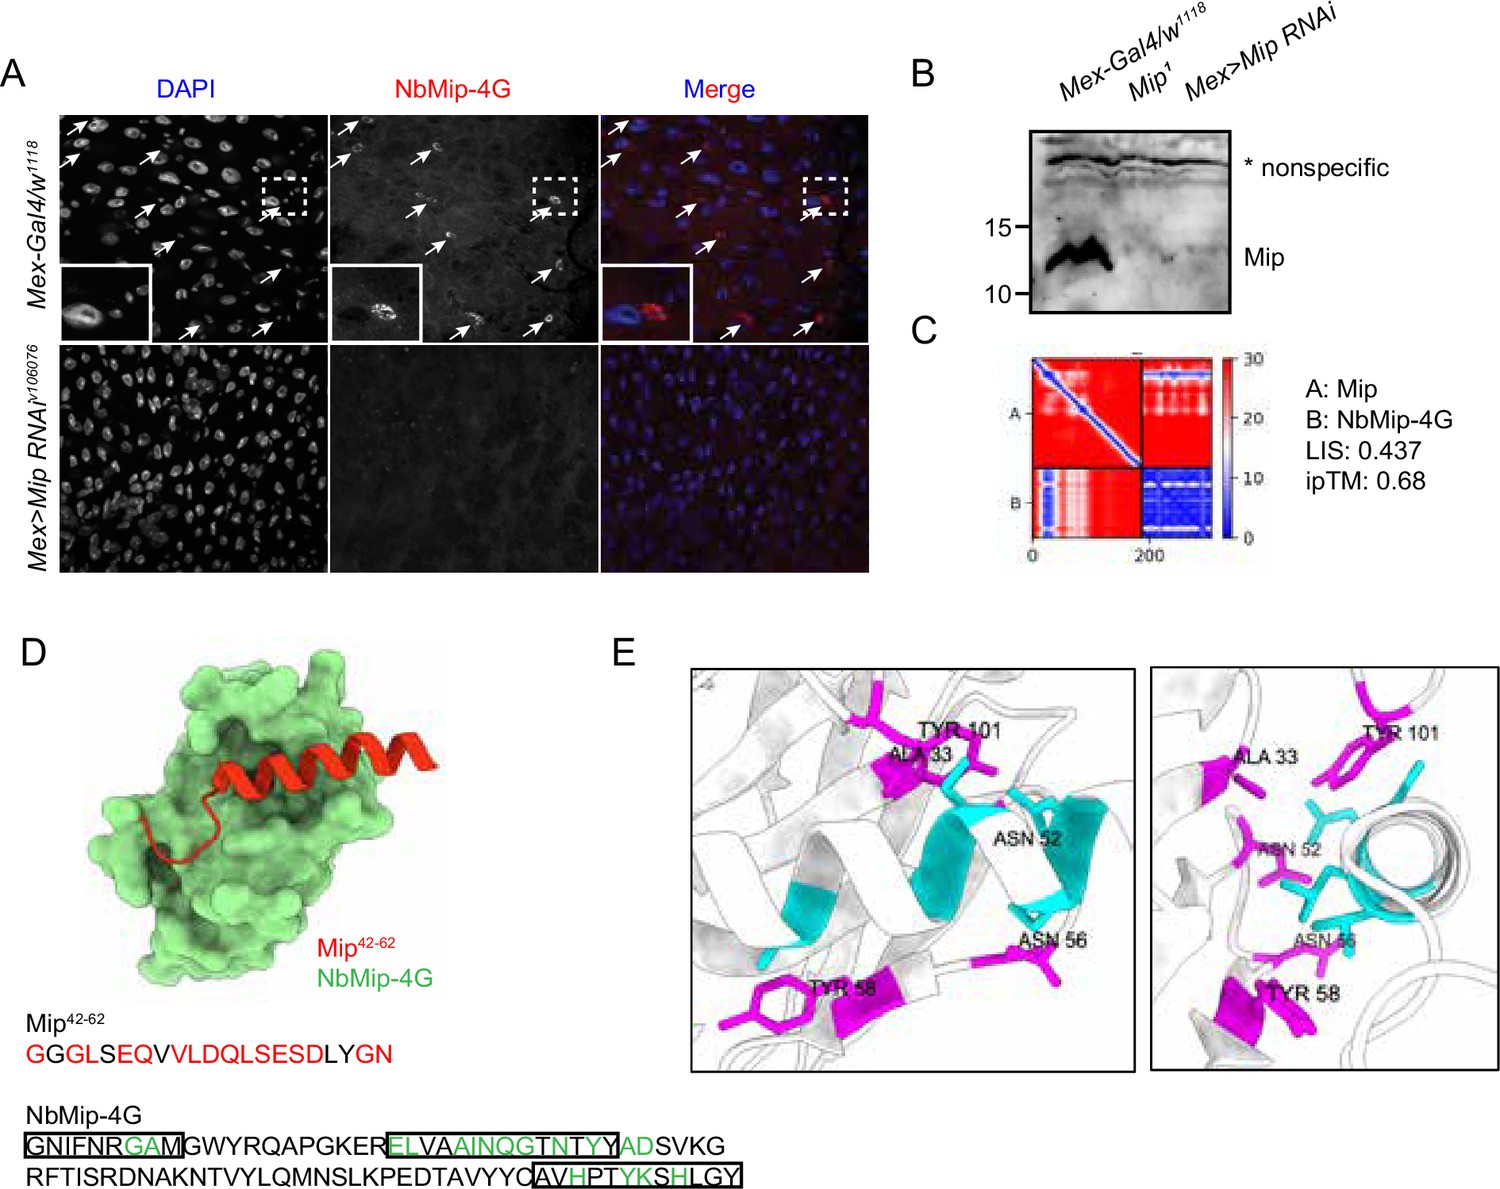
Immunostaining and immunoblotting with NbMip-4G nanobody.
(A) Immunostaining of Drosophila adult intestine with NbMip-4G nanobody. (B) Immunoblotting detection of Mip in Drosophila adult hemolymph with NbMip-4G nanobody. A nonspecific band is included as a loading control. (C) Predicted Aligned Error (PAE) map generated using AlphaFold-Multimer for the Mip-NbMip-4G complex. Low PAE values, shown in blue, indicate accurate predictions for the interaction interfaces, depicted in the top right and bottom left quadrants. High LIS and ipTM values confirm the structural reliability of the interface. (D) Predicted 3D structure of the Mip-NbMip-4G complex. The surface representation shows NbMip-4G in green and the interacting helical segment of Mip (residues 42–62) in red. Key residues involved in the interaction are marked in red (Mip) and green (NbMip-4G) in the protein sequences. CDRs in the protein sequence are marked by boxes. The interaction predominantly occurs within these CDR regions. (E) Neighboring residues between Mip and NbMip-4G, showing residues within a 5 Å distance. Cyan indicates residues of Mip, and magenta indicates residues of NbMip-4G. Each residue in NbMip-4G is labeled with its residue name and number.
Tables
Table 1
Protein sequences of the nanobodies identified in this study.
| nanobody | sequence |
|---|---|
| NbCARPB-1H | QVQLQESGGGLVQAGGSLRLSCAASGTISYAPVMG WYRQAPGKEREFVAGISLGGNTNYADSVKGRFTISR DNAKNTVYLQMNSLKPEDTAVYYCAAVYVGSSPYEYWGQGTQVTVSS |
| NbCARPB-2A | QVQLQESGGGLVQAGGSLRLSCAASGNISHYSIMGW YRQAPGKEREFVAAINIGATTNYADSVKGRFTISRDNAK NTVYLQMNSLKPEDTAVYYCAAYAARRPGYEYWGQGTQVTVSS |
| NbCARPB-2E | QVQLQESGGGLVQAGGSLRLSCAASGTISAHSVMGWY RQAPGKEREFVAGIAYGGNTNYADSVKGRFTISRDNAKNT VYLQMNSLKPEDTAVYYCAVASHYTRAPATAHDYWGQGTQVTVSS |
| NbCARPB-4D | QVQLQESGGGLVQAGGSLRLSCAASGYISQPGYMGWYRQ APGKERELVAAITSGGITYYADSVKGRFTISRDNAKNTVYLQM NSLKPEDTAVYYCAVSYASSYLYSYWGQGTQVTVSS |
| NbCARPB-5F | QVQLQESGGGLVQAGGSLRLSCAASGSIFIGFMGWYRQAP GKERELIAGITSGGSTYYADSVKGRFTISRDNAKNTVYLQMN SLKPEDTAVYYCAVVYGGYAYWPAWHDYWGQGTQVTVSS |
| NbMip-4G | QVQLQESGGGLVQAGGSLRLSCAASGNIFNRGAMGWYRQAP GKERELVAAINQGTNTYYADSVKGRFTISRDNAKNTVYLQMNS LKPEDTAVYYCAVHPTYKSHLGYWGQGTQVTVSS |
| NbMip-4H | QVQLQESGGGLVQAGGSLRLSCAASGTIFFRGVMGWYRQA PGKERELVAAISRGANTYYADSVKGRFTISRDNAKNTVYLQMN SLKPEDTAVYYCAVYFPNEGGHYYWGQGTQVTVSS |
| NbNesfatin1-1A | QVQLQESGGGLVQAGGSLRLSCAASGTISTFTFMGWYRQ APGKEREFVAAIGYGGITNYADSVKGRFTISRDNAKNTVYL QMNSLKPEDTAVYYCAAPYGYSYPQFYAFKYWGQGTQVTVSS |
| NbNesfatin1-1E | QVQLQESGGGLVQAGGSLRLSCAASGNIFEPASMGWYRQ APGKERELVAAINRGAITYYADSVKGRFTISRDNAKNTVYLQM NSLKPEDTAVYYCAASRYYGAIFLYWGQGTQVTVSS |
| NbNesfatin1-1G | QVQLQESGGGLVQAGGSLRLSCAASGNIFRYRAMGWYRQ APGKERELVAAIAAGGTTYYADSVKGRFTISRDNAKNTVYLQ MNSLKPEDTAVYYCAVGRYIVSVYRDDYWYWGQGTQVTVSS |
| NbNesfatin1-1H | QVQLQESGGGLVQAGGSLRLSCAASGSIFYLVDMGWYRQAP GKEREFVATIATGGITYYADSVKGRFTISRDNAKNTVYLQMNS LKPEDTAVYYCAARVYDGTSDWRHYYYWGQGTQVTVSS |
| NbNesfatin1-2A | QVQLQESGGGLVQAGGSLRLSCAASGNISPYAAMGWYRQA PGKEREFVAAIARGSTTYYADSVKGRFTISRDNAKNTVYLQM NSLKPEDTAVYYCAVRYLGYTVKGILHIYWGQGTQVTVSS |
| NbNesfatin1-2C | QVQLQESGGGLVQAGGSLRLSCAASGYIFYRYTMGWYRQA PGKERELVAGINRGGITNYADSVKGRFTISRDNAKNTVYLQM NSLKPEDTAVYYCAVIARAQWYLAYWGQGTQVTVSS |
| NbNesfatin1-3C | QVQLQESGGGLVQAGGSLRLSCAASGSIFRFYGMGWYRQ APGKEREFVAAIAYGTTTNYADSVKGRFTISRDNAKNTVYLQ MNSLKPEDTAVYYCAVRGYNTADSVRRYDYWGQGTQVTVSS |
| NbCG9849-15G | QVQLQESGGGLVQAGGSLRLSCAASGSIFPWRGMGWYRQ APGKERELVAAISGGANTNYADSVKGRFTISRDNAKNTVYLQ MNSLKPEDTAVYYCAAGTLTAGQHRYWGQGTQVTVSS |
| NbAmn-4D | QVQLQESGGGLVQAGGSLRLSCAASGSIFLIFAMGWYRQA PGKEREFVATIGYGATTNYADSVKGRFTISRDNAKNTVYLQ MNSLKPEDTAVYYCAVRGFYLRNPPDGYNIRHRYWGQGTQVTVSS |
| NbAmn-10A | QVQLQESGGGLVQAGGSLRLSCAASGTIFLGIYMGWYRQA PGKERELVAAIALGASTYYADSVKGRFTISRDNAKNTVYLQM NSLKPEDTAVYYCASRDAADIYDHDFWYWGQGTQVTVSS |
Key resources table
| Reagent type (species) or resource | Designation | Source or reference | Identifiers | Additional information |
|---|---|---|---|---|
| Gene (Drosophila melanogaster) | CARPB | FlyBase | FLYB: FBgn0052698 | |
| Gene (Drosophila melanogaster) | Mip | FlyBase | FLYB: FBgn0036713 | |
| Gene (Drosophila melanogaster) | Sgsf | FlyBase | FLYB: FBgn0266261 | |
| Gene (Drosophila melanogaster) | Nesfatin-1 | FlyBase | FLYB: FBgn0052190 | |
| Gene (Drosophila melanogaster) | Miple1 | FlyBase | FLYB: FBgn0027111 | |
| Gene (Drosophila melanogaster) | Amn | FlyBase | FLYB: FBgn0086782 | |
| Gene (Drosophila melanogaster) | CG9849 | FlyBase | FLYB: FBgn0034803 | |
| Gene (Drosophila melanogaster) | CG13965 | FlyBase | FLYB: FBgn0032834 | |
| Cell line (D. melanogaster) | S2 | DRSC | FLYB: FBbt:00005737 | |
| Cell line (D. melanogaster) | S2R+ | DRSC | FLYB: FBtc0000150 | |
| Strain, strain background (Escherichia coli) | SS320 (MC1061 F') Electrocompetent Cells | Biosearch | 60512–2 | For phage library construction |
| Strain, strain background (Escherichia coli) | One Shot TOP10 Chemically Competent E. coli | Invitrogen | C404010 | |
| Strain, strain background (Escherichia coli) | One Shot OmniMAX 2 T1R E. coli | Invitrogen | C854003 | |
| Strain, strain background (Escherichia coli) | One Shot ccdB Survival 2 T1R Competent Cells | Invitrogen | A10460 | |
| Strain, strain background (Escherichia coli) | BL21 Competent E. coli | NEB | C2530H | |
| Antibody | M13 Major Coat Protein Antibody (RL-ph1) HRP | Santa Cruz biotechnology | sc-53004 HRP | 1:1000 dilution for ELISA |
| Antibody | M13 Major Coat Protein Antibody (RL-ph1) Alexa Fluor 647 | Santa Cruz biotechnology | sc-53004 AF647 | 1:500 dilution for immunostaining |
| Antibody | Alexa Fluor 647 AffiniPure Goat Anti-Alpaca IgG, VHH domain | Jackson ImmunoResearch | 128-605-230 | 1:500 dilution for immunostaining |
| Antibody | Peroxidase AffiniPure Goat Anti-Alpaca IgG, VHH domain | Jackson ImmunoResearch | 128-035-230 | 1:5000 dilution for immunoblotting |
| Commercial assay or kit | Effectene Transfection Reagent | Qiagen | 301425 |
Additional files
Download links
A two-part list of links to download the article, or parts of the article, in various formats.
Downloads (link to download the article as PDF)
Open citations (links to open the citations from this article in various online reference manager services)
Cite this article (links to download the citations from this article in formats compatible with various reference manager tools)
Phage-displayed synthetic library and screening platform for nanobody discovery
eLife 14:RP105887.
https://doi.org/10.7554/eLife.105887.3


