Action mechanism of a novel agrichemical quinofumelin against Fusarium graminearum
- State Key Laboratory of Agricultural and Forestry Biosecurity, College of Plant Protection, Nanjing Agricultural University, China
- College of Science, Nanjing Agricultural University, China
Figures
Figure 1 with 2 supplements
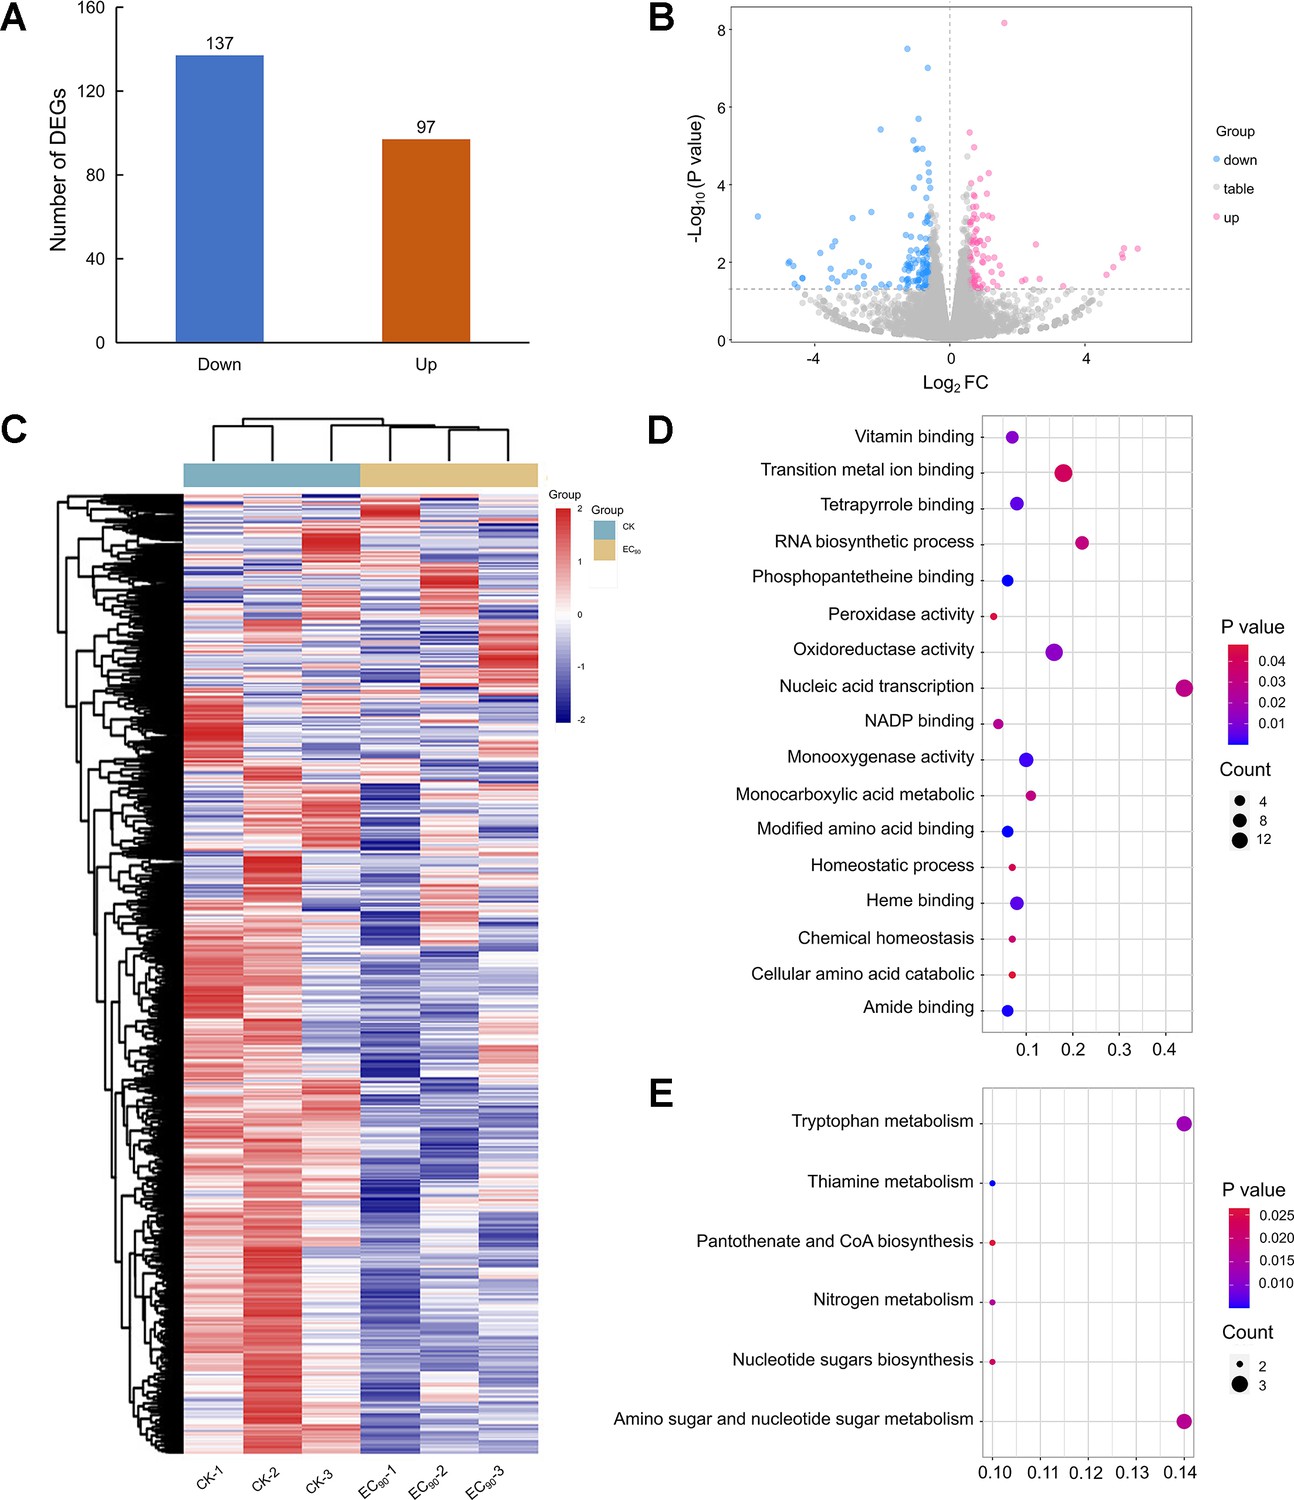
Analysis of transcriptome sequencing data in F.graminearum PH-1 treated with quinofumelin.
(A) Bar chart illustrating the comparison of differentially expressed genes between EC90 treatments and the control. (B) Volcano plot depicting up-regulated differentially expressed genes (DEGs) as red scattered dots and down-regulated DEGs as blue scattered dots. (C) Cluster heat maps displaying gene relative expression values using RNA-seq data scale-standardized values. (D) Bubble map presenting the results of Gene Ontology (GO) enrichment analysis for DEGs. (E) Bubble map showcasing the findings of Kyoto Encyclopedia of Genes and Genomes (KEGG) enrichment analysis for DEGs.
Figure 1—figure supplement 1
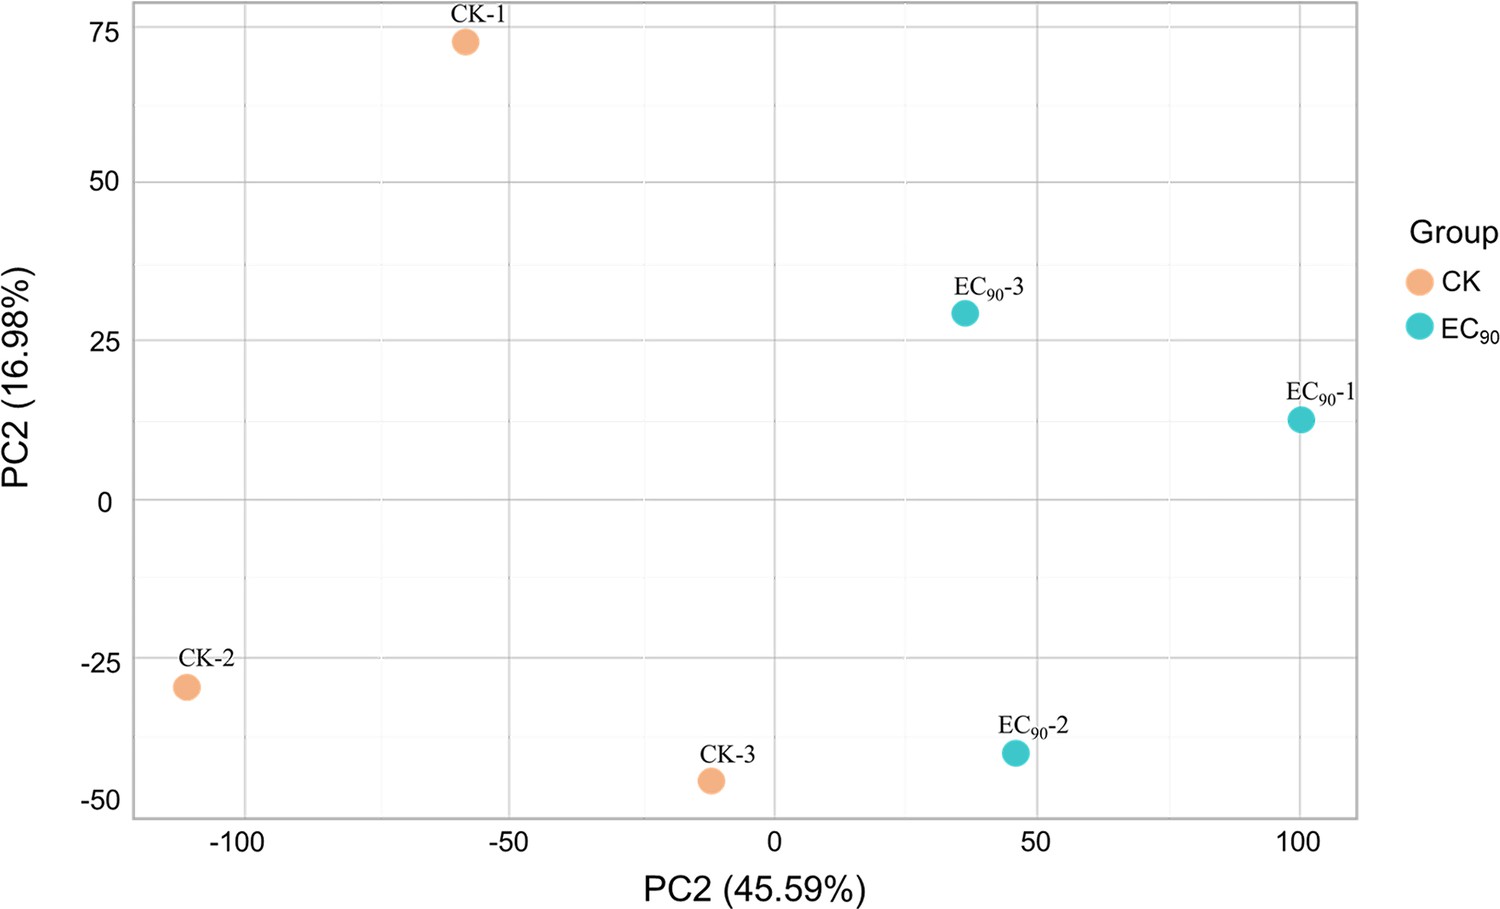
Principal component analysis plots between the experimental (EC90: 1 μg/mL quinofumelin) and control (CK) samples.
Figure 1—figure supplement 2
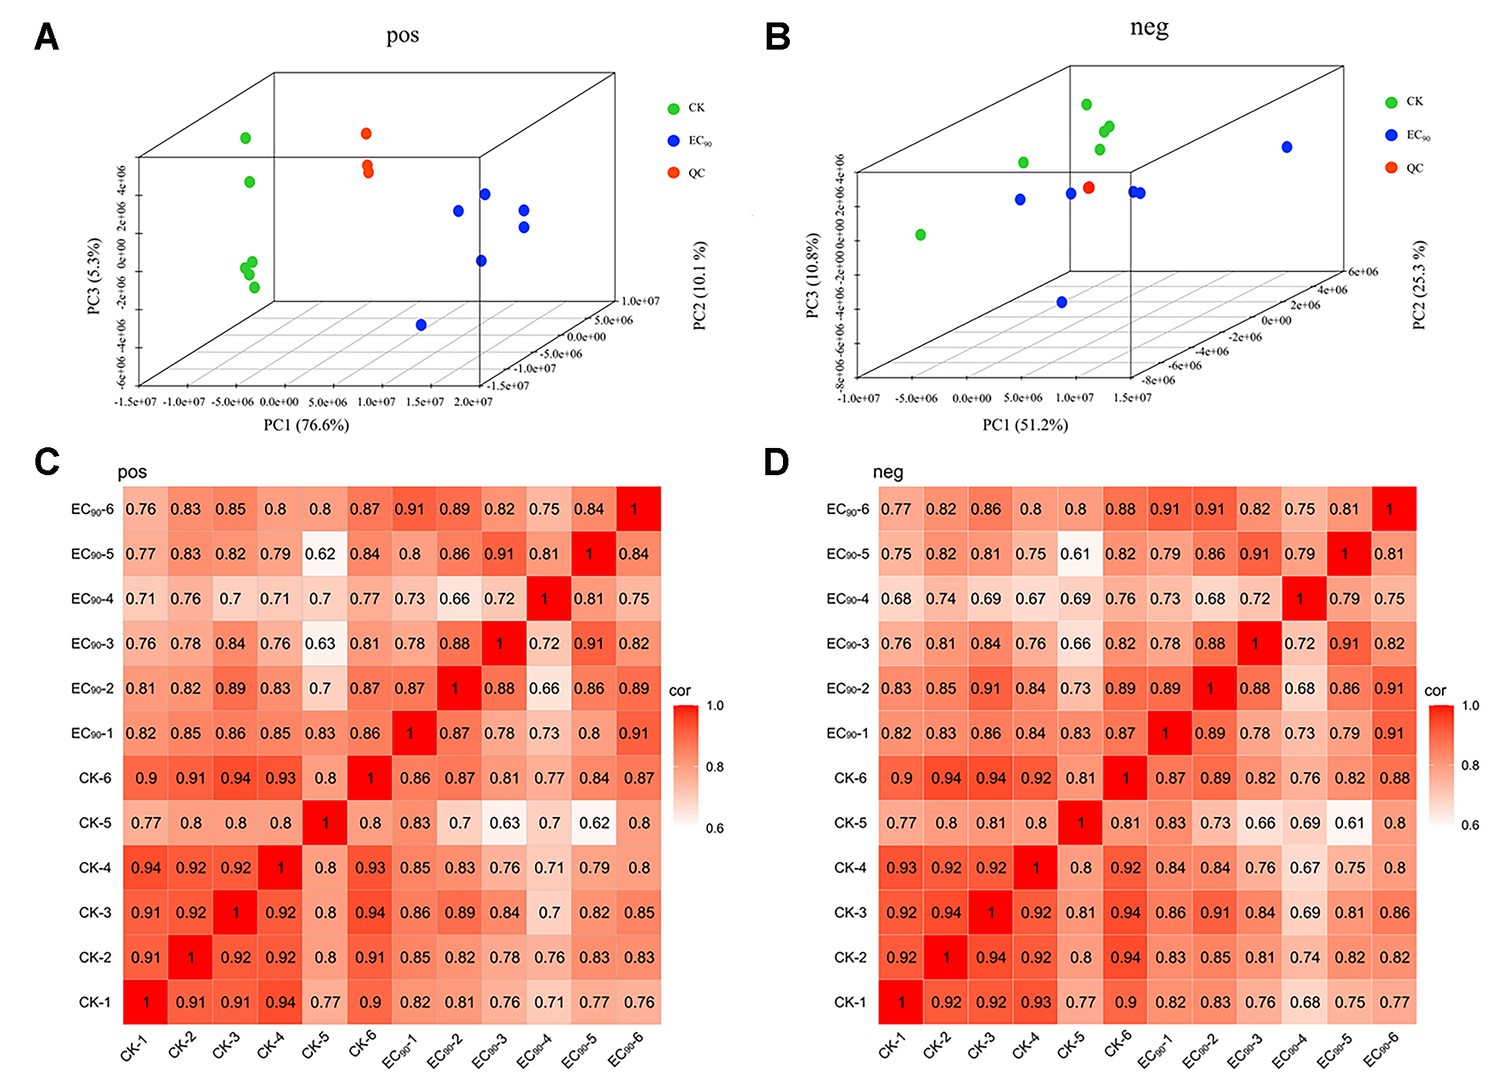
Cluster analysis of the metabolite group.
(A) 3D principal component analysis diagram of EC90, CK, and QC samples in positive ion mode. (B) 3D principal component analysis diagram of EC90, CK, and QC samples in negative ion mode. (C) Heat map of inter-sample correlation analysis in positive ion mode. (D) Heat map of inter-sample correlation analysis in negative ion mode.
Figure 2 with 2 supplements
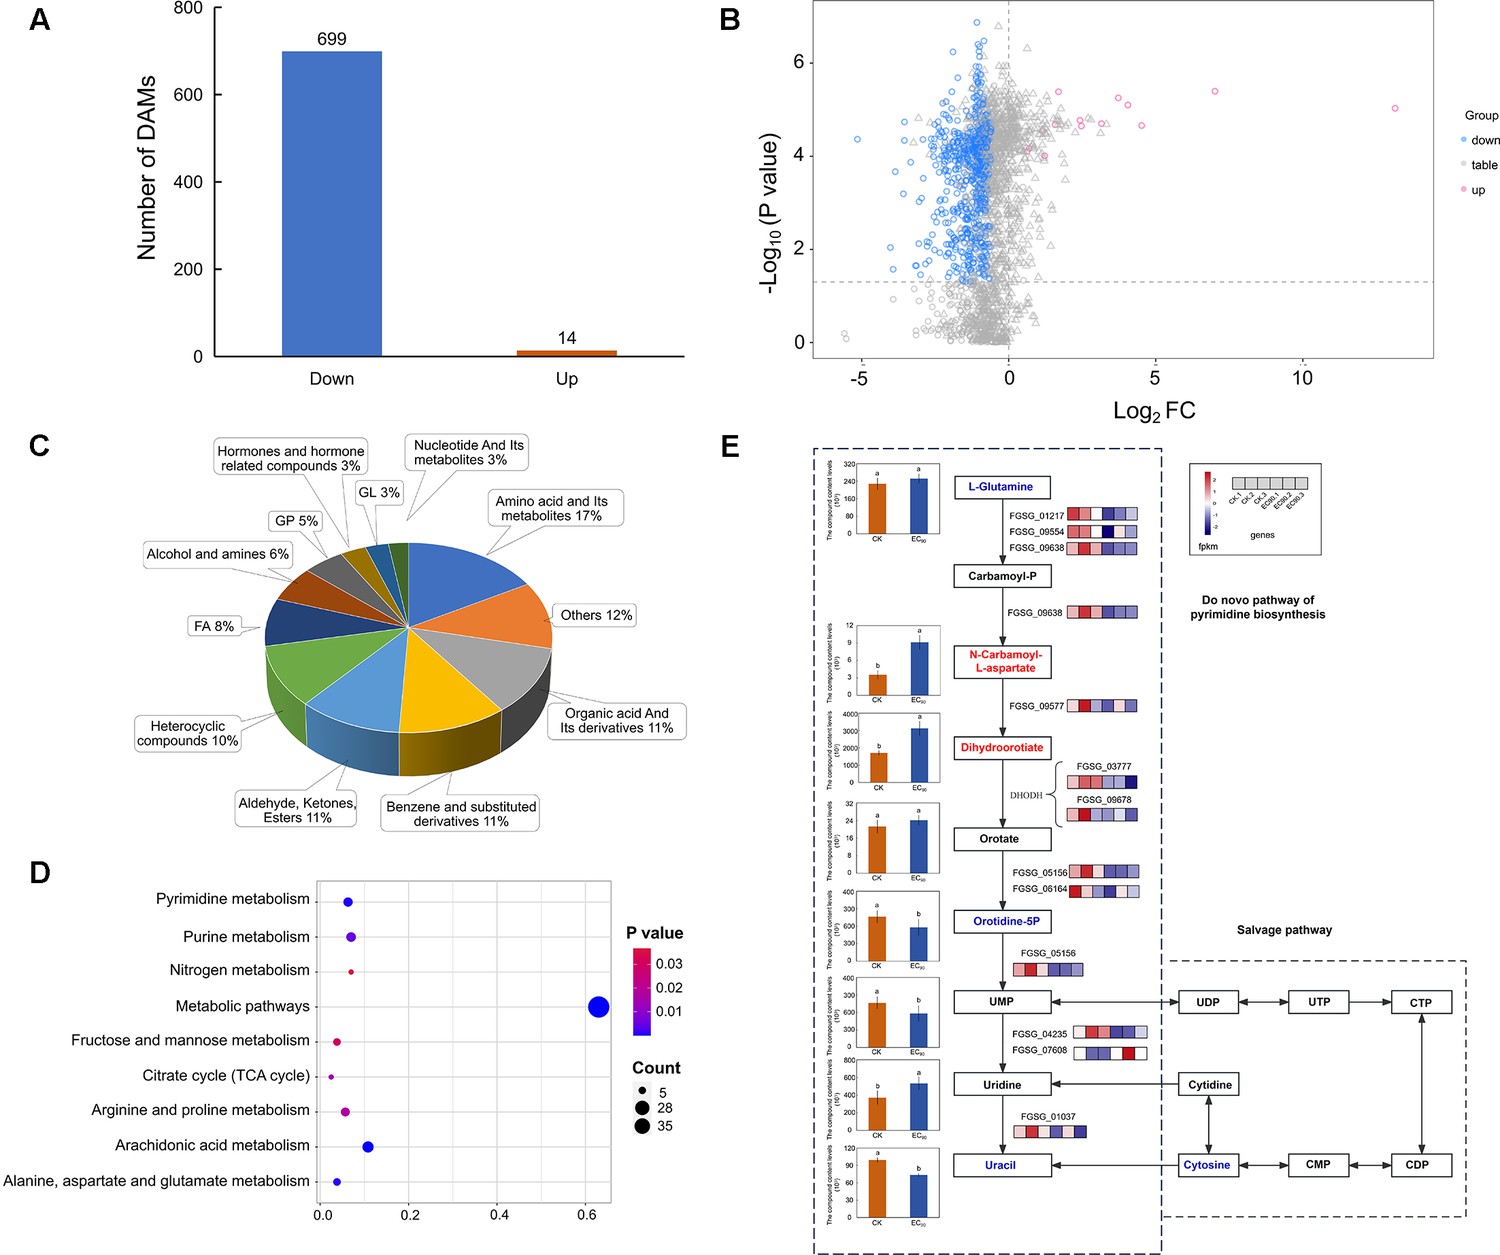
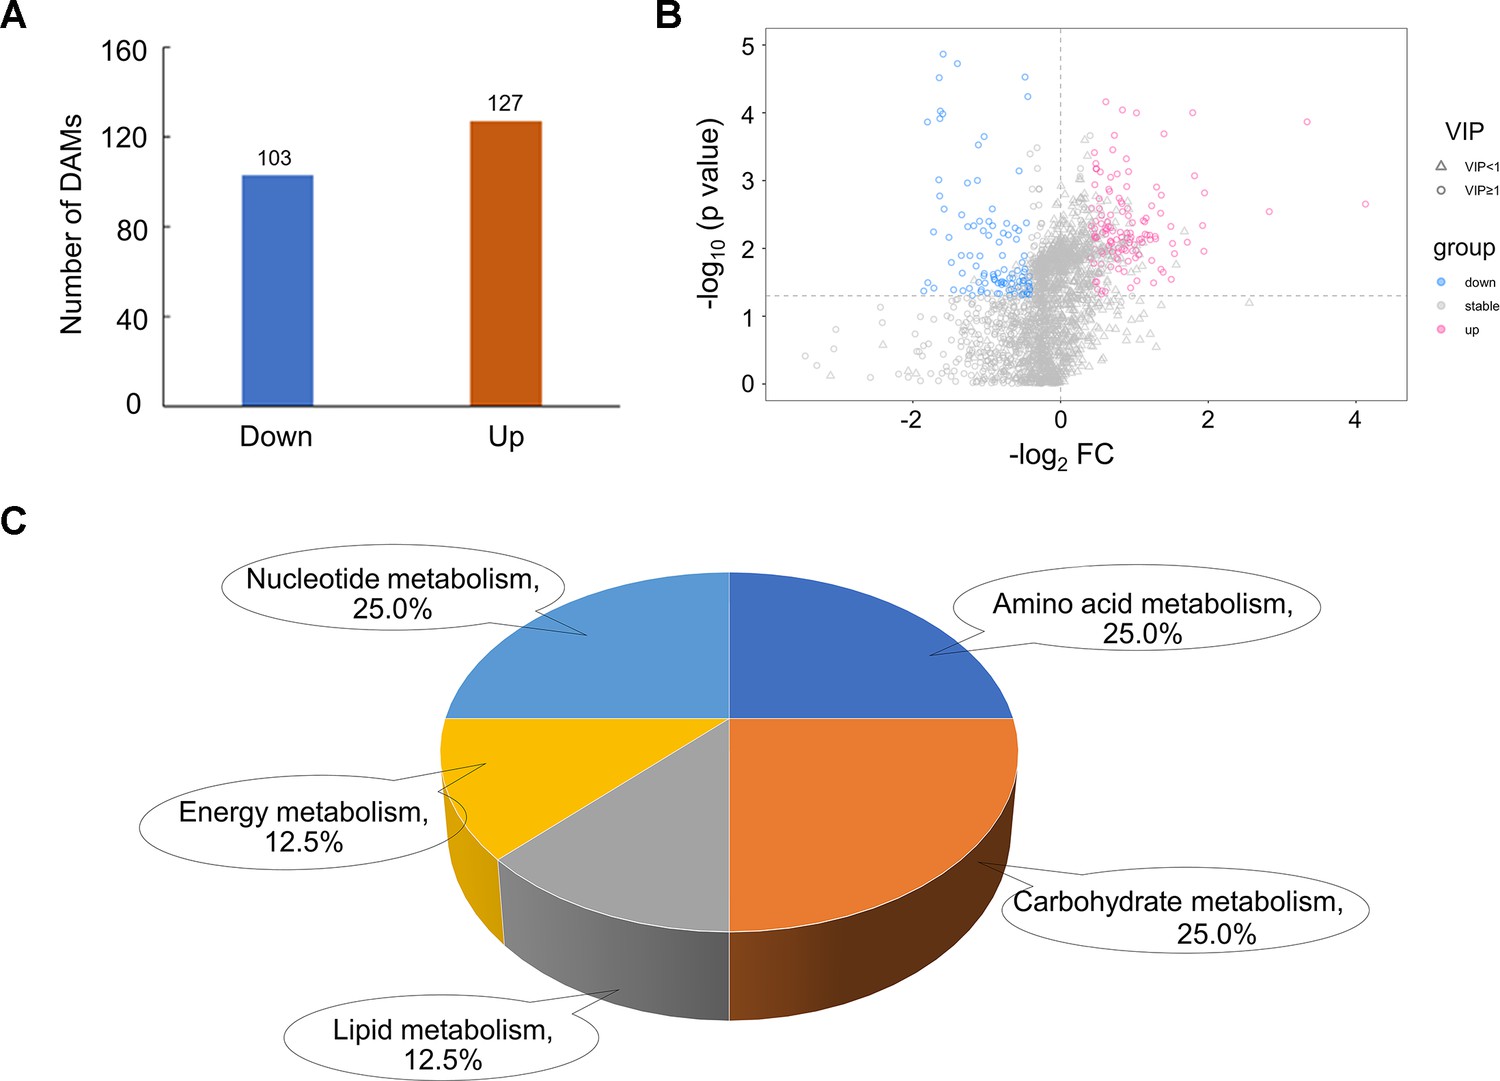
Difference analysis and enrichment analysis of metabolome data in F. graminearum PH-1 treated with quinofumelin.
(A) Bar chart illustrating the number of differential accumulation metabolites (DAMs) quantity in experimental groups (EC90) and control groups (CK) in positive ion mode. (B) Volcanic map of all metabolites in positive ion mode. The red scatter points represent up-regulated DAMs, while the blue scatter points represent down-regulated DAMs. (C) Classification and proportion of DAMs. (D) Bubble diagram of differential accumulation metabolite Kyoto Encyclopedia of Genes and Genomes (KEGG) enrichment pathway. (E) Pyrimidine de novo biosynthesis pathway in Fusarium graminearum. The left box plots represent the relative content of eight metabolite samples, while the right box represents the relative content of six gene samples. The color gradient from navy blue to firebrick red indicates a progression from low to high content.
Figure 2—figure supplement 1
Difference analysis of metabolic group data.
(A) A bar chart illustrating the number of differentially accumulated metabolite (DAM) quantity in experimental group (EC90) and control group (CK) in the negative ion mode. (B) Volcanic map of all metabolites in the negative ion mode. The red scatter points represent the up-regulated DAMs, and the blue scatter points represent the down-regulated DAMs. (C) Pie diagram of differential metabolite enrichment pathway classification.
Figure 2—figure supplement 2
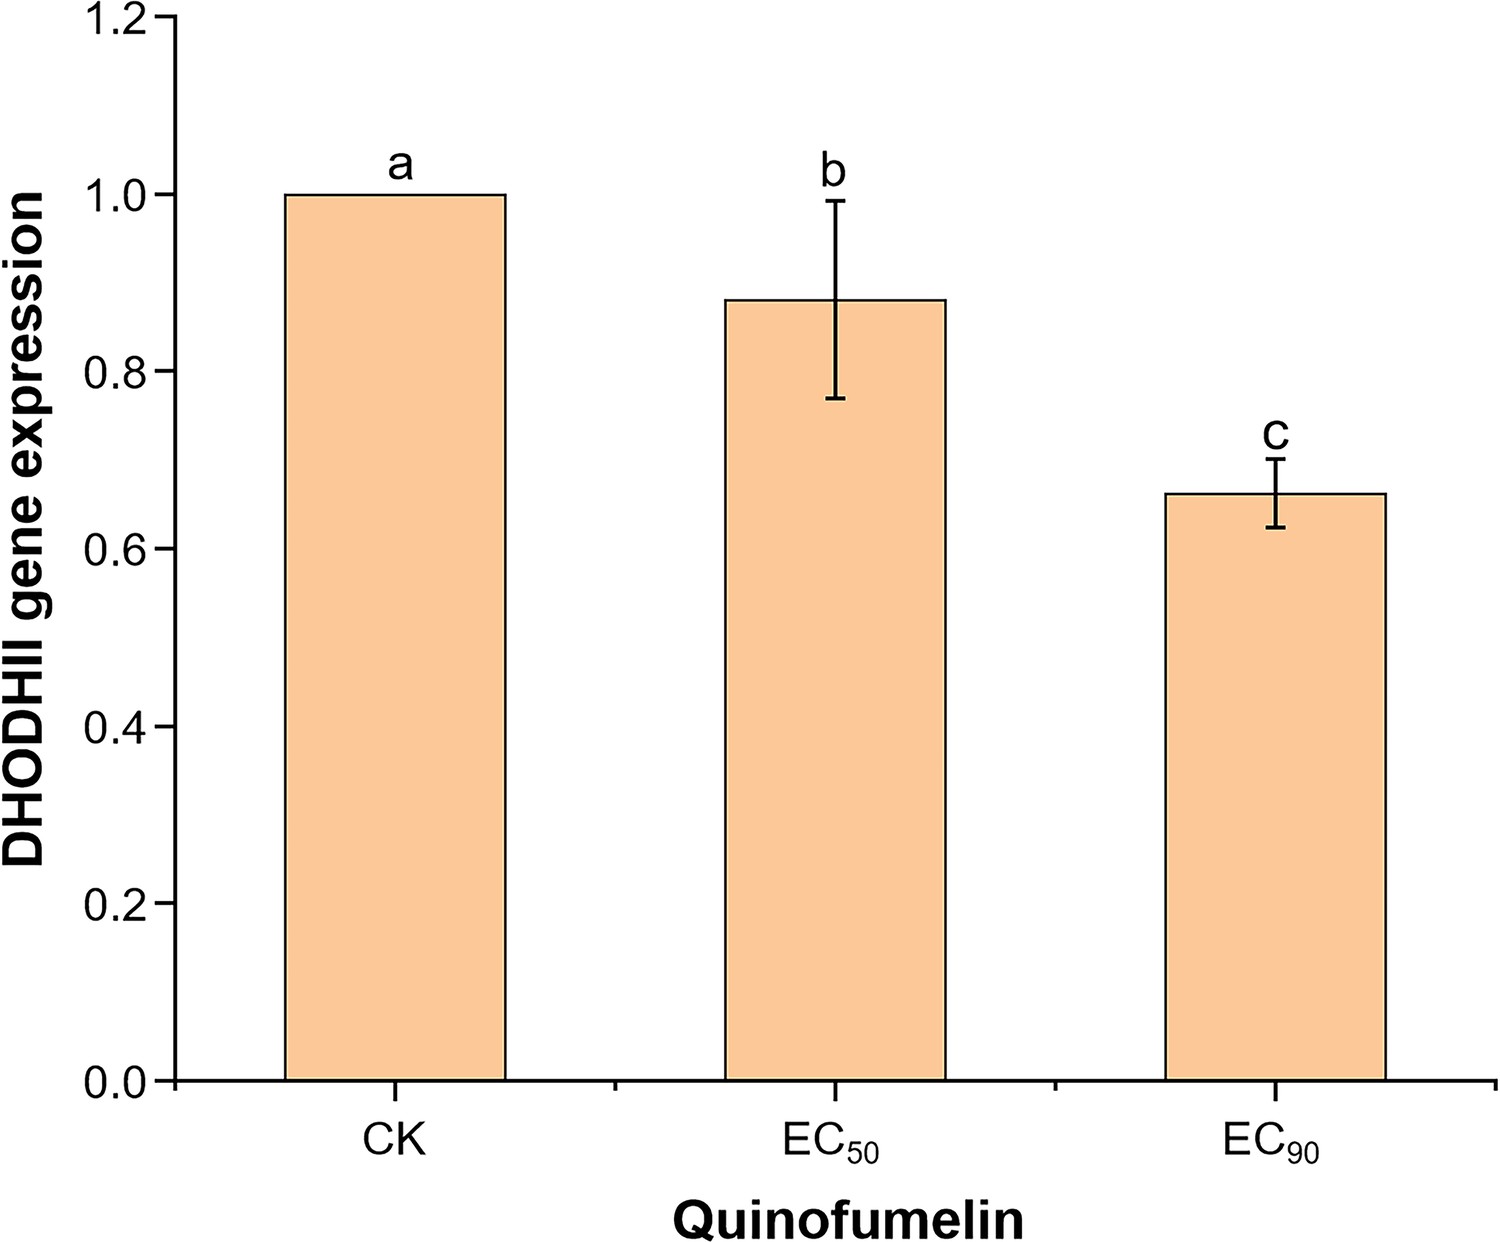
DHODHII gene expression in F. graminearum is affected by quinofumelin.
After the strain PH-1 was cultured in Yeast extract peptone dextrose (YEPD) medium for 36 hr, the EC50 (0.035 μg/mL) and EC90 (1 μg/mL) of quinofumelin were added, respectively, followed by an additional 12 hr incubation period. The expression level of the DHODHII gene was subsequently quantified using RT-qPCR. Data represent the mean values and standard errors derived from three independent replicates. Letters above the columns indicate statistically significant differences among treatments (p<0.05, ANOVA, LSD).
Figure 3
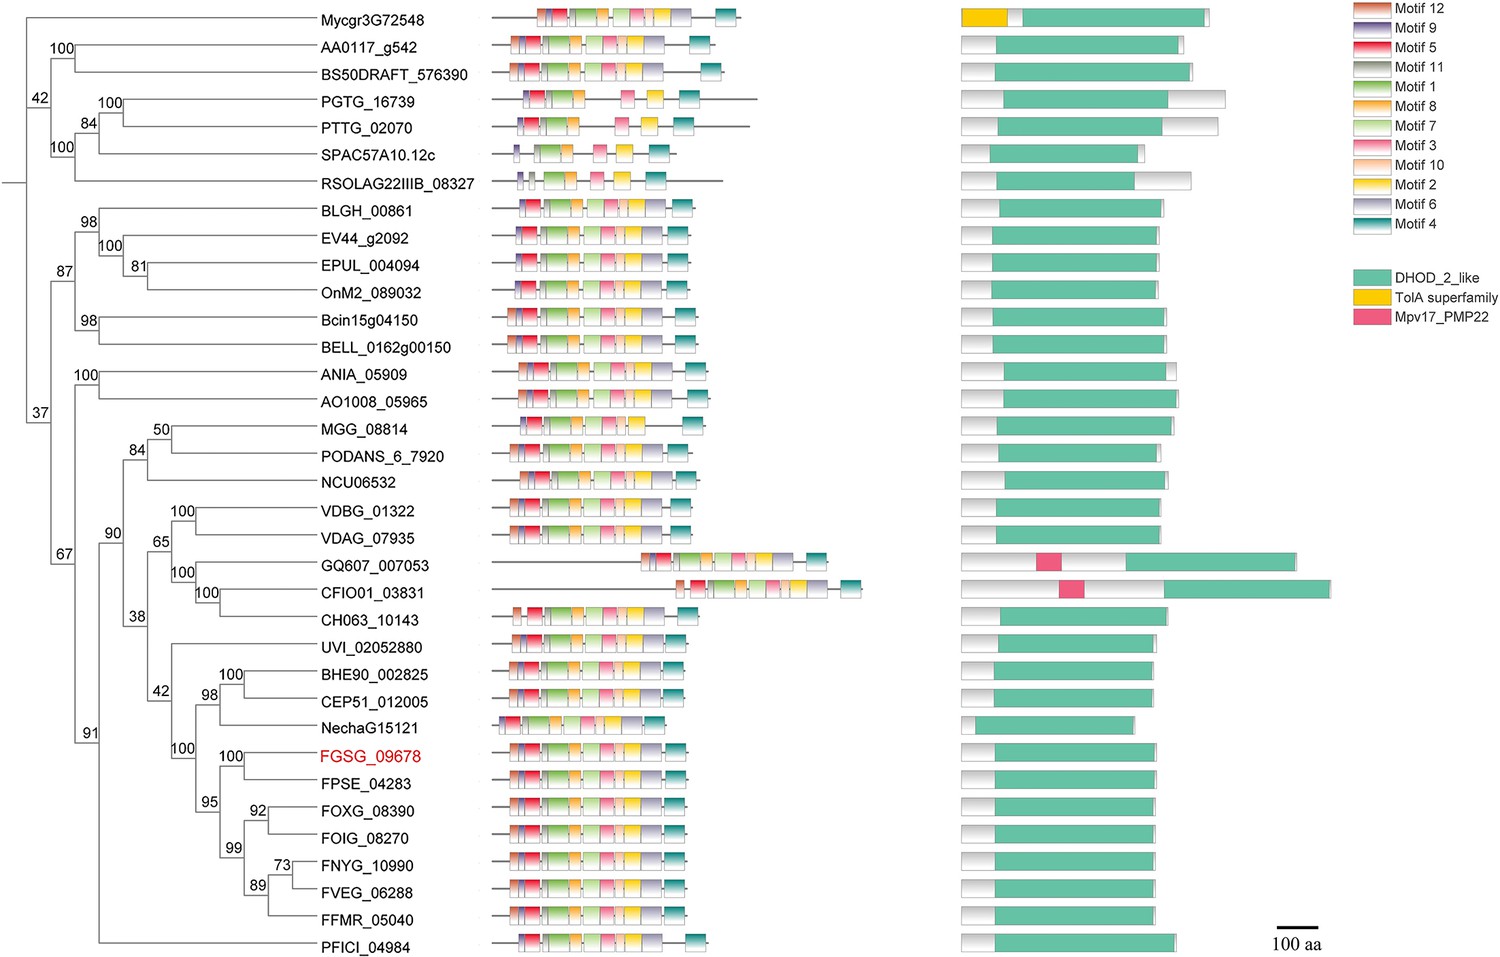
Phylogenetic tree of DHODHII proteins.
The phylogenetic tree was constructed based on the amino acid sequences of DHODHII homologous proteins with Mega X using the neighbor-joining method. The bootstrap values from 1000 replications are indicated on the branches. Motif pattern information was generated using the MEME suite12, while functional domain information and protein coordinates were obtained through CD-search. The final phylogenetic tree was visualized using TBtools. FgDHODHII was highlighted in red. The amino acid sequence of DHODHII from Alternaria alternata (AA0117_g542), Aspergillus nidulans (ANIA_05909), Aspergillus oryzae (AO1008_05965), Blumeria graminis (BLGH_00861), Botrytis cinerea (Bcin15g04150), Botrytis elliptica (BELL_0162g00150), Colletotrichum asianum (GQ607_007053), Colletotrichum fioriniae (CFIO01_03831), Colletotrichum higginsianum (CH063_10143), Corynespora cassiicola (BS50DRAFT_576390), Erysiphe necator (EV44_g2092), Erysiphe pulchra (EPUL_004094), Fusarium euwallaceae (BHE90_002825), Fusarium floridanum (CEP51_012005), Fusarium fujikuroi (FFMR_05040), Fusarium graminearum (FGSG_09678), Fusarium nygamai (FNYG_10990), Fusarium odoratissimum (FOIG_08270), Fusarium oxysporum (FOXG_08390), Fusarium pseudograminearum (FPSE_04283), Fusarium solani (NechaG15121), Fusarium verticillioides (FVEG_06288), Magnaporthe oryzae (MGG_08814), Neurospora crassa (NCU06532), Oidium neolycopersici (OnM2_089032), Pestalotiopsis fici (PFICI_04984), Podospora anserina (PODANS_6_7920), Puccinia graminis (PGTG_16739), Puccinia triticina (PTTG_02070), Rhizoctonia solani (RSOLAG22IIIB_08327), Schizosaccharomyces pombe (SPAC57A10.12c), Ustilaginoidea virens (UVI_02052880), Verticillium alfalfae (VDBG_01322), Verticillium dahliae (VDAG_07935), and Zymoseptoria tritici (Mycgr3G72548) were accessed in EnsemblFungi database.
Figure 4 with 1 supplement
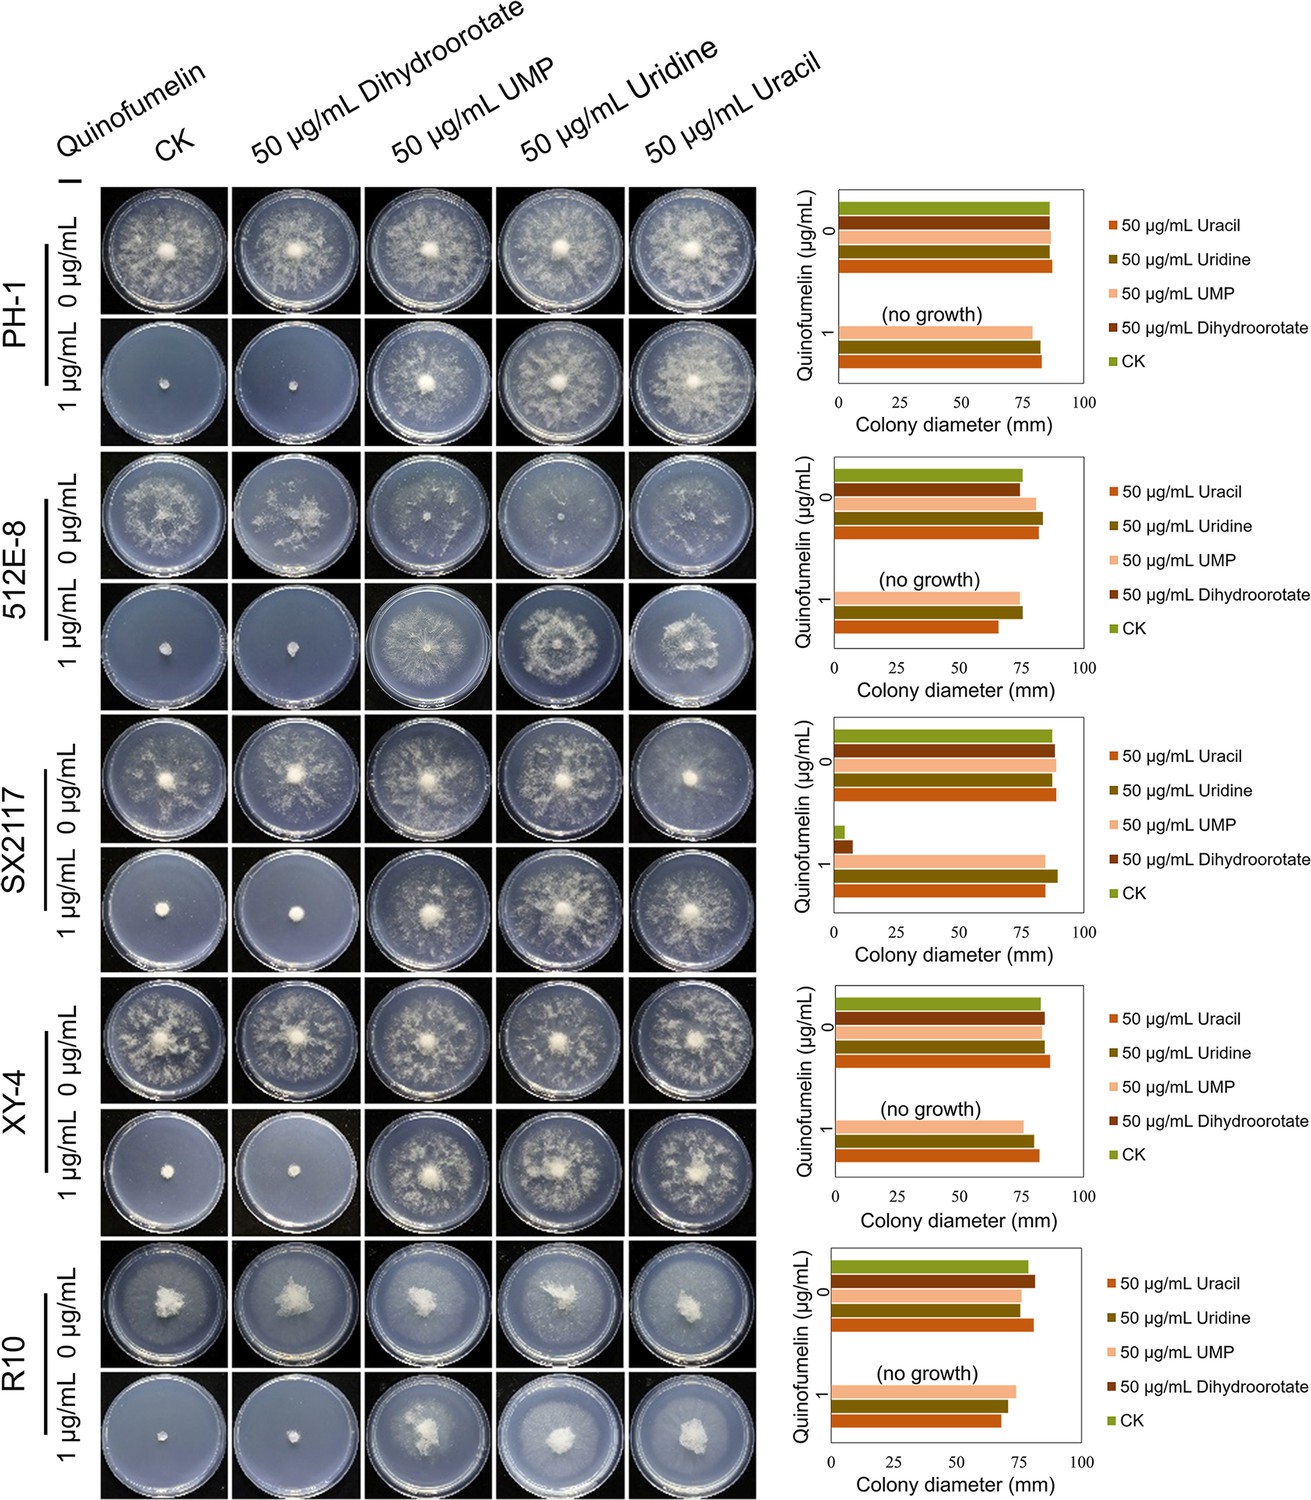
Recovery test of mycelial growth suppressed by quinofumelin.
All strains were incubated on Czapek Solution Agar (CZA) plates at 25°C for 3 days. F. graminearum strains PH-1, 512E-8, SX2117, XY-4, and R10. The left image shows the colony morphology, while the right image is a bar chart of colony diameters.
Figure 4—figure supplement 1
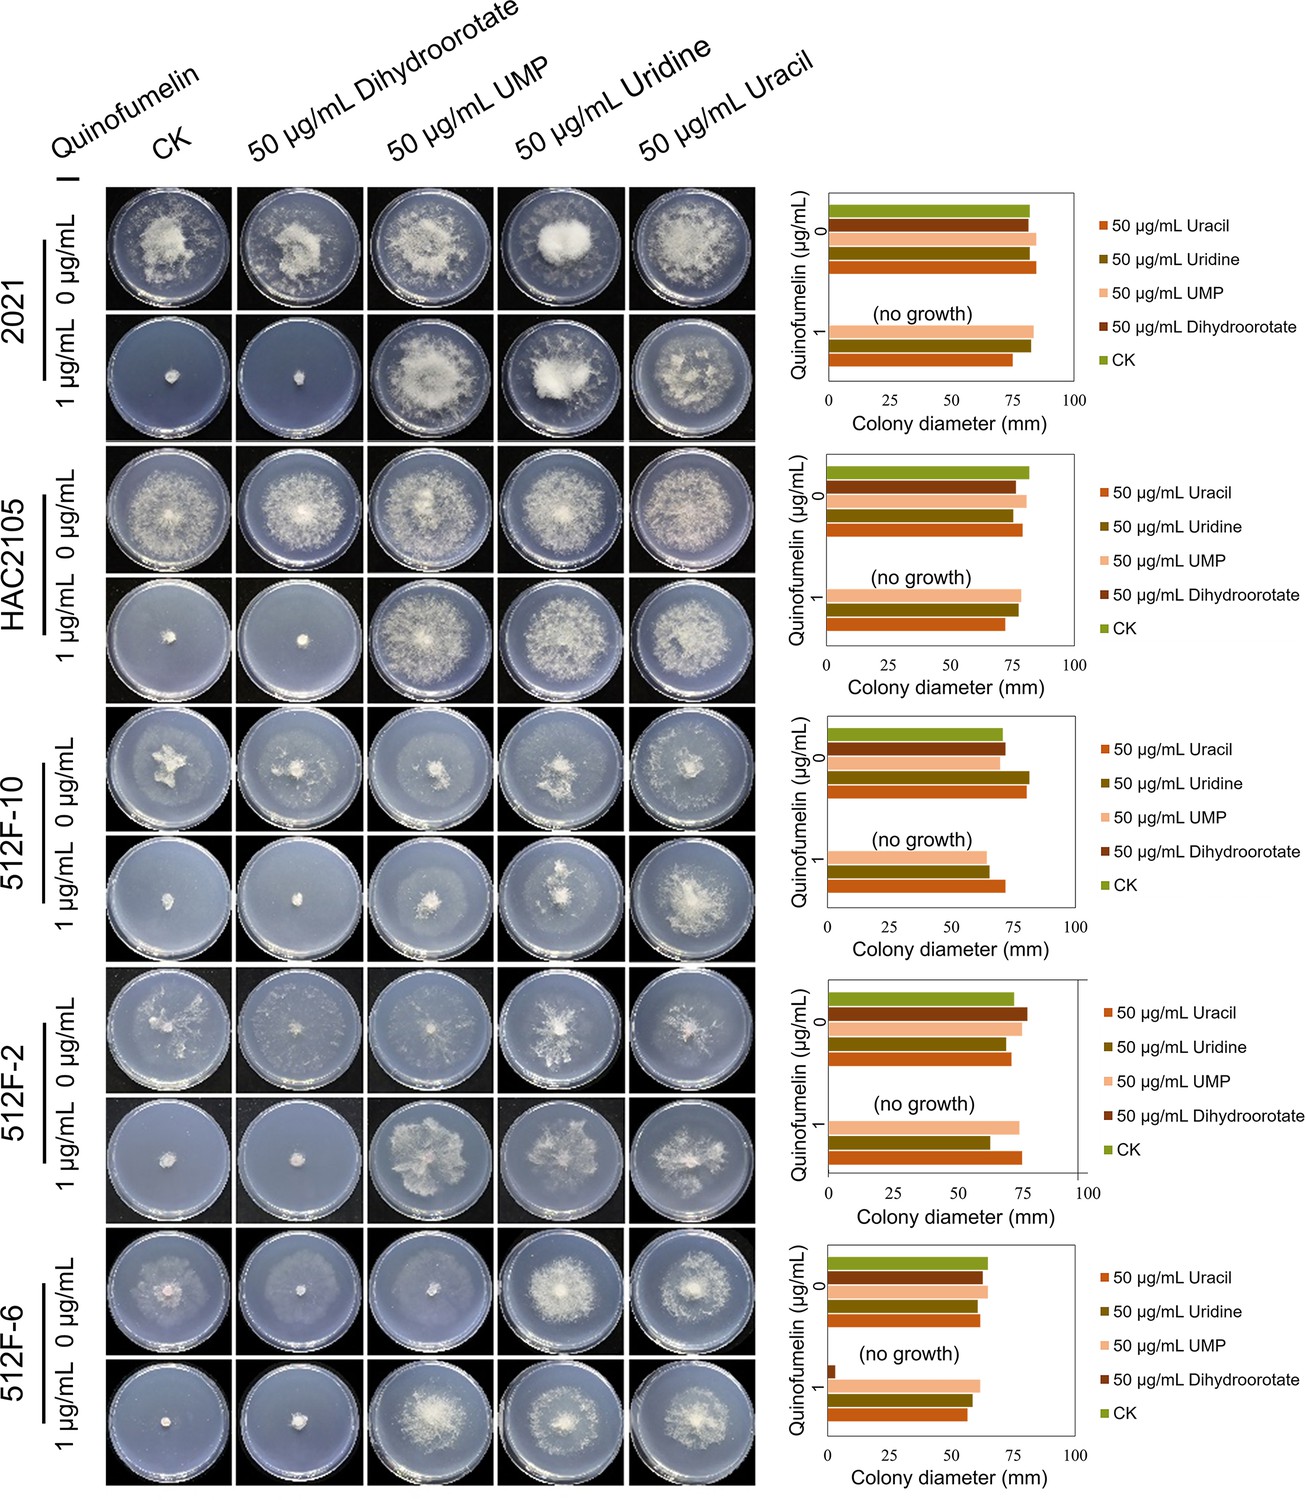
Recovery test of mycelial growth suppressed by quinofumelin.
All strains were incubated on Czapek Solution Agar (CZA) plates at 25°C for 3 days. F. asiaticum strains: 2021, HAC2105, 512 F-10, 512 F-2, and 512 F-6. The left image shows the colony morphology, while the right image is a bar chart of colony diameters.
Figure 5
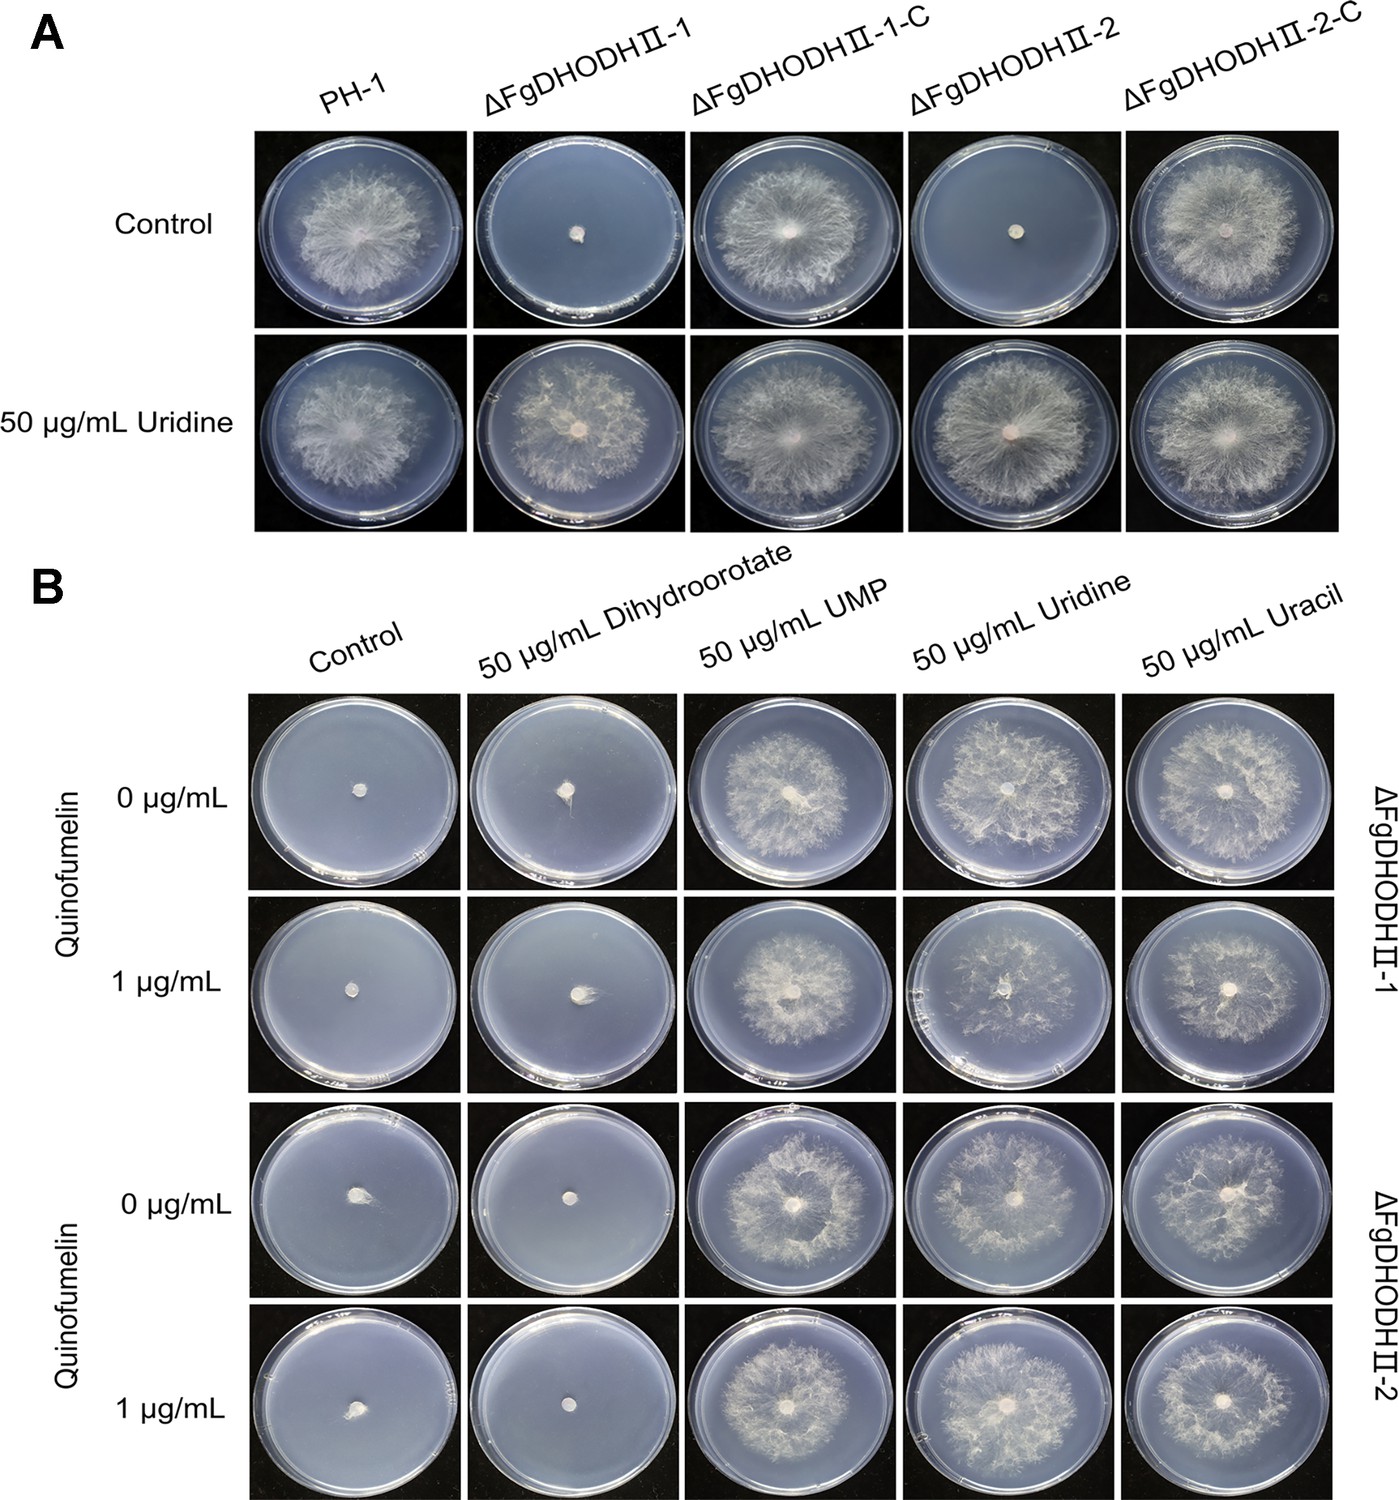
Mycelial growth of FgDHODHII deletion mutants on Czapek Solution Agar (CZA) plates.
(A) Mycelial growth of the FgDHODHII deletion mutants and the parental strain was observed in the presence or absence of 50 μg/mL uridine. (B) Recovery of mycelial growth of the FgDHODHII deletion mutants was observed in the presence of 50 μg/mL dihydroorotate, uridine monophosphate (UMP), uridine, or uracil. All strains were incubated at 25°C for 3 days.
Figure 6 with 1 supplement
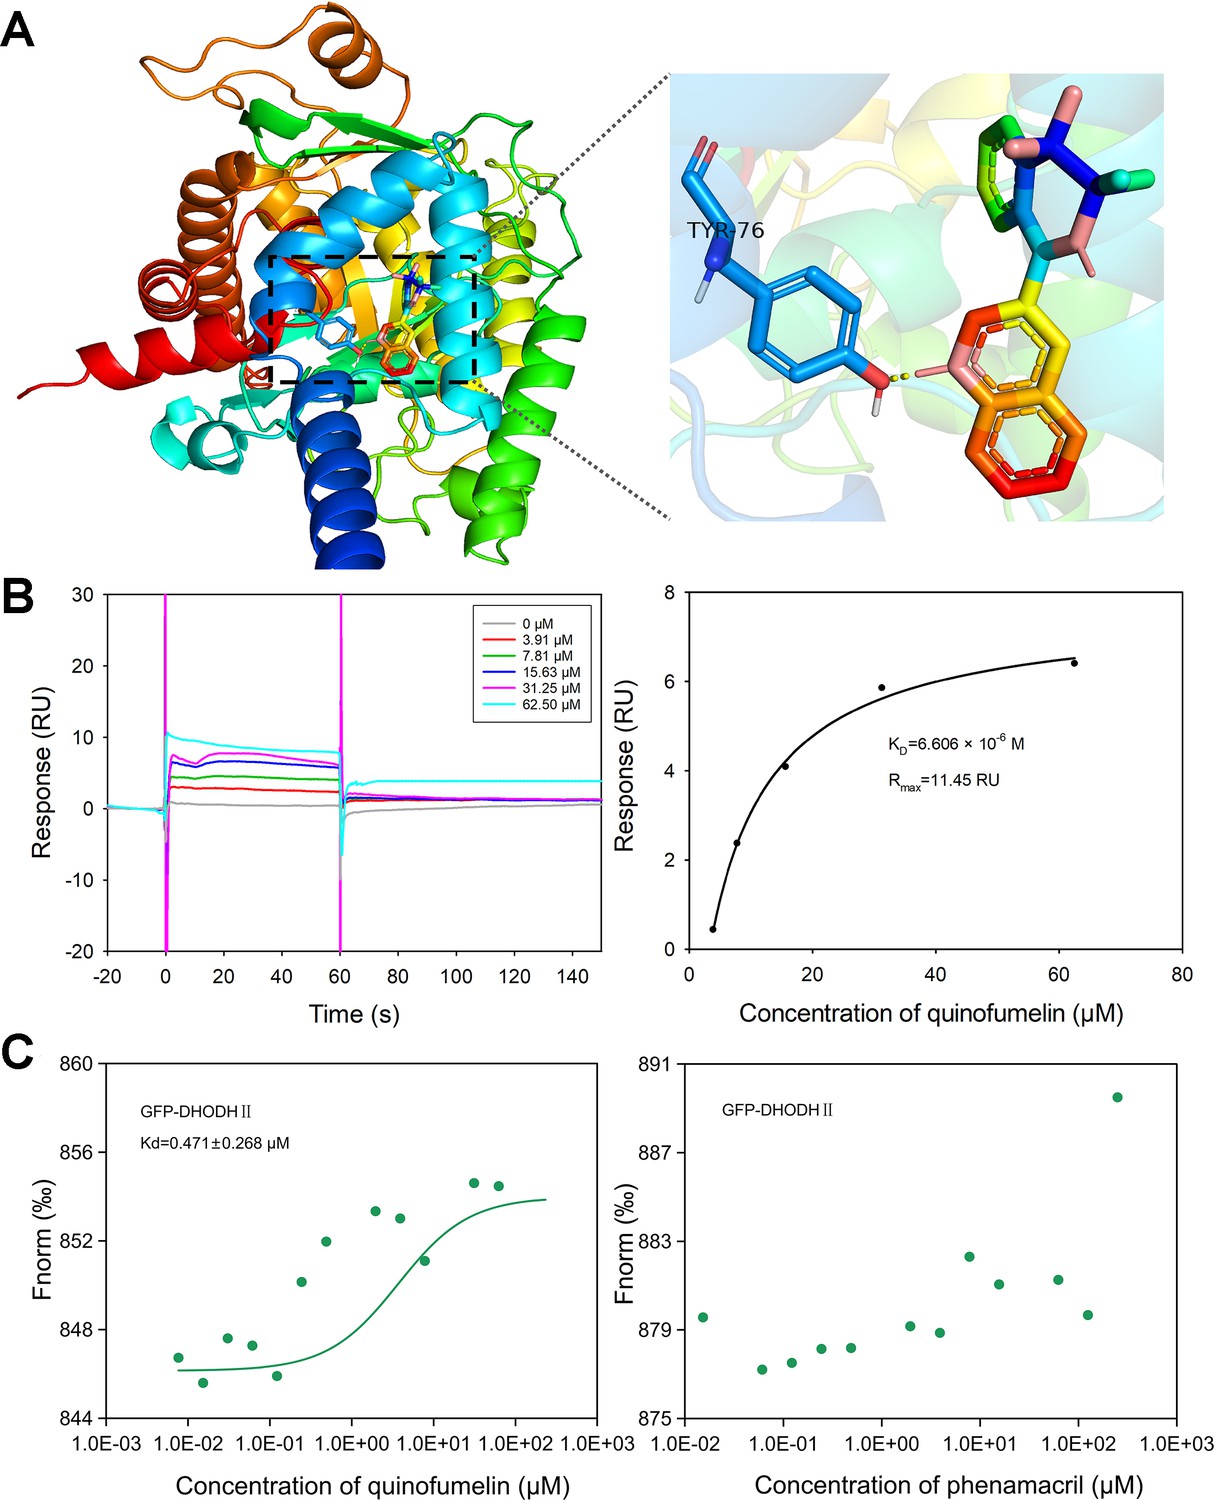
Validation and analysis of quinofumelin’s binding affinity to FgDHODHII.
(A) Three-dimensional model of the wild-type FgDHODHII are depicted, with an enlarged view highlighting the binding site for quinofumelin on the corresponding FgDHODHII models. (B) The surface plasmon resonance (SPR) response (RU) analysis and fitting results demonstrate the interaction between quinofumelin and FgDHODHII. (C) Microscale thermophoresis (MST) analysis to detect the binding of quinofumelin and FgDHODHII.
Figure 6—figure supplement 1
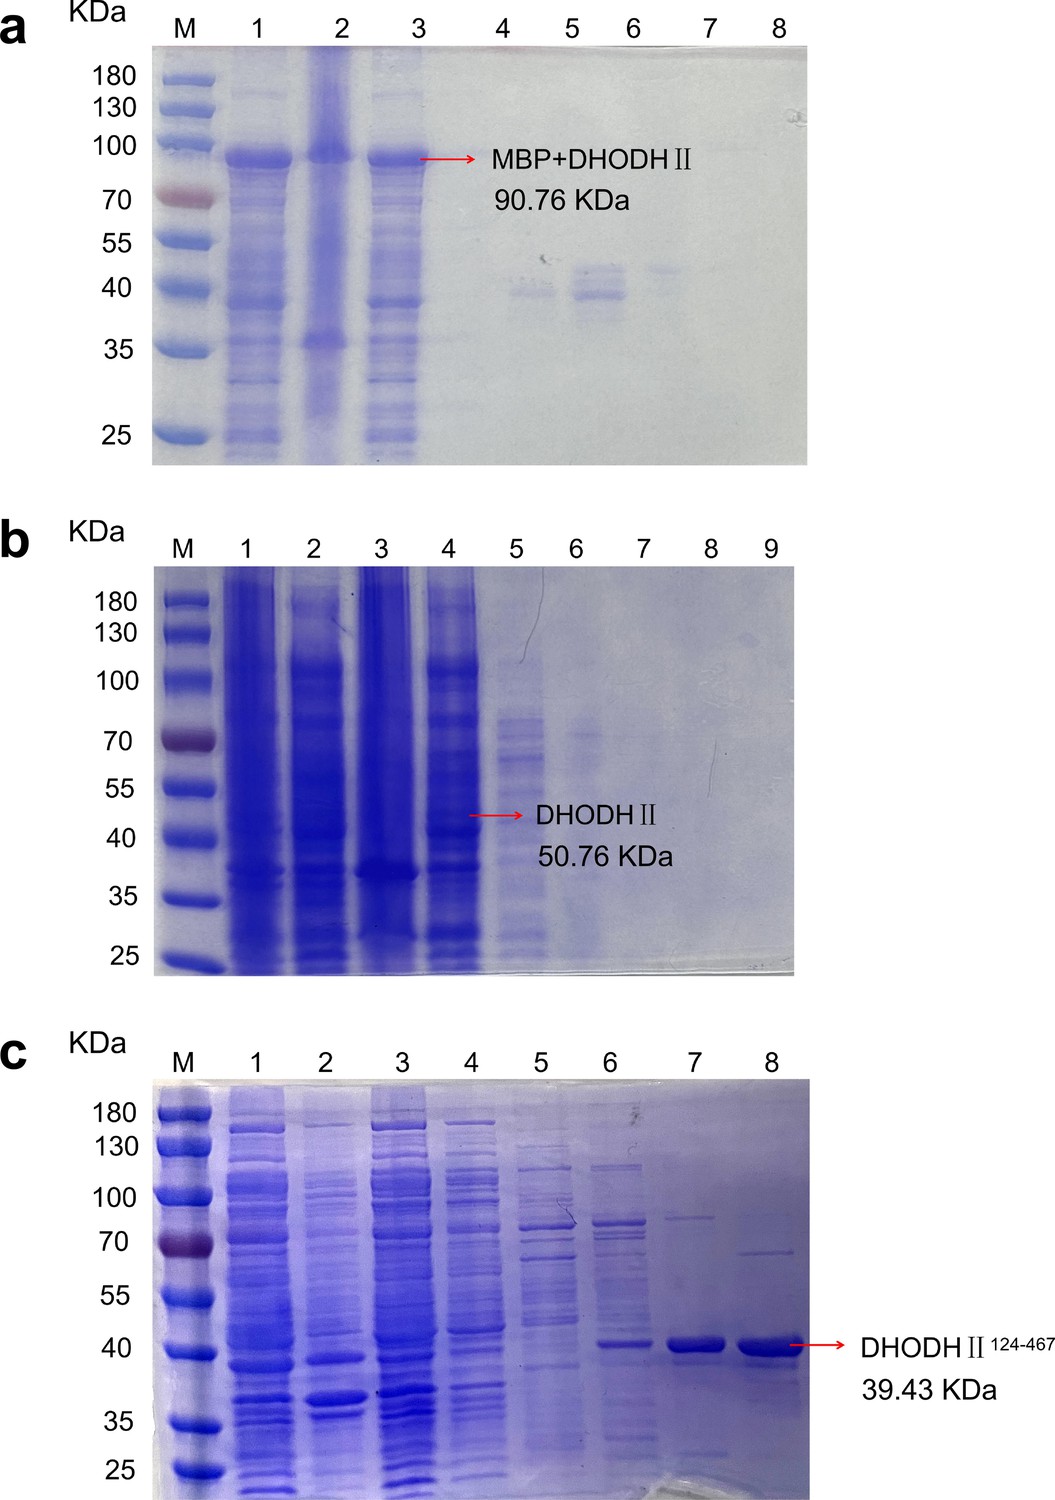
SDS-PAGE electrophoresis of the fusion protein.
(A) The purification effect of pCold-9 ×His-MBP-TEV-DHODHII. (B) The purification effect of pET-28a (+)-DHODHII. (C) The purification of pET-28a (+) -DHODHII124-467. The lane M is a protein marker; in a and c, lanes 1–8 were supernatant, precipitate, flow through solution, and eluent containing 5, 20, 50, 100, and 250 mM imidazole, respectively. In b, lanes 1–9 were the whole fungus, supernatant, precipitate, flow-through solution, and eluent containing 5, 20, 50, 100, and 250 mM imidazole.
-
Figure 6—figure supplement 1—source data 1
TIFF file containing original western blots for Figure 6—figure supplement 1A, indicating the relevant bands and treatments.
- https://cdn.elifesciences.org/articles/105892/elife-105892-fig6-figsupp1-data1-v1.zip
-
Figure 6—figure supplement 1—source data 2
Original files for SDS-PAGE analysis displayed in Figure 6—figure supplement 1A.
- https://cdn.elifesciences.org/articles/105892/elife-105892-fig6-figsupp1-data2-v1.zip
-
Figure 6—figure supplement 1—source data 3
TIFF file containing original western blots for Figure 6—figure supplement 1B, indicating the relevant bands and treatments.
- https://cdn.elifesciences.org/articles/105892/elife-105892-fig6-figsupp1-data3-v1.zip
-
Figure 6—figure supplement 1—source data 4
Original files for SDS-PAGE analysis displayed in Figure 6—figure supplement 1B.
- https://cdn.elifesciences.org/articles/105892/elife-105892-fig6-figsupp1-data4-v1.zip
-
Figure 6—figure supplement 1—source data 5
TIFF file containing original western blots for Figure 6—figure supplement 1C, indicating the relevant bands and treatments.
- https://cdn.elifesciences.org/articles/105892/elife-105892-fig6-figsupp1-data5-v1.zip
-
Figure 6—figure supplement 1—source data 6
Original files for SDS-PAGE analysis displayed in Figure 6—figure supplement 1C.
- https://cdn.elifesciences.org/articles/105892/elife-105892-fig6-figsupp1-data6-v1.zip
Figure 7
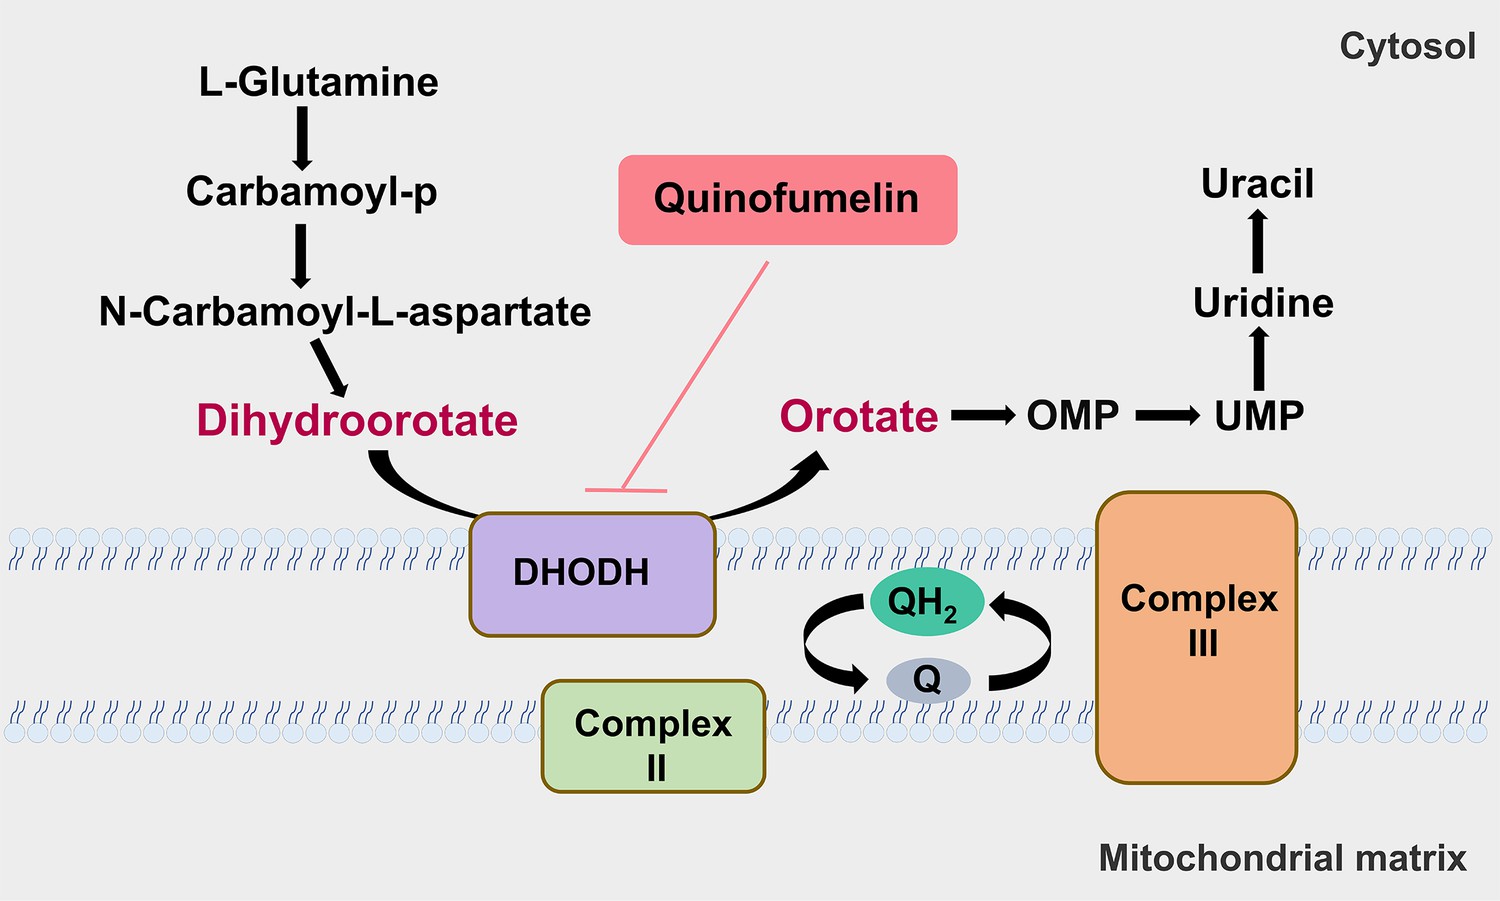
A model of the pyrimidine pathway that quinofumelin attacks.
Tables
Table 1
Primers used in the study.
| Primer | Sequence (5’–3’) | Use |
|---|---|---|
| FgDHODHII-UF | GGCAGTGAAAGTCTTGTTCAAG | PCR primers to amplify FgDHODHII upstream fragment |
| FgDHODHII-UR | GCTCCTTCAATATCATCTTCTGTG GCTGGGAAGTAATGCTGGG | |
| FgDHODHII-DF | GAGACAATACCGGAAGGAAC ACATGCTATAGCAAGCAACA | PCR primers to amplify FgDHODHII downstream fragment |
| FgDHODHII-DR | AAACTTAACAAATCATCTTTGCC | |
| SS-F | ACAGAAGATGATATTGAAGGAGC | PCR primers to amplify Hph-Hsv-tk fragment |
| SS-R | GAGACAATACCGGAAGGAA | |
| FgDHODHII-YZ-F | TTTGCCCGATCTCTTGGTCT | PCR primers to verify FgDHODHII |
| FgDHODHII-YZ-R | AACCACCAGTCTCCATGAGG | |
| FgDHODHII-GFP-F | CTCATCACCATCACCATCAC ATGTCTGCCGCTCTCCTACG | Constructed FgDHODHII-GFP fusion vector |
| FgDHODHII-GFP-R | AGCTCCTCGCCCTTGCTCAC CCTCGAATTCTTCACACCAC | |
| T7 | TAATACGACTCACTATAGG | Amplification of FgDHODHII fragments for sequencing |
| T7t | CCGCTAGTTATTGCTCAGC | |
| pET-28a-F | CCTGGTGCCGCGCGGCAGCCATATGCT GGCTGTCAATGTTTTTGGAACAG | PCR primers to construct pET28a-FgDHODHII expression vector |
| pET-28a-R | AAGCTTGTCGACGGAGCTCGAATTCCT ATTTTAACTCCTGCTTGATCCTG | |
| pCold-F | GTAAAGCACGCCATATCGC | PCR primers to construct pCold-FgDHODHII expression vector |
| pCold-R | CCAAATGGCAGGGATCTTAG |
Additional files
-
MDAR checklist
- https://cdn.elifesciences.org/articles/105892/elife-105892-mdarchecklist1-v1.docx
-
Supplementary file 1
Supplementary tables for this article.
- https://cdn.elifesciences.org/articles/105892/elife-105892-supp1-v1.docx
Download links
A two-part list of links to download the article, or parts of the article, in various formats.
Downloads (link to download the article as PDF)
Open citations (links to open the citations from this article in various online reference manager services)
Cite this article (links to download the citations from this article in formats compatible with various reference manager tools)
Action mechanism of a novel agrichemical quinofumelin against Fusarium graminearum
eLife 14:RP105892.
https://doi.org/10.7554/eLife.105892.3


