Single nuclei RNA-sequencing of adult brain neurons derived from type 2 neuroblasts reveals transcriptional complexity in the insect central complex
- Institute of Neuroscience, Howard Hughes Medical Institute, University of Oregon, United States
Figures
Figure 1 with 1 supplement

Cell atlas of central brain with single nuclei RNAseq.
(A-A’) Genetics (A) to label progeny (A’) derived from T2 NBs. Dashed lines show the boundary of optic lobes and central brain, and the optic lobes were removed during dissection. (B) Central brain atlas labeled with known cell types. Abbreviations: CLK, clock neurons; CRZ, Corazonergic neurons; DOP, dopaminergic neurons; HEM, hemocytes; MBN, mushroom body neurons; OCTY, octopaminergic-tyraminergic neurons; OC, ocelli; OL, optic lobe; OPN, olfactory projection neurons; SER: serotoninergic neurons. (C) Central brain atlas labeled by NB (T1 or T2) lineage. Dash line-outlined box shows the region enriched with the cells derived from T2 NBs, and the identity are shown at the bottom-right box. (D) Dot plot of top 5 marker genes of the T2-enriched clusters. (E) Atlas of central brain glia labeled with known cell types. (E’) T1 and T2 derived cells colored cyan and red respectfully. (F) Dot plot of known and top marker genes of glial clusters.
Figure 1—figure supplement 1
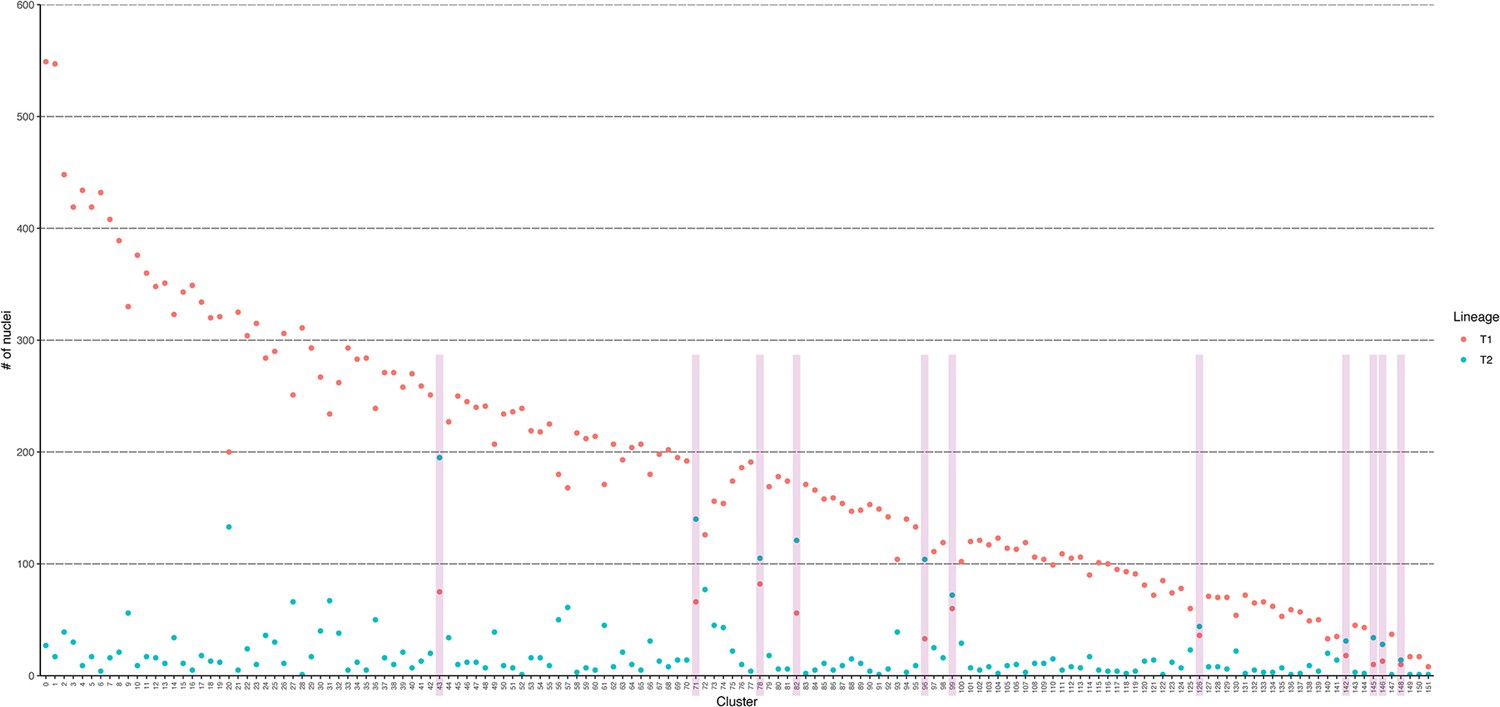
Nuclei numbers T1 vs T2.
Vertical shades mark the cluster with T2/(T1+T2)>50%.
Figure 2 with 1 supplement

Cell atlas of neurons produced by T1 or T2 NBs.
(A) Cell atlas from T2 NBs. (B) Heatmap of scaled average expression of top 10 markers genes from each T2 neuronal cluster.
Figure 2—figure supplement 1
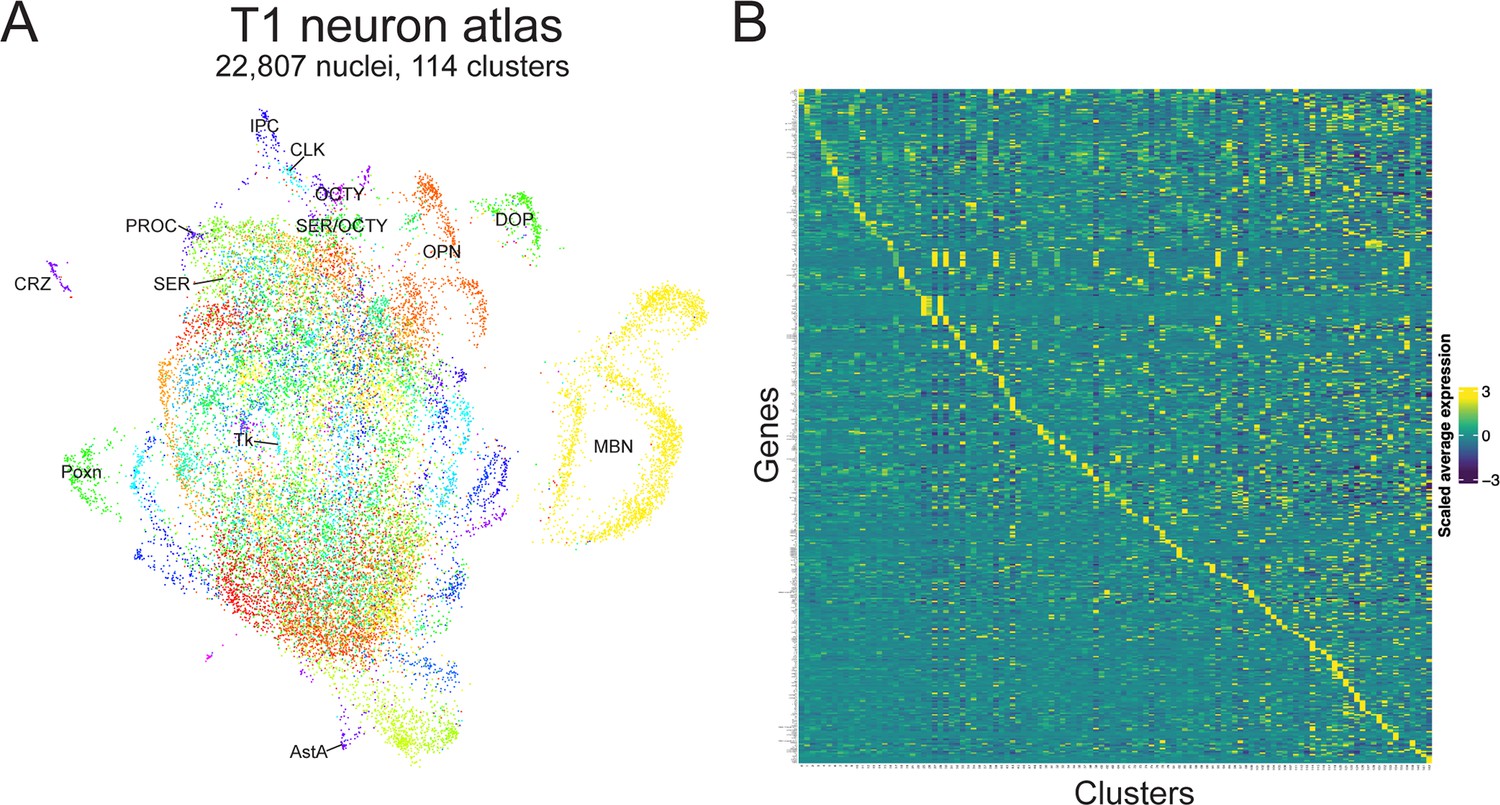
T1 neuron atlas.
(A) Cell atlas from T1 NBs. (B) Heatmap of scaled average expression of top 10 markers genes from each neuronal cluster. Annotations: AstA, Allatostatin A+ neurons; CLK, clock neurons; CRZ, Corazonin+ neurons; DOP, dopaminergic neurons; IPC, insulin-like peptide producing cells; MBN, mushroom body neurons; OCTY, octopaminergic-tyraminergic neurons; OPN olfactory projection neurons; Tk, Tachykinin+ neurons; Poxn, Pox neuro+ neurons; PROC, Proctolin + neurons; SER, serotonergic neurons.
Figure 3
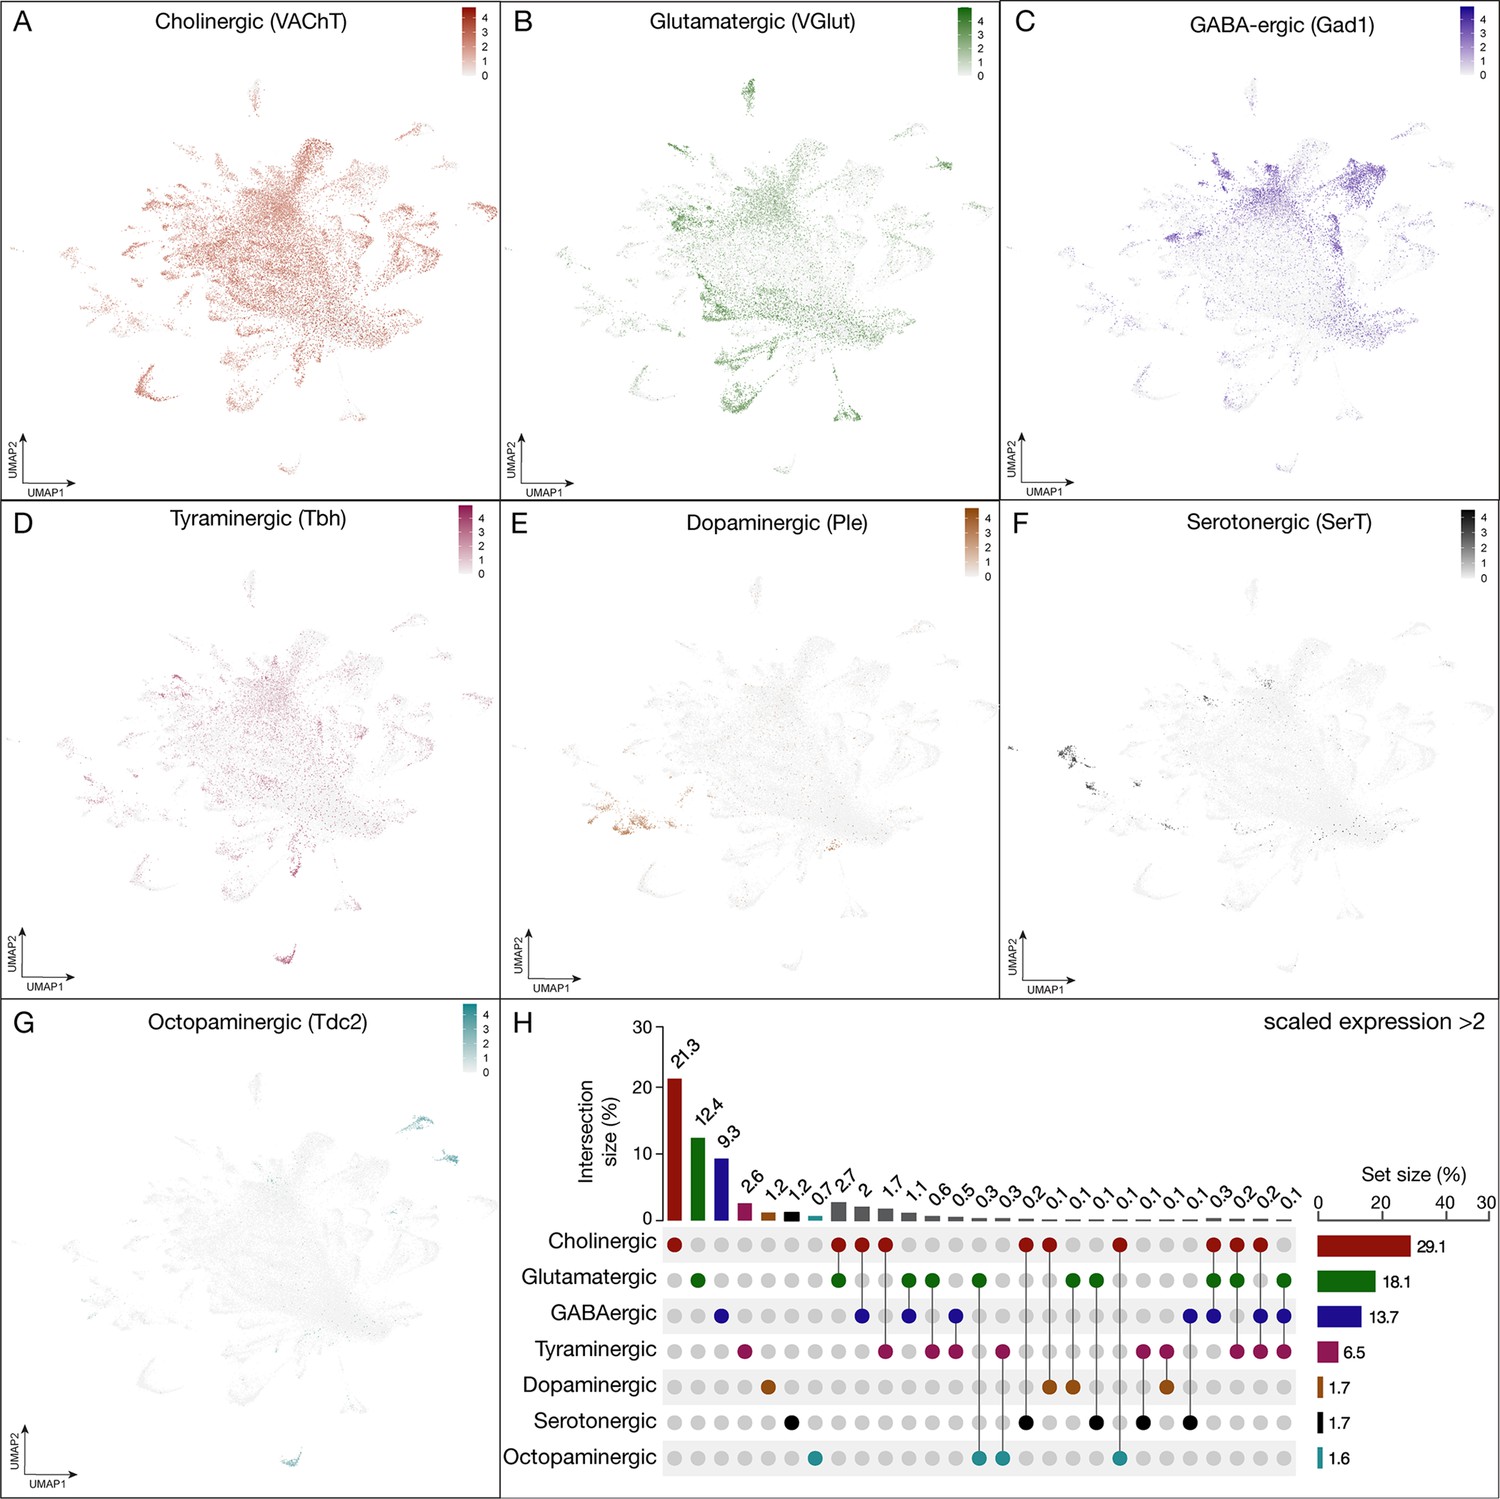
Expression of fast-acting neurotransmitters in neurons derived from T2NSC lineages.
(A–G) UMAP distribution plots demonstrate the expression of the following neurotransmitters: (A) vesicular glutamate transporter (VGlut, glutamatergic neurons), (B) vesicular acetylcholine transporter (VAChT, cholinergic neurons), (C) glutamic acid decarboxylase 1 (Gad1, GABAergic neurons), (D) tyramine β hydroxylase (Tbh, tyraminergic neurons), (E) tyrosine 3-monooxygenase (Ple, dopaminergic neurons), (F) serotonin transporter (SerT, serotonergic neurons) (G) tyrosine decarboxylase (Tdc2, octopaminergic neurons). All plots have a minimum cutoff value set at 0. (H) The UpSet quantifies the number of cells in the atlas that express each neurotransmitter gene with a scaled expression >2 (Gu, 2022).
Figure 4
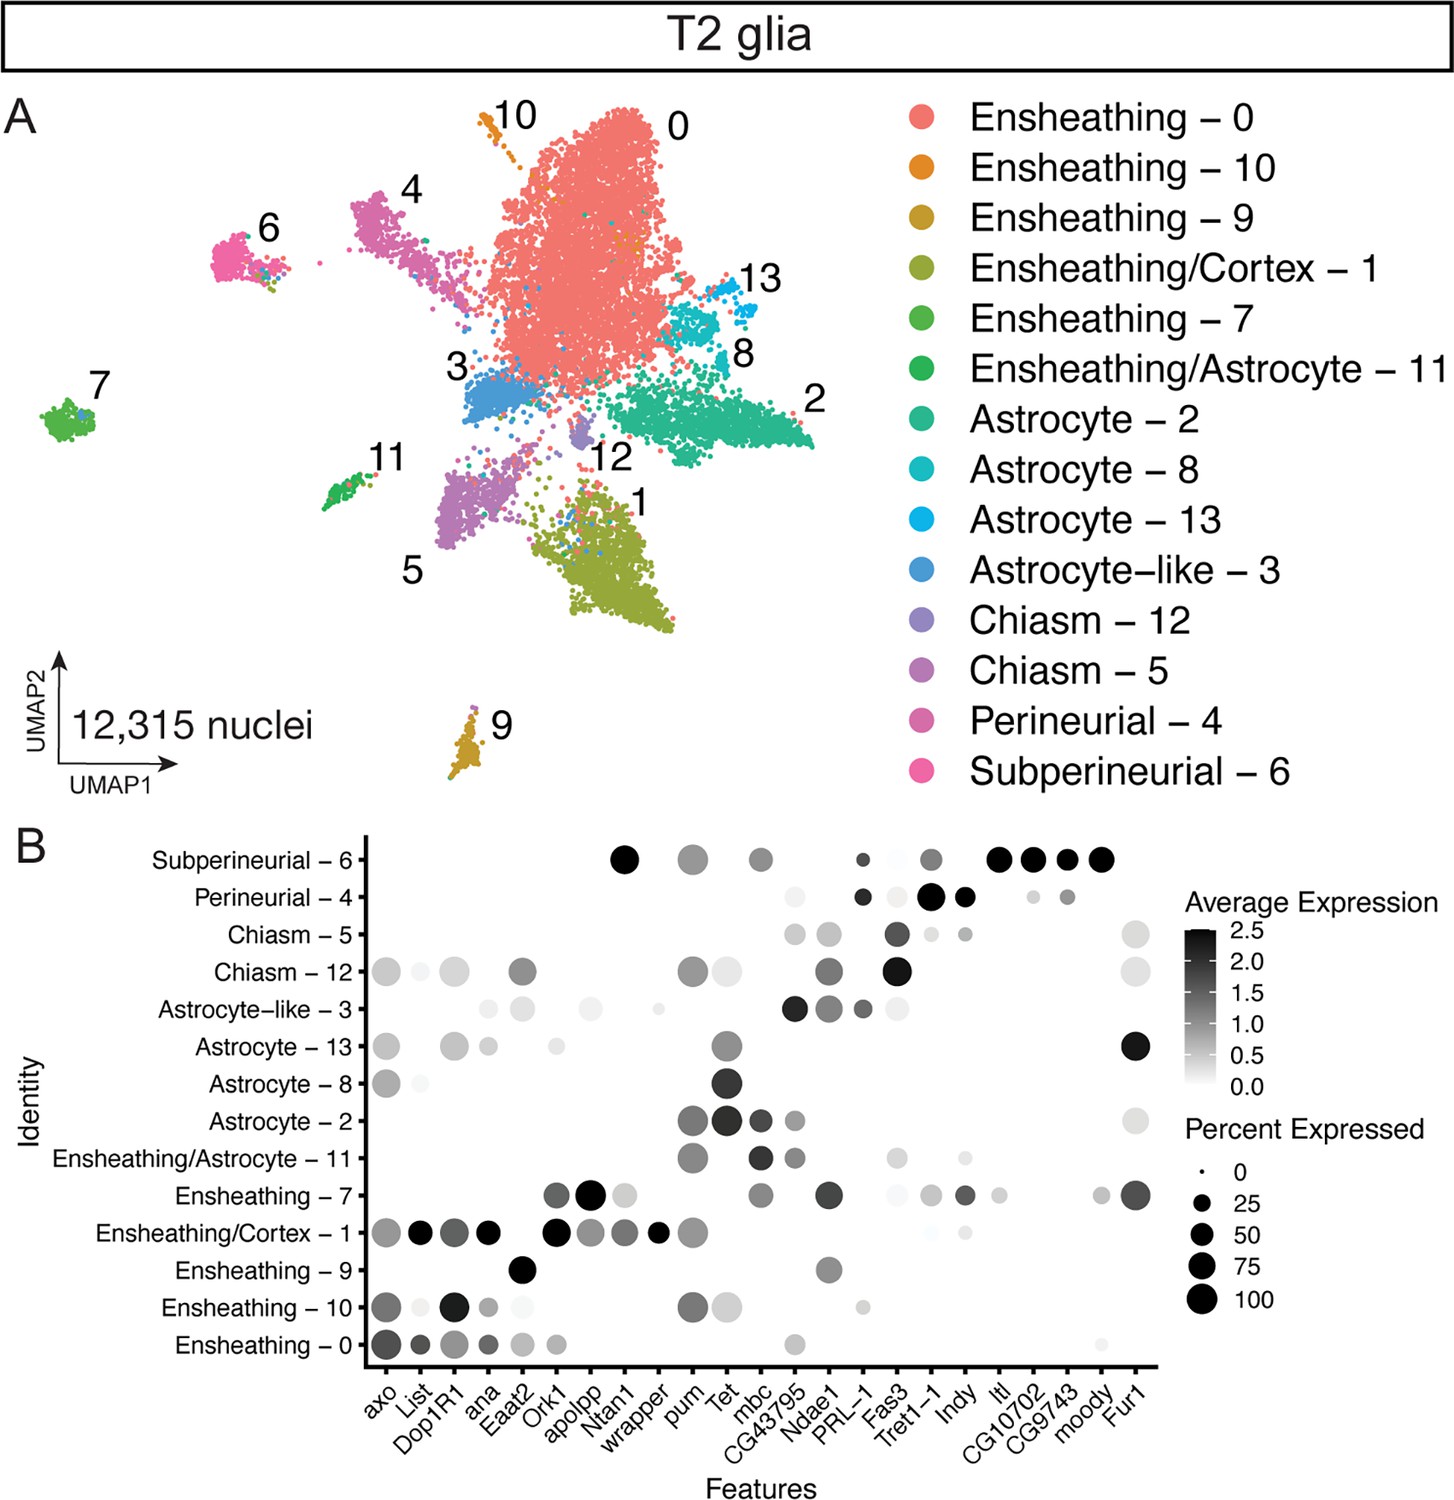
Glial cell types present in the T2-derived cell atlas.
(A) Sub-clustered of 12,315 nuclei from Repo + T2 clusters in UMAP distribution. (B) Dot plot of validated glial subtype markers to identify glial clusters by differential gene expression.
Figure 5
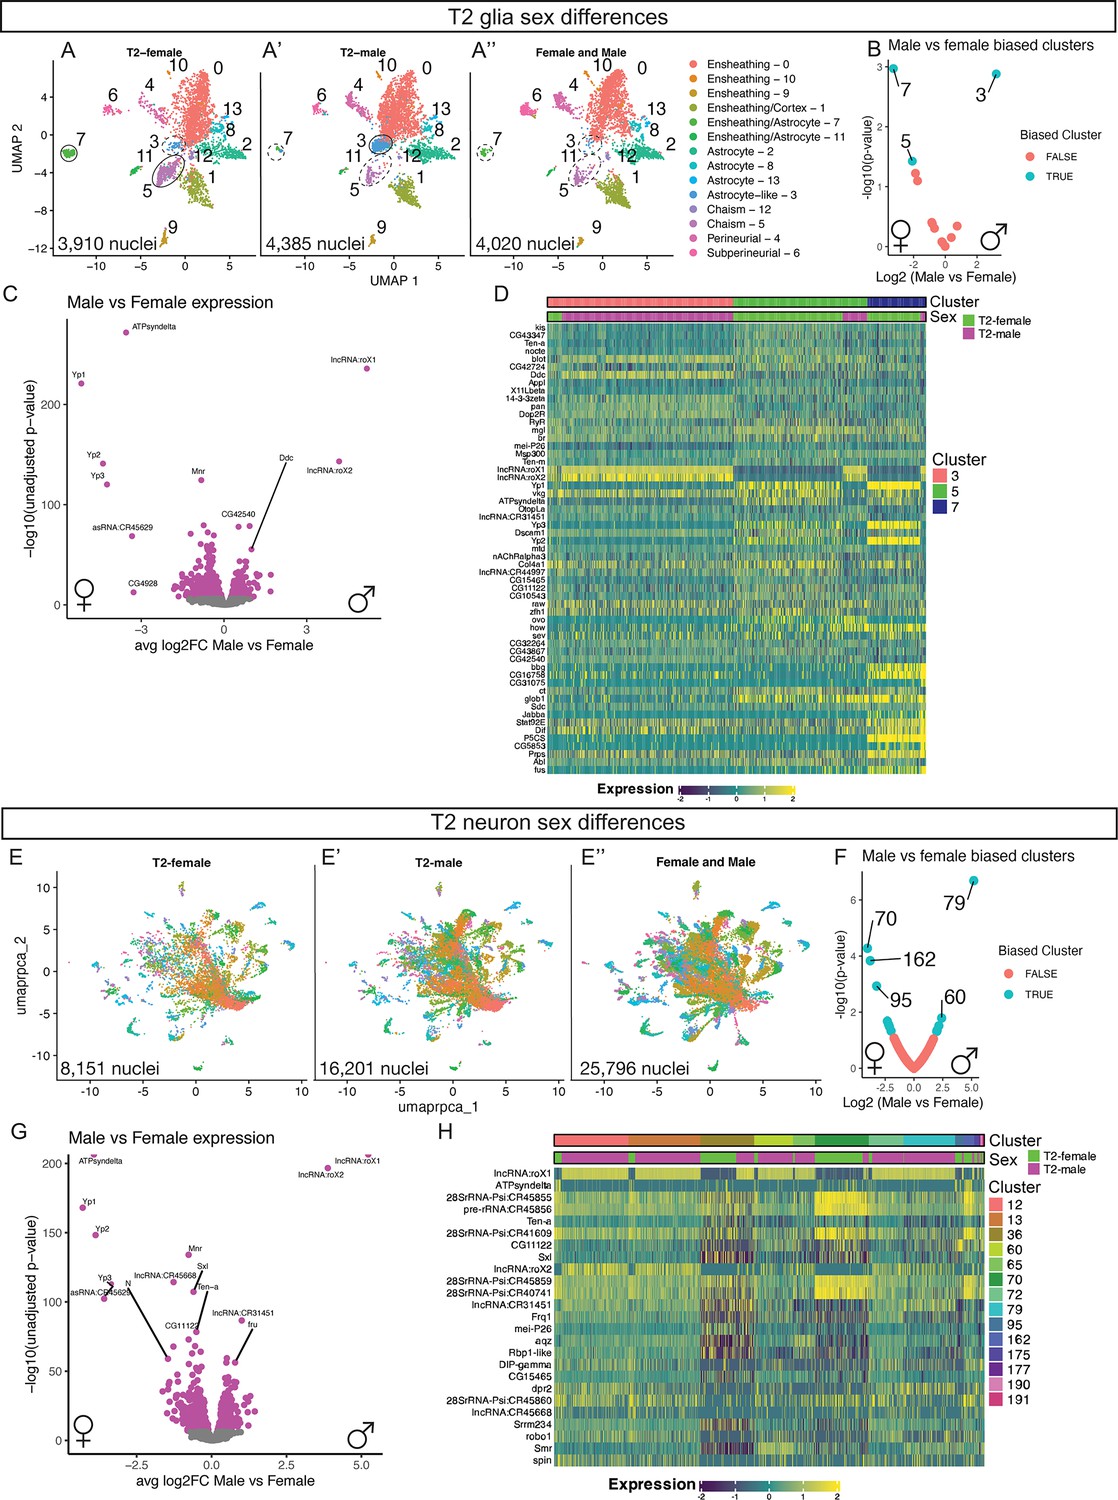
Sex differences present in the T2-derived glia and neurons.
(A-A’’) T2 glia in UMAP distribution across samples: (A) T2 Female (3,910 nuclei), (A’) T2 Male (4,385 nuclei), (A’’) Female and Male mixed (4,020 nuclei). (B) Biased clusters for male to female ratio for number of nuclei in the T2 glia clusters. (C) Differential expression between male and female T2 glia. (D) Heatmap of top differential gene expression between male and female nuclei within glial clusters. (E-E’’) T2 neuron in UMAP distribution across samples: (E) T2 Female (8,151 nuclei), (E’) T2 Male (16,201 nuclei), (E’’) Female and Male mixed (25,796 nuclei). (F) Biased clusters for male to female ratio for number of nuclei in the T2 neuron clusters. (G) Differential expression between male and female T2 neurons. (H) Heatmap of top differential gene expression between male and female nuclei within neuron clusters.
Figure 6 with 1 supplement
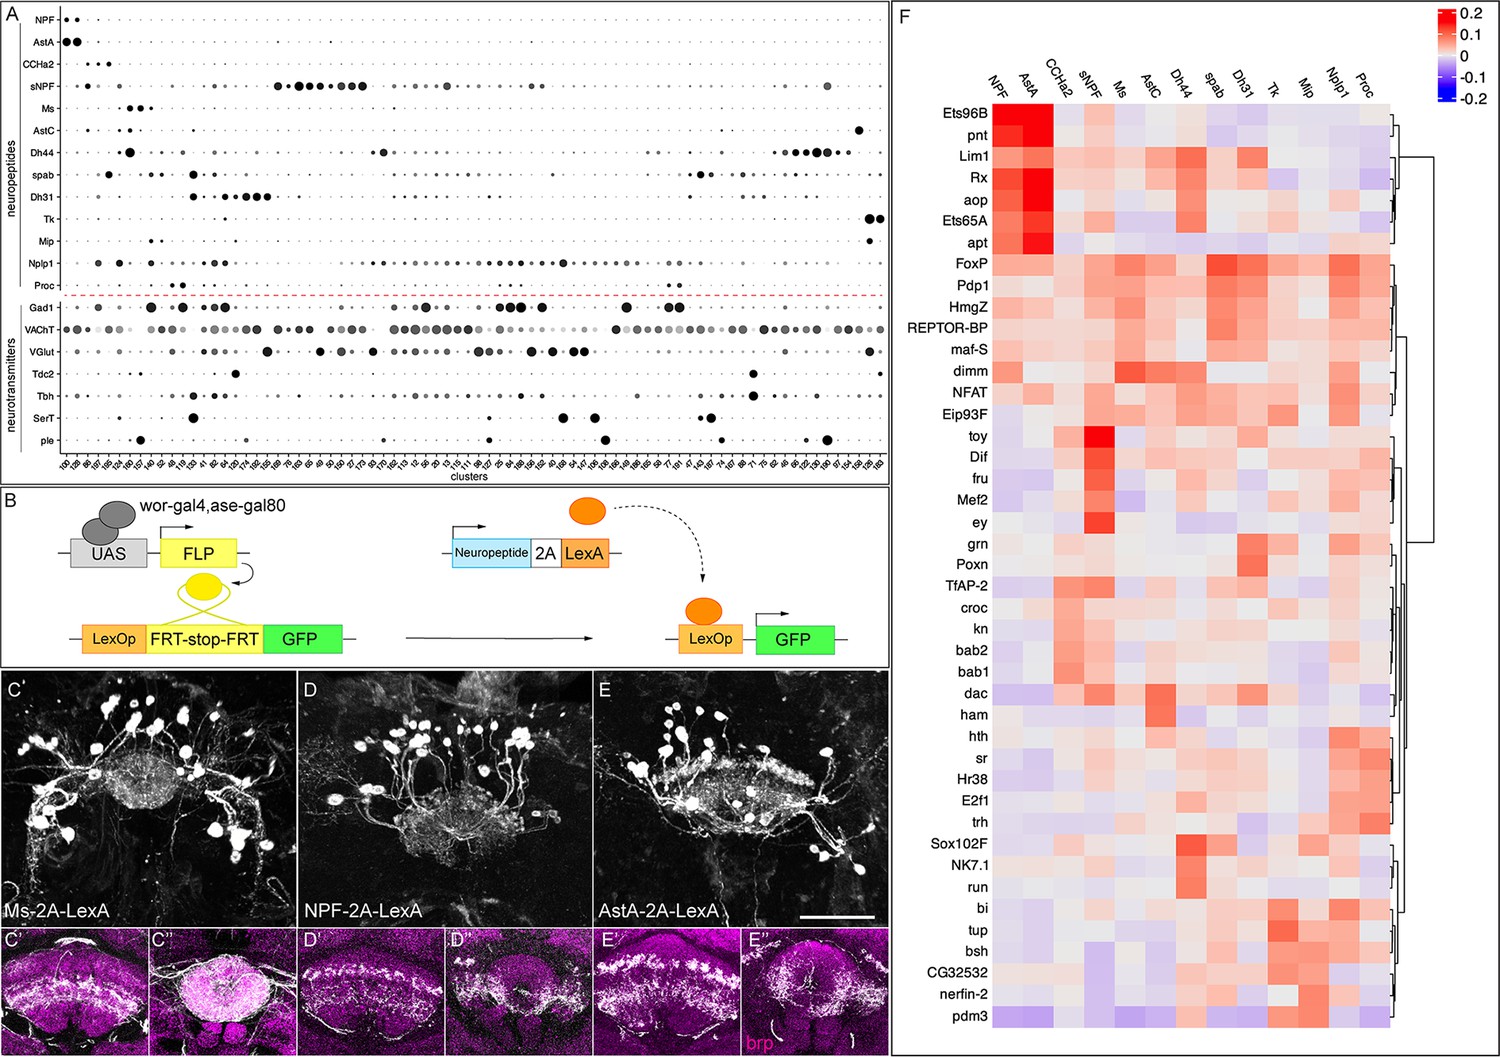
Neuropeptide expression in T2-derived neurons.
(A) Dot plot showing expression of 13 neuropeptides and their co-expression with the 7 fast-acting neurotransmitters (red dashed line) across selected clusters. (B) Genetic scheme to map neuropeptide expression in T2-derived adult neurons. (C–E) Neuropeptide-expressing neurons labeled with GFP in three-dimensional projections. (C'–E’) Fan-shaped body projections. (C''-E'') Ellipsoid body projections. nc82 counterstains (magenta) in the brain for neuropil projections. (F) Heatmap showing the top 5 transcription factors most strongly correlated with each neuropeptide across all cells (Sigorelli, 2024). Scale bar represents 20 μm.
Figure 6—figure supplement 1
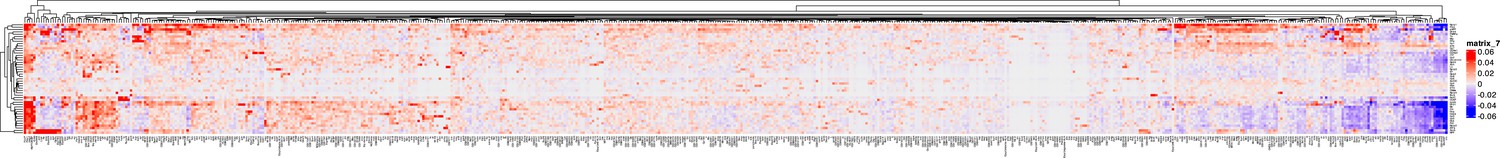
Expression correlation coefficient of transcription factors and neuropeptides.
Heatmap of expression correlation coefficient of transcription factors and neuropeptides calculated from each individual T2 neuron.
Figure 7
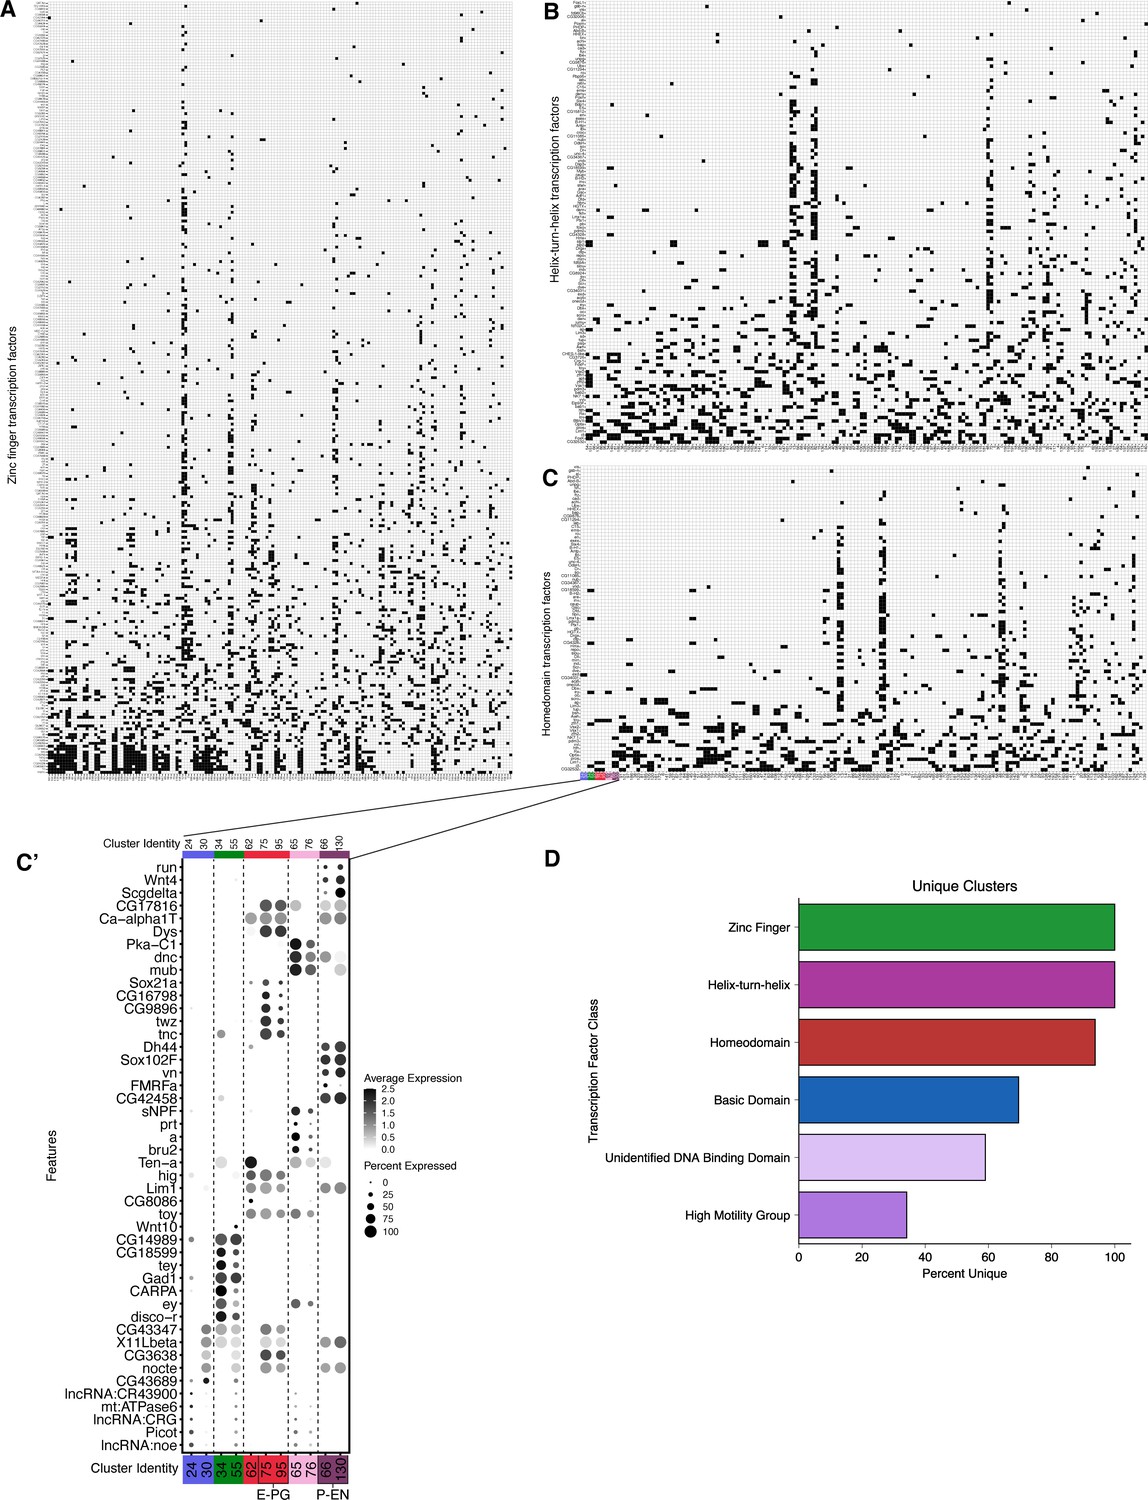
Combinations of transcription factor expression in T2-derived neurons.
Binarized heatmaps of positive (A) zinc finger (B) helix-turn-helix (C) homeodomain TF markers in T2-derived neurons. Clusters are sorted by similarity based on Jaccard index scores. (C`) Top five marker genes for clusters which had non-unique combinations of homeodomain TF expression. Percentage of clusters with unique combinations of TF expression based on TF class zinc finger TFs = 100% (161 unique clusters), helix-turn-helix TFs = 100% (161 unique clusters), homeodomain TFs = 93.8% (150 unique clusters), basic domain TFs = 69.6% (112 unique clusters), unidentified DNA binding domain TFs = 59% (95 unique clusters), high motility group TFs = 34.2% (55 unique clusters).
Figure 8

Mapping T2-derived neurons to UMAP clusters.
(A) Heatmap of the coefficients (r) of expression profiles of single cell clusters (columns) to the expressions of known central complex neurons (rows) profiled with bulk RNA sequencing. The matching of the cluster to the central complex neurons is determined by the highest coefficient value (gray box) for each cluster. FB6A(1) and FB6A(2) are labeled and profiled with two different split-Gal4 drivers (Wolff et al., 2025). Cluster 75 and 95 identified as E-PG were verified in Dillon et al., 2024. (B) Scaled average expression of the enhancer genes of split-Gal4 drivers (columns) in each cluster (rows). The name of central complex neurons (CX) labeled by split-Gal4 drivers are listed at the top. The cluster identity was determined by the combination of positive scaled average expression of the enhancer genes (black boxes). (C) Dotplot of the known marker genes (toy, runt) expressed in central complex neurons (PF-R, P-FN, and P-EN), lexA-driver enhancer gene (rho, Gγ30A), split-Gal4-driver (SS00191) enhancer genes (shakB, Pkc53E), and newly identified marker genes. (D) PF-R (R37G12-Gal4 UAS-V5) neuronal cell bodies labeled with V5, and co-stained with marker genes boxed in (C). (E,F) PF-N (R16D01-Gal4 UAS-V5) neuronal cell bodies labeled with V5, and co-stained with marker genes boxed in (C). (G) PE-N (R12D09-Gal4 UAS-V5) neuronal cell bodies labeled with V5, and co-stained with marker genes boxed in (C). (H) Percentage of marker genes in PE-N and PF-N. Scale bar: 5 μm in all panels.
Figure 9
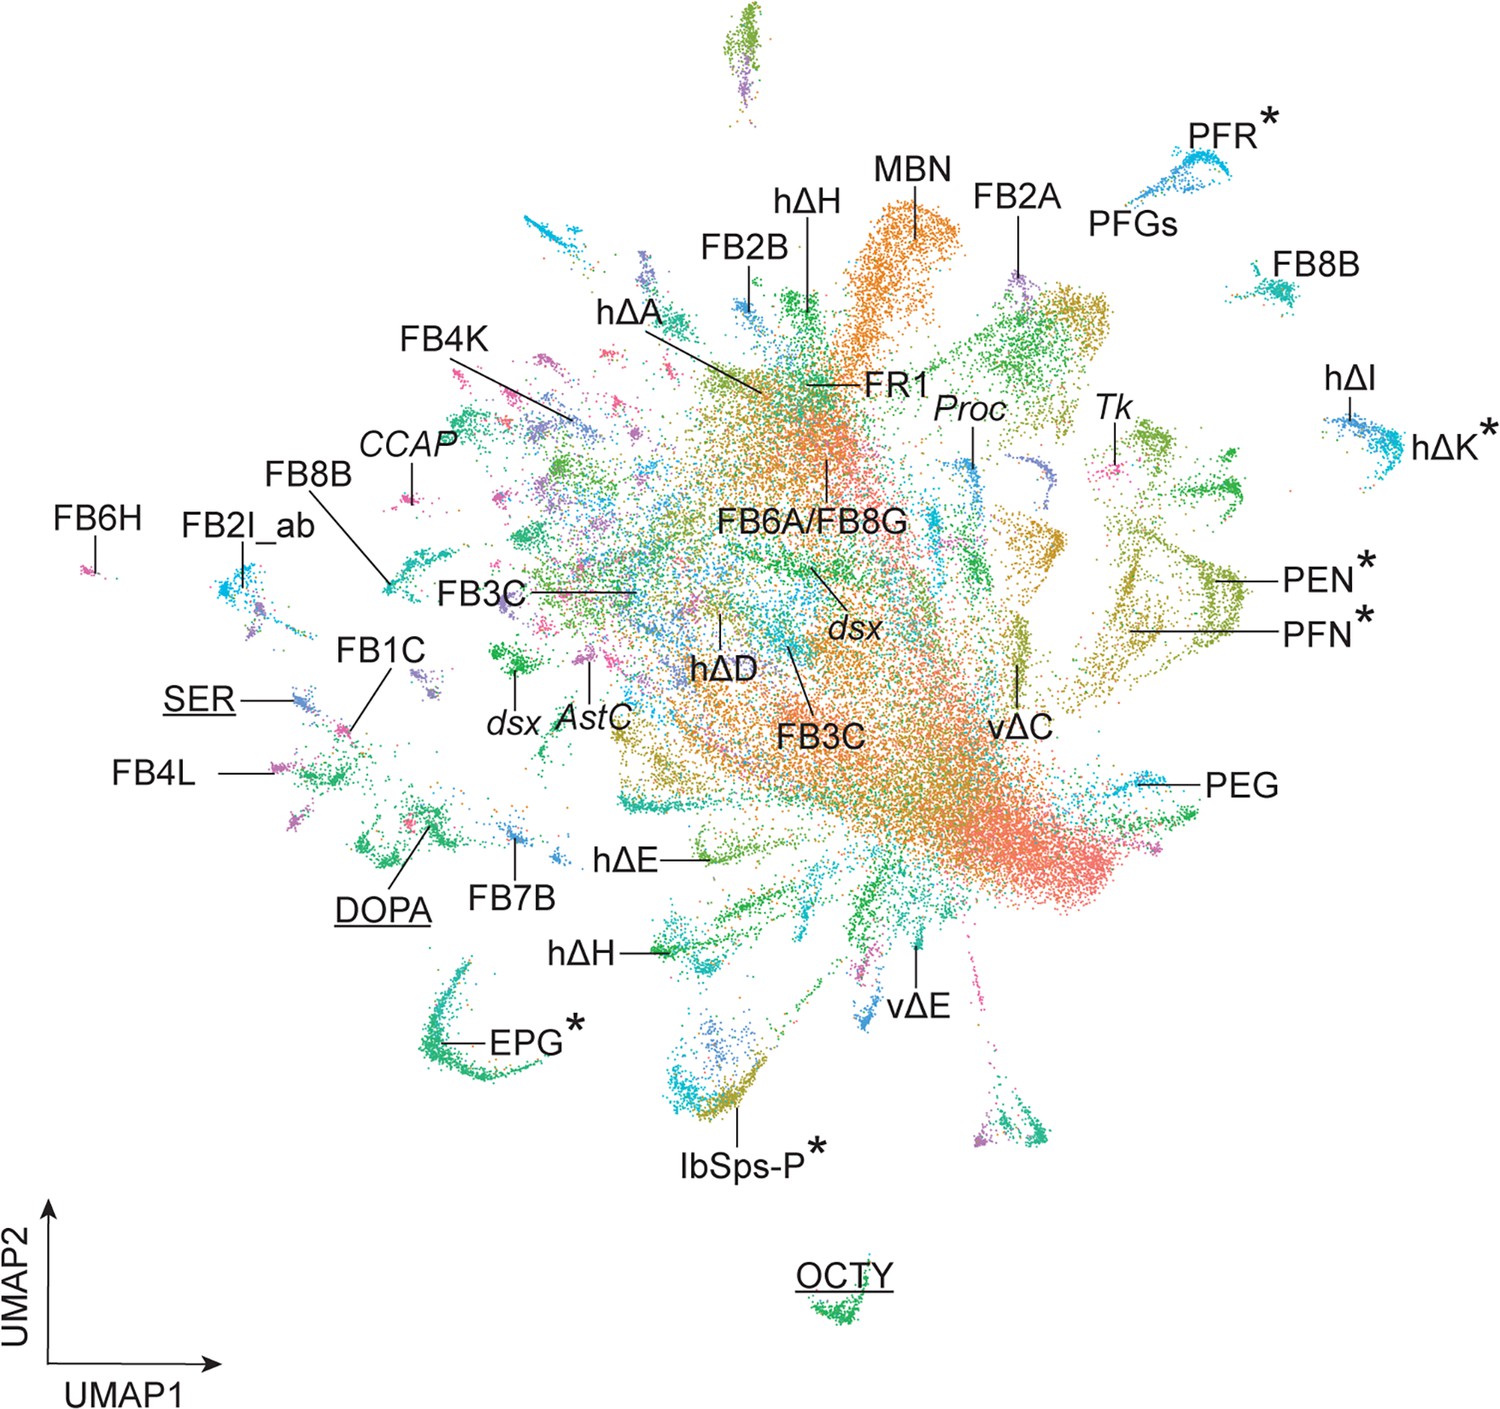
Summary.
Asterisk, known neuron-cluster associations; others are predicted neuron-cluster associations. Underline, neurotransmitter expressing clusters. Abbreviations: AstC, Allatostatin C+ neurons; CCAP, Crustacean cardioactive peptide+ neurons; DOPA, dopaminergic neurons; dsx, doublesex+ neurons; MBN, mushroom body neurons; OCTY, octopaminergic-tyraminergic neurons; Proc, Proctolin + neurons; Tk, Tachykinin+ neurons; SER, serotonergic neurons. E-PG, FB1C, FB2A, FB2B, FB2I_ab, FB3C, FB4K, FB4L, FB6A, FB6H, FB7B, FB8B, FB8G, FR1, hΔA, hΔD, hΔE, hΔH, hΔI, hΔK, lbSps-P, P-EG, P-EN, P-FGs, P-FN, PF-R, vΔC and vΔE are the names of central complex neurons (Hulse et al., 2021).
Videos
Video 1
Rotation of Imaris three-dimensional view of Ms-2A-LexA expression.
Genotype: 20xUAS-flp;worniu-gal4,asense-gal80; lexAop-FRT-stop-FRT-myr::gfp x Ms-2A-LexA.
Video 2
Rotation of Imaris three-dimensional view of NPF-2A-LexA expression.
Genotype: 20xUAS-flp;worniu-gal4,asense-gal80; lexAop-FRT-stop-FRT-myr::gfp x NPF-2A-LexA.
Video 3
Rotation of Imaris three-dimensional view of AstA-2A-LexA expression.
Genotype: 20xUAS-flp;worniu-gal4,asense-gal80; lexAop-FRT-stop-FRT-myr::gfp x AstA-2A-LexA.
Tables
Key resources table
| Reagent type (species) or resource | Designation | Source or reference | Identifiers | Additional information |
|---|---|---|---|---|
| Genetic reagent (Drosophila melanogaster) | 20xUAS-FLPG5.PEST;worniu-gal4,asense- gal80; Act5c(FRT.CD2)gal4 | Syed et al., 2017 | Type II lineage immortalization | |
| Genetic reagent (Drosophila melanogaster) | 20xUAS-FLPG5.PEST;worniu-gal4,asense-gal80; lexAop(FRT.stop)- mCD8:GFP | This work | Label type II derived lexA + cells | |
| Genetic reagent (Drosophila melanogaster) | TI{2A-lexA::GAD}AstA [2A-lexA]/TM3,Sb[1] | BDSC | RRID:BDSC_84356 | |
| Genetic reagent (Drosophila melanogaster) | TI{2A-lexA::GAD}Ms [2A-lexA]/TM3,Sb[1] | BDSC | RRID:BDSC_84403 | |
| Genetic reagent (Drosophila melanogaster) | TI{2A-lexA::GAD}NPF [2A-lexA]/TM3,Sb[1] | BDSC | RRID:BDSC_84422 | |
| Genetic reagent (Drosophila melanogaster) | UAS-RedStinger | BDSC | RRID:BDSC_8545 | |
| Genetic reagent (Drosophila melanogaster) | UAS-unc84-2xGFP | Henry et al., 2012 | ||
| Genetic reagent (Drosophila melanogaster) | GMR12D09-lexA/CyO | BDSC | RRID:BDSC_54419 | P-EN |
| Genetic reagent (Drosophila melanogaster) | GMR16D01-lexA | BDSC | RRID:BDSC_52503 | P-FN |
| Genetic reagent (Drosophila melanogaster) | GMR37G12-lexA | BDSC | RRID:BDSC_52765 | PF-R |
| Genetic reagent (Drosophila melanogaster) | 13xLexAop2-IVS-myr::smGdP-V5 | BDSC | RRID:BDSC_62215 | |
| Antibody | mouse anti-Cut 2B10, monoclonal | DSHB | RRID:AB_528186 | 2 μg/mL |
| Antibody | guinea pig anti-DIP-β, polyclonal | Xu et al., 2024 | 1:300 | |
| Antibody | guinea pig anti-E93, polyclonal | Syed et al., 2017 | 1:500 | |
| Antibody | rabbit anti-Imp, polyclonal | Syed et al., 2017 | 1:500 | |
| Antibody | rabbit anti-Lim1, polyclonal | Desplan, New York University | 1:500 | |
| Antibody | guinea pig anti-Runt, polyclonal | Sullivan et al., 2019 | 1:1000 | |
| Antibody | guinea pig anti-Rx, polyclonal | Desplan, New York University | 1:500 | |
| Antibody | rabbit anti-Syp, polyclonal | Syed et al., 2017 | 1:500 | |
| Antibody | rabbit anti-Toy, polyclonal | Sullivan et al., 2019 | 1:1000 | |
| Antibody | chicken anti-V5, polyclonal | Fortis Life Sciences, Waltham, MA | 1 μg/mL | |
| Antibody | rat anti-Zfh2, olyclonal | Tran et al., 2010 | 1:200 | |
| Antibody | DyLight405, Alexa Fluor 488, Rhodamine Red-X (RRX), or Alexa Fluor 647 conjugated donkey whole IgG, polyclonals | Jackson Immuno Research Laboratories Inc, West Grove, PA | 5 μg/mL | |
| Commercial kit | Evercode WT | Parse Bioscience | ||
| Commercial kit | PIPseq 3’ Single Cell RNA T20 kit | Fluent BioSciences | ||
| Software, algorithm | R Studio | Posit Software | https://posit.co/products/open-source/rstudio/ | |
| Software, algorithm | Seurat | Rahul Satija, New York University | https://satijalab.org/seurat/ | |
| Software, algorithm | ComplexHeatmap | Gu, 2022 | https://github.com/jokergoo/ComplexHeatmap (Gu, 2025) |
Additional files
-
Supplementary file 1
Cluster-defining genes and cell identity of all clusters identified by Seurat function FindAllMarkers.
- https://cdn.elifesciences.org/articles/105896/elife-105896-supp1-v1.csv
-
Supplementary file 2
Marker genes used to identify cell types.
- https://cdn.elifesciences.org/articles/105896/elife-105896-supp2-v1.csv
-
Supplementary file 3
Marker genes used to identify glial cell types.
- https://cdn.elifesciences.org/articles/105896/elife-105896-supp3-v1.csv
-
Supplementary file 4
Cluster-defining genes and glial cell types from all glial clusters identified by Seurat function FindAllMarkers.
- https://cdn.elifesciences.org/articles/105896/elife-105896-supp4-v1.csv
-
Supplementary file 5
Differential expression (DE) analysis of glial marker genes in T1- vs T2-derived glia with Seurat function differential expression testing.
- https://cdn.elifesciences.org/articles/105896/elife-105896-supp5-v1.csv
-
Supplementary file 6
Cluster-defining genes of T1-derived neuronal clusters identified by Seurat function FindAllMarkers.
- https://cdn.elifesciences.org/articles/105896/elife-105896-supp6-v1.csv
-
Supplementary file 7
Cluster-defining genes of T2-derived neuronal clusters identified by Seurat function FindAllMarkers.
- https://cdn.elifesciences.org/articles/105896/elife-105896-supp7-v1.csv
-
Supplementary file 8
Top 10 most enriched genes for each cluster extracted from Supplementary file 6 by scCustomize function Extract_Top_Markers (Marsh, 2024; scCustomize: Custom Visualizations & Functions for Streamlined Analyses of Single Cell Sequencing; https://zenodo.org/records/14529706 RRID:SCR_024675).
- https://cdn.elifesciences.org/articles/105896/elife-105896-supp8-v1.csv
-
Supplementary file 9
Cluster-defining genes of T2-derived glial clusters identified by Seurat function FindAllMarkers.
- https://cdn.elifesciences.org/articles/105896/elife-105896-supp9-v1.csv
-
Supplementary file 10
Differential expression (DE) analysis of all genes in male vs female T2-derived glia with Seurat function differential expression testing.
- https://cdn.elifesciences.org/articles/105896/elife-105896-supp10-v1.csv
-
Supplementary file 11
Differential expression (DE) analysis of all genes in male vs female T2-derived neurons with Seurat function differential expression testing.
- https://cdn.elifesciences.org/articles/105896/elife-105896-supp11-v1.csv
-
Supplementary file 12
Coefficients of expression levels between transcription factors and neuropeptides in each individual nuclei.
- https://cdn.elifesciences.org/articles/105896/elife-105896-supp12-v1.csv
-
Supplementary file 13
Expression profiles of selected genes by antibody staining in central complex neurons and predicted cluster.
- https://cdn.elifesciences.org/articles/105896/elife-105896-supp13-v1.csv
-
Supplementary file 14
Summarized cluster identity of T2-derived neurons.
- https://cdn.elifesciences.org/articles/105896/elife-105896-supp14-v1.csv
-
MDAR checklist
- https://cdn.elifesciences.org/articles/105896/elife-105896-mdarchecklist1-v1.pdf
Download links
A two-part list of links to download the article, or parts of the article, in various formats.
Downloads (link to download the article as PDF)
Open citations (links to open the citations from this article in various online reference manager services)
Cite this article (links to download the citations from this article in formats compatible with various reference manager tools)
Single nuclei RNA-sequencing of adult brain neurons derived from type 2 neuroblasts reveals transcriptional complexity in the insect central complex
eLife 14:RP105896.
https://doi.org/10.7554/eLife.105896.3


