Separable dorsal raphe dopamine projections mimic the facets of a loneliness-like state
- Salk Institute for Biological Studies, United States
- Neurosciences Graduate Program, University of California San Diego, United States
- Howard Hughes Medical Institute, United States
- The Picower Institute for Learning and Memory, Department of Brain and Cognitive Sciences, Massachusetts Institute of Technology, United States
- Kavli Institute for Brain and Mind, United States
Figures
Figure 1 with 2 supplements
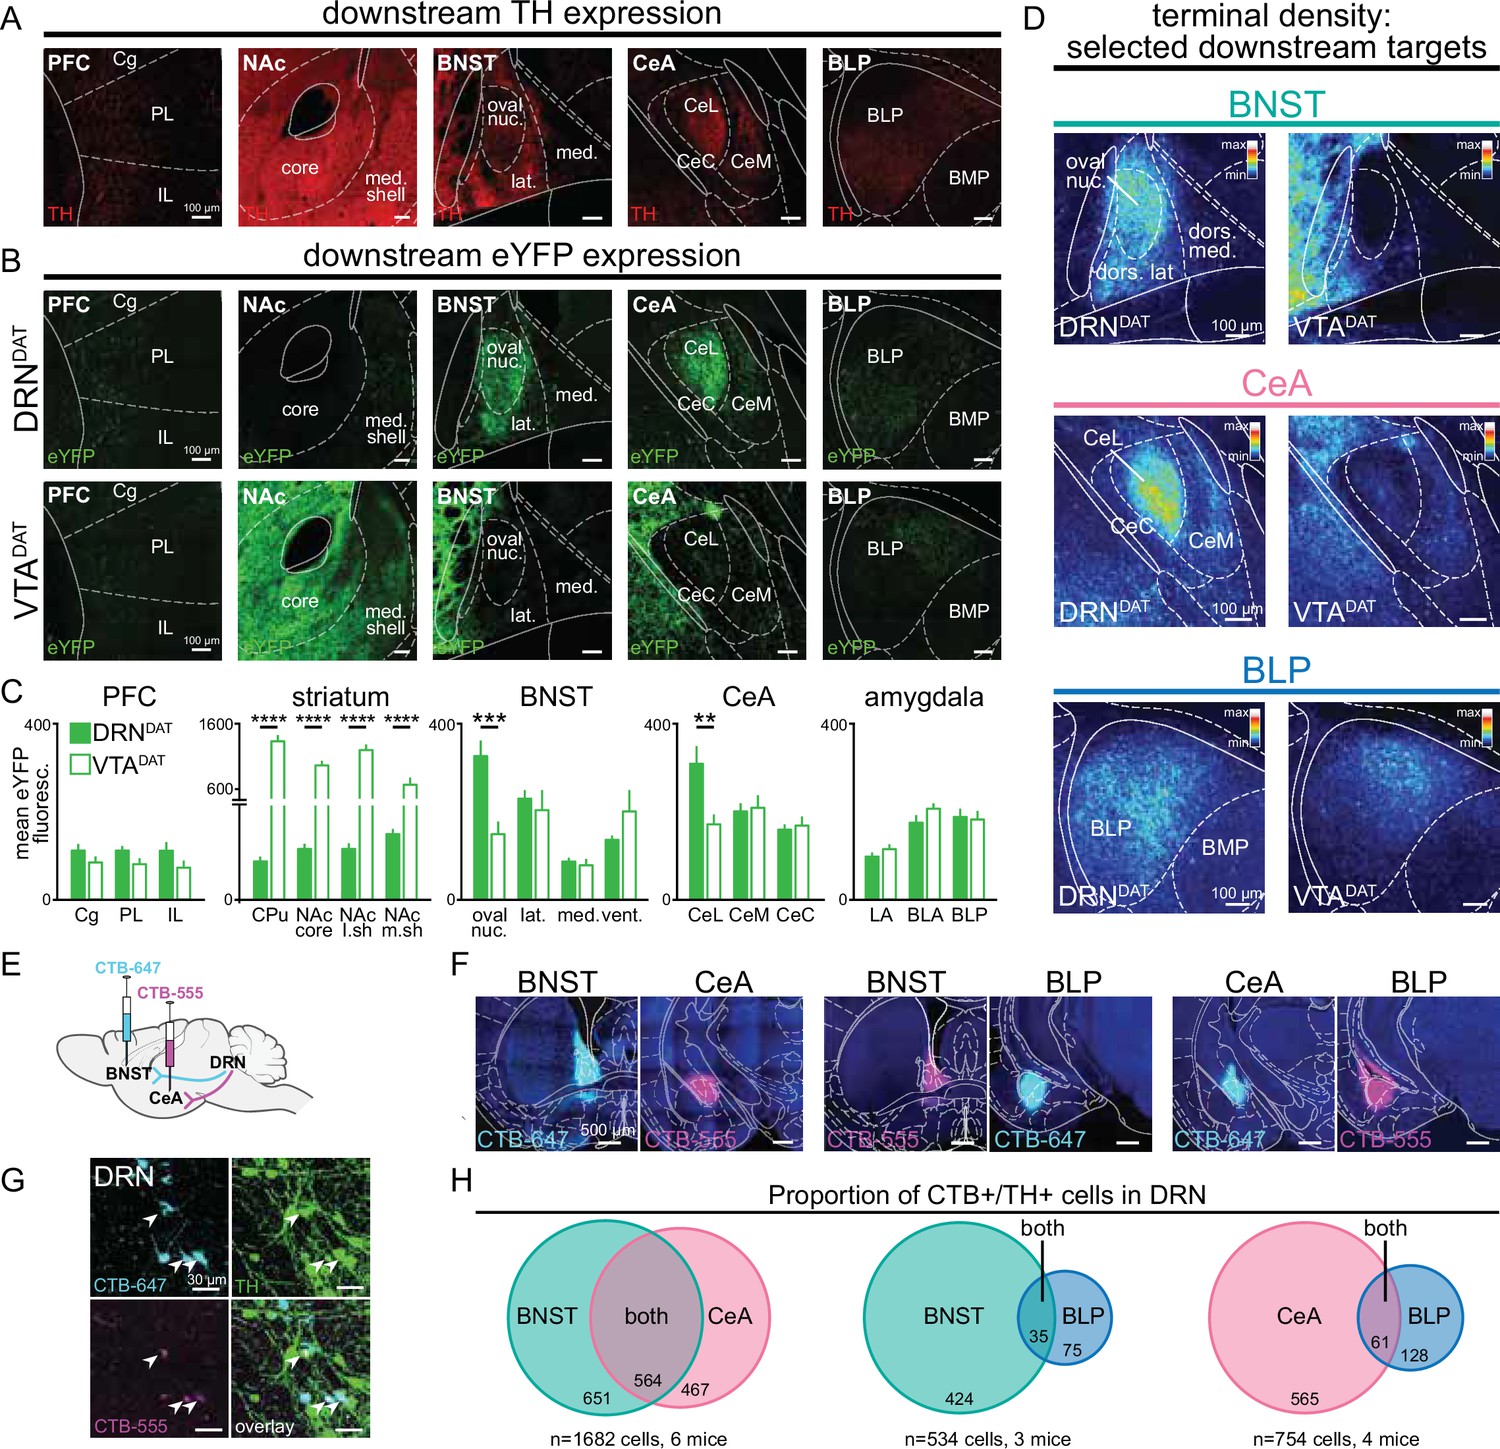
DRNDAT and VTADAT afferents target distinct downstream regions.
(A) Example images of downstream regions showing TH expression from immunohistochemistry. (B) eYFP expression in the prefrontal cortex (PFC), nucleus accumbens (NAc), bed nucleus of the stria terminalis (BNST), central amygdala (CeA), and posterior basolateral amygdala (BLP) following injection into the DRN (upper panels) and the VTA (lower panels). (C) Quantification of mean eYFP fluorescence in subregions from each structure (PFC: n=18 and 14 sections, striatum: n=20 and 21 sections, BNST: n=14 and 13 sections, CeA: n=24 and 27 sections, amygdala: n=45 and 51 sections from DRN and VTA injections, respectively, from 6 mice). eYFP fluorescence was significantly greater following VTA injection in all striatal subregions (unpaired t-test: CPu: t39=13.23, p<0.0001; NAc core: t39=13.56, p<0.0001; NAc lateral shell: t31=13.01, p<0.0001; NAc medial shell: t37=4.49, p<0.0001), and significantly greater following DRN injection in the BNST oval nucleus (unpaired t-test: t22=3.95, p=0.0007) and CeA lateral division (unpaired t-test: t34=3.18, p=0.0031). (D) Images from three selected downstream targets showing average terminal density in the middle anteroposterior (AP) region following eYFP expression in DRNDAT (left) or VTADAT (right) neurons. (E) The retrograde tracer cholera toxin subunit-B (CTB) conjugated to Alexa Fluor 555 (CTB-555, pseudo-colored magenta) or Alexa-Fluor 647 (CTB-647, pseudo-colored cyan) was injected into two downstream targets. (F) Confocal images showing representative injection sites for dual BNST and CeA injections (left panels), BNST and BLP (center panels), and CeA and BLP (right panels). (G) High-magnification images of DRN cells expressing CTB-555 (magenta), CTB-647 (cyan), and TH (green) following injection into the BNST and CeA. White arrows indicate triple-labeled cells. (H) Venn diagrams showing the proportion of CTB+/TH + cells in the DRN following dual injections placed in the BNST and CeA (left), BNST and BLP (center), or CeA and BLP (right). When injections were placed in the BNST and CeA, dual CTB-labeled TH + cells constituted 46% of all BNST projectors and 55% of all CeA projectors. In contrast, when injections were placed in the BNST and BLP, or CeA and BLP, the proportion of dual-labeled cells was considerably lower (7.6% of BNST projectors and 9.7% of CeA projectors). Bar graphs show mean ± SEM. *p<0.05, **p<0.01, ***p<0.001, ****p<0.0001. PFC: Cg = cingulate cortex, PL = prelimbic cortex, IL = infralimbic cortex; striatum: CPu = caudate putamen, NAc core = nucleus accumbens core, NAc l.sh.=nucleus accumbens lateral shell, NAc m.sh.=nucleus accumbens medial shell; BNST: oval nuc.=BNST oval nucleus, lat.=BNST lateral division, med.=BNST medial division, vent.=BNST ventral part; CeL = central amygdala lateral division, CeM = central amygdala medial division, CeC = central amygdala capsular division; amygdala: LA = lateral amygdala, BLA = basolateral amygdala, BLP = basolateral amygdala posterior.
-
Figure 1—source data 1
Mean DRNDAT eYFP fluorescence in downstream regions, as shown in Figure 1C.
- https://cdn.elifesciences.org/articles/105955/elife-105955-fig1-data1-v1.csv
-
Figure 1—source data 2
Colocalization counts of CTB+/TH + cells in the DRN, as shown in Figure 1H.
- https://cdn.elifesciences.org/articles/105955/elife-105955-fig1-data2-v1.csv
Figure 1—figure supplement 1

DRNDAT and VTADAT eYFP virus injection sites.
(A–D) Confocal images at different AP locations through the VTA and DRN showing the typical spread of eYFP expression (green) following an injection of AAV5-DIO-ChR2-eYFP into (A) the DRN and (C) the VTA. Tyrosine hydroxylase (TH; the rate-limiting enzyme in dopamine synthesis) expression from immunohistochemistry is shown in red. (b, d) Insets showing high-magnification images of the substantia nigra pars compacta (SNc), VTA, rostral linear nucleus (RLi), caudal linear nucleus (CLi), and DRN. Viral injection in the DRN typically resulted in eYFP-expressing cells within the DRN, ventrolateral periaqueductal grey (vlPAG), and CLi nuclei, with minimal expression in the RLi, and none in the VTA or substantia nigra pars compacta (SNc). In contrast, viral injection in the VTA produced robust eYFP expression in SNc and VTA cell bodies, with some RLi expression and none in the CLi, vlPAG, or DRN.
Figure 1—figure supplement 2

Verification of dual-retrograde tracing strategy and intersectional approach to reveal axon collaterals.
(A) Two retrograde tracers (CTB-555 and CTB-647) were injected into the same location, followed by sectioning and immunohistochemistry after 7 days. Right panels show example injection site for CTB-555 and CTB-647 in the BNST. (B) CTB-expressing cells in the DRN with TH (green) revealed by immunohistochemistry. White arrows indicate triple-labeled cells. (C) Within the TH + cells in the DRN, injection of both retrograde tracers into the same location resulted in 97% CTB-647 + cells co-labeled with CTB-555, and 100% CTB-555 + cells co-labeled with CTB-647. (D) Heatmaps indicating the relative density of TH + CTB + cells throughout the DRN/CLi for each projector population and (E) dual-labeled cells. Color intensity represents average number of cells per slice. The total number of TH +BNST and CeA projectors per slice was similar (n=27.9 BNST projectors and n=27.2 CeA projectors per slice), whereas TH + BLP projectors were significantly fewer in number (n=6.4 BLP projectors per slice; Kruskal-Wallis statistic = 83.5, p<0.0001; Dunn’s post hoc tests: BNST vs. CeA p>0.05, BNST vs BLP p<0.001, CeA vs BLP p<0.001). TH + BNST and CeA projectors, and dual-labeled cells, were broadly distributed throughout the DRN, vlPAG, and CLi, with a higher concentration in the dorsal aspect of the DRN, whereas BLP projectors tended to be relatively denser in ventral DRN/CLi. (F) Injection strategy to enable eYFP expression selectively in the DRNDAT-CeA projection. A retrogradely traveling HSV construct encoding mCherry-flpo, expressed in a Cre-dependent manner (HSV-LS1L-mCherry-IRES-flpo), was injected into the CeA of a DAT::Cre mouse, and an AAV, expressed in a flpo-dependent manner, encoding eYFP (AAV5-fDIO-eYFP) was injected into the DRN. (G) After 7 weeks, this resulted in eYFP-expressing TH + cells in the DRN, and (H) eYFP-expressing processes in both the CeA (upper panels) and BNST (lower panels). (I) Injection of only AAV5-fDIO-eYFP into the DRN of a DAT::Cre mouse did not result in eYFP expression.
-
Figure 1—figure supplement 2—source data 1
Colocalization counts of CTB+/TH + cells in the DRN, as shown in Figure 1—figure supplement 2C.
- https://cdn.elifesciences.org/articles/105955/elife-105955-fig1-figsupp2-data1-v1.csv
Figure 2 with 2 supplements
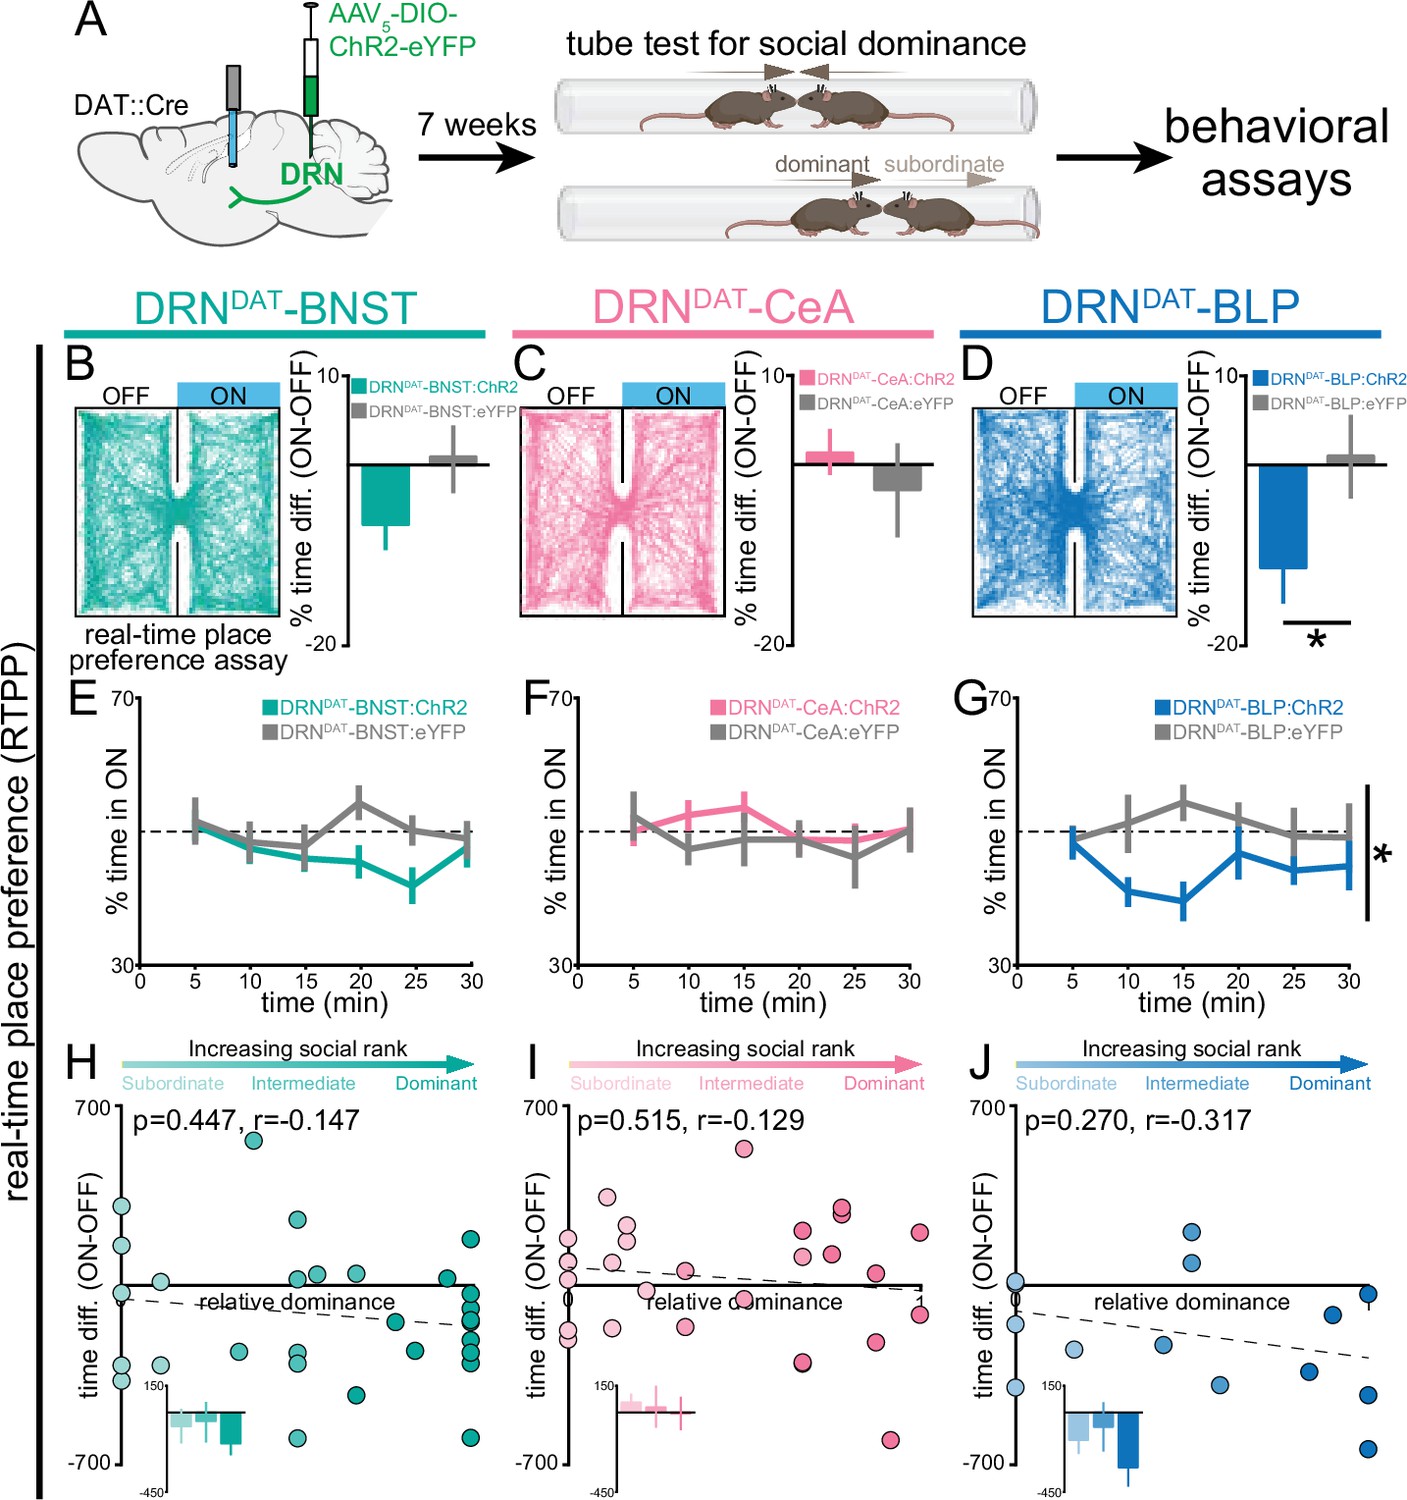
DRNDAT-BLP (but not DRNDAT-BNST or DRNDAT-CeA) photostimulation promotes place avoidance.
(A) AAV5-DIO-ChR2-eYFP or AAV5-DIO-eYFP was injected into the DRN of DAT::Cre mice and optic fibers implanted over the BNST, CeA, or BLP to photostimulate DRNDAT terminals. After >7 weeks, viral expression cages of mice were assayed for social dominance using the tube test, prior to other behavioral tasks. (B–D) Left panels: example tracks of DRNDAT-BNST:ChR2, DRNDAT-CeA:ChR2, and DRNDAT-BLP:ChR2 mice in the real-time place preference (RTPP) assay. Right panels: bar graphs showing the difference in % time spent in the stimulated (‘ON’) and unstimulated (‘OFF’) zones. There were no significant RTPP differences detected in (B) DRNDAT-BNST:ChR2 (DRNDAT-BNST:ChR2: N=29 mice, DRNDAT-BNST:eYFP: N=14 mice; unpaired t-test: t41=1.44, p=0.156) and (C) DRNDAT-CeA:ChR2 mice (DRNDAT-CeA:ChR2: N=28 mice, DRNDAT-CeA:eYFP: N=13 mice; unpaired t-test: t39=0.828, p=0.413) compared to their respective eYFP control mice groups. However, (D) DRNDAT-BLP:ChR2 mice spent proportionally less time in the stimulated zone relative to DRNDAT-BLP:eYFP mice (DRNDAT-BLP:ChR2: N=14 mice, DRNDAT-BLP:eYFP: N=8 mice; unpaired t-test: t20=2.13, p=0.0455). (E–G) Time spent in the ON zone across the 30 min session. (G) DRNDAT-BLP:ChR2 mice spent significantly less time in the ON zone relative to DRNDAT-BLP:eYFP mice (DRNDAT-BLP:ChR2: N=14 mice, DRNDAT-BLP:eYFP: N=8 mice; repeated measures two-way ANOVA: F1,20 = 4.53, main effect of opsin p=0.046). (H–J) Scatter plots showing relative dominance plotted against the difference in zone time (insets show mean values for subordinate, intermediate, and dominant mice) for (H) DRNDAT-BNST, (I) DRNDAT-CeA, or (J) DRNDAT-BLP mice. Bar and line graphs display mean ± SEM. *p<0.05.
-
Figure 2—source data 1
DRNDAT-BNST:ChR2 RTPP percent time difference (ON-OFF), as shown in Figure 2B.
- https://cdn.elifesciences.org/articles/105955/elife-105955-fig2-data1-v1.csv
-
Figure 2—source data 2
DRNDAT-CeA:ChR2 RTPP percent time difference (ON-OFF), as shown in Figure 2C.
- https://cdn.elifesciences.org/articles/105955/elife-105955-fig2-data2-v1.csv
-
Figure 2—source data 3
DRNDAT-BLP:ChR2 RTPP percent time difference (ON-OFF), as shown in Figure 2D.
- https://cdn.elifesciences.org/articles/105955/elife-105955-fig2-data3-v1.csv
-
Figure 2—source data 4
DRNDAT-BNST:ChR2 RTPP percent time in ON (binned), as shown in Figure 2E.
- https://cdn.elifesciences.org/articles/105955/elife-105955-fig2-data4-v1.csv
-
Figure 2—source data 5
DRNDAT-CeA:ChR2 RTPP percent time in ON (binned), as shown in Figure 2F.
- https://cdn.elifesciences.org/articles/105955/elife-105955-fig2-data5-v1.csv
-
Figure 2—source data 6
DRNDAT-BLP:ChR2 RTPP percent time in ON (binned), as shown in Figure 2G.
- https://cdn.elifesciences.org/articles/105955/elife-105955-fig2-data6-v1.csv
-
Figure 2—source data 7
DRNDAT-BNST:ChR2 RTPP percent time difference (ON-OFF) x relative dominance, as shown in Figure 2H.
- https://cdn.elifesciences.org/articles/105955/elife-105955-fig2-data7-v1.csv
-
Figure 2—source data 8
DRNDAT-CeA:ChR2 RTPP percent time difference (ON-OFF) x relative dominance, as shown in Figure 2I.
- https://cdn.elifesciences.org/articles/105955/elife-105955-fig2-data8-v1.csv
-
Figure 2—source data 9
DRNDAT-BLP:ChR2 RTPP percent time difference (ON-OFF) x relative dominance, as shown in Figure 2J.
- https://cdn.elifesciences.org/articles/105955/elife-105955-fig2-data9-v1.csv
Figure 2—figure supplement 1

Fiber placement in DRNDAT downstream regions and stability of social dominance within cages.
(A–C) Example confocal images showing ChR2-expressing DRNDAT terminals in (A) the BNST, (B) CeA, and (C) BLP. (D–F) Fiber placement over (D) the BNST, (E) CeA, and (F) BLP. Colored lines indicate ChR2 subjects, whereas gray colored lines indicate eYFP subjects. Lighter shade lines indicate unilateral implants, whereas darker shade lines indicate bilateral implants. (G) The tube test for social dominance was performed prior to optogenetic manipulations. (H) Proportion of wins for an individual cage tested across 4 days, and average for all cages used in optogenetic manipulation experiments, separated by number of mice per cage (red = dominant, orange = intermediate, yellow = subordinate). Graphs show mean ± SEM.
-
Figure 2—figure supplement 1—source data 1
Social rank stability, as shown in Figure 2—figure supplement 1H.
- https://cdn.elifesciences.org/articles/105955/elife-105955-fig2-figsupp1-data1-v1.csv
Figure 2—figure supplement 2

Photostimulation of DRNDAT projections does not modify operant intra-cranial self-stimulation behavior.
(A–C) Photostimulation of (A) the DRNDAT-BNST, (B) DRNDAT-CeA, or (C) DRNDAT-BLP projection did not support intra-cranial self-stimulation (ICSS) as shown by a lack of preference for the active nosepoke (paired with blue light delivery) over the inactive nosepoke (unpaired t-test: DRNDAT-BNST: DRNDAT-BNST:ChR2: N=28 mice, DRNDAT-BNST:eYFP: N=16 mice; t42=0.225, p=0.823; DRNDAT-CeA: DRNDAT-CeA:ChR2: N=26 mice, DRNDAT-CeA:eYFP: N=17 mice; t41=0.225, p=0.823; DRNDAT-BLP: DRNDAT-BLP:ChR2: N=14 mice, DRNDAT-BLP:eYFP: N=8 mice; t20=0.152, p=0.881).
-
Figure 2—figure supplement 2—source data 1
DRNDAT-BNST:ChR2 ICSS number of nose pokes, as shown in Figure 2—figure supplement 2A.
- https://cdn.elifesciences.org/articles/105955/elife-105955-fig2-figsupp2-data1-v1.csv
-
Figure 2—figure supplement 2—source data 2
DRNDAT-CeA:ChR2 ICSS number of nose pokes, as shown in Figure 2—figure supplement 2B.
- https://cdn.elifesciences.org/articles/105955/elife-105955-fig2-figsupp2-data2-v1.csv
-
Figure 2—figure supplement 2—source data 3
DRNDAT-BLP:ChR2 ICSS number of nose pokes, as shown in Figure 2—figure supplement 2C.
- https://cdn.elifesciences.org/articles/105955/elife-105955-fig2-figsupp2-data3-v1.csv
Figure 3 with 1 supplement
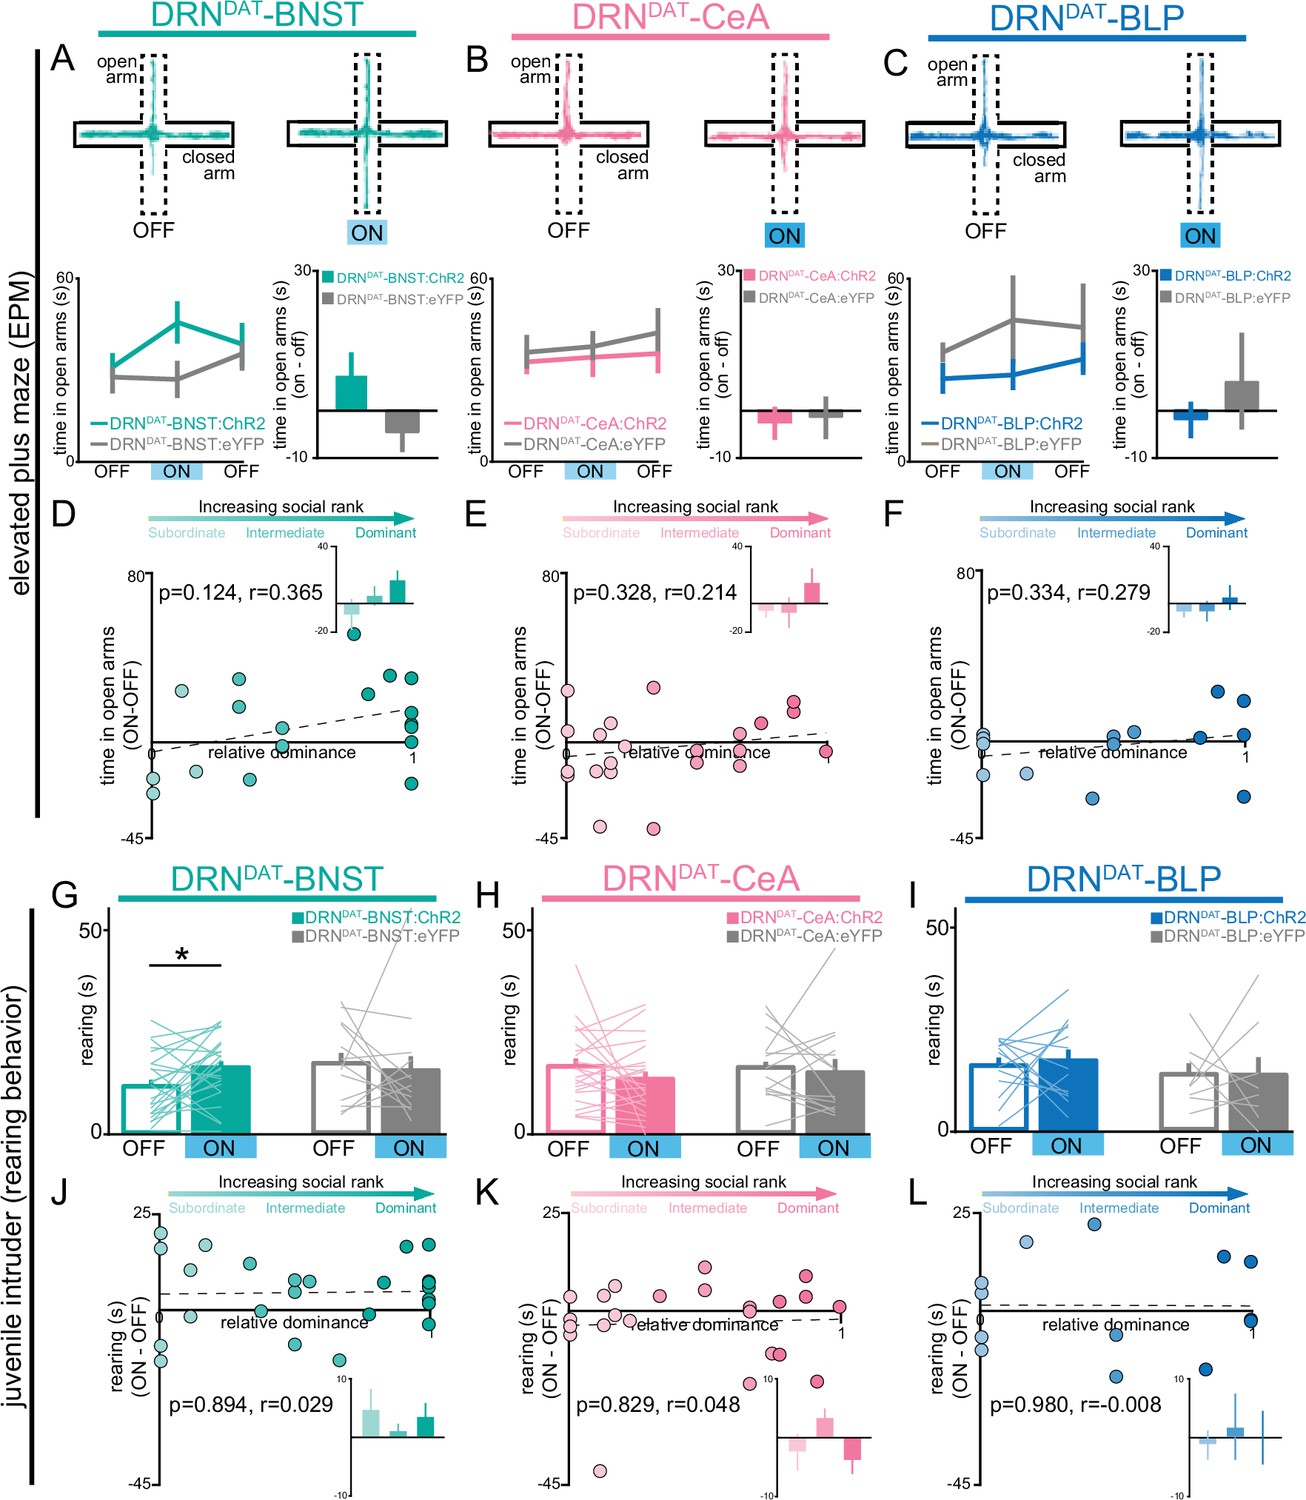
DRNDAT-BNST (but not DRNDAT-CeA or DRNDAT-BLP) photostimulation promotes non-social exploratory behavior.
(A–C) Left panels: example tracks in the elevated plus maze (EPM) from a (A) DRNDAT-BNST:ChR2, (B), DRNDAT-CeA:ChR2, and (C), DRNDAT-BLP:ChR2 mouse. Upper right panels: time spent in the open arms of the EPM across the 15 min session. Photostimulation had no significant effect on time spent in the open arms of the EPM (two-way ANOVA, light x group interaction, BNST – F2,50=2.008, p=0.145, CeA – F2,72=0.118, p=0.889, BLP – F2,40=0.354, p=0.704) for (A) DRNDAT-BNST, (B), DRNDAT-CeA, or (C) DRNDAT-BLP mice. Bottom right panels: difference in time spent in open arms of the EPM between the stimulation ON and first OFF epochs. Photostimulation had no significant effect on time spent in the open arms of the EPM for (A) DRNDAT-BNST (DRNDAT-BNST:ChR2: N=19 mice, DRNDAT-BNST:eYFP: N=10 mice; unpaired t-test: t27=1.39, p=0.177), (B) DRNDAT-CeA (DRNDAT-CeA:ChR2: N=23 mice, DRNDAT-CeA:eYFP: N=14 mice; unpaired t-test: t35=0.639, p=0.527), or (C) DRNDAT-BLP mice (DRNDAT-BLP:ChR2: N=14 mice, DRNDAT-BLP:eYFP: N=8 mice; unpaired t-test: t20=0.759, p=0.457). (D–F) Scatter plots showing relative dominance plotted against the difference in the open arm zone time (insets show mean values for subordinate, intermediate, and dominant mice) for (D) DRNDAT-BNST, (E) DRNDAT-CeA, or (F) DRNDAT-BLP mice. (G–I) Home-cage behavior was assessed in the juvenile intruder assay across two counterbalanced sessions, one paired with photostimulation (‘ON’) and one without (‘OFF’) for (G) DRNDAT-BNST, (H) DRNDAT-CeA, or (I) DRNDAT-BLP mice. DRNDAT-BNST photostimulation increased time spent rearing (DRNDAT-BNST:ChR2: N=24 mice, DRNDAT-BNST:eYFP: N=13 mice; paired t-test: t23=2.32, p=0.0298), but DRNDAT-CeA and DRNDAT-BLP photostimulation did not. (J–L) Scatter plots showing relative dominance plotted against the difference in rearing time with optical stimulation (ON-OFF) (insets show mean values for subordinate, intermediate, and dominant mice) for (J) DRNDAT-BNST, (K) DRNDAT-CeA, or (L) DRNDAT-BLP mice. Bar and line graphs display mean ± SEM. *p<0.05.
-
Figure 3—source data 1
DRNDAT-BNST:ChR2 EPM open arm time (binned), as shown in Figure 3A.
- https://cdn.elifesciences.org/articles/105955/elife-105955-fig3-data1-v1.csv
-
Figure 3—source data 2
DRNDAT-CeA:ChR2 EPM open arm time (binned), as shown in Figure 3B.
- https://cdn.elifesciences.org/articles/105955/elife-105955-fig3-data2-v1.csv
-
Figure 3—source data 3
DRNDAT-BLP:ChR2 EPM open arm time (binned), as shown in Figure 3C.
- https://cdn.elifesciences.org/articles/105955/elife-105955-fig3-data3-v1.csv
-
Figure 3—source data 4
DRNDAT-BNST:ChR2 EPM open arm time (ON-OFF) x relative dominance, as shown in Figure 3D.
- https://cdn.elifesciences.org/articles/105955/elife-105955-fig3-data4-v1.csv
-
Figure 3—source data 5
DRNDAT-CeA:ChR2 EPM open arm time (ON-OFF) x relative dominance, as shown in Figure 3E.
- https://cdn.elifesciences.org/articles/105955/elife-105955-fig3-data5-v1.csv
-
Figure 3—source data 6
DRNDAT-BLP:ChR2 EPM open arm time (ON-OFF) x relative dominance, as shown in Figure 3F.
- https://cdn.elifesciences.org/articles/105955/elife-105955-fig3-data6-v1.csv
-
Figure 3—source data 7
DRNDAT-BNST:ChR2 juvenile intruder time spent rearing, as shown in Figure 3G.
- https://cdn.elifesciences.org/articles/105955/elife-105955-fig3-data7-v1.csv
-
Figure 3—source data 8
DRNDAT-CeA:ChR2 juvenile intruder time spent rearing, as shown in Figure 3H.
- https://cdn.elifesciences.org/articles/105955/elife-105955-fig3-data8-v1.csv
-
Figure 3—source data 9
DRNDAT-BLP:ChR2 juvenile intruder time spent rearing, as shown in Figure 3I.
- https://cdn.elifesciences.org/articles/105955/elife-105955-fig3-data9-v1.csv
-
Figure 3—source data 10
DRNDAT-BNST:ChR2 juvenile intruder time spent rearing (ON-OFF) x relative dominance, as shown in Figure 3J.
- https://cdn.elifesciences.org/articles/105955/elife-105955-fig3-data10-v1.csv
-
Figure 3—source data 11
DRNDAT-CeA:ChR2 juvenile intruder time spent rearing (ON-OFF) x relative dominance, as shown in Figure 3K.
- https://cdn.elifesciences.org/articles/105955/elife-105955-fig3-data11-v1.csv
-
Figure 3—source data 12
DRNDAT-BLP:ChR2 juvenile intruder time spent rearing (ON-OFF) x relative dominance, as shown in Figure 3L.
- https://cdn.elifesciences.org/articles/105955/elife-105955-fig3-data12-v1.csv
Figure 3—figure supplement 1

Photostimulation of DRNDAT projections does not modify locomotor or anxiety-like behavior.
(A–C) Example tracks in the open field test from a (A) DRNDAT-BNST:ChR2, (B) DRNDAT-CeA:ChR2, and (C) DRNDAT-BLP:ChR2 mouse. Photostimulation had no significant effect on time spent in the center of the open field (two-way ANOVA, light x group interaction, BNST – F2,90=0.2105, p=0.811; CeA – F2,92=0.528, p=0.592; BLP – F2,40=0.181, p=0.835) or distance traveled (two-way RM ANOVA, light x group interaction, BNST – F2,90=0.209, p=0.812; CeA – F2,92=0.108, p=0.898; BLP – F2,40=0.252, p=0.771) for DRNDAT-BNST, DRNDAT-CeA, or DRNDAT-BLP mice. Line and bar graphs show mean ± SEM.
-
Figure 3—figure supplement 1—source data 1
DRNDAT-All projections:ChR2 OFT time in center, as shown in Figure 3—figure supplement 1A–C.
- https://cdn.elifesciences.org/articles/105955/elife-105955-fig3-figsupp1-data1-v1.csv
-
Figure 3—figure supplement 1—source data 2
DRNDAT-All projections:ChR2 OFT distance traveled, as shown in Figure 3—figure supplement 1A–C.
- https://cdn.elifesciences.org/articles/105955/elife-105955-fig3-figsupp1-data2-v1.csv
Figure 4 with 2 supplements
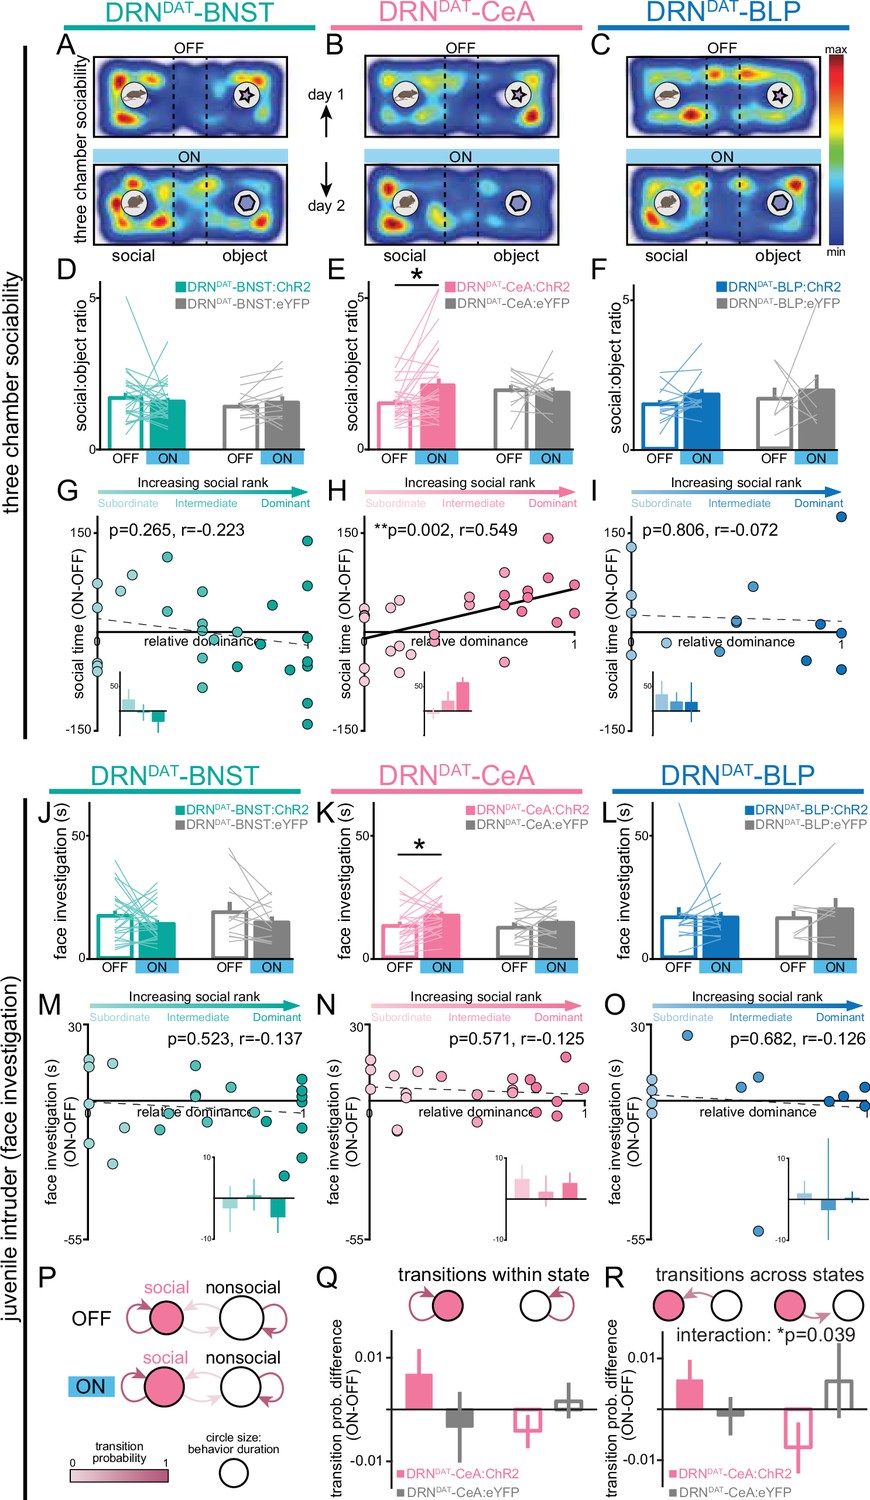
DRNDAT-CeA (but not DRNDAT-BNST or DRNDAT-BLP) photostimulation promotes sociability in a rank-dependent manner.
(A–C) Heatmaps showing the relative location of ChR2-expressing mice in the three-chamber sociability assay, with optic fibers located over the (A) BNST, (B) CeA, or (C) BLP. The task was repeated across 2 days, with one session paired with photostimulation (‘ON’) and one without (‘OFF’). (D–F) Bar graphs showing social preference in three-chamber sociability assay. (D) Photostimulation of DRNDAT-BNST terminals (8 pulses of 5ms pulse-width 473 nm light, delivered at 30 Hz every 5 s) in ChR2-expressing mice (DRNDAT-BNST:ChR2) had no significant effect on time spent in the social zone relative to the object zone (DRNDAT-BNST:ChR2: N=27 mice, DRNDAT-BNST:eYFP: N=14 mice; ‘social:object ratio’; paired t-test: t26=0.552, p=0.586), (E) but increased social:object ratio for DRNDAT-CeA:ChR2 mice (DRNDAT-CeA:ChR2: N=29 mice, DRNDAT-CeA:eYFP: N=13 mice; paired t-test: t28=2.91; corrected for multiple comparisons: p=0.021) (F) and had no significant effect for DRNDAT-BLP:ChR2 mice (DRNDAT-BLP:ChR2: N=14 mice, DRNDAT-BLP:eYFP: N=7 mice; paired t-test: t13=1.62, p=0.130). (G–I) Scatter plots displaying relative dominance plotted against the change in social zone time with optical stimulation (ON-OFF) for (G) DRNDAT-BNST, (H) DRNDAT-CeA, or (I) DRNDAT-BLP mice, showing significant positive correlation in DRNDAT-CeA:ChR2 mice (Pearson’s correlation: r=0.549, p=0.002, N=29 mice). Inset bar graphs show mean values for subordinate, intermediate, and dominant mice. (J–L) Home-cage behavior was assessed in the juvenile intruder assay across two counterbalanced sessions, one paired with photostimulation (‘ON’) and one without (‘OFF’) for (J) DRNDAT-BNST, (K) DRNDAT-CeA, or (L) DRNDAT-BLP mice. DRNDAT-CeA photostimulation in ChR2-expressing mice increased time spent engaged in face investigation with the juvenile mouse (DRNDAT-CeA:ChR2: N=22 mice, DRNDAT-CeA:eYFP: N=14 mice; paired t-test: t22=2.36, p=0.027). (M–O) Scatter plots showing relative dominance plotted against the difference in face investigation time with optical stimulation (ON-OFF) (insets show mean values for subordinate, intermediate, and dominant mice) for (M) DRNDAT-BNST, (N) DRNDAT-CeA, or (O) DRNDAT-BLP mice. (P) A two-state Markov model was used to examine behavioral transitions during the juvenile intruder assay for DRNDAT-CeA mice. (Q, R) Bar graphs showing the difference in transition probability (ON-OFF) for (Q) within-state transitions and (R) across-state transitions, for DRNDAT-CeA:ChR2 and DRNDAT-CeA:eYFP mice. There was no significant difference between ChR2 and eYFP groups for the change in within-state transition probability (DRNDAT-CeA:ChR2: N=22 mice, DRNDAT-CeA:eYFP: N=14 mice; two-way ANOVA: opsin x transition interaction, F1,68=3.385, p=0.0702), (R) but there was a significant interaction between opsin and across-state transition probability (DRNDAT-CeA:ChR2: N=22 mice, DRNDAT-CeA:eYFP: N=14 mice; two-way ANOVA: opsin x transition interaction, F1,68=4.452, p=0.0385) with photostimulation. Bar and line graphs display mean ± SEM. *p<0.05, **p<0.01.
-
Figure 4—source data 1
DRNDAT-BNST:ChR2 three-chamber social:object ratio, as shown in Figure 4D.
- https://cdn.elifesciences.org/articles/105955/elife-105955-fig4-data1-v1.csv
-
Figure 4—source data 2
DRNDAT-CeA:ChR2 three-chamber social:object ratio, as shown in Figure 4E.
- https://cdn.elifesciences.org/articles/105955/elife-105955-fig4-data2-v1.csv
-
Figure 4—source data 3
DRNDAT-BLP:ChR2 three-chamber social:object ratio, as shown in Figure 4F.
- https://cdn.elifesciences.org/articles/105955/elife-105955-fig4-data3-v1.csv
-
Figure 4—source data 4
DRNDAT-BNST:ChR2 time spent in social zone (ON-OFF) x relative dominance, as shown in Figure 4G.
- https://cdn.elifesciences.org/articles/105955/elife-105955-fig4-data4-v1.csv
-
Figure 4—source data 5
DRNDAT-CeA:ChR2 time spent in social zone (ON-OFF) x relative dominance, as shown in Figure 4H.
- https://cdn.elifesciences.org/articles/105955/elife-105955-fig4-data5-v1.csv
-
Figure 4—source data 6
DRNDAT-BLP:ChR2 time spent in social zone (ON-OFF) x relative dominance, as shown in Figure 4I.
- https://cdn.elifesciences.org/articles/105955/elife-105955-fig4-data6-v1.csv
-
Figure 4—source data 7
DRNDAT-BNST:ChR2 juvenile intruder time spent in face investigation, as shown in Figure 4J.
- https://cdn.elifesciences.org/articles/105955/elife-105955-fig4-data7-v1.csv
-
Figure 4—source data 8
DRNDAT-CeA:ChR2 juvenile intruder time spent in face investigation, as shown in Figure 4K.
- https://cdn.elifesciences.org/articles/105955/elife-105955-fig4-data8-v1.csv
-
Figure 4—source data 9
DRNDAT-BLP:ChR2 juvenile intruder time spent in face investigation, as shown in Figure 4L.
- https://cdn.elifesciences.org/articles/105955/elife-105955-fig4-data9-v1.csv
-
Figure 4—source data 10
DRNDAT-BNST:ChR2 juvenile intruder time spent in face investigation (ON-OFF) x relative dominance, as shown in Figure 4M.
- https://cdn.elifesciences.org/articles/105955/elife-105955-fig4-data10-v1.csv
-
Figure 4—source data 11
DRNDAT-CeA:ChR2 juvenile intruder time spent in face investigation (ON-OFF) x relative dominance, as shown in Figure 4N.
- https://cdn.elifesciences.org/articles/105955/elife-105955-fig4-data11-v1.csv
-
Figure 4—source data 12
DRNDAT-BLP:ChR2 juvenile intruder time spent in face investigation (ON-OFF) x relative dominance, as shown in Figure 4O.
- https://cdn.elifesciences.org/articles/105955/elife-105955-fig4-data12-v1.csv
-
Figure 4—source data 13
DRNDAT-CeA:ChR2 juvenile intruder markov model (transition within state), as shown in Figure 4Q.
- https://cdn.elifesciences.org/articles/105955/elife-105955-fig4-data13-v1.csv
-
Figure 4—source data 14
DRNDAT-CeA:ChR2 juvenile intruder markov model (transition across states), as shown in Figure 4R.
- https://cdn.elifesciences.org/articles/105955/elife-105955-fig4-data14-v1.csv
Figure 4—figure supplement 1

Photostimulation of DRNDAT terminals in CeA (but not in BNST or BLP) increases time spent in three-chamber social zone.
(A–C) Bar graphs showing time spent in the social zone of the three chamber apparatus. (A) Photostimulation of DRNDAT-BNST terminals (8 pulses of 5ms pulse-width 473 nm light, delivered at 30 Hz every 5 s) in ChR2-expressing mice (DRNDAT-BNST:ChR2) had no significant effect on time spent in the social zone (DRNDAT-BNST:ChR2: N=27 mice, DRNDAT-BNST:eYFP: N=14 mice; ‘social:object ratio’; paired t-test: t26=0.165; corrected for multiple comparisons: p>0.999) (B) but increased time spent in the social zone for DRNDAT-CeA:ChR2 mice (DRNDAT-CeA:ChR2: N=29 mice, DRNDAT-CeA:eYFP: N=13 mice; paired t-test: t28=2.88; corrected for multiple comparisons: p=0.015) (C) and had no significant effect for DRNDAT-BLP:ChR2 mice (DRNDAT-BLP:ChR2: N=14 mice, DRNDAT-BLP:eYFP: N=7 mice; paired t-test: t13=1.92; corrected for multiple comparisons: p=0.154).
-
Figure 4—figure supplement 1—source data 1
DRNDAT-BNST:ChR2 three-chamber social zone time, as shown in Figure 4—figure supplement 1A.
- https://cdn.elifesciences.org/articles/105955/elife-105955-fig4-figsupp1-data1-v1.csv
-
Figure 4—figure supplement 1—source data 2
DRNDAT-CeA:ChR2 three-chamber social zone time, as shown in Figure 4—figure supplement 1B.
- https://cdn.elifesciences.org/articles/105955/elife-105955-fig4-figsupp1-data2-v1.csv
-
Figure 4—figure supplement 1—source data 3
DRNDAT-BLP:ChR2 three-chamber social zone time, as shown in Figure 4—figure supplement 1C.
- https://cdn.elifesciences.org/articles/105955/elife-105955-fig4-figsupp1-data3-v1.csv
Figure 4—figure supplement 2

Photostimulation of DRNDAT projections effects on juvenile behavior, and analysis of baseline behavioral traits.
(A–C) Scatter plots displaying the change in face investigation against the change in rearing with photostimulation (ON-OFF) for (A) DRNDAT-BNST:ChR2, (B) DRNDAT-CeA:ChR2, (C) and DRNDAT-BLP:ChR2 mice in the juvenile intruder assay. Outer plots are probability density curves, using kernel density estimation, to show the distribution of each behavior. (D) Correlation matrix indicating the relationship between baseline behavioral measures for all mice used in Figures 2—4 and associated supplement figures. For the open field test (OFT) and elevated-plus maze (EPM), the first 5 min of the task were used, and for the juvenile intruder and three-chamber assays, the data from the ‘OFF’ session was used. (E) Principal component analysis (PCA) of behavioral measures with point color representing the social dominance score for each animal. Inset, screen plot showing % variance explained by the first 5 PCs. Line and bar graphs show mean ± SEM.
-
Figure 4—figure supplement 2—source data 1
DRNDAT-BNST:ChR2 juvenile intruder rearing time x face investigation time (ON-OFF), as shown in Figure 4—figure supplement 2A.
- https://cdn.elifesciences.org/articles/105955/elife-105955-fig4-figsupp2-data1-v1.csv
-
Figure 4—figure supplement 2—source data 2
DRNDAT-BNST:ChR2 juvenile intruder rearing time x face investigation time (ON-OFF), as shown in Figure 4—figure supplement 2B.
- https://cdn.elifesciences.org/articles/105955/elife-105955-fig4-figsupp2-data2-v1.csv
-
Figure 4—figure supplement 2—source data 3
DRNDAT-BNST:ChR2 juvenile intruder rearing time x face investigation time (ON-OFF), as shown in Figure 4—figure supplement 2C.
- https://cdn.elifesciences.org/articles/105955/elife-105955-fig4-figsupp2-data3-v1.csv
-
Figure 4—figure supplement 2—source data 4
Baseline behavioral measures correlation matrix (r-values), as shown in Figure 4—figure supplement 2D.
- https://cdn.elifesciences.org/articles/105955/elife-105955-fig4-figsupp2-data4-v1.csv
-
Figure 4—figure supplement 2—source data 5
Baseline behavioral measures correlation matrix (p-values), as shown in Figure 4—figure supplement 2D.
- https://cdn.elifesciences.org/articles/105955/elife-105955-fig4-figsupp2-data5-v1.csv
-
Figure 4—figure supplement 2—source data 6
Baseline behavioral measures (raw values), as shown in Figure 4—figure supplement 2D, E.
- https://cdn.elifesciences.org/articles/105955/elife-105955-fig4-figsupp2-data6-v1.csv
Figure 5 with 1 supplement
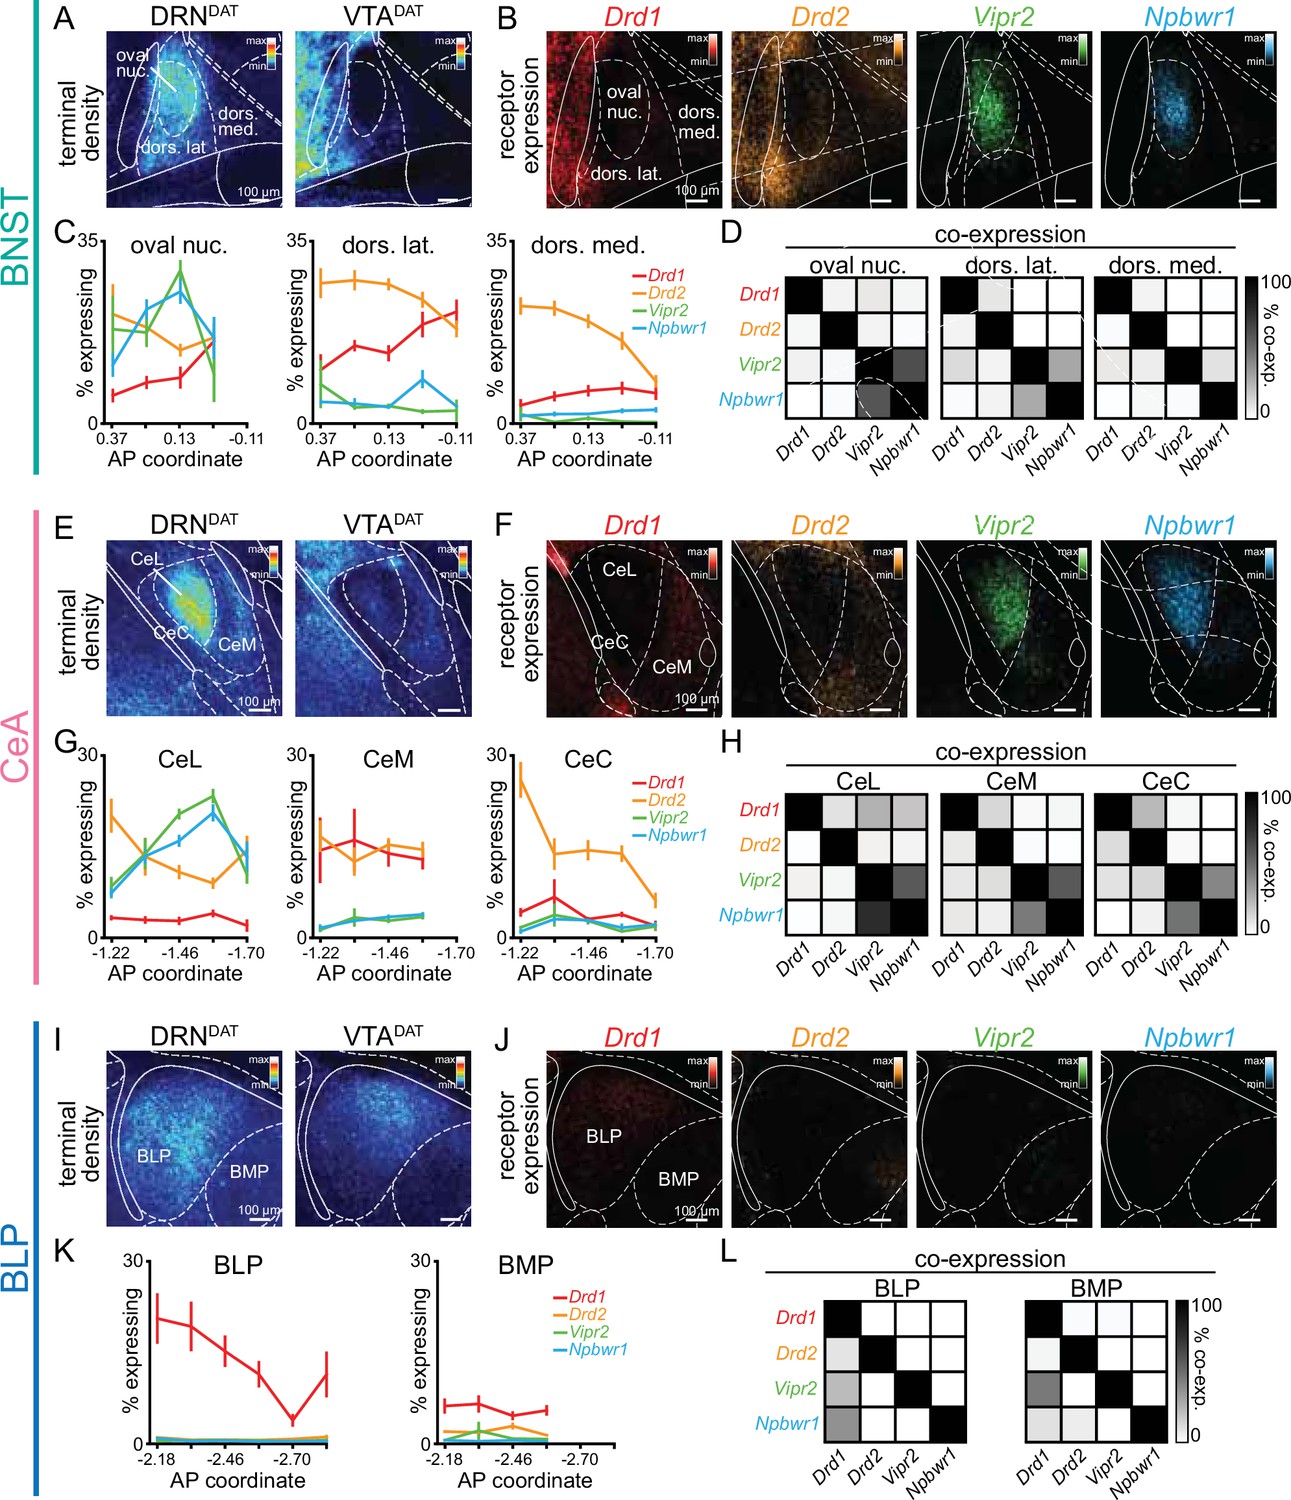
Spatial segregation of dopamine and neuropeptide receptor populations within DRNDAT terminal fields.
(A) Mean projection of terminal density in the middle anteroposterior (AP) region of the BNST, following eYFP expression in DRNDAT (left) or VTADAT (right) neurons. (B) Mean projection showing fluorescent puncta in the BNST indicating detection of Drd1 (red), Drd2 (yellow), Vipr2 (green), or Npbwr1 (blue) mRNA transcripts. (C) Line graphs showing the percent of cells expressing each receptor (≥5 puncta) across AP locations for the oval nucleus, dorsolateral BNST, and dorsomedial BNST (two-way ANOVA, oval nucleus: probe x AP interaction, F9,160=6.194, p<0.0001, dorsolateral BNST: probe x AP interaction, F12,167=3.410, p=0.0002, dorsomedial BNST: probe x AP interaction, F12,161=2.268, p=0.0110). Drd1: n=51,55,53 Drd2: n=52,55,53 Vipr2: n=37,39,37 Npbwr1: n=36,38,38 sections, for oval nucleus, dorsolateral BNST, and dorsomedial BNST, respectively, from 4 mice. (D) Matrices indicating overlap between mRNA-expressing cells: square shade indicates the percent of cells expressing the gene in the column from within cells expressing the gene in the row. (E) Mean projection of terminal density in the middle AP region of the CeA, following eYFP expression in DRNDAT (left) or VTADAT (right) neurons. (F) Mean projection showing fluorescent puncta in the CeA indicating mRNA expression.(G) Line graphs showing the % of cells expressing each receptor (≥5 puncta) across AP locations for the CeL, CeM, and CeC (two-way ANOVA, CeL: probe x AP interaction, F12,220=8.664, p<0.0001, CeM: main effect of probe, F3,186=60.30, p<0.0001, CeC: probe x AP interaction, F12,218=4.883, p<0.0001). Drd1: n=47,40,47 Drd2: n=70,55,70 Vipr2: n=65,57,63 Npbwr1: n=62,50,60 sections, for CeL, CeM, and CeC, respectively, from 4 mice. (H) Matrices indicating overlap between mRNA-expressing cells. (I) Mean projection of terminal density in the middle AP region of the BLP, following eYFP expression in DRNDAT (left) or VTADAT (right) neurons. (J) Mean projection showing fluorescent puncta in the BLP indicating mRNA expression. (K) Line graphs showing the percent of cells expressing each receptor (≥5 puncta) across AP locations for the BLP and BMP (two-way ANOVA, BLP: probe x AP interaction, F15,176=2.165, p=0.0091, BMP: main effect of probe, F3,141=56.92, p<0.0001). Drd1: n=55,44 Drd2: n=59,46 Vipr2: n=41,33 Npbwr1: n=45,34 sections, for BLP and BMP, respectively, from 4 mice. (L) Matrices indicating overlap between mRNA-expressing cells. Line graphs show mean ± SEM.
-
Figure 5—source data 1
BNST RNAScope sub-regional probe expression (percent), as shown in Figure 5C.
- https://cdn.elifesciences.org/articles/105955/elife-105955-fig5-data1-v1.csv
-
Figure 5—source data 2
BNST RNAScope sub-regional probe co-expression, as shown in Figure 5D.
- https://cdn.elifesciences.org/articles/105955/elife-105955-fig5-data2-v1.csv
-
Figure 5—source data 3
CeA RNAScope sub-regional probe expression (percent), as shown in Figure 5G.
- https://cdn.elifesciences.org/articles/105955/elife-105955-fig5-data3-v1.csv
-
Figure 5—source data 4
CeA RNAScope sub-regional probe co-expression, as shown in Figure 5H.
- https://cdn.elifesciences.org/articles/105955/elife-105955-fig5-data4-v1.csv
-
Figure 5—source data 5
BLA RNAScope sub-regional probe expression (percent), as shown in Figure 5K.
- https://cdn.elifesciences.org/articles/105955/elife-105955-fig5-data5-v1.csv
-
Figure 5—source data 6
BLA RNAScope sub-regional probe co-expression, as shown in Figure 5L.
- https://cdn.elifesciences.org/articles/105955/elife-105955-fig5-data6-v1.csv
Figure 5—figure supplement 1

Analysis of mRNA expression using different thresholds qualitatively shows similar spatial pattern of dopamine and neuropeptide receptor expression in downstream regions.
(A) Workflow for RNAscope and image processing. (B) Scatter plots showing a linear relationship between fluorescent pixels/cell and number of puncta/cell for three separate sections for each probe. (C) Violin plots displaying puncta count per section for each receptor in the BNST (white circle indicates median; Drd1: n=51,55,53 Drd2: n=52,55,53 Vipr2: n=37,39,37 Npbwr1: n=36,38,38 sections, for oval nucleus, dorsolateral BNST, and dorsomedial BNST, respectively, from 4 mice). (D) Line graphs for each BNST subregion showing the number of expressing cells when using a threshold of 1 punctum/cell and (E) 3 puncta per cell. (F) Violin plots displaying puncta count per section for each receptor in the CeA (white circle indicates median; Drd1: n=47,40,47 Drd2: n=70,55,70 Vipr2: n=65,57,63 Npbwr1: n=62,50,60 sections, for CeL, CeM, and CeC, respectively, from 4 mice). (G) Line graphs for each CeA subregion showing the number of expressing cells when using a threshold of 1 punctum/cell and (H) 3 puncta per cell. (I) Violin plots displaying puncta count per section for each receptor in the amygdala (white circle indicates median; Drd1: n=55,44 Drd2: n=59,46 Vipr2: n=41,33 Npbwr1: n=45,34 sections, for BLP and BMP, respectively, from 4 mice). (J) Line graphs for each amygdala subregion showing the number of expressing cells when using a threshold of 1 punctum/cell and (K) 3 puncta per cell. These lower thresholds yielded more expressing cells than using 5 puncta/cell (compare with Figure 3c, g and k), but with a similar expression pattern across subregions and AP location. (L–M) Example images showing expression of Vipr1 and Vipr2 within the BNST and CeA. We typically observed greater Vipr2 than Vipr1 expression, and high co-localization, and therefore concentrated our detailed analyses on Vipr2. Line graphs show mean ± SEM.
-
Figure 5—figure supplement 1—source data 1
Number of puncta x pixels occupied for all RNAScope probes, as shown in Figure 5—figure supplement 1B.
- https://cdn.elifesciences.org/articles/105955/elife-105955-fig5-figsupp1-data1-v1.csv
-
Figure 5—figure supplement 1—source data 2
BNST RNAScope sub-regional probe expression (percent, threshold = 1 punctum/cell), as shown in Figure 5—figure supplement 1D.
- https://cdn.elifesciences.org/articles/105955/elife-105955-fig5-figsupp1-data2-v1.csv
-
Figure 5—figure supplement 1—source data 3
BNST RNAScope sub-regional probe expression (percent, threshold = 3 puncta/cell), as shown in Figure 5—figure supplement 1E.
- https://cdn.elifesciences.org/articles/105955/elife-105955-fig5-figsupp1-data3-v1.csv
-
Figure 5—figure supplement 1—source data 4
CeA RNAScope sub-regional probe expression (percent, threshold = 1 punctum/cell), as shown in Figure 5—figure supplement 1G.
- https://cdn.elifesciences.org/articles/105955/elife-105955-fig5-figsupp1-data4-v1.csv
-
Figure 5—figure supplement 1—source data 5
CeA RNAScope sub-regional probe expression (percent, threshold = 3 puncta/cell), as shown in Figure 5—figure supplement 1H.
- https://cdn.elifesciences.org/articles/105955/elife-105955-fig5-figsupp1-data5-v1.csv
-
Figure 5—figure supplement 1—source data 6
BLA RNAScope sub-regional probe expression (percent, threshold = 1 punctum/cell), as shown in Figure 5—figure supplement 1J.
- https://cdn.elifesciences.org/articles/105955/elife-105955-fig5-figsupp1-data6-v1.csv
-
Figure 5—figure supplement 1—source data 7
BLA RNAScope sub-regional probe expression (percent, threshold = 3 puncta/cell), as shown in Figure 5—figure supplement 1K.
- https://cdn.elifesciences.org/articles/105955/elife-105955-fig5-figsupp1-data7-v1.csv
Figure 6 with 1 supplement
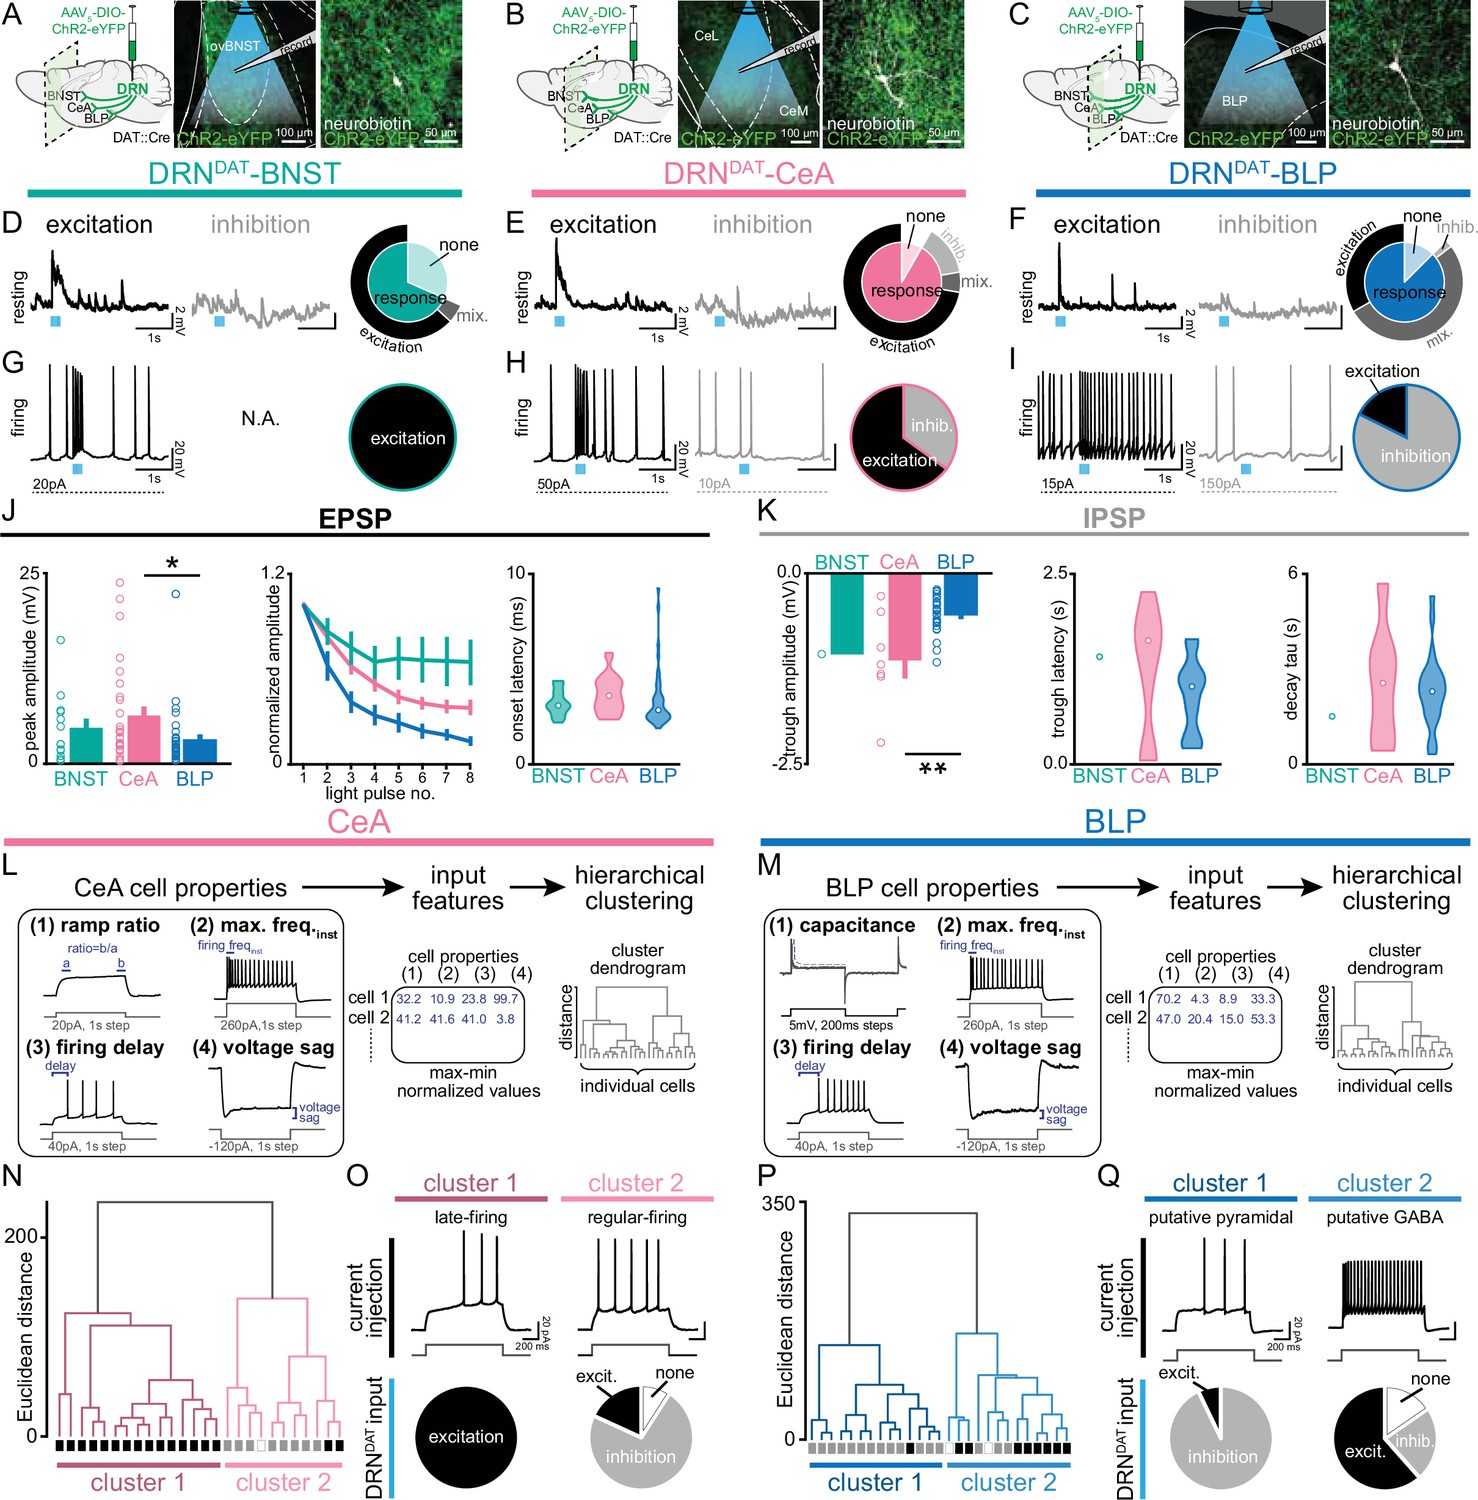
DRNDAT input distinctly influences downstream activity in each downstream target.
(A–C) In mice expressing ChR2 in DRNDAT neurons, ex vivo electrophysiological recordings were made from (A) the BNST, (B) CeA, and (C) BLP. (D–F) Photostimulation of DRNDAT terminals with blue light (8 pulses delivered at 30 Hz) evoked both excitatory and inhibitory responses at resting membrane potentials in (D) the BNST, (E) CeA, and (F) BLP. Traces show single sweeps and pie charts indicate proportion of cells with no response (‘none’), an EPSP only (‘excitation’), an IPSP only (‘inhibition’), or a mixed combination of EPSPs and IPSPs (‘mix’). Recorded cells: BNST n=19, CeA n=36, BLP n=48. (G–I) When constant current was injected to elicit spontaneous firing, (G) BNST cells responded to photostimulation with an increase in firing (‘excitation’), while (H) CeA and (I) BLP cells responded with an increase or a decrease in firing (‘inhibition’). Recorded cells: BNST n=5, CeA n=20, BLP n=17. (J) Properties of the optically evoked excitatory post-synaptic potential (EPSP) at resting membrane potentials – left: peak amplitude (Kruskal-Wallis statistic = 6.790, p=0.0335; Dunn’s posts-hoc tests: CeA vs BLP p=0.0378); middle: change in amplitude across light pulses; right: violin plots showing distribution of onset latencies (white circle indicates median).(K) Properties of the optically evoked inhibitory post-synaptic potential (IPSP) at resting membrane potentials – left panel: trough amplitude (one-way ANOVA, F2,31=8.150, p=0.0014, CeA vs BLP: **p=0.0014); middle panel: violin plot showing latency to trough peak; right panel: violin plot showing tau for the current decay (white circle indicates median). (L) Workflow for agglomerative hierarchical clustering of CeA neurons and (M) BLP neurons. Four baseline electrical properties were used as input features (following max-min normalization) and Ward’s method was used to generate a cluster dendrogram, grouping cells based on Euclidean distance. (N) Dendrogram for CeA cells indicating two major clusters, with their response to DRNDAT input indicated below each branch (excitation = black; inhibition = grey; no response = open). (O) Upper panels: cluster 1 showed baseline properties typical of ‘late-firing’ neurons and cluster 2 showed baseline properties typical of ‘regular-firing’ neurons. Lower panels: pie charts showing the response of cells in each cluster to DRNDAT input. (P) Dendrogram for BLP cells indicating two major clusters, with their response to DRNDAT input indicated below each branch (excitation = black; inhibition = grey; no response = open). (Q) Upper panels: cluster 1 showed baseline properties typical of pyramidal neurons and cluster 2 showed baseline properties typical of GABA interneurons. Lower panels: pie charts showing the response of cells in each cluster to DRNDAT input. Bar and line graphs show mean ± SEM. *p<0.05, **p<0.01.
-
Figure 6—source data 1
BNST (resting) ex vivo responses to DRNDAT optical stimulation, as shown in Figure 6D.
- https://cdn.elifesciences.org/articles/105955/elife-105955-fig6-data1-v1.csv
-
Figure 6—source data 2
CeA (resting) ex vivo responses to DRNDAT optical stimulation, as shown in Figure 6E.
- https://cdn.elifesciences.org/articles/105955/elife-105955-fig6-data2-v1.csv
-
Figure 6—source data 3
BLP (resting) ex vivo responses to DRNDAT optical stimulation, as shown in Figure 6F.
- https://cdn.elifesciences.org/articles/105955/elife-105955-fig6-data3-v1.csv
-
Figure 6—source data 4
BNST (firing) ex vivo responses to DRNDAT optical stimulation, as shown in Figure 6G.
- https://cdn.elifesciences.org/articles/105955/elife-105955-fig6-data4-v1.csv
-
Figure 6—source data 5
CeA (firing) ex vivo responses to DRNDAT optical stimulation, as shown in Figure 6H.
- https://cdn.elifesciences.org/articles/105955/elife-105955-fig6-data5-v1.csv
-
Figure 6—source data 6
BLP (firing) ex vivo responses to DRNDAT optical stimulation, as shown in Figure 6I.
- https://cdn.elifesciences.org/articles/105955/elife-105955-fig6-data6-v1.csv
-
Figure 6—source data 7
BNST/CeA/BLP ex vivo EPSP peak amplitude in response to DRNDAT optical stimulation, as shown in Figure 6J.
- https://cdn.elifesciences.org/articles/105955/elife-105955-fig6-data7-v1.csv
-
Figure 6—source data 8
BNST/CeA/BLP ex vivo EPSP normalized amplitude in response to DRNDAT optical stimulation, as shown in Figure 6J.
- https://cdn.elifesciences.org/articles/105955/elife-105955-fig6-data8-v1.csv
-
Figure 6—source data 9
BNST/CeA/BLP ex vivo EPSP onset latency in response to DRNDAT optical stimulation, as shown in Figure 6J.
- https://cdn.elifesciences.org/articles/105955/elife-105955-fig6-data9-v1.csv
-
Figure 6—source data 10
BNST/CeA/BLP ex vivo IPSP trough amplitude in response to DRNDAT optical stimulation, as shown in Figure 6K.
- https://cdn.elifesciences.org/articles/105955/elife-105955-fig6-data10-v1.csv
-
Figure 6—source data 11
BNST/CeA/BLP ex vivo IPSP trough latency in response to DRNDAT optical stimulation, as shown in Figure 6K.
- https://cdn.elifesciences.org/articles/105955/elife-105955-fig6-data11-v1.csv
-
Figure 6—source data 12
BNST/CeA/BLP ex vivo IPSP decay tau in response to DRNDAT optical stimulation, as shown in Figure 6K.
- https://cdn.elifesciences.org/articles/105955/elife-105955-fig6-data12-v1.csv
-
Figure 6—source data 13
CeA ex vivo baseline cell properties used for hierarchical clustering, as shown in Figure 6L–O.
- https://cdn.elifesciences.org/articles/105955/elife-105955-fig6-data13-v1.csv
-
Figure 6—source data 14
BLP ex vivo baseline cell properties used for hierarchical clustering, as shown in Figure 6M–Q.
- https://cdn.elifesciences.org/articles/105955/elife-105955-fig6-data14-v1.csv
Figure 6—figure supplement 1

Effect of DRNDAT photostimulation on downstream cellular excitability ex vivo.
(A–C) Example DIC image, and corresponding eYFP fluorescence, of a brain slice containing (A) the BNST, (B) CeA, or (C) BLP during ex vivo recording. Regional maps show the location of recorded cells, with color indicating the change in membrane potential elicited by optical stimulation of DRNDAT terminals. (D) Example traces showing the optically evoked EPSP (upper panels) and slow component of the IPSP (lower panels) were maintained following application of TTX/4AP. (E) Normalized peak amplitude of the EPSP and IPSP following TTX/4AP (EPSP, n=8; IPSP, n=3). (F) Scatter plots showing the amplitude of the optically evoked EPSP (left) and IPSP (right) recorded in downstream locations plotted against baseline membrane potential. (G) Line graphs showing the action potential inter-event interval (IEI) in cells where constant current was injected to elicit firing. Raw (left) and normalized (right) IEI 5.5 s before and 5 s after optical stimulation of DRNDAT terminals (blue shading) in BNST, CeA, and BLP cells. Cells that showed a reduction in IEI with optical stimulation were labeled ‘excited’ (excit., black) and cells that showed an increase in IEI with optical stimulation were defined as ‘inhibited’ (inhib., grey). (H) Box-and-whisker plots comparing the baseline cell properties (used as input features for hierarchical clustering; Figure 6L–Q) of the two CeA clusters and (I) the two BLP clusters. Unpaired t-tests for CeA – ramp ratio: t24=3.502, p=0.0018; max instantaneous firing frequency (max freqinst.): t24=4.698, p<0.0001, firing delay: t24=5.050, p<0.0001, voltage sag: t24=3.983, p=0.0006; unpaired t-tests for BLP – capacitance: t25=4.803, p<0.0001, max freqinst.: t25=15.48, p<0.0001, firing delay: t25=2.743, p=0.0111, voltage sag: t25=2.705, p=0.0121. (J) Box-and-whisker plots for the two CeA clusters and (K) the two BLP clusters showing the amplitude and latency of the EPSP and IPSP, and the combined total voltage area elicited by optical stimulation of DRNDAT terminals. EPSP peak amplitude, CeA: unpaired t-test, t17=1.40, p=0.180; BLP: unpaired t-test t22=2.34, p=0.029. EPSP latency, CeA: unpaired t-test, t17=0.673, p=0.510; BLP: Mann-Whitney U=33.5, p=0.032. Total voltage area, CeA: Mann-Whitney U=22, p=0.0023; BLP: Mann-Whitney U=29, p=0.0019. (L) Workflow for agglomerative hierarchical clustering of all CeA and BLP neurons combined. Five cell properties were used as input features, corresponding to the five used in Figure 6L–Q for separate clustering of CeA and BLP cells. (M) Dendrogram indicating two major clusters, with the cell location and response to DRNDAT input indicated by the colored bars below each branch (CeA – pink, BLP – blue; excitation = black; inhibition = grey; no response = open). (N) Pie charts showing the response of cluster 1 and cluster 2 CeA cells (upper) and BLP cells (lower) to optical stimulation DRNDAT input. *p<0.05, **p<0.01, ***p<0.001, ****p<0.0001.
-
Figure 6—figure supplement 1—source data 1
BNST/CeA/BLP ex vivo EPSP/IPSP normalized peak amplitude in response to DRNDAT optical stimulation with TTX/4AP application, as shown in Figure 6—figure supplement 1E.
- https://cdn.elifesciences.org/articles/105955/elife-105955-fig6-figsupp1-data1-v1.csv
-
Figure 6—figure supplement 1—source data 2
BNST/CeA/BLP ex vivo EPSP/IPSP peak/trough pre-stimulation membrane potential, as shown in Figure 6—figure supplement 1F.
- https://cdn.elifesciences.org/articles/105955/elife-105955-fig6-figsupp1-data2-v1.csv
-
Figure 6—figure supplement 1—source data 3
BNST/CeA/BLP action potential inter-event intervals, as shown in Figure 6—figure supplement 1G.
- https://cdn.elifesciences.org/articles/105955/elife-105955-fig6-figsupp1-data3-v1.csv
-
Figure 6—figure supplement 1—source data 4
CeA baseline cell properties by cluster, as shown in Figure 6—figure supplement 1H.
- https://cdn.elifesciences.org/articles/105955/elife-105955-fig6-figsupp1-data4-v1.csv
-
Figure 6—figure supplement 1—source data 5
BLP baseline cell properties by cluster, as shown in Figure 6—figure supplement 1I.
- https://cdn.elifesciences.org/articles/105955/elife-105955-fig6-figsupp1-data5-v1.csv
-
Figure 6—figure supplement 1—source data 6
Effect of DRNDAT input on CeA cell properties by cluster (EPSPs/IPSPs), as shown in Figure 6—figure supplement 1J.
- https://cdn.elifesciences.org/articles/105955/elife-105955-fig6-figsupp1-data6-v1.csv
-
Figure 6—figure supplement 1—source data 7
Effect of DRNDAT input on CeA total voltage area by cluster, as shown in Figure 6—figure supplement 1J.
- https://cdn.elifesciences.org/articles/105955/elife-105955-fig6-figsupp1-data7-v1.csv
-
Figure 6—figure supplement 1—source data 8
Effect of DRNDAT input on BLP cell properties by cluster (EPSPs/IPSPs), as shown in Figure 6—figure supplement 1K.
- https://cdn.elifesciences.org/articles/105955/elife-105955-fig6-figsupp1-data8-v1.csv
-
Figure 6—figure supplement 1—source data 9
Effect of DRNDAT input on BLP total voltage area by cluster, as shown in Figure 6—figure supplement 1K.
- https://cdn.elifesciences.org/articles/105955/elife-105955-fig6-figsupp1-data9-v1.csv
-
Figure 6—figure supplement 1—source data 10
CeA/BLP ex vivo baseline cell properties used for hierarchical clustering, as shown in Figure 6—figure supplement 1L, M.
- https://cdn.elifesciences.org/articles/105955/elife-105955-fig6-figsupp1-data10-v1.csv
Figure 7 with 2 supplements
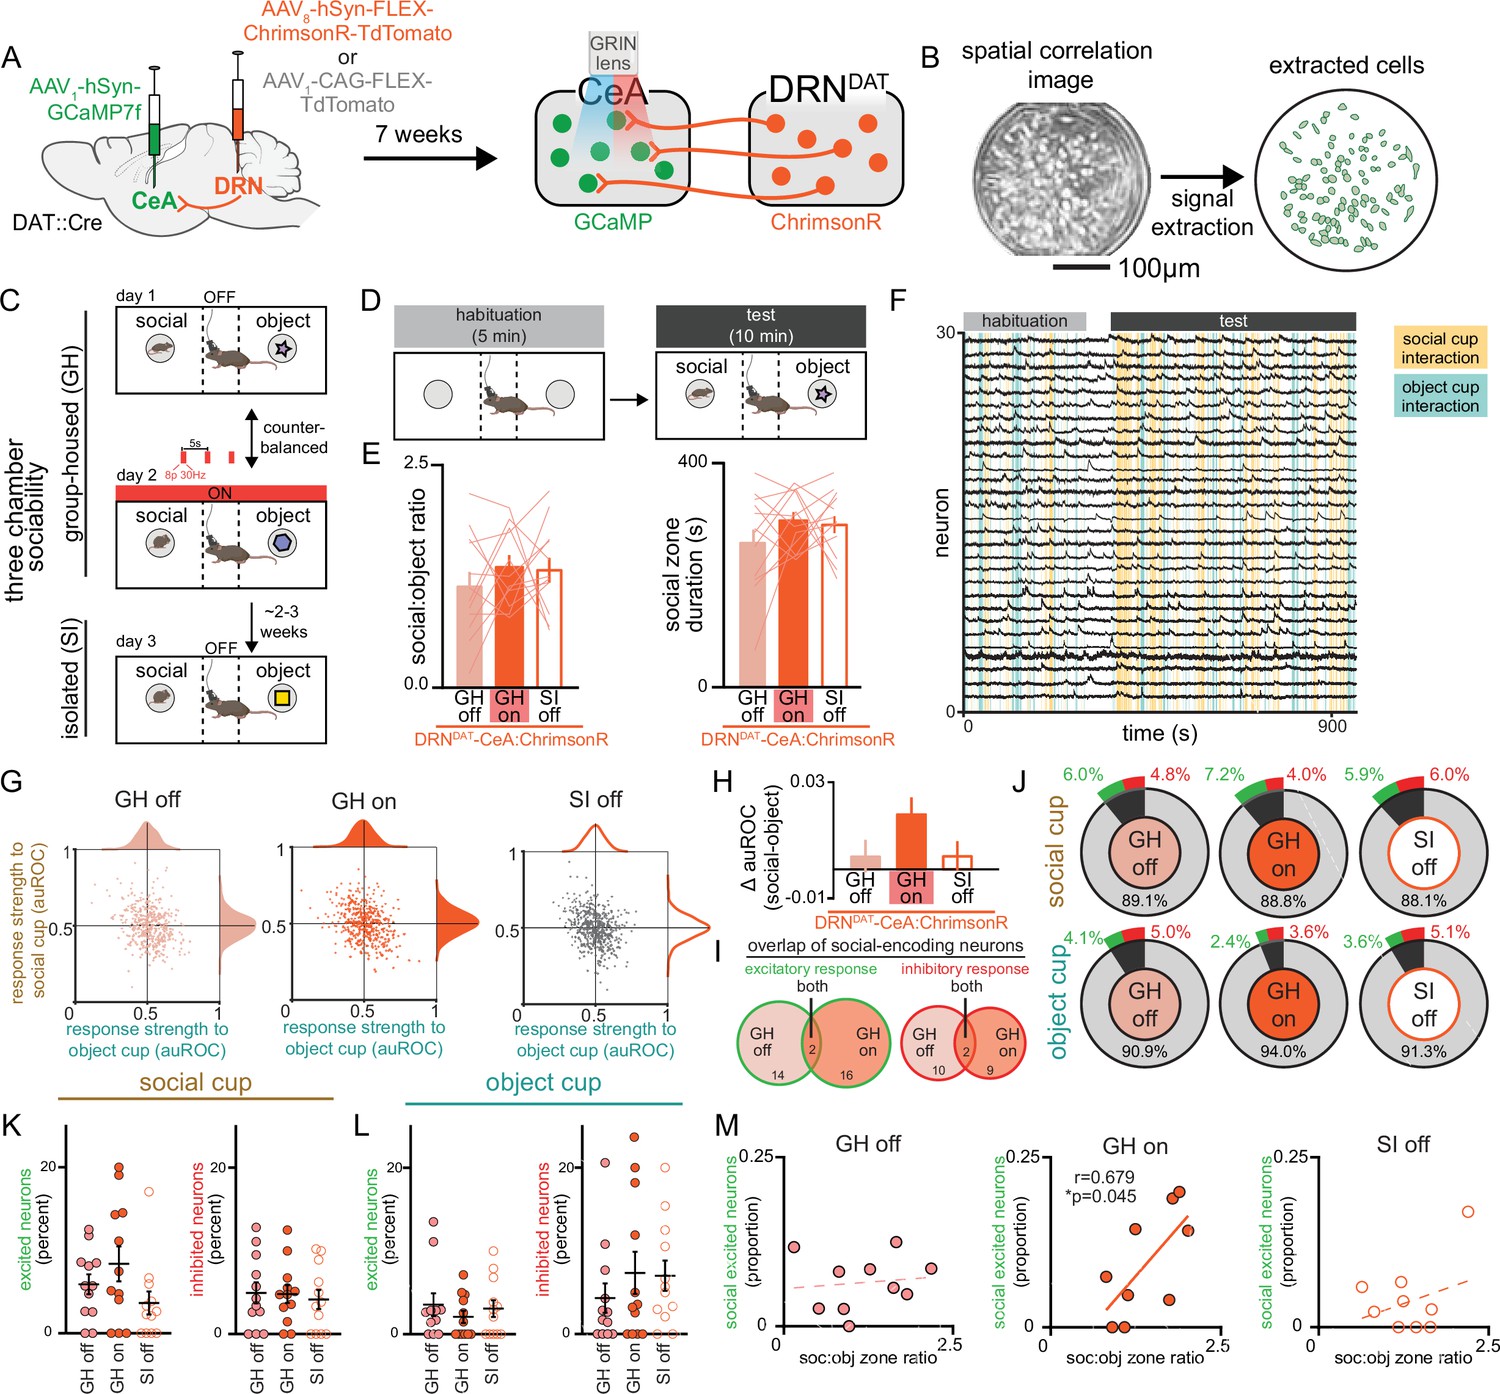
Simultaneous calcium imaging of CeA neurons and optogenetic stimulation of DRNDAT terminals in CeA.
(A) AAV1-hSyn-GCaMP7f was injected into the CeA and AAV8-hSyn-FLEX-ChrimsonR-TdTomato or AAV1-CAG-FLEX-TdTomato was injected into the DRN of DAT-Cre mice, and a GRIN lens was implanted over CeA. Experiments were conducted 7 weeks following surgery to allow adequate virus expression in axon terminals. (B) Example spatial correlation image and extracted ROIs of CeA neurons following calcium imaging processing. (C) Three chamber sociability paradigm. While group-housed, mice explored a three-chamber apparatus with a novel male juvenile stimulus on one side and a novel object stimulus on the other. During one day of the imaging experiment, DRNDAT terminals were not stimulated, and in another session, DRNDAT terminals were stimulated with red light delivery. Mice underwent a third imaging session, without photostimulation, following 24 hr of social isolation. (D) Mice first explored the three-chamber apparatus without social or object stimuli for a 5-min habituation period, then with the social and object stimuli for a 10-min test period. (E) Social:object ratio (left) and total social cup interaction time (right) during GH stimulation and no stimulation sessions and 24 hr isolated session in mice expressing ChrimsonR in DRNDAT neurons. Bar and line graphs represent mean ± SEM (N=12 mice; mixed-effects model: F1.897,30.36=0.5767, p=0.5591). (F) Representative traces from CeA calcium imaging during one three-chamber imaging session. (G) Scatter and distribution plots indicating the response strength (auROC) of recorded CeA neurons to social and object cups (GH off: n=429 cells, N=15 mice; GH on: n=441 cells, N=15 mice; SI off: n=484 cells, N=15 mice).(H) Difference in response strength (Δ auROC) of CeA neurons to social and object cups (GH off: n=429 cells; GH on: n=441 cells; SI off: n=484 cells) Kruskal-Wallis test: K-W statistic: 6.172, *p=0.0457; Dunn’s multiple comparisons test: GH off vs GH on—p=0.0580, GH off vs SI off—p>0.9999. (I) Venn diagrams showing overlap of social-encoding neurons (displaying an excitatory response, left, or an inhibitory response, right as defined with auROC) in GH off and GH on sessions (GH off and GH on co-registered neurons: n=202 cells). 16 co-registered GH off cells and 18 GH on cells exhibited an excitatory response to social stimulus with 2 cells having the same response across conditions, whereas 12 co-registered GH off and 11 GH on cells exhibited an inhibitory response with 2 cells having the same response across conditions. (J) Proportion of CeA neurons responsive to social and object cups, further classified as an excitatory (green) or inhibitory (red) response to the stimulus as defined with auROC. (K) Proportion of recorded neurons that have an excitatory or inhibitory response to the social cup and (L) to the object cup (N=12 mice). (M) Correlation between social preference in three-chamber task and the proportion of CeA neurons that have an excitatory response to the social cup. The proportion of socially excited neurons is positively correlated with soc:obj zone ratio only for the GH on condition (Pearson correlation: r=0.6785, p=0.0445, N=9 mice). Bar and line graphs show mean ± SEM. *p<0.05.
-
Figure 7—source data 1
DRNDAT-CeA:ChrimsonR three-chamber social:object ratio and social zone duration, as shown in Figure 7E.
- https://cdn.elifesciences.org/articles/105955/elife-105955-fig7-data1-v1.csv
-
Figure 7—source data 2
CeA response strength to social and object stimuli, as shown in Figure 7G.
- https://cdn.elifesciences.org/articles/105955/elife-105955-fig7-data2-v1.csv
-
Figure 7—source data 3
CeA response strength (change in auROC, social – object), as shown in Figure 7H.
- https://cdn.elifesciences.org/articles/105955/elife-105955-fig7-data3-v1.csv
-
Figure 7—source data 4
CeA response overlap of social-encoding neurons, as shown in Figure 7I.
- https://cdn.elifesciences.org/articles/105955/elife-105955-fig7-data4-v1.csv
-
Figure 7—source data 5
CeA response classification to social and object stimuli, as shown in Figure 7J.
- https://cdn.elifesciences.org/articles/105955/elife-105955-fig7-data5-v1.csv
-
Figure 7—source data 6
Percentage of CeA neurons excited/inhibited by social stimulus, as shown in Figure 7K.
- https://cdn.elifesciences.org/articles/105955/elife-105955-fig7-data6-v1.csv
-
Figure 7—source data 7
Percentage of CeA neurons excited/inhibited by object stimulus, as shown in Figure 7L.
- https://cdn.elifesciences.org/articles/105955/elife-105955-fig7-data7-v1.csv
-
Figure 7—source data 8
Proportion of CeA neurons excited by social stimulus x social:object ratio, as shown in Figure 7M.
- https://cdn.elifesciences.org/articles/105955/elife-105955-fig7-data8-v1.csv
Figure 7—figure supplement 1

Ex vivo validation of simultaneous calcium imaging and photostimulation and behavioral and neural effects of DRNDAT-CeA:TdTomato stimulation in CeA.
(A) Representative images of GCaMP-expressing cells in the CeA beneath the GRIN lens, and DRNDAT terminals expressing ChrimsonR. (B) ChrimsonR was expressed in DRNDAT neurons by injection of AAV9-Syn-FLEX-ChrimsonR-Tdtomato into the DRN of DAT::Cre mice, and (C) after 7 weeks whole-cell patch-clamp electrophysiological recordings were made from CeA neurons. (D) Example EPSP and IPSP evoked by delivery of 635 nm red light or 470 nm blue light (8 pulses, with 5ms pulse width, at 30 Hz).(E) Peak amplitude and (F) area of optically evoked potential elicited by 635 nm (10 mW) and 470 nm (0.3 and 0.2 mW) light. Inset bar graphs show normalized data. Red light evoked a PSP with a significantly greater peak amplitude (repeated measures ANOVA, F2,16=200.1, p<0.0001, red vs 0.3 mW blue: p<0.0001, red vs 0.2 mW blue: p<0.0001) and area (repeated measures ANOVA, F2,16=404.2, p<0.0001, red vs 0.3 mW blue: p<0.0001, red vs 0.2 mW blue: p<0.0001) than either 0.3 mW or 0.2 mW blue light. (G) Example EPSP and IPSP evoked by delivery of 635 nm red light alone (8 pulses, with 5ms pulse width, at 30 Hz) or during constant 470 nm blue light (0.3 mW) to mimic in vivo recording conditions. (H) Peak amplitude and (I) area of optically evoked potential elicited by 635 nm light alone, or during constant 470 nm light. Inset bar graphs show normalized data. Red light evoked a significantly smaller PSP in the presence of continuous blue light (peak amplitude: paired t-test: t11=5.172, p=0.0003; potential area: paired t-test: t11=6.431, p<0.0001) similar to a previous report (Stamatakis et al., 2018). Note that the wavelength of imaging light here (470 nm) is higher than for the nVoke miniature microscope (455±8 nm), so this experiment may overestimate the constant blue light-induced suppression of red light-evoked potentials. (J) Social:object ratio and (K) total social cup interaction time during GH stimulation and no stimulation sessions and 24 hr isolated session for DRNDAT-CeA:TdTomato control animals (N=2 mice). (L) Difference in response strength (Δ auROC) of CeA neurons to social and object cups in DRNDAT-CeA:TdTomato control mice (GH off: n=39 cells, N=2 mice; GH on: n=61 cells, N=2 mice; SI off: n=76 cells, N=2 mice; one-way ANOVA: F2,173=0.4183, p=0.6588) (M) (top) ROC curves generated by aligning an example CeA neuron’s calcium trace to interaction with the social (blue) or object (gold) cup in the three-chamber sociability task. This example neuron is classified as having an excitatory response to the social stimulus while having a neutral response to the object cup. (bottom) Calcium dynamics of example CeA neuron aligned to mouse’s behavior. Blue shading indicates interaction with the social cup, while gold shading indicates interaction with the object cup. (N) No correlation was found between social preference in three chamber task and the proportion of CeA neurons that have a significantly excitatory response to the object cup (Pearson’s correlation: GH off – r=−0.3231, p=0.6328, N=9; GH on – r=−0.1152, p=0.7679, N=8; SI off – r=0.3438, p=0.3307, N=9). (O) No correlation was found between social preference in three chamber task and the proportion of CeA neurons that have a significantly inhibitory response to the social cup (Pearson’s correlation: GH off – r=0.1729, p=0.3625, N=9 mice; GH on – r=−0.3941, p=0.2939, N=8 mice; SI off – r=0.0116, p=0.9745, N=9 mice). Bar and line graphs show mean ± SEM. ***p<0.001, ****p<0.0001.
-
Figure 7—figure supplement 1—source data 1
CeA ex vivo EPSP/IPSP voltage peak in response to 635 nm or 470 nm wavelength light, as shown in Figure 7—figure supplement 1E.
- https://cdn.elifesciences.org/articles/105955/elife-105955-fig7-figsupp1-data1-v1.csv
-
Figure 7—figure supplement 1—source data 2
CeA ex vivo EPSP/IPSP voltage area in response to 635 nm or 470 nm wavelength light, as shown in Figure 7—figure supplement 1F.
- https://cdn.elifesciences.org/articles/105955/elife-105955-fig7-figsupp1-data2-v1.csv
-
Figure 7—figure supplement 1—source data 3
CeA ex vivo EPSP/IPSP voltage peak in response to just 635 nm or simultaneous 635 nm and 470 nm wavelength light, as shown in Figure 7—figure supplement 1H.
- https://cdn.elifesciences.org/articles/105955/elife-105955-fig7-figsupp1-data3-v1.csv
-
Figure 7—figure supplement 1—source data 4
CeA ex vivo EPSP/IPSP voltage area in response to just 635 nm or simultaneous 635 nm and 470 nm wavelength light, as shown in Figure 7—figure supplement 1I.
- https://cdn.elifesciences.org/articles/105955/elife-105955-fig7-figsupp1-data4-v1.csv
-
Figure 7—figure supplement 1—source data 5
DRNDAT-CeA:TdTomato three-chamber social:object ratio and social zone duration, as shown in Figure 7—figure supplement 1J, K.
- https://cdn.elifesciences.org/articles/105955/elife-105955-fig7-figsupp1-data5-v1.csv
-
Figure 7—figure supplement 1—source data 6
CeA response strength (change in auROC, social – object), as shown in Figure 7—figure supplement 1L.
- https://cdn.elifesciences.org/articles/105955/elife-105955-fig7-figsupp1-data6-v1.csv
-
Figure 7—figure supplement 1—source data 7
Proportion of CeA neurons excited by object stimulus x social:object ratio, as shown in Figure 7—figure supplement 1N.
- https://cdn.elifesciences.org/articles/105955/elife-105955-fig7-figsupp1-data7-v1.csv
-
Figure 7—figure supplement 1—source data 8
Proportion of CeA neurons inhibited by social stimulus x social:object ratio, as shown in Figure 7—figure supplement 1O.
- https://cdn.elifesciences.org/articles/105955/elife-105955-fig7-figsupp1-data8-v1.csv
Figure 7—figure supplement 2

Ex vivo validation of simultaneous calcium imaging and photostimulation and behavioral and neural effects of DRNDAT-CeA:TdTomato stimulation in CeA.
(A) Agglomerative hierarchical clustering of trial-averaged CeA traces aligned to interaction with the social or object cup. The dendrogram (left) reveals 12 functional clusters of neurons, as displayed by the heatmap of trial-averaged neural activity (right). (B) Cluster-averaged traces aligned to the onset of social cup (blue) or object cup (gold) interaction for each cluster. The percentage of neurons per condition is listed in each inset. Line graphs show mean ± SEM.
Figure 8 with 1 supplement
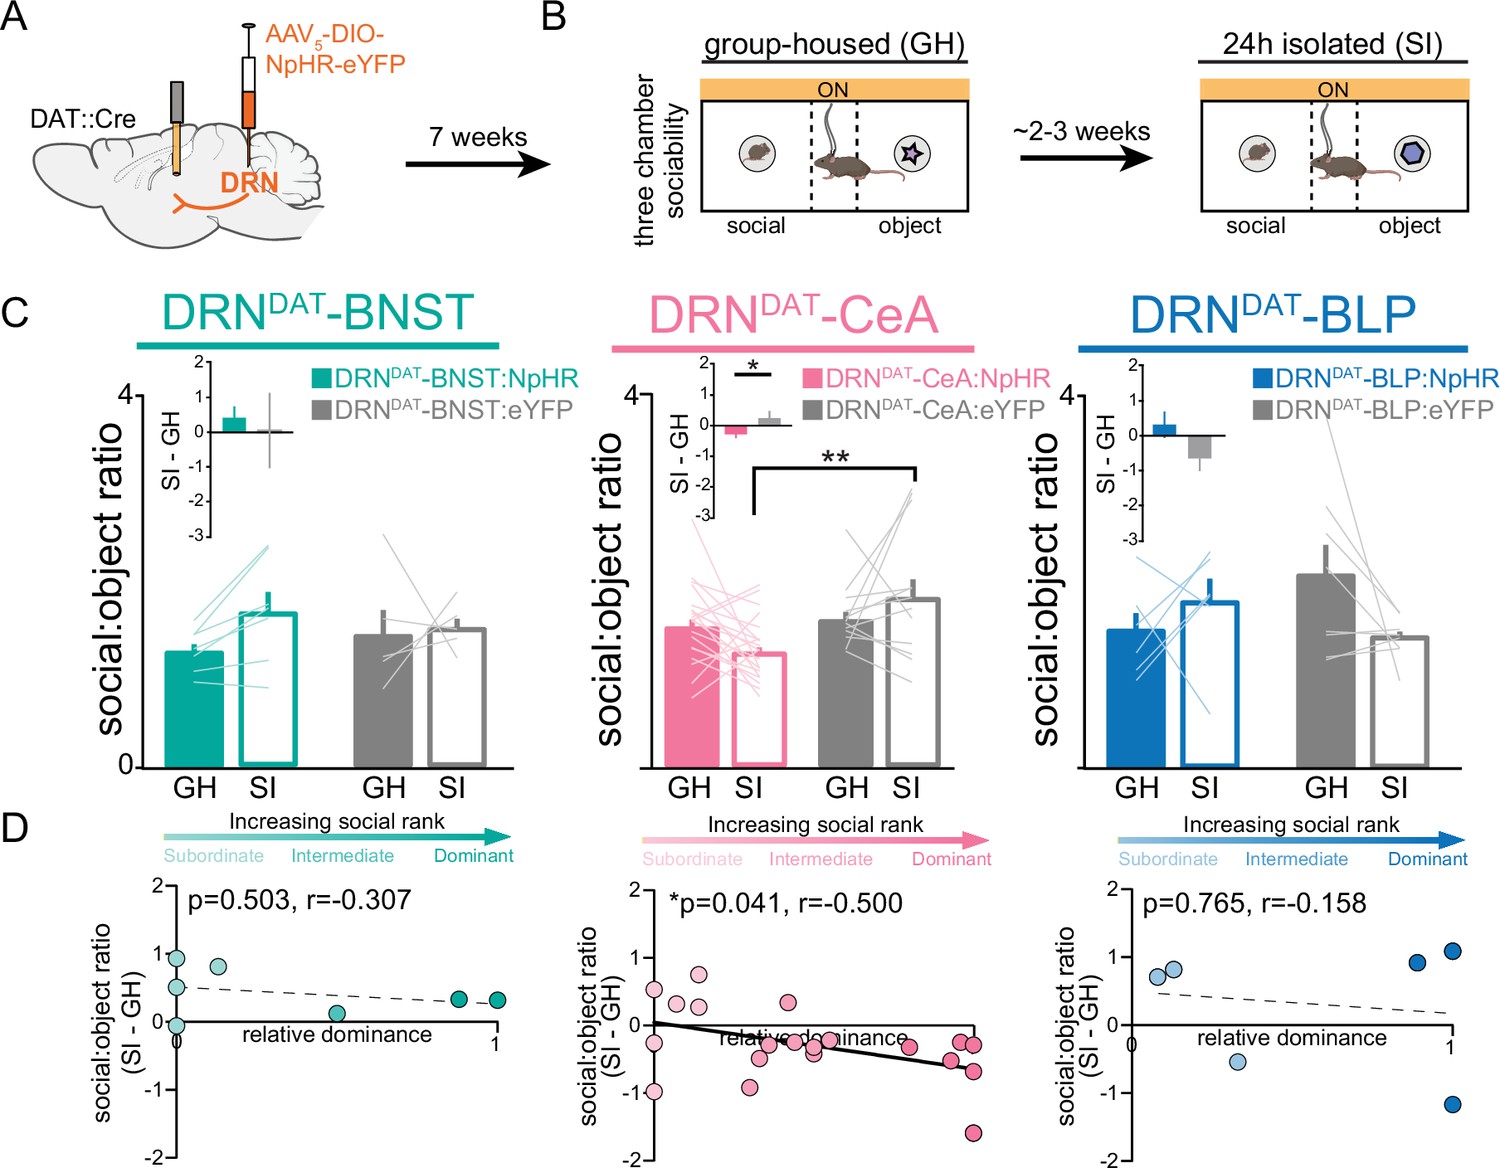
DRNDAT-CeA photoinhibition blocks isolation-induced sociability.
(A) AAV5-DIO-NpHR-eYFP or AAV5-DIO-eYFP was injected into the DRN of DAT::Cre mice and optic fibers implanted over the BNST, CeA, or BLP to photoinhibit DRNDAT terminals. (B) After >7 weeks for viral expression, mice were assayed on the three-chamber sociability assay with delivery of continuous yellow light for photoinhibition, once when group-housed and once following 24 hr of social isolation (2–3 weeks after the initial session). (C) Photoinhibition of DRNDAT-BNST terminals in NpHR-expressing mice (DRNDAT-BNST:NpHR) had no significant effect on time spent in the social zone relative to the object zone (DRNDAT-BNST:NpHR: N=7 mice, DRNDAT-BNST:eYFP: N=5 mice; ‘social:object ratio’; two-way RM ANOVA: light x group interaction, F1,10=1.005, p=0.3397), but reduced social:object ratio for isolated DRNDAT-CeA:NpHR mice compared to isolated DRNDAT-CeA:eYFP mice (DRNDAT-CeA:NpHR: N=20 mice, DRNDAT-CeA:eYFP: N=12 mice; ‘social:object ratio’; two-way RM ANOVA: light x group interaction, F1,30=4.909, p=0.0344; multiple comparisons test, DRNDAT-CeA:NpHRSI vs DRNDAT-CeA:eYFPSI adjusted **p=0.0017). In addition, terminal photoinhibition had no effect for DRNDAT-BLP:NpHR mice (DRNDAT-BLP:NpHR: N=6 mice, DRNDAT-BLP:eYFP: N=8 mice; ‘social:object ratio’; two-way RM ANOVA: light x group interaction, F1,12=3.346, p=0.0923). Inset bar graphs show the difference in social:object ratio in isolated and grouped conditions. A significant difference between NpHRCeA and eYFPCeA groups was observed (unpaired t-test: t29=2.177, p=0.0377). (D) Scatter plots displaying relative dominance plotted against the change in social zone time (isolated-grouped), showing significant negative correlation in NpHRCeA mice (Pearson’s correlation: r=−0.500, p=0.0414, N=20 mice). Bar and line graphs show mean ± SEM. *p<0.05, **p<0.01.
-
Figure 8—source data 1
DRNDAT-ALL:NpHR three-chamber social:object ratio (GH on and SI on), as shown in Figure 8C.
- https://cdn.elifesciences.org/articles/105955/elife-105955-fig8-data1-v1.csv
-
Figure 8—source data 2
DRNDAT-ALL:NpHR three-chamber social:object ratio (SI – GH) x relative dominance, as shown in Figure 8D.
- https://cdn.elifesciences.org/articles/105955/elife-105955-fig8-data2-v1.csv
Figure 8—figure supplement 1

Photoinhibition of DRNDAT-BNST:NpHR, DRNDAT-CeA:NPHR, DRNDAT-BLP:NpHR terminals does not affect social preference in group-housed mice.
(A) Schematic showing three-chamber behavior paradigm in group-housed DRNDAT:NpHR or DRNDAT:eYFP mice, with and without yellow light for photoinhibition. (B) Photoinhibition had no significant effect on social:object ratio in group-housed mice (two-way ANOVA, light x group interaction, BNST – F1,11 p=0.4571, DRNDAT-BNST:NpHR: N=7 mice, DRNDAT-BNST:eYFP: N=5 mice; CeA – F1,31=0.1353, p=0.7154, DRNDAT-CeA:NpHR: N=20 mice, DRNDAT-CeA:eYFP: N=12 mice; BLP – F1,14=2.517, p=0.1349, DRNDAT-BLP:NpHR: N=6 mice, DRNDAT-BLP:eYFP: N=8 mice). Line and bar graphs show mean ± SEM.
-
Figure 8—figure supplement 1—source data 1
DRNDAT-ALL:NpHR three-chamber social:object ratio (GH off and GH on), as shown in Figure 8—figure supplement 1B.
- https://cdn.elifesciences.org/articles/105955/elife-105955-fig8-figsupp1-data1-v1.csv
Author response image 1

Author response image 2

P-values from subsampling analysis show a moderately reproducible social preference effect in DRNDAT-CeA:ChR2 mice, but not in DRNDAT-BNST:ChR2 mice.
(A-D) Histograms showing distribution of paired t-test p-values comparing OFF and ON social preference scores (as shown in Figure 4A-I) in subsampled groups (to match the sample size of the DRNDAT-BLP:ChR2 group). (A) 14 DRNDAT-CeA:ChR2 mice were randomly subsampled, a paired t-test was performed, and the resulting p-values were binned and plotted. (B) Same as (A), but ensuring that the proportion of subordinate, intermediate, and dominant mice in the subsampled groups were the same as the original distribution. (C) Same as (A), but with DRNDAT-BNST:ChR2 mice. (D) Same as (B), but with DRNDAT-BNST:ChR2 mice.
Author response image 3

Tables
Key resources table
| Reagent type (species) or resource | Designation | Source or reference | Identifiers | Additional information |
|---|---|---|---|---|
| Strain, strain background (Mus musculus, male) | DATIREScre (B6.SJL-Slc6a3tm1.1(cre)Bkmn/J) | Jackson Laboratory | IMSR_JAX: 000664 | |
| Strain, strain background (M. musculus, male) | C57BL/6 J | Charles River Laboratories | Strain code 631 | |
| Strain, strain background (AAV) | AAV5-EF1α-DIO-ChR2-eYFP | University of North Carolina Vector Core | https://www.med.unc.edu/genetherapy/vectorcore/in-stock-aav-vectors/deisseroth/ | |
| Strain, strain background (AAV) | AAV5-EF1α-DIO-eYFP | University of North Carolina Vector Core | https://www.med.unc.edu/genetherapy/vectorcore/in-stock-aav-vectors/deisseroth/ | |
| Strain, strain background (AAV) | AAV9-Syn-ChrimsonR-tdTomato | University of North Carolina Vector Core | https://www.med.unc.edu/genetherapy/vectorcore/in-stock-aav-vectors/deisseroth/ | |
| Strain, strain background (AAV) | HSV-LS1L-mCherry-IRES-flpo | Viral Gene Transfer Core Facility at MIT | https://biology.mit.edu/faculty-and-research/core-facilities/ | |
| Strain, strain background (AAV) | AAV5-EF1α-DIO-eNpHR3.0-eYFP | Addgene | RRID:Addgene_26966 | |
| Strain, strain background (AAV) | AAV1-syn-jGCaMP7f | Addgene | RRID:Addgene_104488 | |
| Strain, strain background (AAV) | AAV1-CAG-TdTomato | UPenn vector core | https://www.med.upenn.edu/carot/aav-core.html | |
| Chemical compound | CTB-555 | ThermoFisher | C34776 | |
| Chemical compound | CTB-647 | ThermoFisher | C34778 | |
| Chemical compound | DAPI | Sigma-Aldrich | D9542 | 1:50,000 |
| Chemical compound | PVA-DABCO | Sigma-Aldrich | 10981 | |
| Chemical compound | Normal Donkey Serum | Jackson Immunoresearch | RRID:AB_2337258 | |
| Chemical compound | CF405-conjugated streptavidin | Biotium | 29032 | 1:1000 |
| Chemical compound, drug | CF633-conjugated streptavidin | Biotium | 29037 | 1:1000 |
| Chemical compound | RNAScope Multiplex Fluorescent Reagent Kit V2 | ACDBio | 323110 | |
| Chemical compound | RNAScope Multiplex Detection Reagents | ACDBio | 323110 | |
| Chemical compound | RNAScope Drd1a target probe | ACDBio | 406491-C1 | |
| Chemical compound | RNAScope Drd2 target probe | ACDBio | 406501-C3 | |
| Chemical compound | RNAScope Npbwr1 target probe | ACDBio | 547181-C1 | |
| Chemical compound | RNAScope Vipr2 target probe | ACDBio | 465391-C1 | |
| Chemical compound | TSA fluorophore (green) | PerkinElmer | Fluorescein | |
| Chemical compound | TSA fluorophore (red) | PerkinElmer | Cyanine 3 | |
| Chemical compound | TSA fluorophore (far red) | PerkinElmer | Cyanine 5 | |
| Antibody | Anti-Tyrosine Hydroxylase Antibody | Millipore | RRID:AB_570923 | 1:1000 |
| Antibody | Alexa Fluor 488 AffiniPure Donkey Anti-Chicken IgY (IgG) (H+L) | Jackson ImmunoResearch | RRID:AB_2340375 | 1:1000 |
| Antibody | Alexa Fluor 647-AffiniPure Donkey Anti-Chicken IgY (IgG) (H+L) | Jackson ImmunoResearch | RRID:AB_2340379 | 1:1000 |
| Software | Fluoview software version 4.0 | Olympus | RRID:SCR_014215 | |
| Software | FIJI | ImageJ | RRID:SCR_003070 | |
| Software | CellProfiler | CellProfiler | RRID:SCR_007358 | |
| Software | Adobe Photoshop CC | Adobe | RRID:SCR_014199 | |
| Software | MATLAB | Mathworks | RRID:SCR_001622 | |
| Software | Adobe Illustrator | Adobe | RRID:SCR_010279 | |
| Software | Ethovision XT | Noldus | RRID:SCR_000441 | |
| Software | pClamp 10.4 software | Molecular Devices | RRID:SCR_011323 | |
| Software | GraphPad Prism 8 | Graphpad | RRID:SCR_002798 | |
| Other | Optic fiber | Thor Labs | TS1843490 | |
| Other | Ferrules | Kientec Systems | FSS-LC-330 | |
| Other | Small animal stereotaxic frame | David Kopf Instruments | Model 942 | |
| Other | 0.10 mL Microsyringe | World Precision Instruments (NANOFIL-NF33BL-2) | RRID:SCR_008593 | |
| Other | Microsyringe Pump UMP3 and Controller Micro4 | World Precision Instruments (UMP3-3) | RRID:SCR_008593 | |
| Other | Peristaltic pump for ex vivo recordings | Minipuls 3 Gilson | F155001 | |
| Other | Pulse generator | A.M.P.I. Master-8 | RRID:SCR_018889 | |
| Other | Cryostat | Leica biosystems CM3050 S | RRID:SCR_020214 | |
| Other | HM430 Microtome | Thermo Fisher Scientific | RRID:SCR_020020 | |
| Other | Vibrating blade vibratome | Leica Biosystems VT1200 | RRID:SCR_018453 | |
| Other | Confocal Laser-Scanning microscope | Olympus FV1000 | RRID:SCR_020337 | |
| Other | Diode Blue 473 nm Laser | OptoEngine LLC | MBL-III-473/1–100 mW | |
| Other | Horizontal puller for glass microelectrodes for ex vivo recordings | Sutter P-1000 | RRID:SCR_021042 | |
| Other | Multiclamp amplifier for ex vivo recordings | Molecular Devices 700B | RRID:SCR_018455 | |
| Other | Microscope for ex vivo recordings | Scientifica | RRID:SCR_021035 | |
| Other | Microscope for in vivo calcium imaging recordings | Inscopix nVoke System | RRID:SCR_023028 |
Additional files
Download links
A two-part list of links to download the article, or parts of the article, in various formats.
Downloads (link to download the article as PDF)
Open citations (links to open the citations from this article in various online reference manager services)
Cite this article (links to download the citations from this article in formats compatible with various reference manager tools)
Separable dorsal raphe dopamine projections mimic the facets of a loneliness-like state
eLife 14:RP105955.
https://doi.org/10.7554/eLife.105955.3


