Intracellular sphingosine releases calcium from lysosomes
- European Molecular Biology Laboratory, Germany
- University of Geneva, Switzerland
- National Institutes of Health, United States
- University of Oxford, United Kingdom
Figures
Figure 1 with 2 supplements

Structures of coumarin-caged sphingosine (Sph-Cou), nitrobenzyl-caged sphingosine (Sph-NB) and the negative control, coumarin-caged dihydrosphingosine (dhSph-Cou), respectively.
https://doi.org/10.7554/eLife.10616.003
Figure 1—figure supplement 1
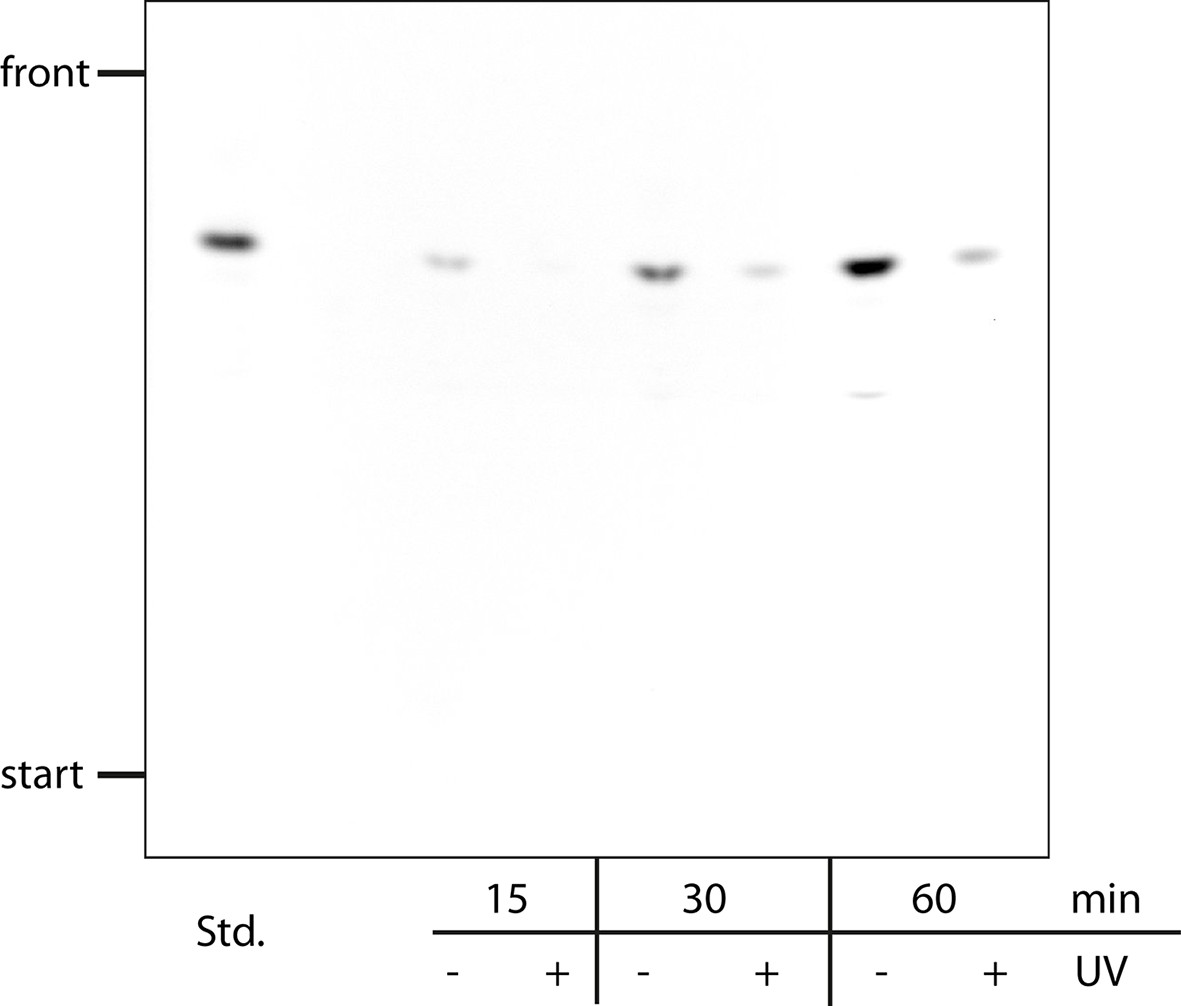
Stability of caged Sph in cells.
HeLa cells were labeled with a pulse of 2 µM of Sph-Cou for the indicated times and then washed. Under +UV conditions, the cells were irradiated for 2 min. Cells were lysed, subjected to lipid extraction and separated by thin layer chromatography. The background was subtracted using Fiji software.
Figure 1—figure supplement 2
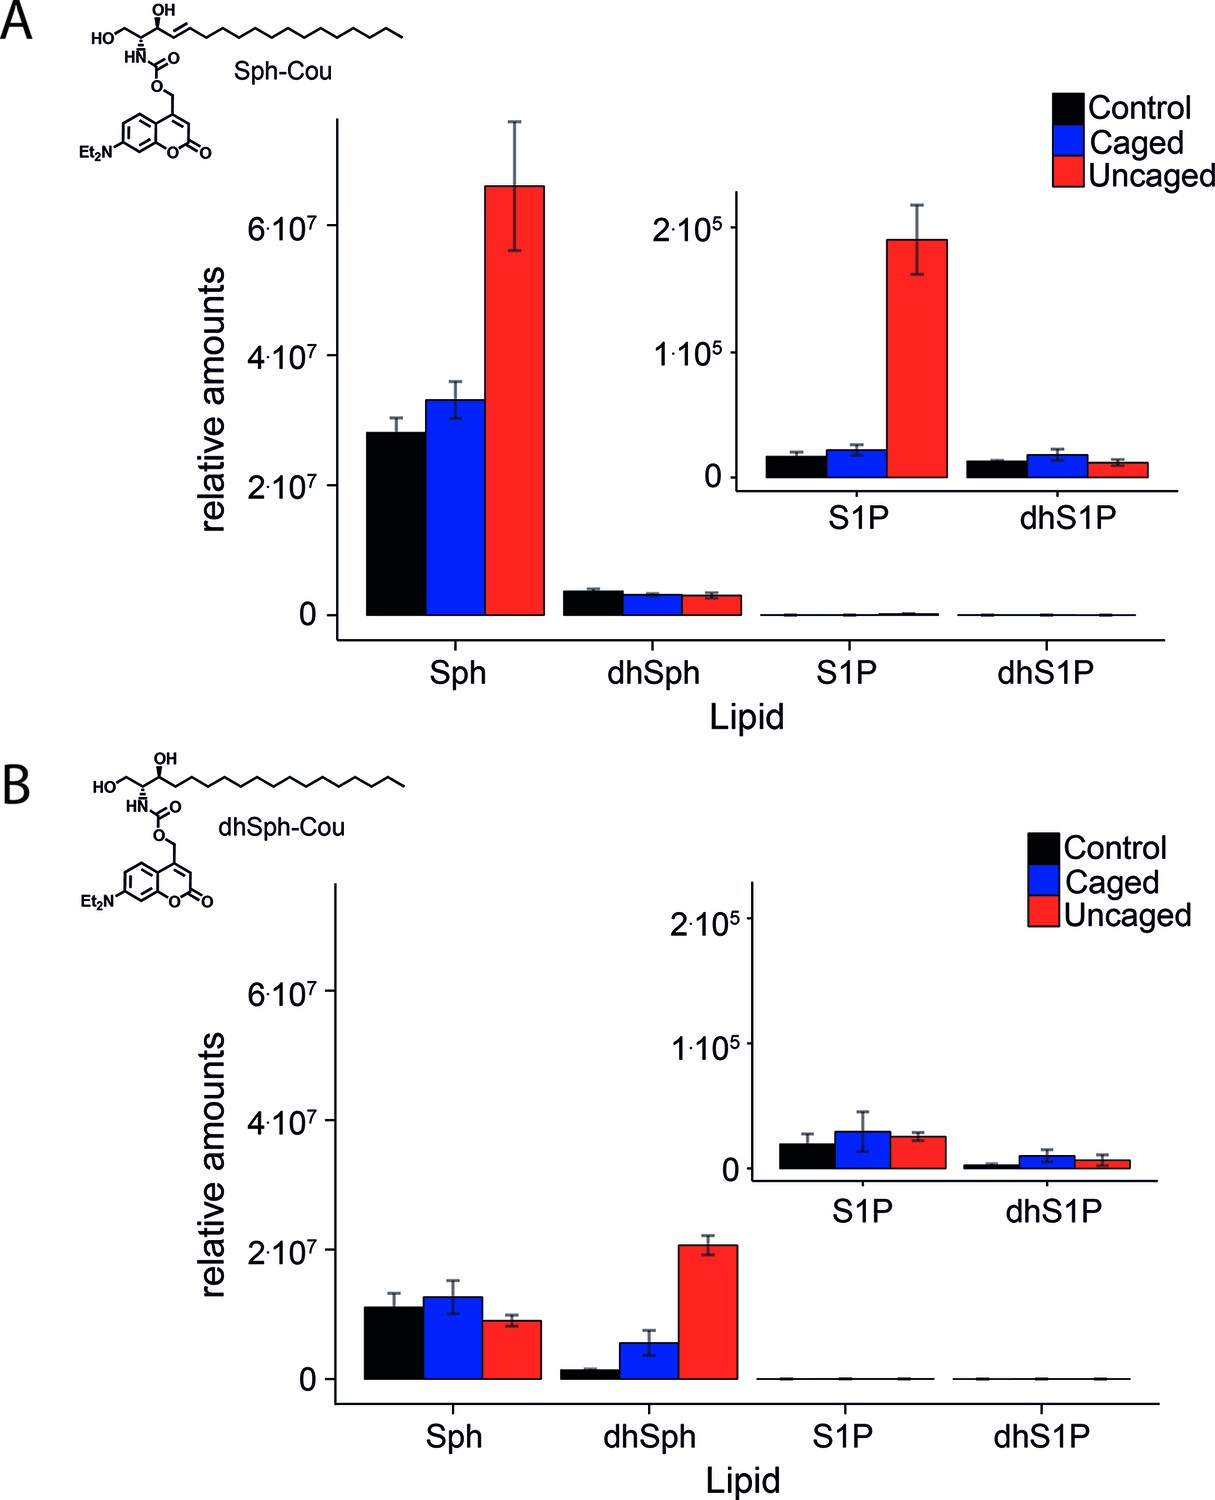
Comparative lipid analysis by mass spectrometry shows a successful uncaging reaction.
Lipid extracts of HeLa cells pulsed with A) Sph-Cou and B) dhSph-Cou were AQC derivatized and measured on a TSQ Vantage mass spectrometer. Values are normalized to the C17 internal standards.
Figure 2 with 2 supplements
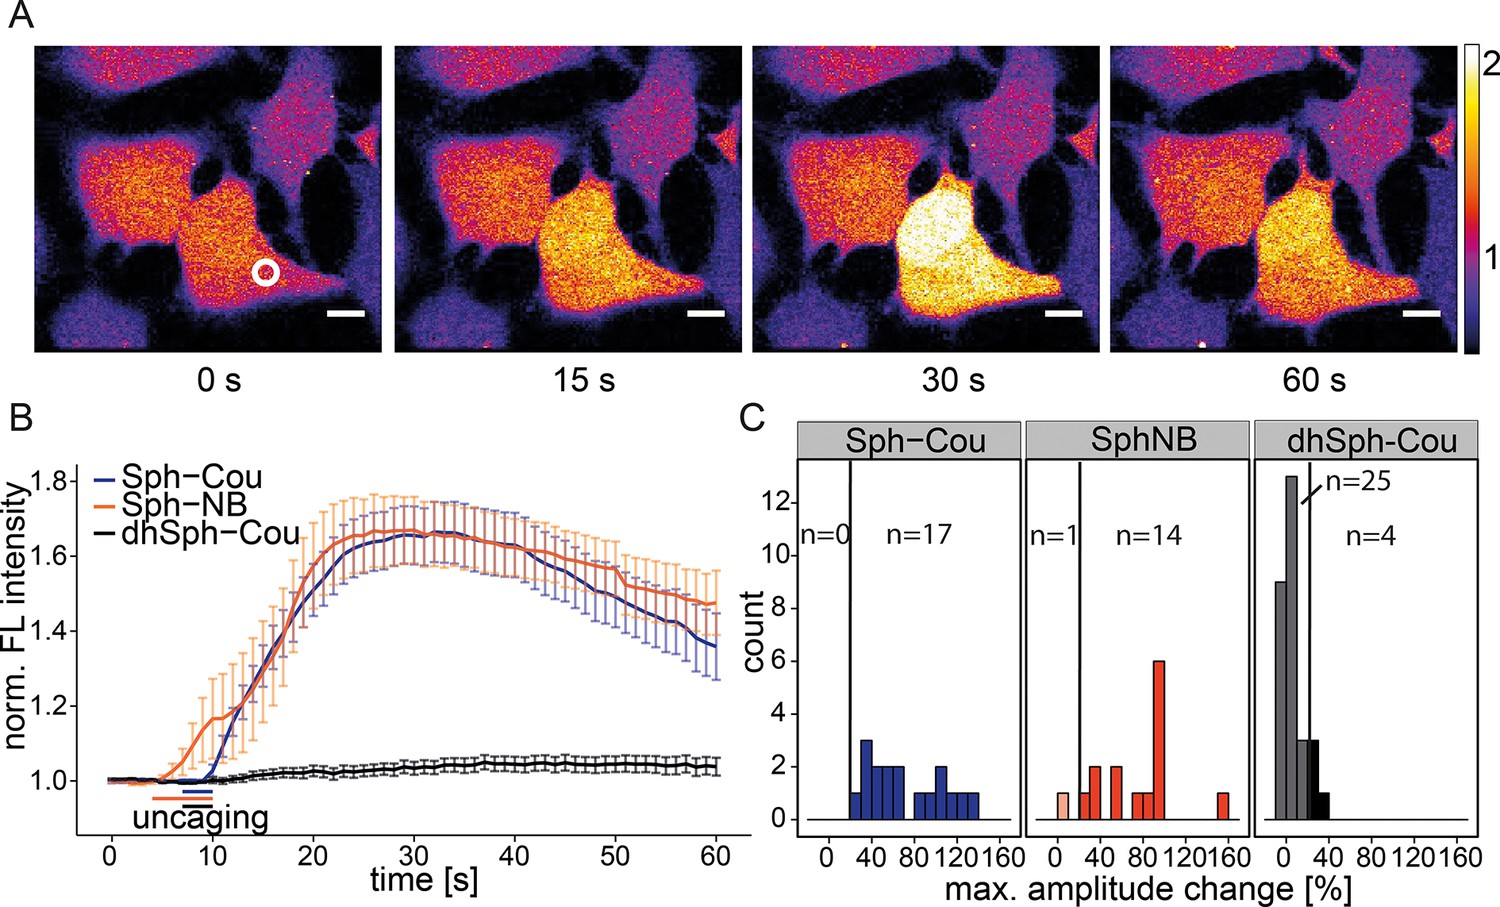
Local uncaging of Sph leads to calcium transients.
(A) Time-lapse confocal microscopy images of HeLa cells loaded with the calcium indicator Fluo-4 and treated with Sph-Cou. Cells were irradiated within the white circle at t = 7 s for 3 s. (B) Mean Fluo-4 fluorescence traces of cells loaded with compounds Sph-Cou (17 cells), Sph-NB (15 cells), and dhSph-Cou (29 cells), respectively. Uncaging was carried out for 3 s for coumarin-caged compounds and for 6 s for nitrobenzyl-caged sphingosine. The duration of uncaging for each lipid is represented by the color-coded bars. Traces represent mean values with the standard error of the mean plotted as error bars. (C) Histogram showing the distribution of the maximum observed amplitude compared to baseline of each analyzed cell. The vertical line represents the threshold set at 20% amplitude increase for responding cells.
Figure 2—figure supplement 1
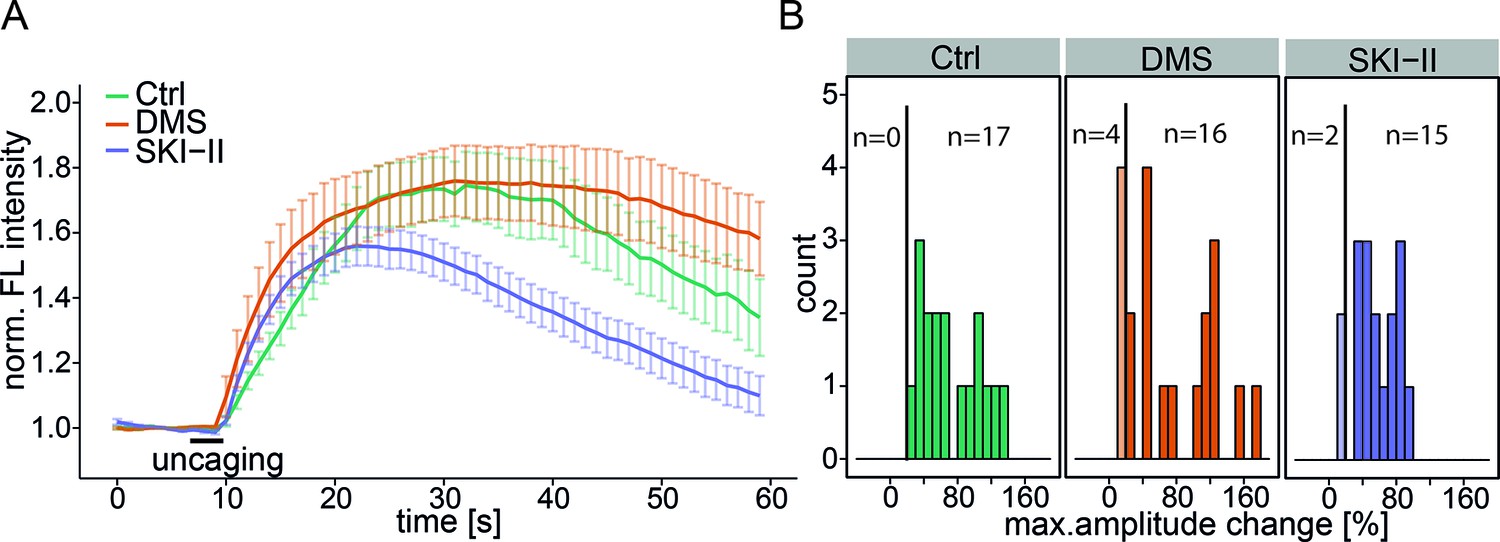
Inhibition of Sph kinases.
(A) HeLa cells were loaded with 2 µM Sph-Cou in basal conditions or incubated with Sph kinase inhibitor N,N-dimethylsphingosine (DMS, 1 µM, 20 cells or with SKI-II (10 µM, 17 cells). Uncaging was performed for 3 s as represented by the bar. Traces represent the mean values with the standard error of the mean plotted as error bars. (B) Histogram showing the distribution of the maximum observed amplitude compared to baseline with a threshold of 20% increase over baseline fluorescence.
Figure 2—figure supplement 2
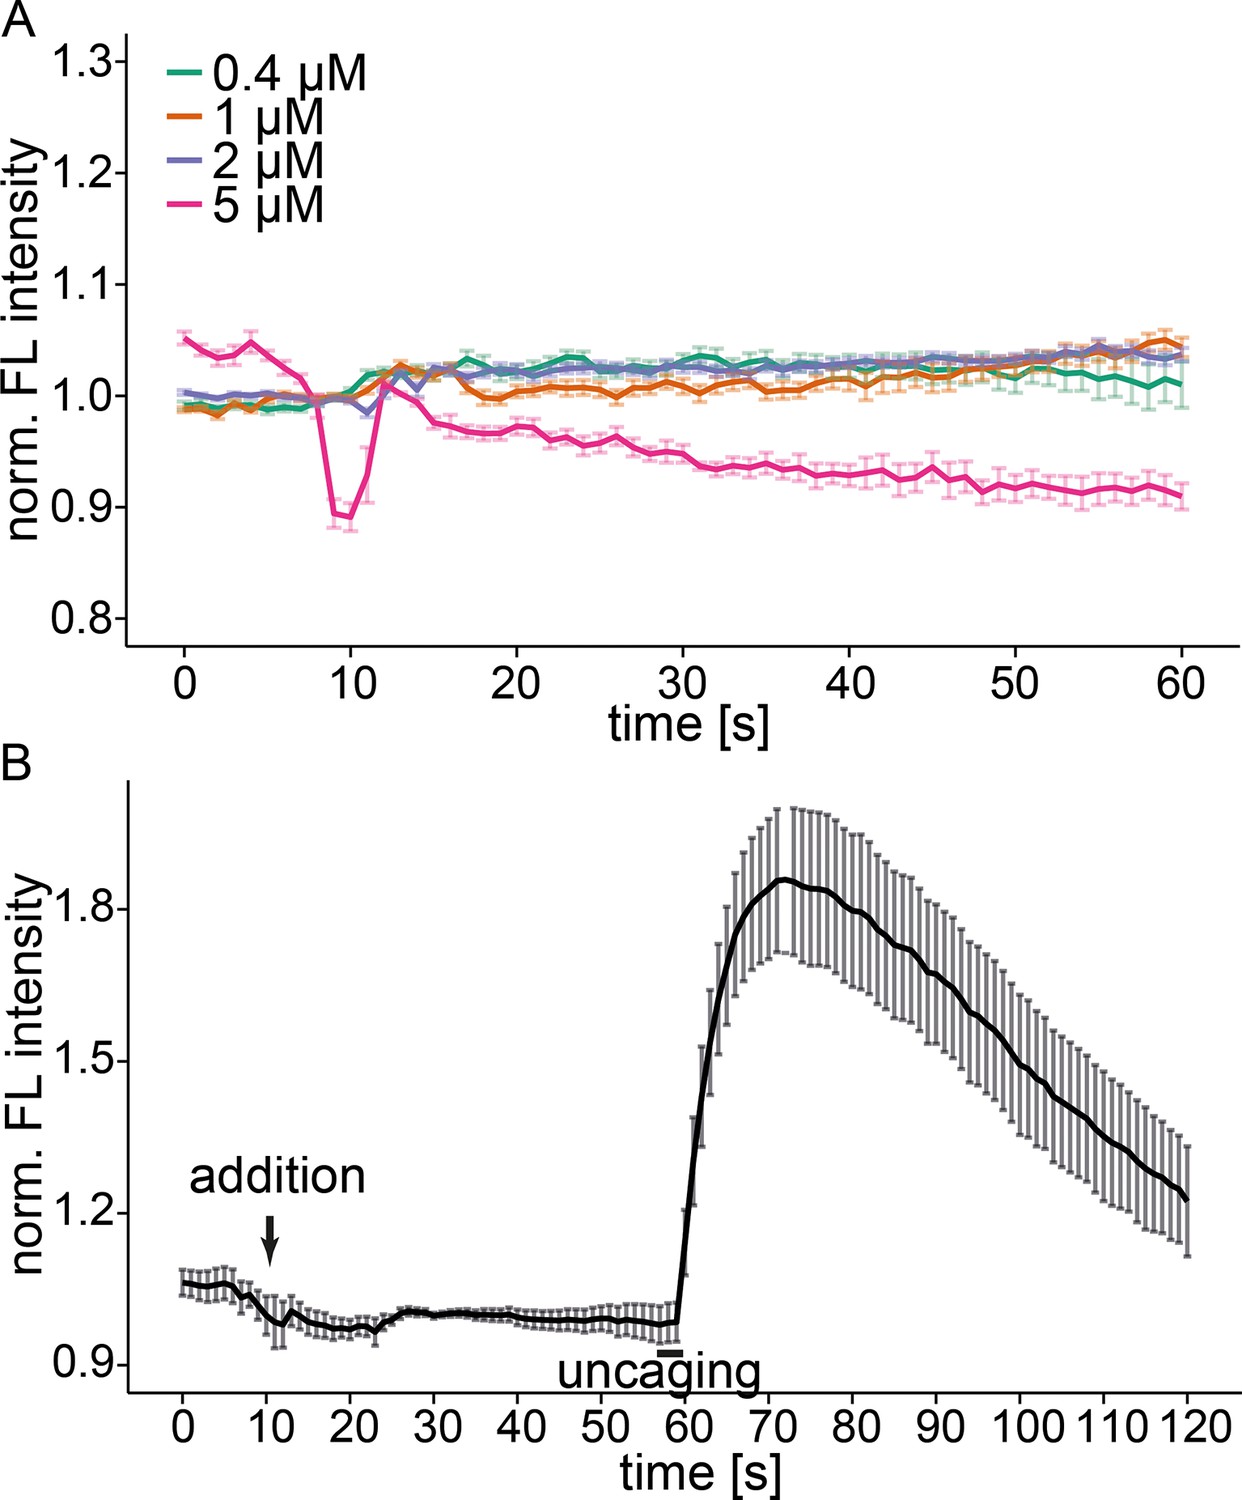
Free Sph does not induce calcium release.
(A) HeLa cells were loaded with Fluo-4 and different concentrations of free Sph were added to the imaging medium at t=10s. Addition of 5 µM Sph leads to strong artifacts, cell blebbing and death of a fraction of the observed cells. (B) HeLa cells were loaded with Fluo-4 and Sph-Cou. Free Sph (4 µM) was added to the imaging medium at t=10s, and uncaging was carried out for 3s as represented by the black bar. Traces represent mean values with the standard error of the mean plotted as error bars.
Figure 3
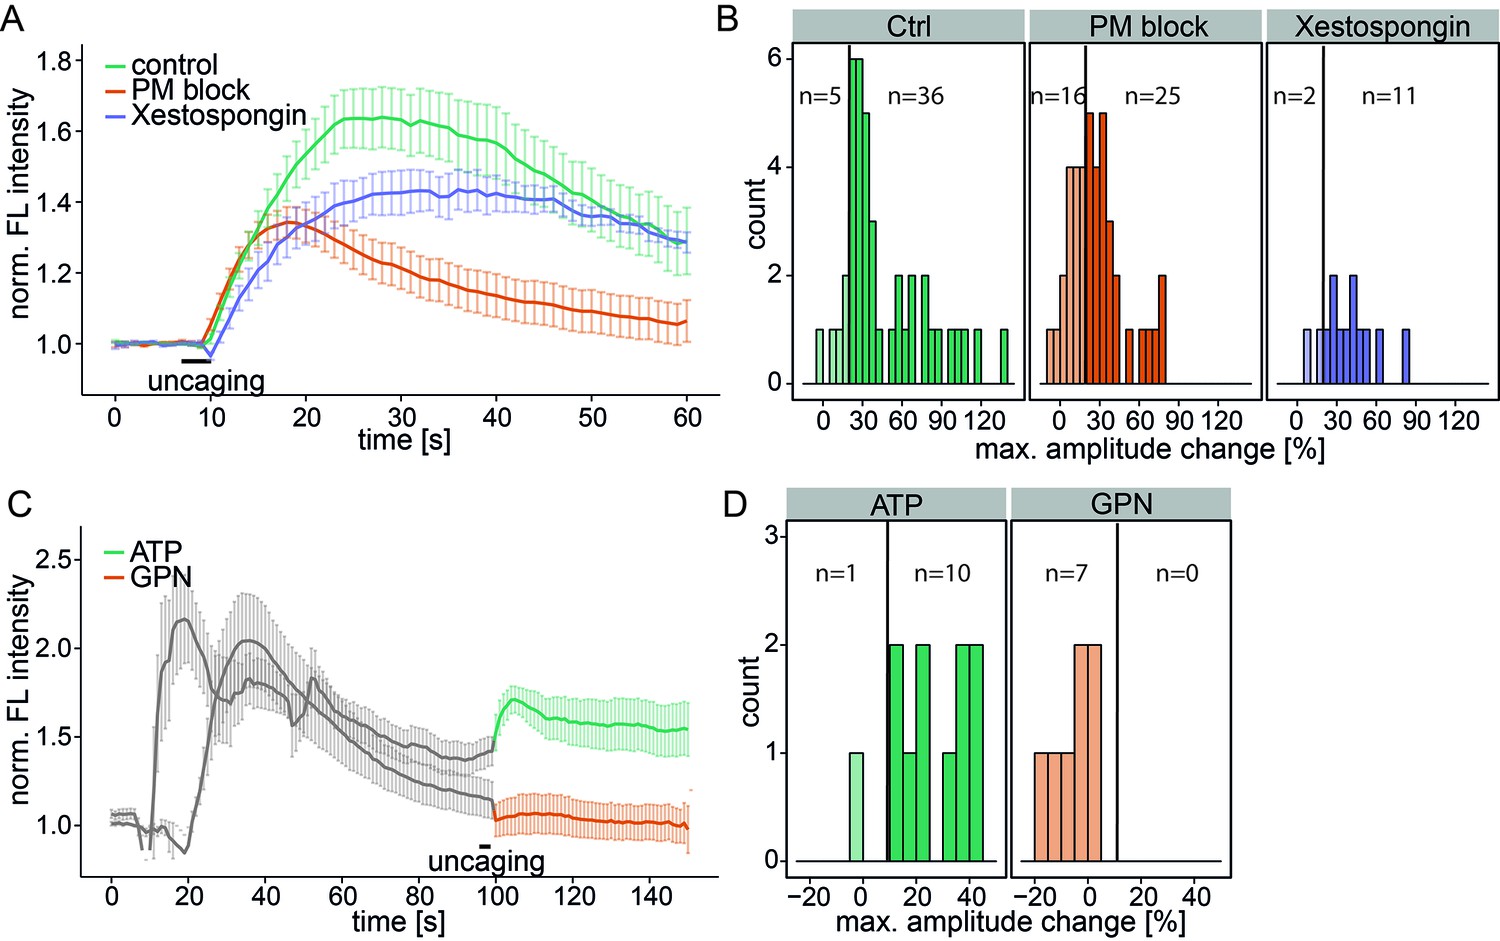
Investigating the source of Sph-induced calcium.
(A) HeLa cells were loaded with 2 µM Sph-Cou in wild-type conditions (41 cells) or in conditions inhibiting plasma membrane channels by removing extracellular calcium with ethylene glycol tetraacetic acid (EGTA) and by inhibition with 5 mM Ni2+ (PM block, 41 cells) or by blocking IP3 receptors at the ER using Xestospongin C at 25 µM (13 cells). Traces represent the mean values with the standard error of the mean plotted as error bars. (B) Histograms showing the distribution of the maximum observed amplitude change compared to baseline of all cells, with a threshold at 20%. (C) HeLa cells were loaded with 2 µM Sph-Cou. After addition of either 10 µM ATP to stimulate release of ER Ca2+ or addition of 200 µM glycyl-L-phenylalanine-beta-naphthylamide (GPN), which leads to release of Ca2+ from the acidic stores through osmotic rupture, uncaging was performed at t = 100 s after the primary calcium transient had passed, as indicated by the bar. (D) Histograms showing the distribution of the maximum observed amplitude of the calcium increase after uncaging. Since these observed effects are second calcium transients, we lowered the threshold for responding cells to 10% amplitude change over baseline.
Figure 4 with 2 supplements
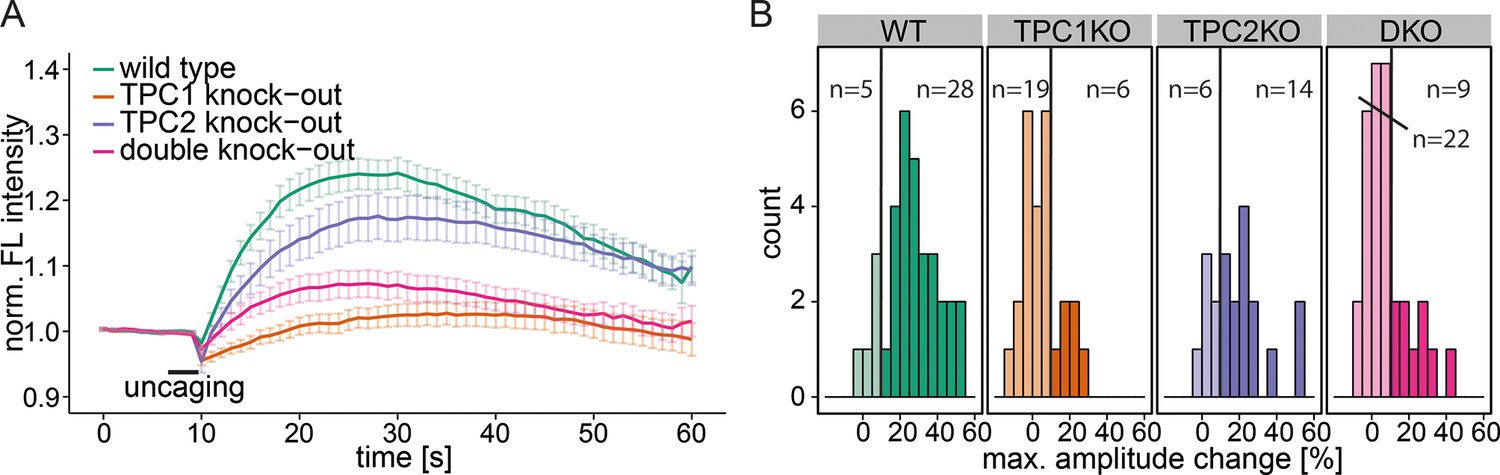
Knock-out studies of two-pore channels.
(A) Primary mouse embryonic fibroblasts derived from a wild-type mouse (33 cells) or from two-pore channel 1 (TPC1) knock-out mice (25 cells), two-pore channel 2 (TPC2, 20 cells) knock-out mice or from a double knock-out mouse (DKO, 31 cells) were loaded with 2 µM Sph-Cou and uncaged for 3 s as indicated. Traces represent the mean values with standard errors of the mean plotted as error bars. (B) Histograms showing the distribution of the maximum observed amplitude compared to baseline, with the threshold set to 10% increase over baseline.
Figure 4—figure supplement 1
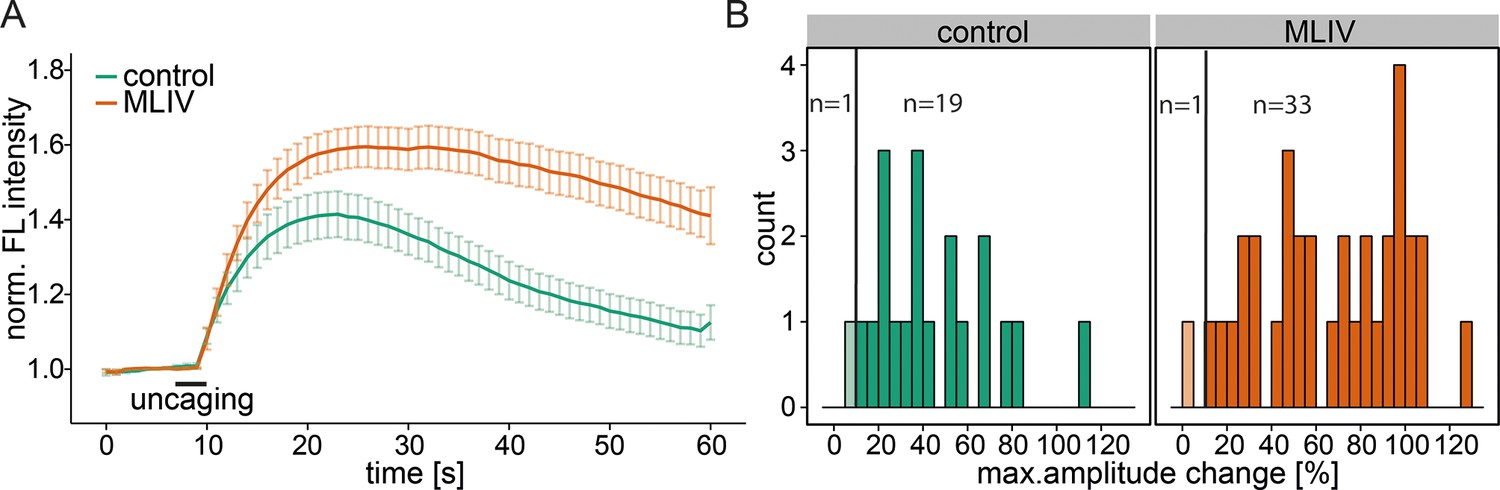
Contribution of the lysosomal calcium channel TRPML1.
(A) Human fibroblasts derived from healthy patients (control, 20 cells) or patients with mucolipidosis type IV (MLIV, 35 cells) were loaded with 2 µM Sph-Cou and uncaged for 3s as indicated. Traces represent the mean values with the standard error of the mean plotted as error bars. (B) Histograms showing the distribution of the maximum observed amplitude compared to baseline with the threshold set at 10% increase over baseline.
Figure 4—figure supplement 2
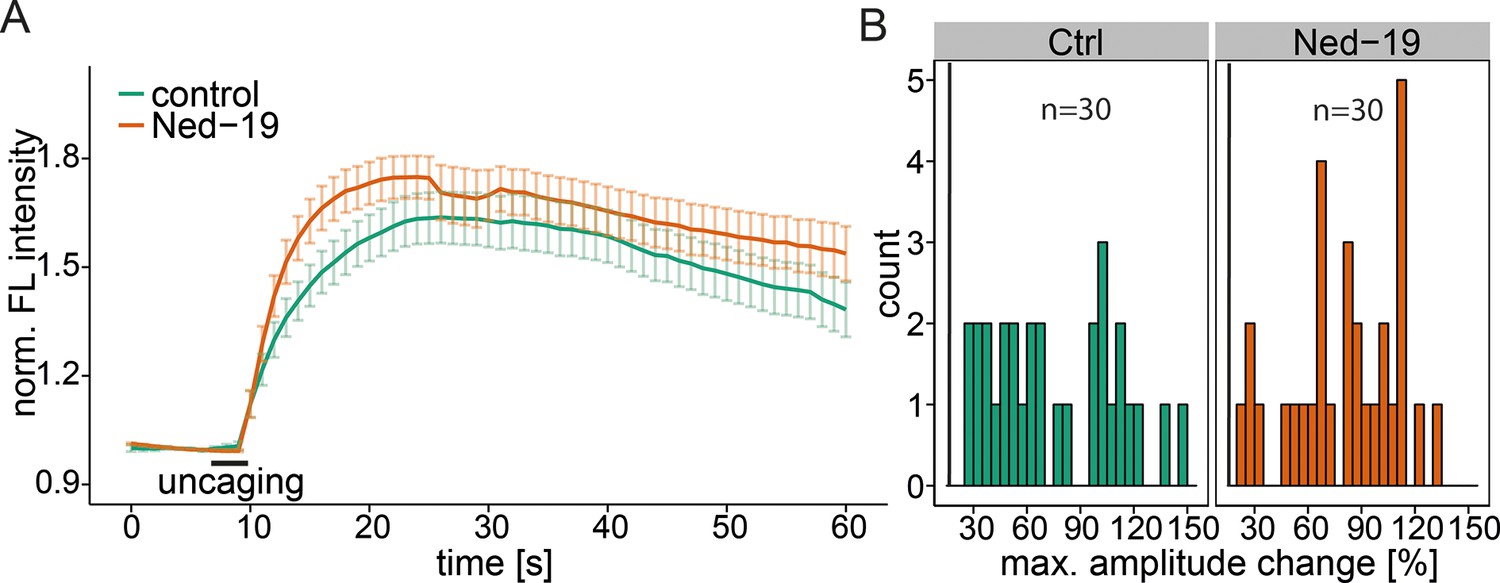
NAADP antagonist Ned-19.
(A) HeLa cells were treated with 100 µM Ned-19 for 1 h before loading with Fluo-4 (30 min) and 2 µM Sph-Cou (15 min). Uncaging was performed for 3s as indicated. Traces represent the mean values with the standard error of the mean plotted as error bars. (B) Histograms showing the distribution of the maximum observed amplitude compared to baseline with the threshold set at 20% increase over baseline.
Figure 5
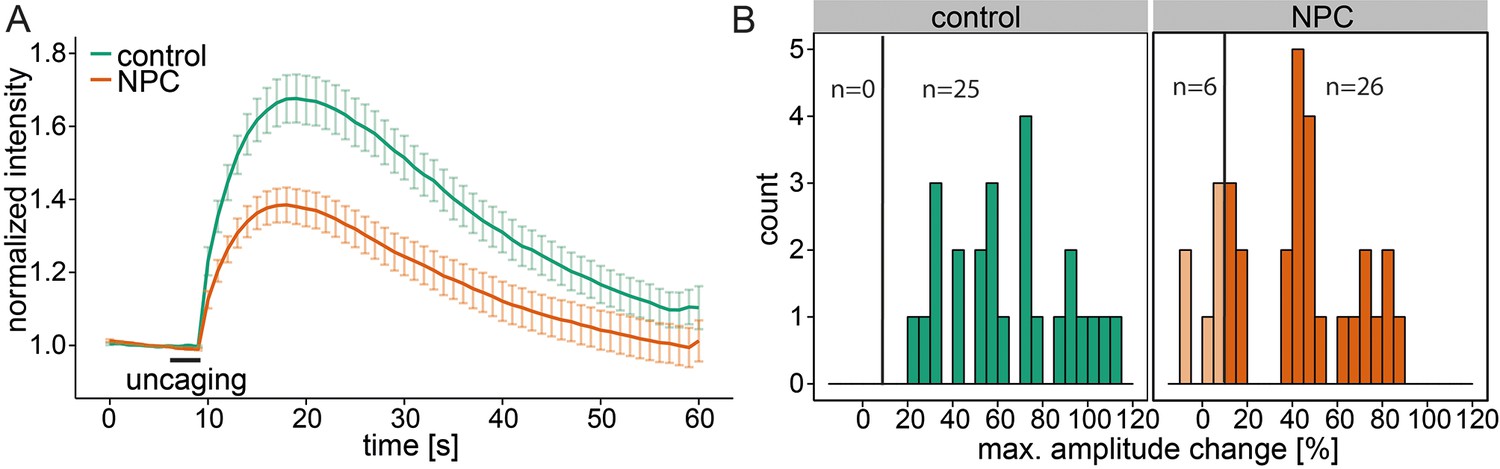
Calcium signaling in NPC disease.
(A) Human fibroblasts derived from healthy subjects (control, 25 cells) or patients with Niemann Pick disease type C (NPC, 31 cells) were loaded with 5 µM Sph-Cou (1) and uncaged for 3s as indicated. Traces represent mean values with the standard error of the mean plotted as error bars. (B) Histograms showing the distribution of the maximum observed amplitude compared to baseline of all cells with the response threshold set to 10% increase over baseline.
Figure 6 with 1 supplement
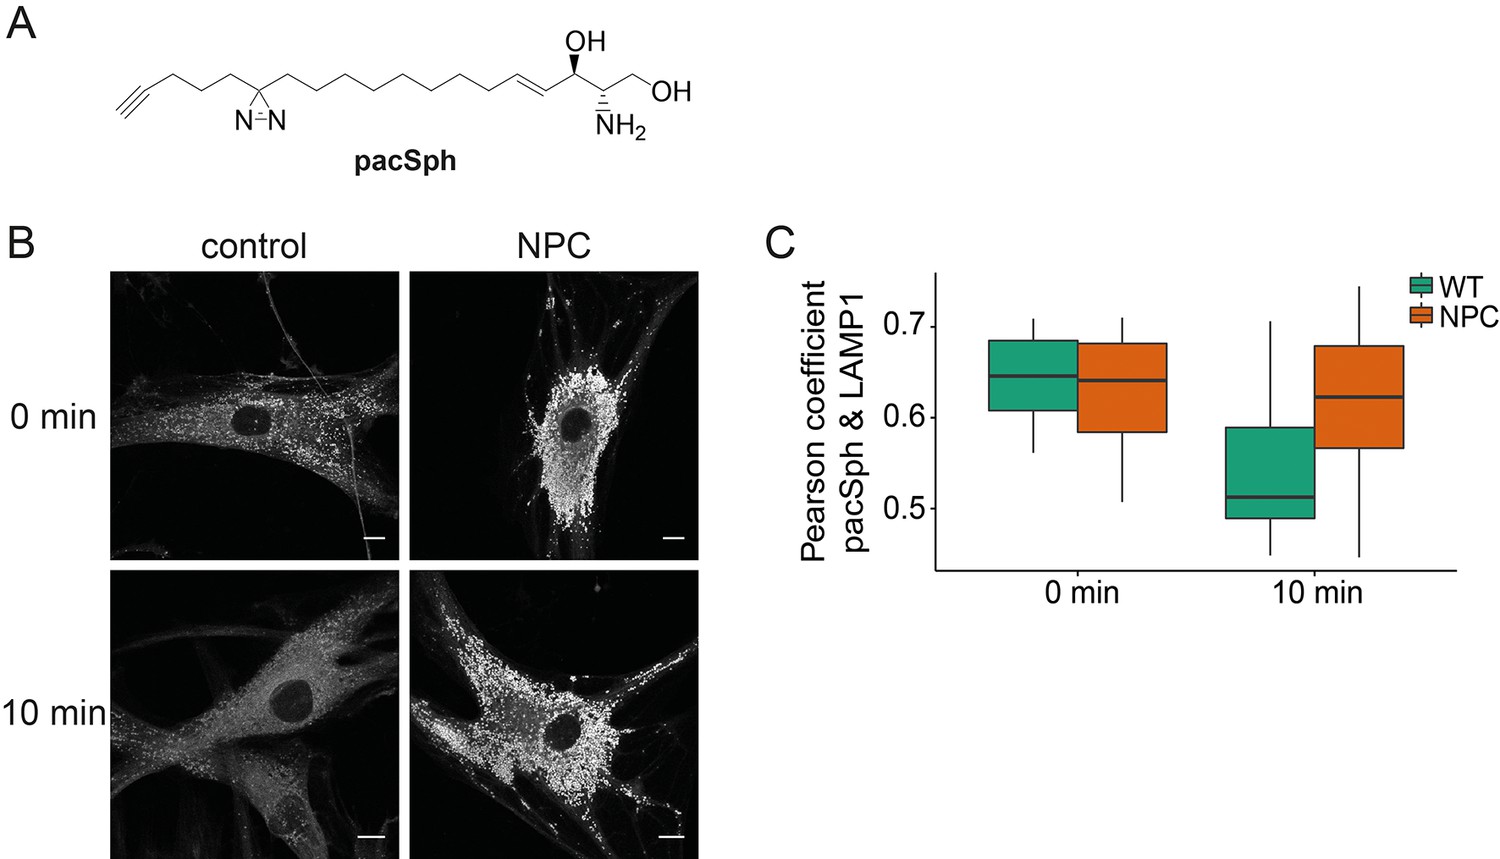
Subcellular localization of Sph.
(A) Structure of pacSph. (B) Sph distribution in control and NPC human fibroblasts. Cells were incubated with 4 µM pacSph for 10 min, washed and either immediately photo-crosslinked and fixed (0 min) or incubated for further 10 min in buffer before crosslinking and fixation. Visualization was achieved by clicking Alexa488-azide to the terminal alkyne bond of pacSph. Confocal analysis shows a striking accumulation of Sph in the late endosomes/lysosomes of the NPC fibroblasts. For co-staining with the lysosomal marker LAMP1, see Figure 6—figure supplement 1. (C) Quantification of co-localization analysis by calculating Pearson’s correlation coefficient for >6 cells in each condition.
Figure 6—figure supplement 1
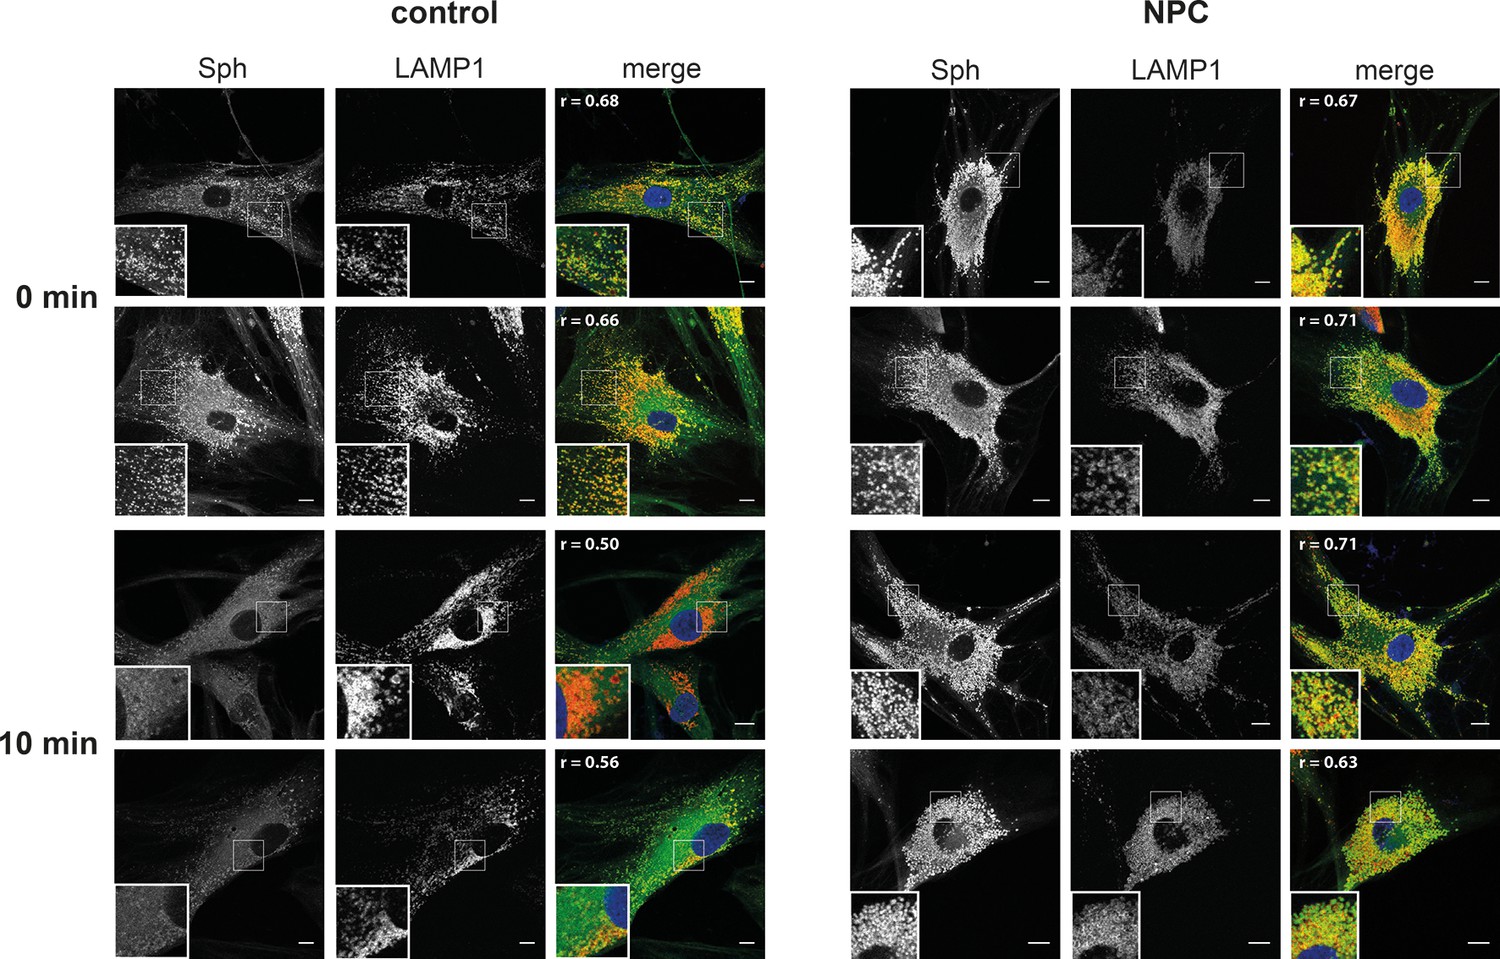
Co-localization with lysosomal markers.
Co-localization of Sph after photo-crosslinking and labeling via click chemistry with N3-Alexa 488 (green) and LAMP1 antibody/anti-rabbit antibody-Alexa555 (red). The respective single cell Pearson’s correlation coefficient r is shown in the top left corner of the merged image. Scale bar represents 10 µm.
Figure 7
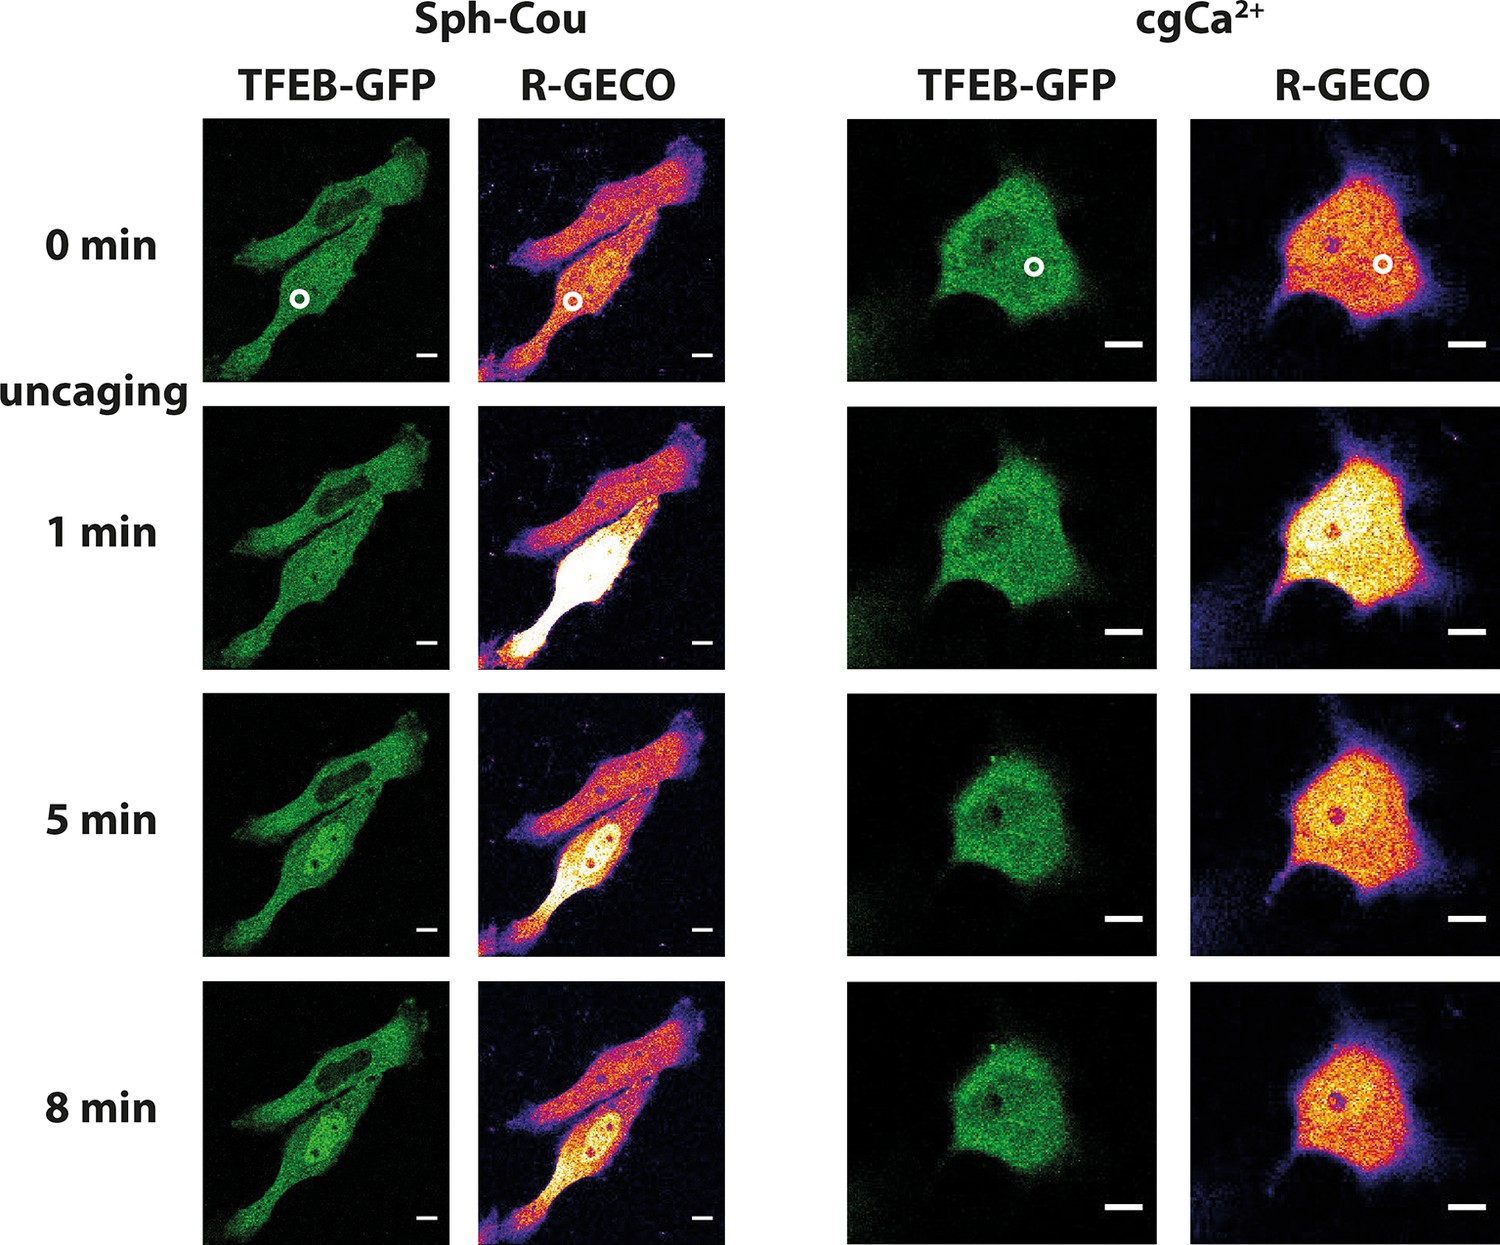
Sph uncaging leads to TFEB translocation to the nucleus.
Time-lapse confocal microscopy images of HeLa cells transfected with TFEB-GFP and R-GECO (a genetically encoded calcium sensor) and loaded with either Sph-Cou or caged calcium (o-nitrophenyl EGTA/AM). Uncaging was performed in a small area within the cell for 3 s for Sph-Cou (lower cell) and 2 s for caged calcium.
Figure 8

Schematic summary of findings.
Sph causes calcium release from acidic stores through the action of TPC1. In Niemann-Pick disease type C, lower endolysosomal calcium levels occur together with increased Sph concentration. Stimulating lysosomal calcium release by uncaging Sph in NPC patient cells results in lower calcium amplitudes compared to cells from control subjects.
Author response image 1
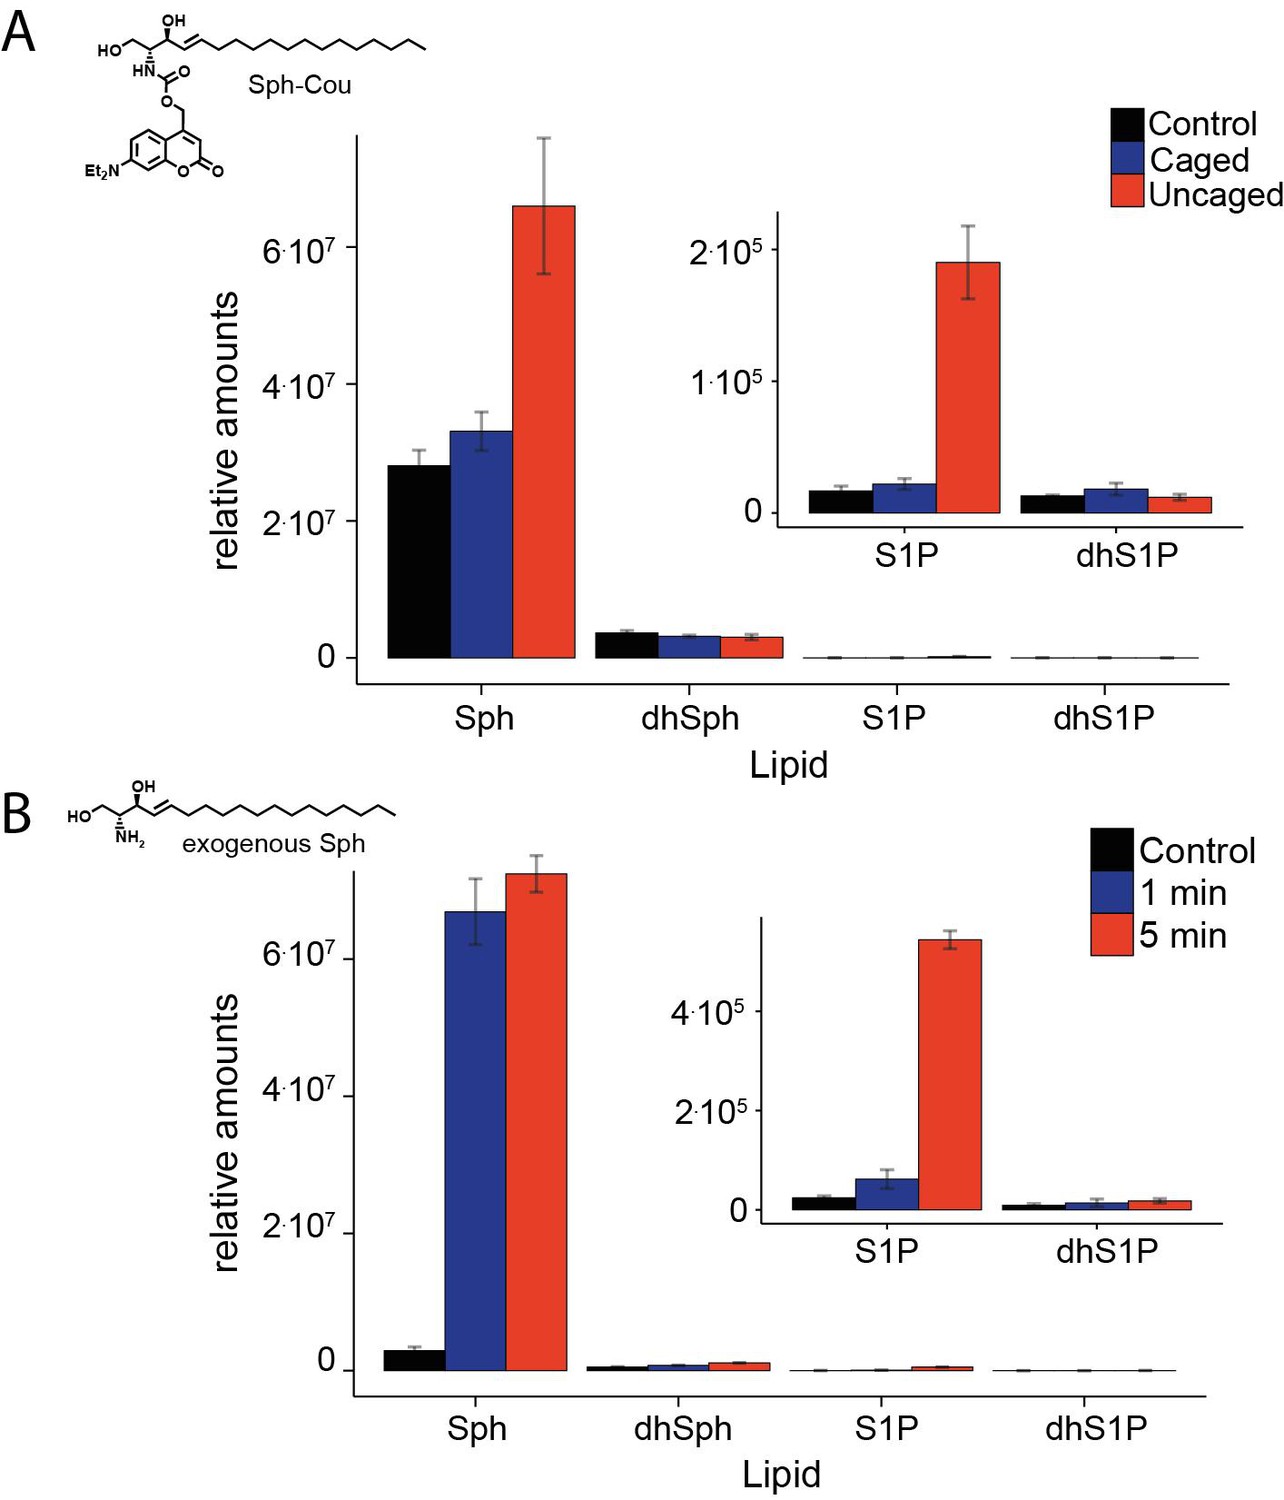
Comparative lipid analysis by mass spectrometry.
Lipid extracts of HeLa cells pulsed with (A). Sph-Cou and then uncaged or (B). upon addition of exogenous Sph were AQC derivatized and measured on a TSQ Vantage mass spectrometer. Values are normalized to the C17 internal standards.
Author response image 2
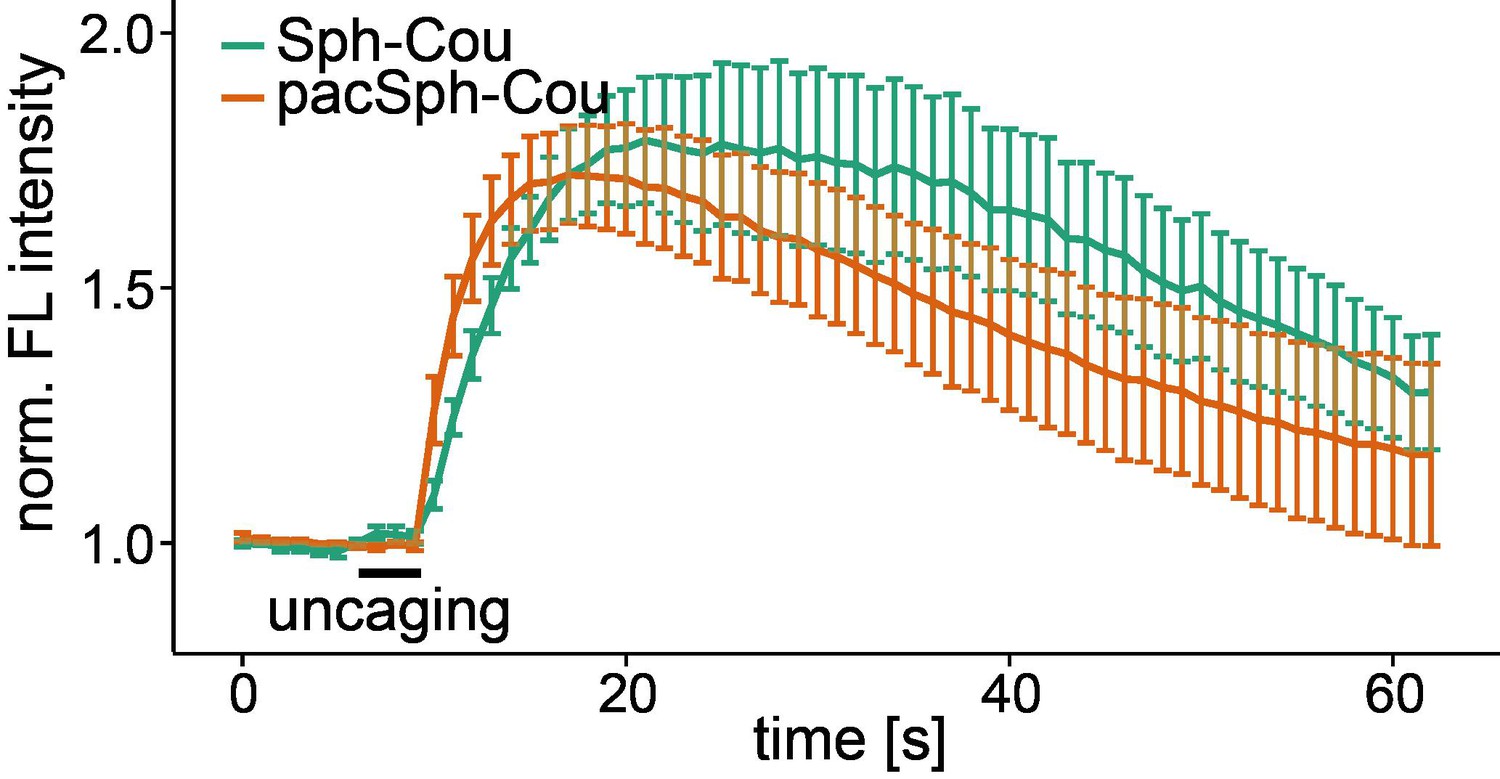
Uncaging of caged pacSph increases cytosolic calcium.
Mean Fluo-4 fluorescence traces of HeLa cells incubated with Sph-Cou or TFS. Uncaging was performed in a small circular area within the cell for 3 s as indicated by the black bar. The standard error of the mean is plotted as error bars.
Videos
Video 1
Local uncaging of Sph leads to calcium transients.
Time-lapse movie of HeLa cells loaded with the calcium indicator Fluo-4 and treated with Sph-Cou. Cells were uncaged a t = 7 s for 3 s and the Fluo-4 fluorescence was recorded.
Download links
A two-part list of links to download the article, or parts of the article, in various formats.
Downloads (link to download the article as PDF)
Open citations (links to open the citations from this article in various online reference manager services)
Cite this article (links to download the citations from this article in formats compatible with various reference manager tools)
Intracellular sphingosine releases calcium from lysosomes
eLife 4:e10616.
https://doi.org/10.7554/eLife.10616


