Recurrent mutations drive the rapid evolution of pesticide resistance in the two-spotted spider mite Tetranychus urticae
- Institute of Plant Protection, Beijing Academy of Agriculture and Forestry Sciences, China
- Bio21 Institute, School of BioSciences, University of Melbourne, Australia
- Biosciences, University of Exeter, United Kingdom
- Department of Entomology, College of Plant Protection, China Agricultural University, China
- College of Plant Science and Technology, Beijing University of Agriculture, China
- Hebei North University, College of Agriculture and Forestry Technology, China
- Institute of Insect Science, Zhejiang University, China
Figures
Figure 1
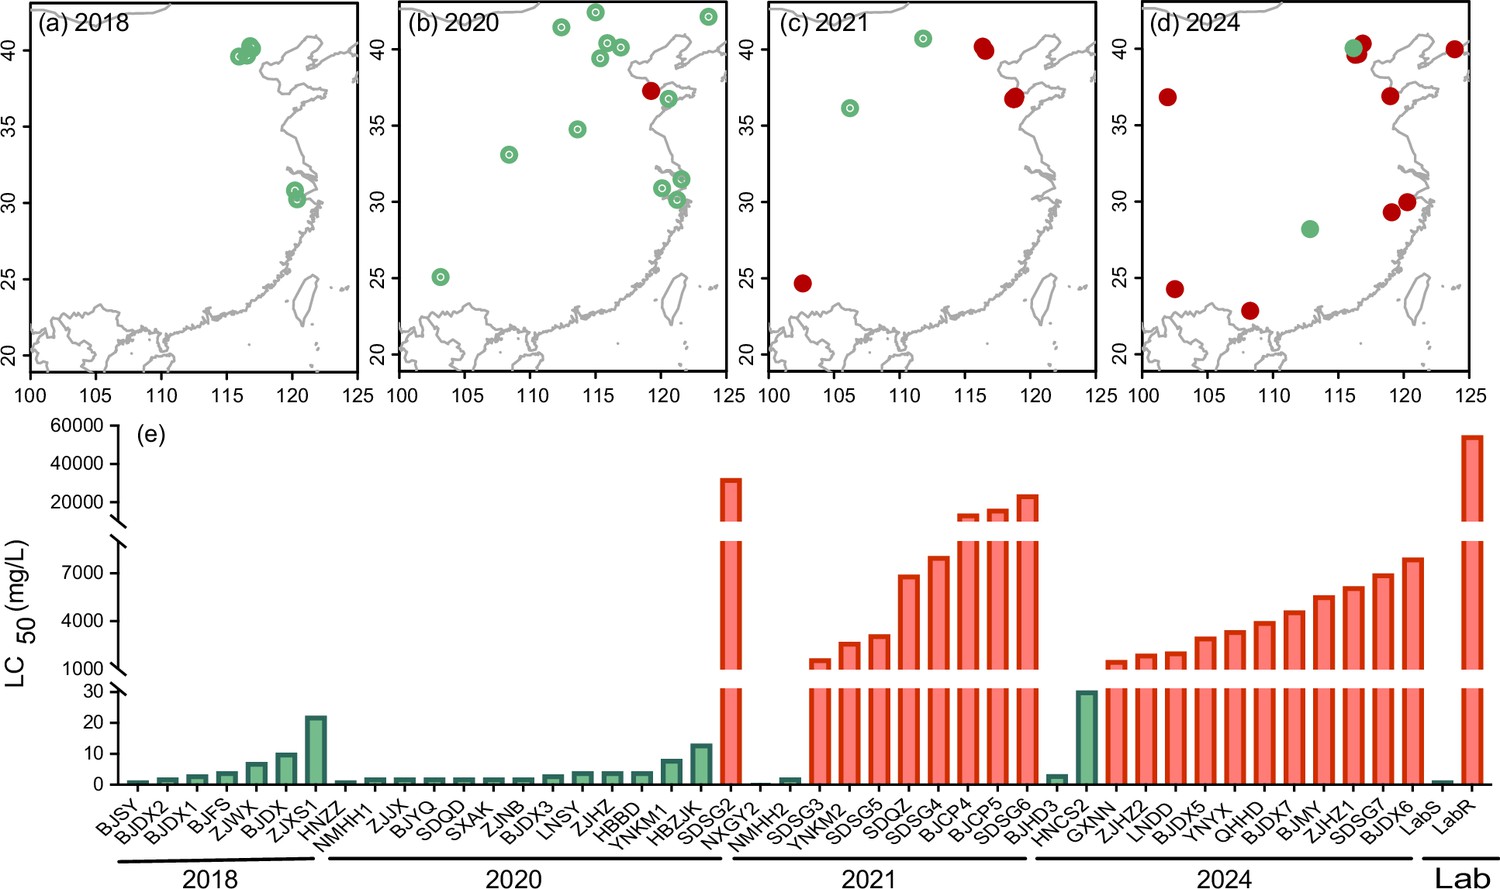
Susceptibility of the two-spotted spider mite Tetranychus urticae to cyetpyrafen.
(a–d) Collection maps of populations used for bioassay in different years. Red and green points represent resistant and susceptible populations, respectively. (e) LC50 values of each population collected in 2018 (7 populations) (Chen et al., 2019), 2020 (14), 2021 (10), 2024 (13), and a laboratory-selected resistant population (LabR) and a parallel reared susceptible population (LabS) to cyetpyrafen. The green bars show the susceptible populations, while the red bars show the resistant populations.
Figure 2 with 2 supplements
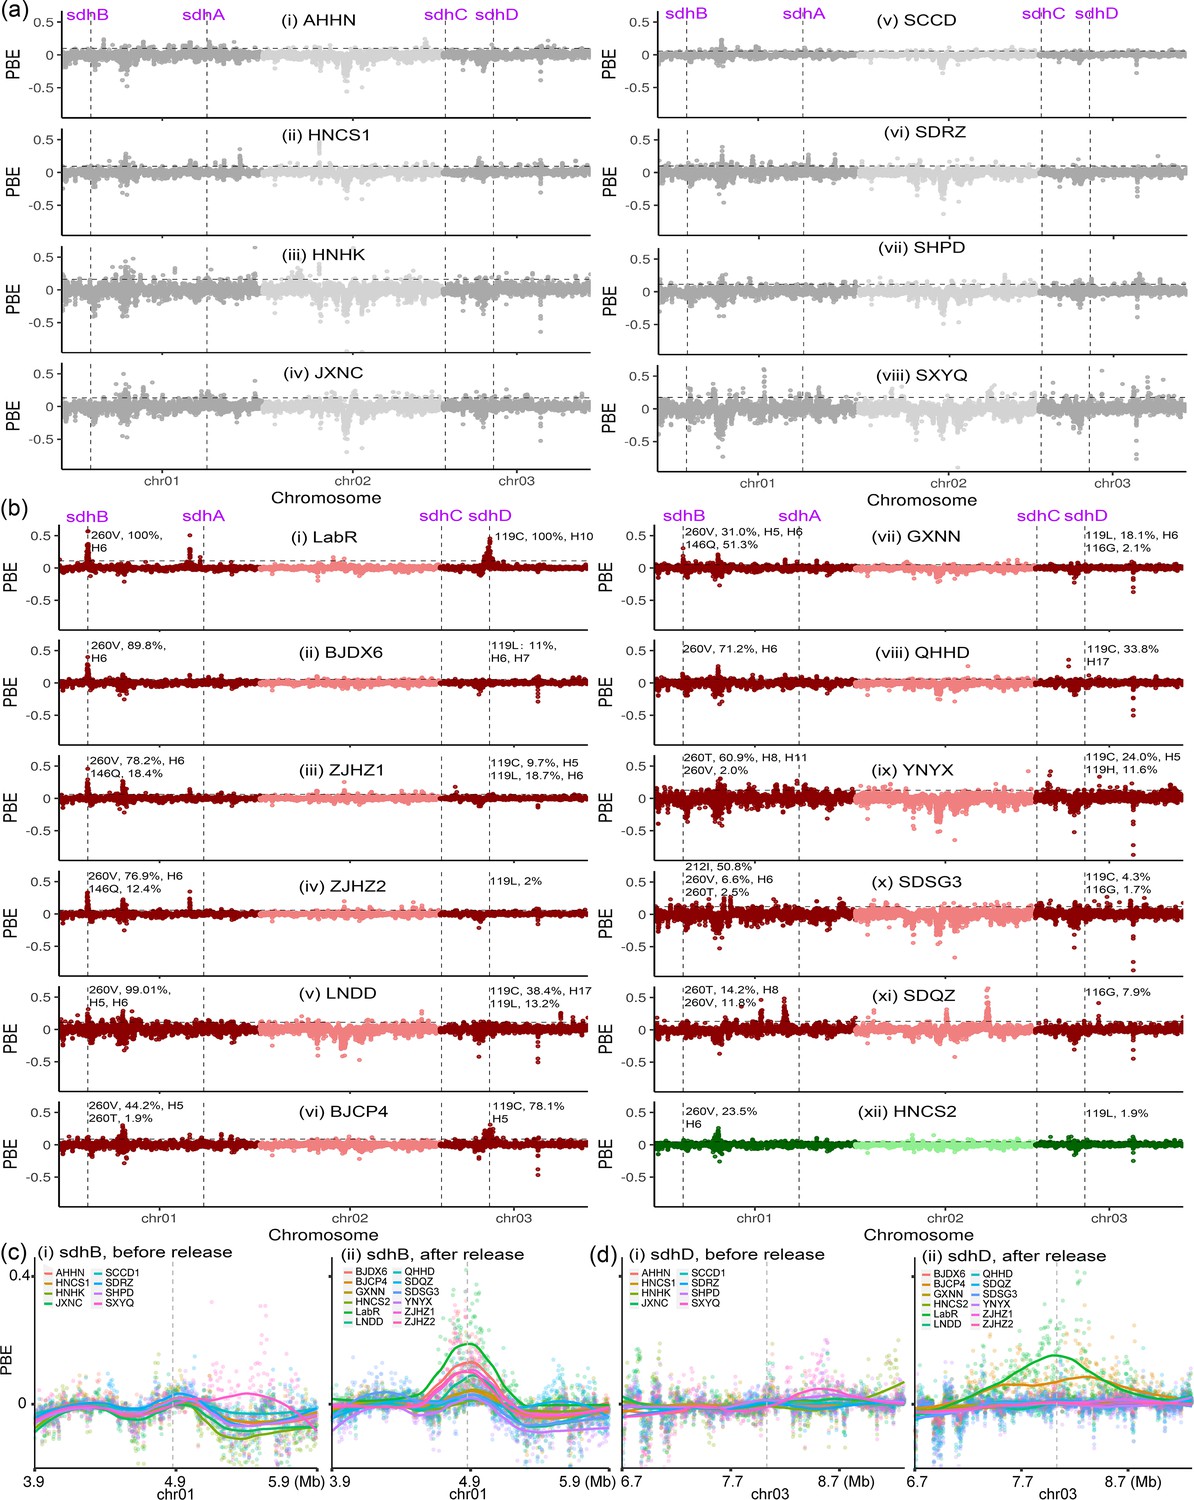
Signals of selective sweep across genomes of the two-spotted spider mite Tetranychus urticae.
(a) PBE values across the genome for eight historic populations collected in 2017 before the commercial release of cyetpyrafen. No clear and consistent selection signal was identified among these samples. Chromosomes are colored alternately dark gray and light gray. (b) PBE values for one lab-selected resistant population (LabR), 10 resistant field populations, and one susceptible population (HNCS) collected in 2021 and 2024 after the release of cyetpyrafen. The laboratory-selected resistant LabR population had clear selection signals at two genes, sdhB and sdhD. Four (BJDX6, ZJHZ1, ZJHZ2, and LNDD) field-collected resistant populations had selection signals at sdhB, and one (BJCP4) had a selection signal at sdhD. Chromosomes are colored alternately dark red and light red for resistant populations, dark green and light green for susceptible population HNCS. Allele frequency (pool-seq data) and haplotypes of mutations are indicated near the corresponding sdhB and sdhD genes of each population in (a) and (b). (c) PBE values for genomic regions around the sdhB gene, comparing values between the historic (left) and recently collected (right) populations. (d) As above but for the sdhD gene. Each point represents a genomic window of 5-kp wide when compared to reference genomes involving the susceptible laboratory line (LabS) and a susceptible field population (NMHH2). The vertical lines indicate the position of sdh genes, while the horizontal lines represent the 1% threshold of PBE values.
Figure 2—figure supplement 1
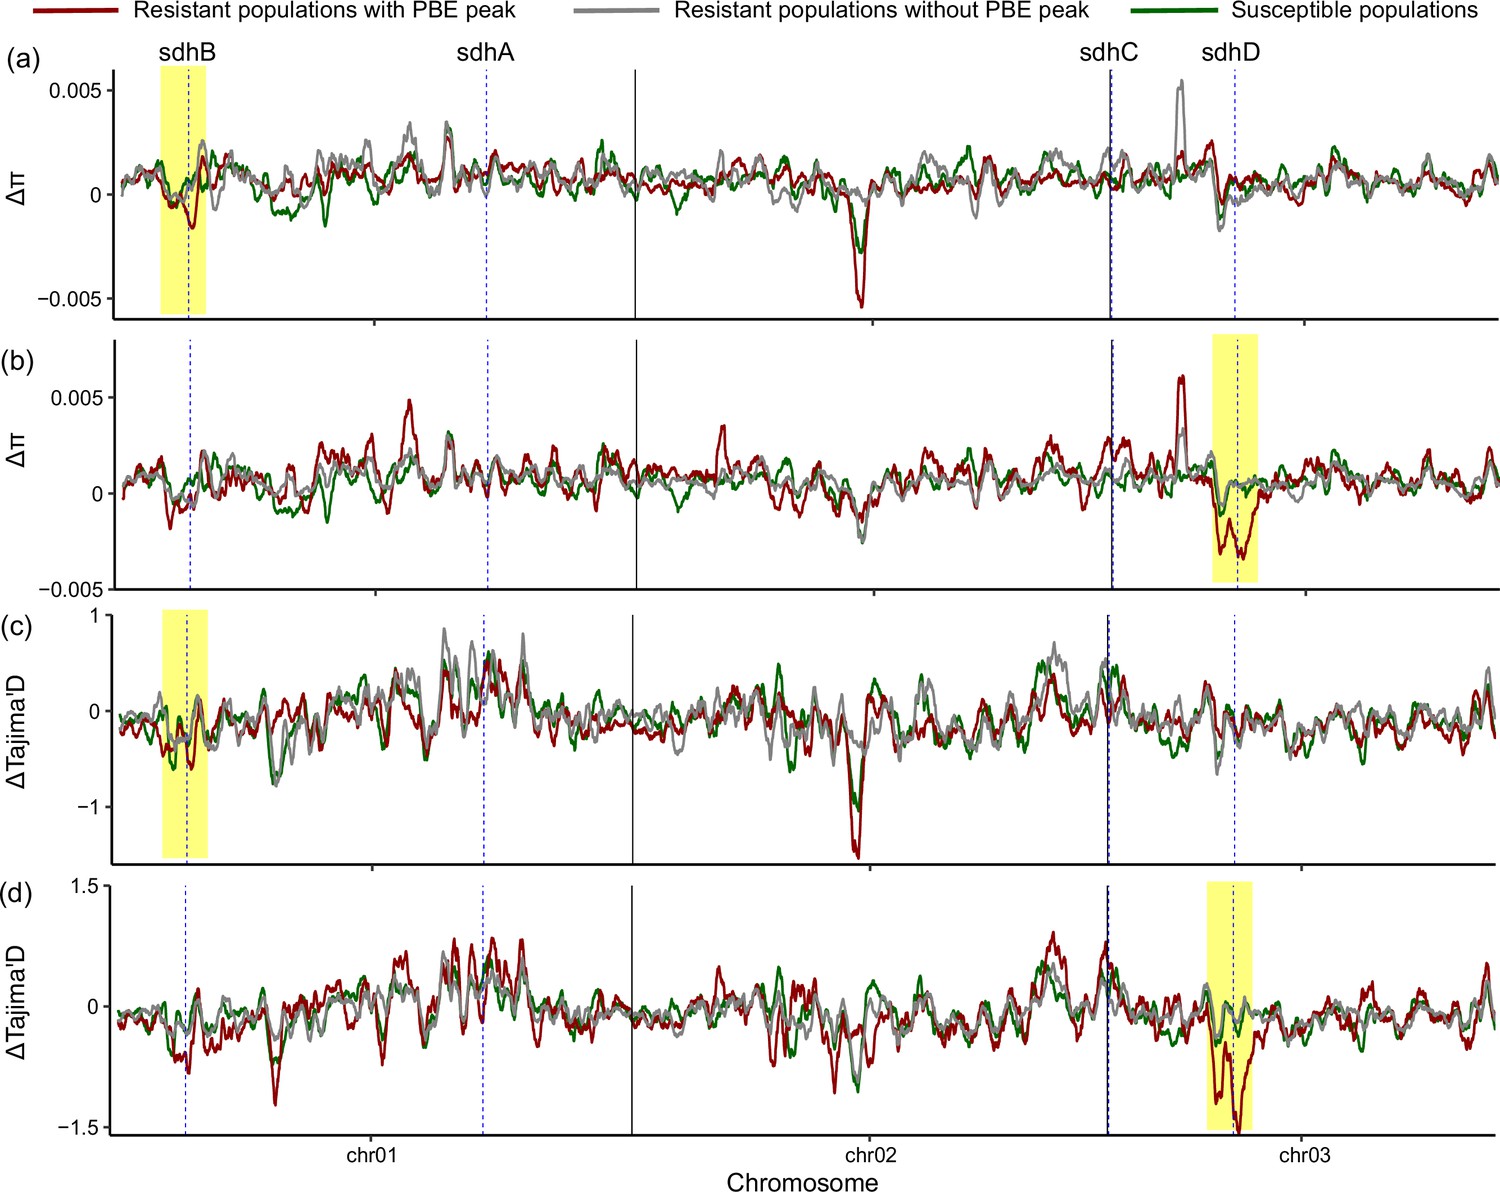
Moving average of delta nucleotide diversity (a - b) and delta Tajima’s D values (c - d) along chromosomes.
Delta π and Tajima’s D represent the difference in nucleotide diversity (π) and Tajima’s D value, respectively, between three field population groups collected before the commercial release of cyetpyrafen and the field populations collected after the release. Lines with different colors represent moving averages of 100 genomic windows of 5 kbp wide in three population groups. The red lines indicate four (a, c) or one field-collected resistant population (b, d) with a clear peak around sdhB or sdhD genes in Figure 2b, while the gray points and lines indicate seven or ten field-collected resistant populations without a peak around sdhB or sdhD genes in Figure 2b. The green lines represent two susceptible populations. The vertical dashed lines show the position of SDH genes. Signals of selection sweep, characterized by decreased nucleotide diversity and Tajima’s D values, were observed in resistant populations (red lines), with the selection signal identified by PBE analysis in Figure 2b.
Figure 2—figure supplement 2
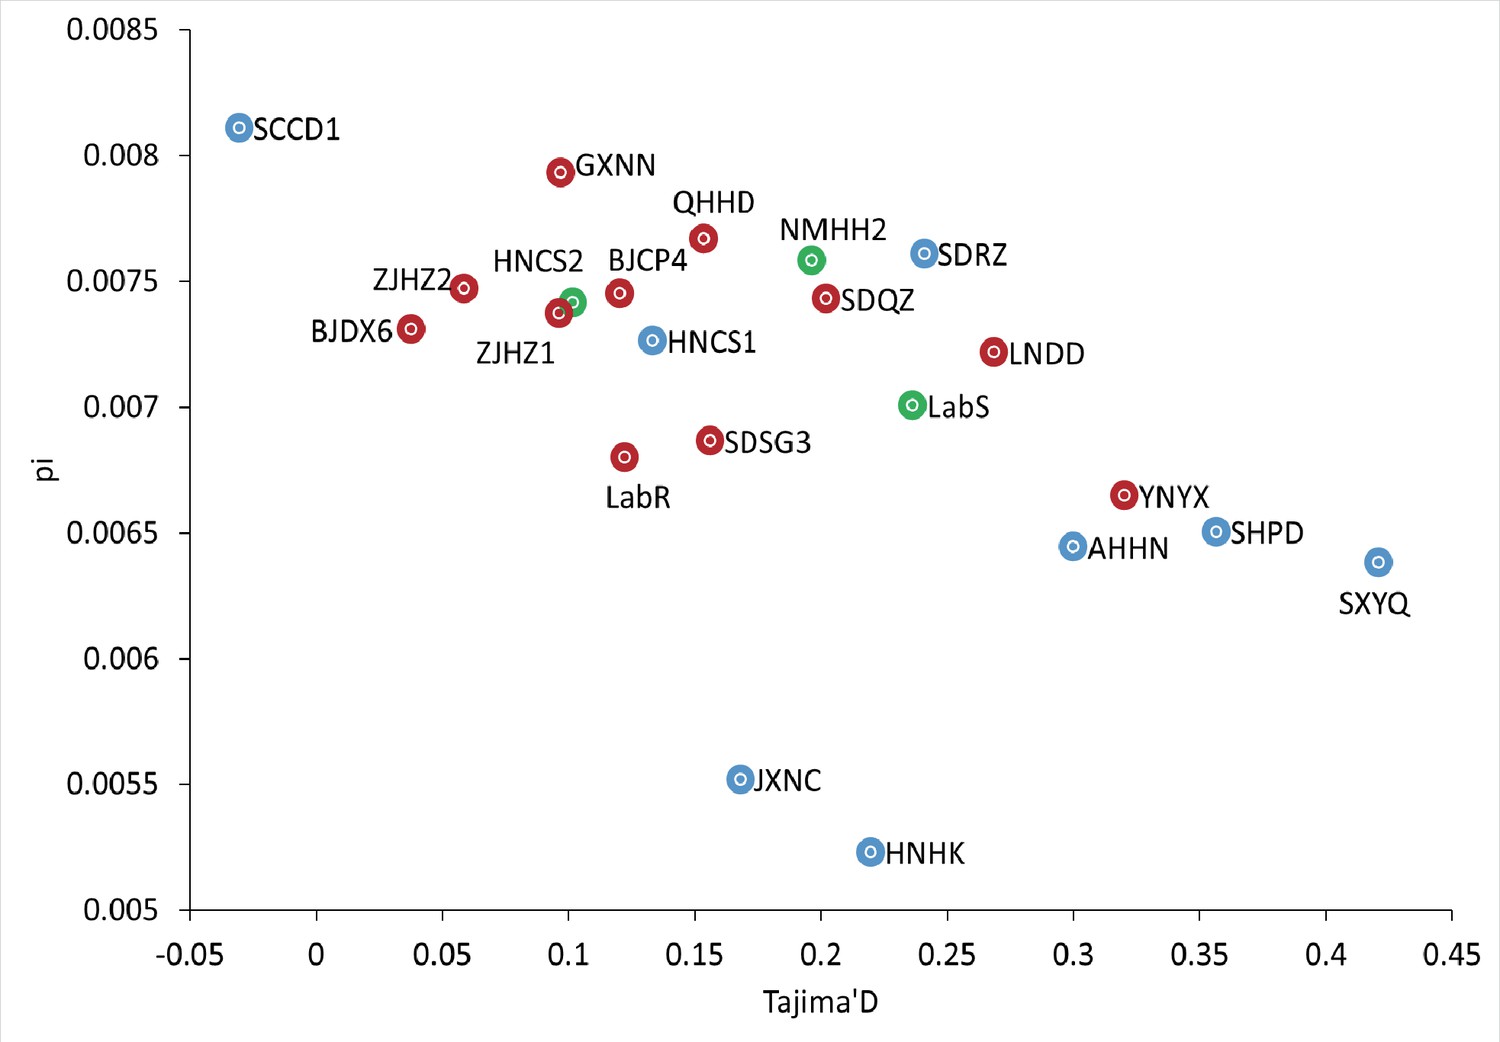
Scatter plot of average genome-wide nucleotide diversity (π) and Tajima’s D per population.
The red points, green points, and blue points indicate resistant populations, susceptible populations, and populations collected before the commercial release of cyetpyrafen, respectively.
Figure 3 with 1 supplement
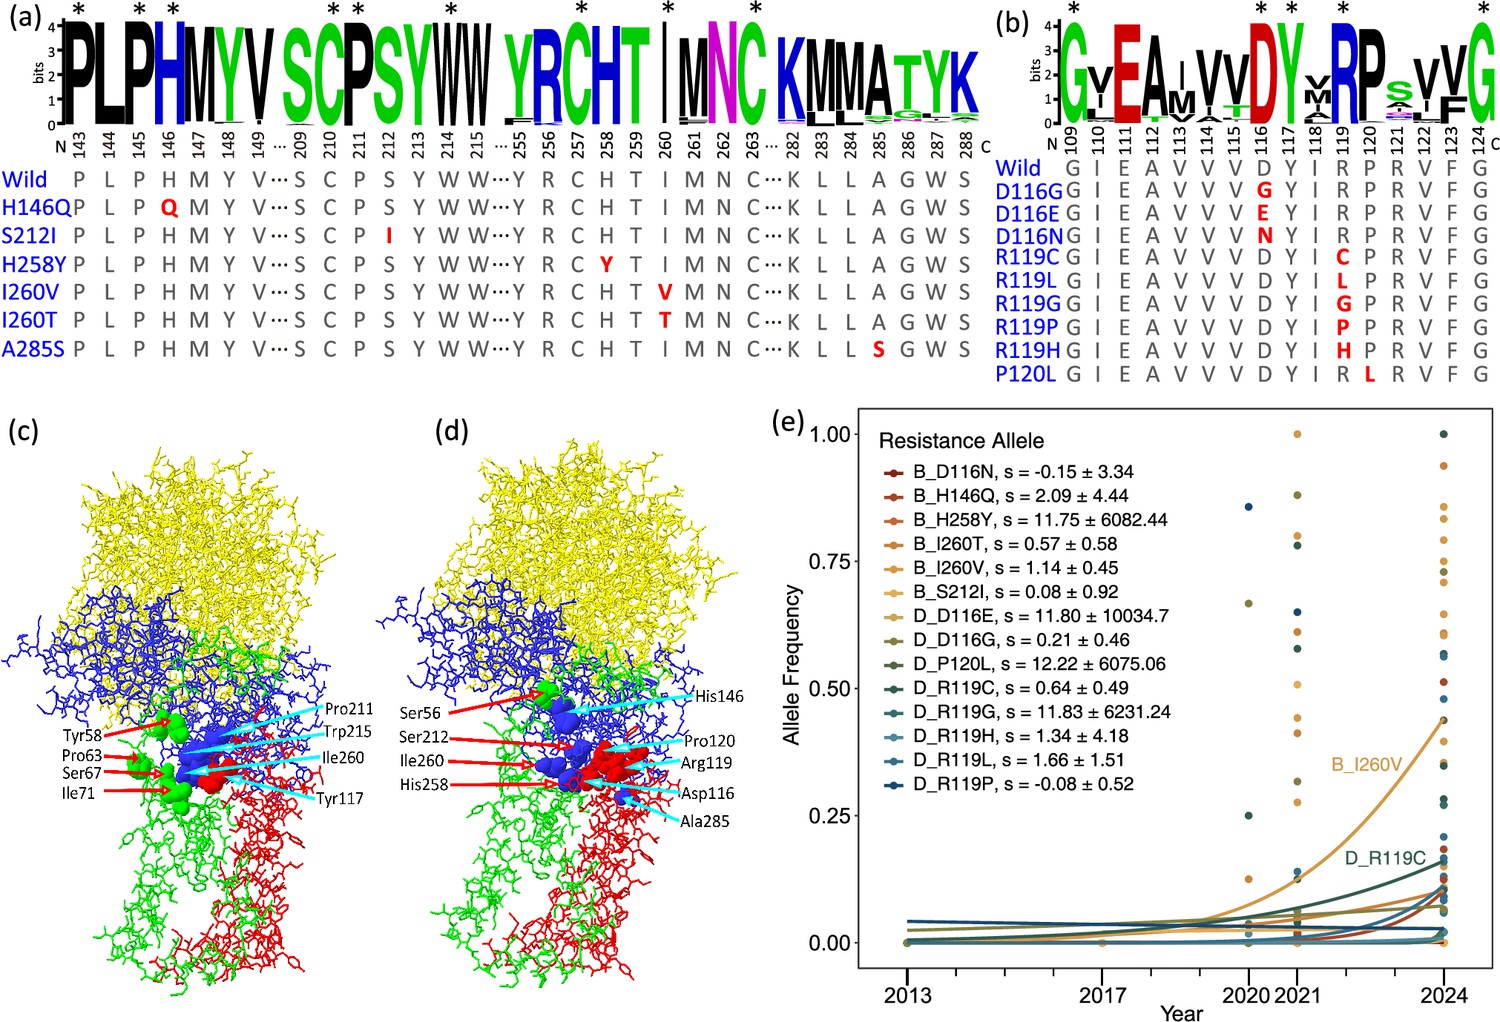
Amino acid mutations on sdhB and sdhD genes in populations of the two-spotted spider mite Tetranychus urticae.
(a, b) Sequence logos at mutations related to cyetpyrafen resistance in sdhB (a, 757 sequences) and sdhD (b, 158 sequences). The numbers under logos indicate the position of amino acid residues on protein chains. Excluding T. urticae, conserved amino acids without any alternative are labeled with asterisks. Amino acids of T. urticae are shown below. Amino acids in red indicate mutations. (c) 3D structure of the wild-type succinate dehydrogenase of T. urticae. Solid 3D shapes show eight amino acid residues at the Q-site, which is the binding site of cyetpyrafen. The sdhA, sdhB, sdhC, and sdhD chains are shown in yellow, blue, green, and red, respectively. (d) Amino acid mutation sites on a 3D structure of the wild-type succinate dehydrogenase of T. urticae. Solid 3D shapes indicate mutations on five residues identified in this study (His258, Ile260, Asp116, Arg119, and Pro120) and one residue (Ser56) reported by previous studies (Njiru et al., 2022; Sugimoto et al., 2020) that confer resistance to SDH inhibitors. (e) The trajectory of allele frequencies of resistance mutations through time fitted by logistic regression. Each dot represents one population. A258S was omitted as it was only present in one population (SDRZ) sampled in 2017.
Figure 3—figure supplement 1

Correlation between allele frequencies genotyped by Sanger sequencing and pool-seq.
Figure 4 with 1 supplement
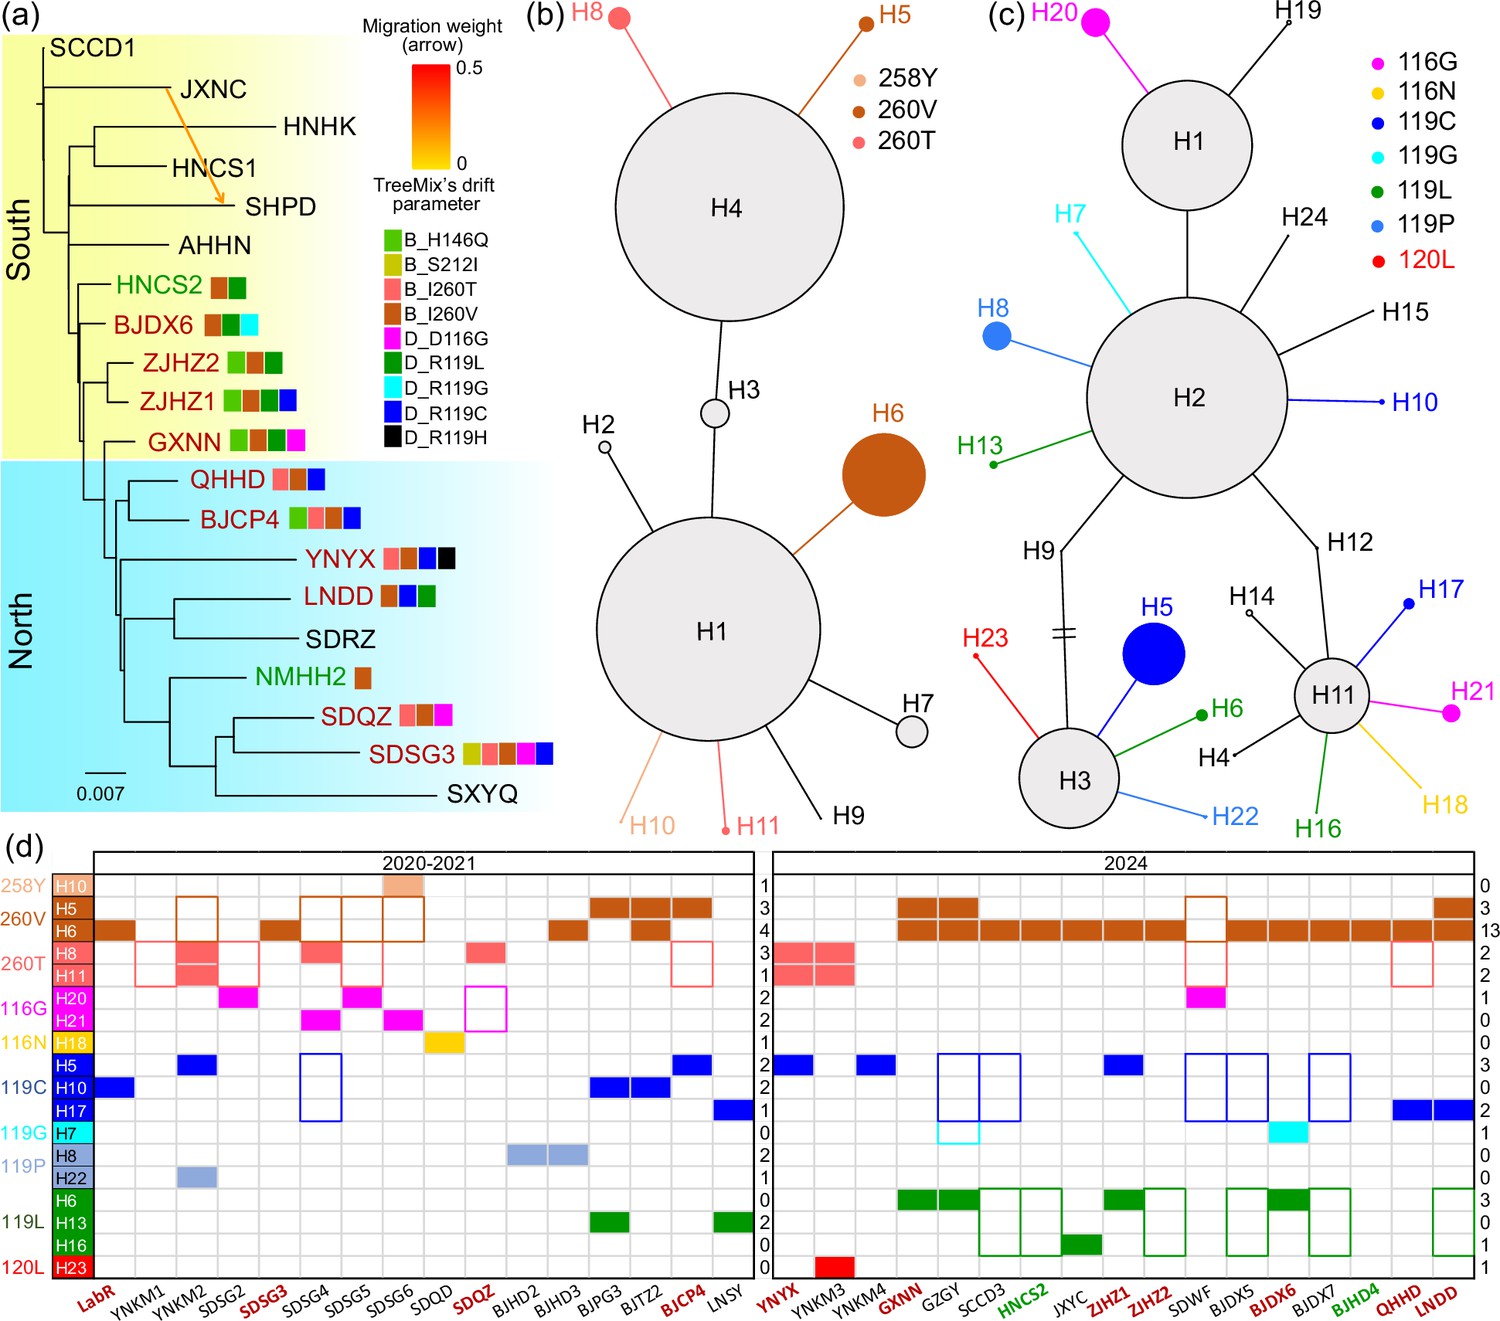
Genetic structure and haplotype networks of sdhB and sdhD genes of the two-spotted spider mite Tetranychus urticae.
(a) Treemix result showing genetic structure and gene flow among populations. The mutations detected by pool-seq data were labeled near the corresponding population. (b) Haplotype network of sdhB gene inferred from homozygous individuals. In figures (a) and (d), the red population codes show resistant populations, the green ones show susceptible populations, while the black ones show populations of unknown resistance status. (c) Haplotype network of sdhD gene inferred from homozygous individuals. The colored haplotypes are those carrying the resistant mutation. (d) Presence of each haplotype carrying the target mutations in two periods. In the early resistance development stage of 2020–2021, each haplotype was mainly distributed across a limited range, while in 2024, the same haplotype was distributed across a wide geographical range. The filled rectangle indicates that the entire haplotype is present in the population, while a colored border suggests that only the mutations were detected, but the haplotype was not assigned. The number of populations carrying the corresponding mutation is listed in the right column for the two time periods.
Figure 4—figure supplement 1
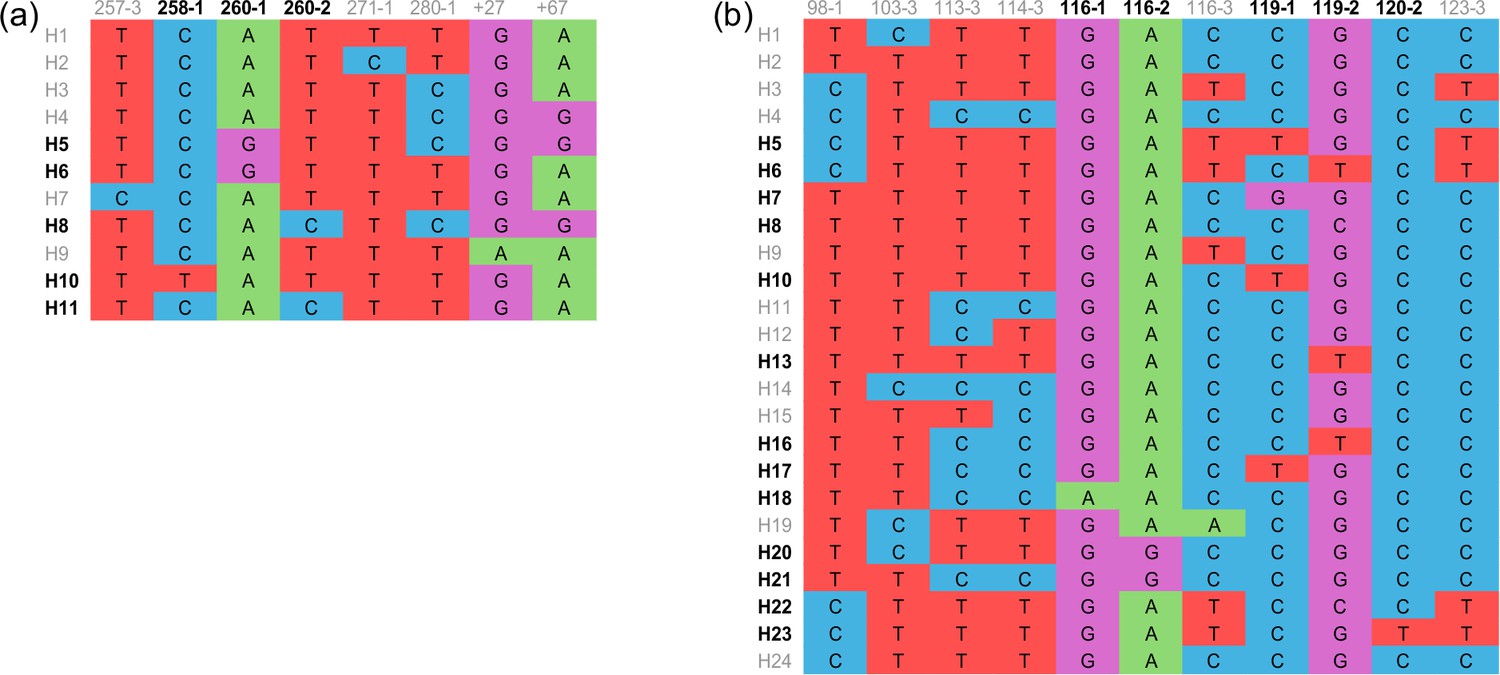
Haplotypes of sdhB (a) and sdhD (b) genes.
(a) and (b) Alignment of haplotypes for sdhB and sdhD genes. Only variant sites are displayed. Nucleotide sites are numbered according to the amino acid position they coded for, followed by the number of the codon positions. The codes of haplotypes carrying nonsynonymous mutation sites are in dark, while codes of haplotypes carrying synonymous mutation sites are in gray.
Figure 5
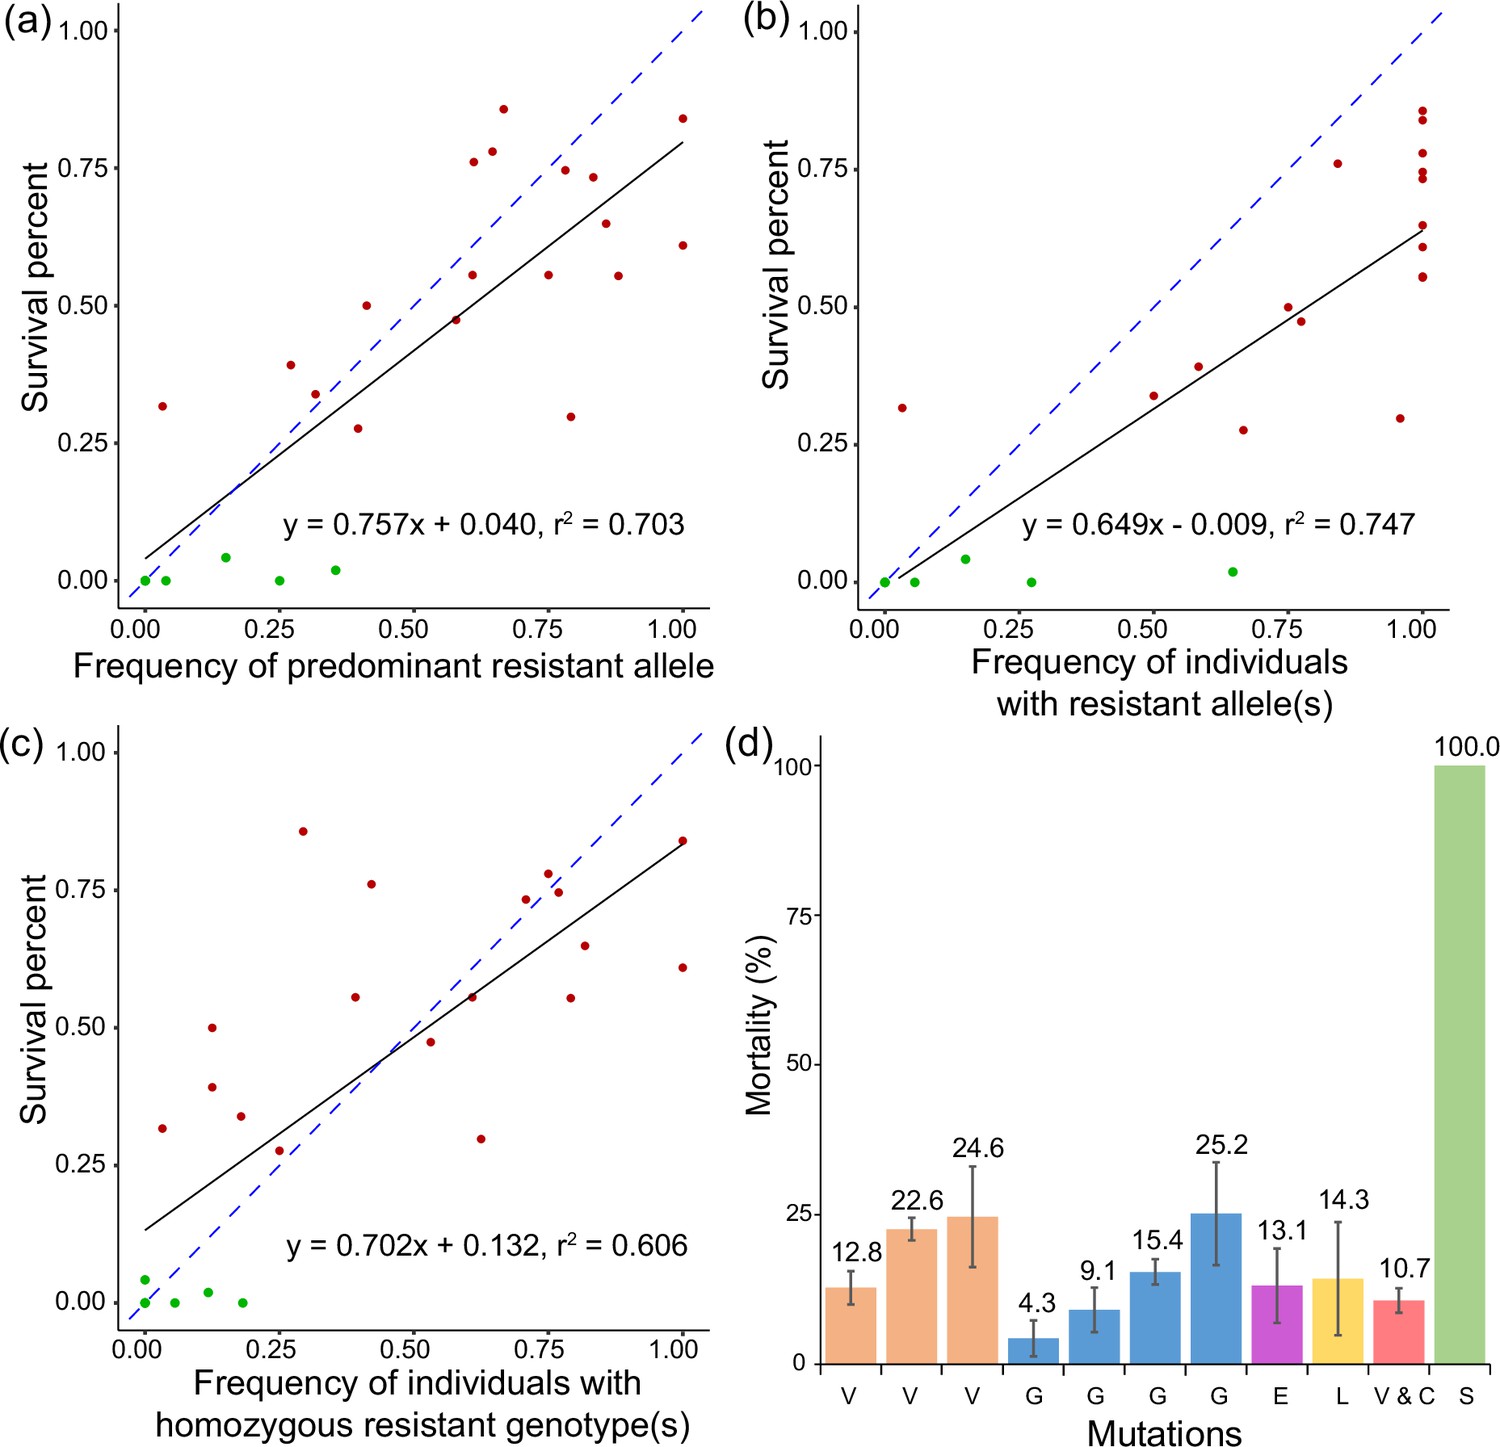
Function of target-site mutations in the sdhB and sdhD genes and survival of two-spotted spider mite Tetranychus urticae in cyetpyrafen resistance.
(a–c) Association between frequency of target-site mutations in the sdhB and sdhD genes and survival of two-spotted spider mite T. urticae exposed to 1000 mg/L of cyetpyrafen. (a) Allele frequencies are measured as the predominant mutation in the population at either the sdhB or sdhD genes. (b) Allele frequency is the proportion of individuals carrying a resistant allele at either the sdhB or sdhD genes. (c) Allele frequency is the proportion of individuals carrying a homozygous genotype for either the sdhB or sdhD genes. Red and dark green points represent resistant and susceptible populations, respectively. Blue dashed lines indicate the expected association between two variables, i.e. y=x. (d) Mortality of mite lines carrying one of the homozygous mutations or a combination of two mutations exposed to 1000 mg/L of cyetpyrafen. V, I260V; G, D116G; E, R119E; L, R119L; V and C, I260V and R119C; S, susceptible populations LabS. Populations with the same homozygous mutations are shown in the same color. Error bars show standard error of the mean.
Additional files
-
MDAR checklist
- https://cdn.elifesciences.org/articles/106288/elife-106288-mdarchecklist1-v1.docx
-
Supplementary file 1
Population information of the two-spotted spider mite Tetranychus urticae used in this study.
- https://cdn.elifesciences.org/articles/106288/elife-106288-supp1-v1.docx
-
Supplementary file 2
Mutant allele frequency (Sanger / pooled sequencing) and susceptibility of the two-spotted spider mites Tetranychus urticae to cyetpyrafen.
- https://cdn.elifesciences.org/articles/106288/elife-106288-supp2-v1.docx
-
Supplementary file 3
Laboratory selection and cross-resistance of Tetranychus urticae.
- https://cdn.elifesciences.org/articles/106288/elife-106288-supp3-v1.docx
-
Supplementary file 4
Sequencing information and genetic diversity of 22 populations of the two-spotted spider mite Tetranychus urticae.
- https://cdn.elifesciences.org/articles/106288/elife-106288-supp4-v1.docx
-
Supplementary file 5
Distribution of haplotypes carrying amino acid mutations in populations.
- https://cdn.elifesciences.org/articles/106288/elife-106288-supp5-v1.docx
-
Supplementary file 6
Correlation between eight mutations on SDH genes and level of resistance (survival percentages under 1000 mg/L).
- https://cdn.elifesciences.org/articles/106288/elife-106288-supp6-v1.docx
Download links
A two-part list of links to download the article, or parts of the article, in various formats.
Downloads (link to download the article as PDF)
Open citations (links to open the citations from this article in various online reference manager services)
Cite this article (links to download the citations from this article in formats compatible with various reference manager tools)
Recurrent mutations drive the rapid evolution of pesticide resistance in the two-spotted spider mite Tetranychus urticae
eLife 14:RP106288.
https://doi.org/10.7554/eLife.106288.3


