Population-level morphological analysis of paired CO2- and odor-sensing olfactory neurons in D. melanogaster via volume electron microscopy
- Department of Neurobiology, University of California, San Diego, United States
- National Center for Microscopy and Imaging Research, Center for Research in Biological Systems, University of California, San Diego, United States
Figures
Figure 1 with 1 supplement
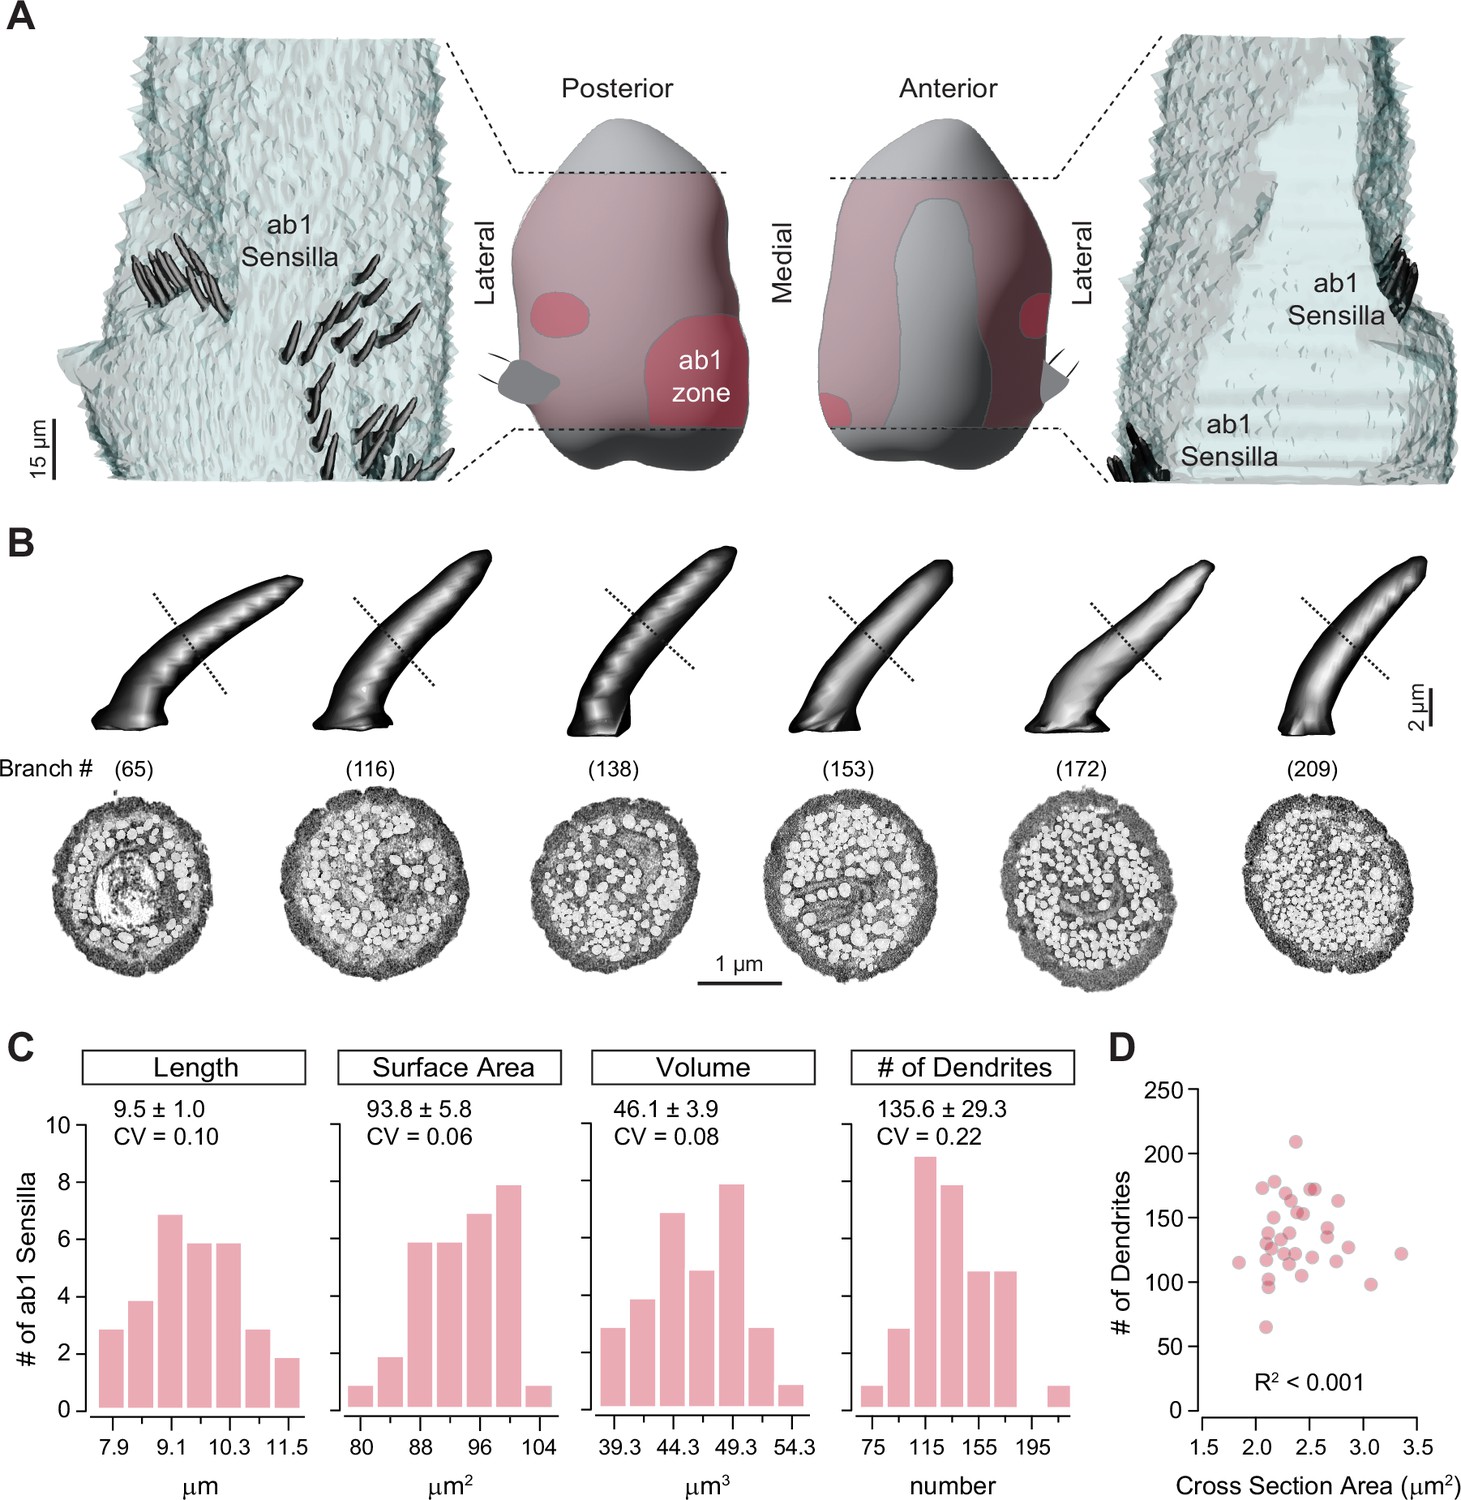
Distribution of ab1 sensilla and their morphometric analysis.
(A) Middle panels: Illustration of the antennal region sampled in the serial block-face scanning electron microscopy (SBEM) volume (pink) with the ab1 zone highlighted in pink. Left and right panels: 3D models of ab1 sensillum cuticles (dark gray) are shown on the imaged portion of the antenna (light gray). Scale bar: 15 μm. (B) 3D models and corresponding SBEM images of ab1 sensilla. Dashed lines indicate the approximate midpoint region of cuticles where the SBEM images were sampled. Sensilla are arranged from left to right in order of increasing dendritic branch counts, as indicated in parentheses. Dendrites are pseudocolored in white. Scale bars: 2 μm for 3D models and 1 μm for SBEM images. (C) Distribution of morphometric features (length, surface area, volume, and dendritic branch counts) from fully segmented ab1 sensillum cuticles. Mean ± SD and coefficients of variation (CVs) are shown above each graph (n=31–32). (D) Correlation analysis of ab1 dendritic branch counts as a function of sensillum midpoint cross-sectional areas (n=32). Also see Figure 1—source data 1 for ab1 sensillum morphometrics.
-
Figure 1—source data 1
ab1 sensillum morphometrics.
- https://cdn.elifesciences.org/articles/106389/elife-106389-fig1-data1-v1.xlsx
Figure 1—figure supplement 1

Drosophila antenna and olfactory sensillum.
(A) Schematic of the Drosophila antenna, which houses hundreds of olfactory sensilla on the surface of its third segment. (B) Schematic of an olfactory sensillum, illustrating the multiporous cuticle and compartmentalized olfactory receptor neurons (ORNs). Each ORN consists of an outer dendrite, inner dendrite, soma, and axon. The inner and outer dendrites are separated by the ciliary constriction.
Figure 2 with 1 supplement
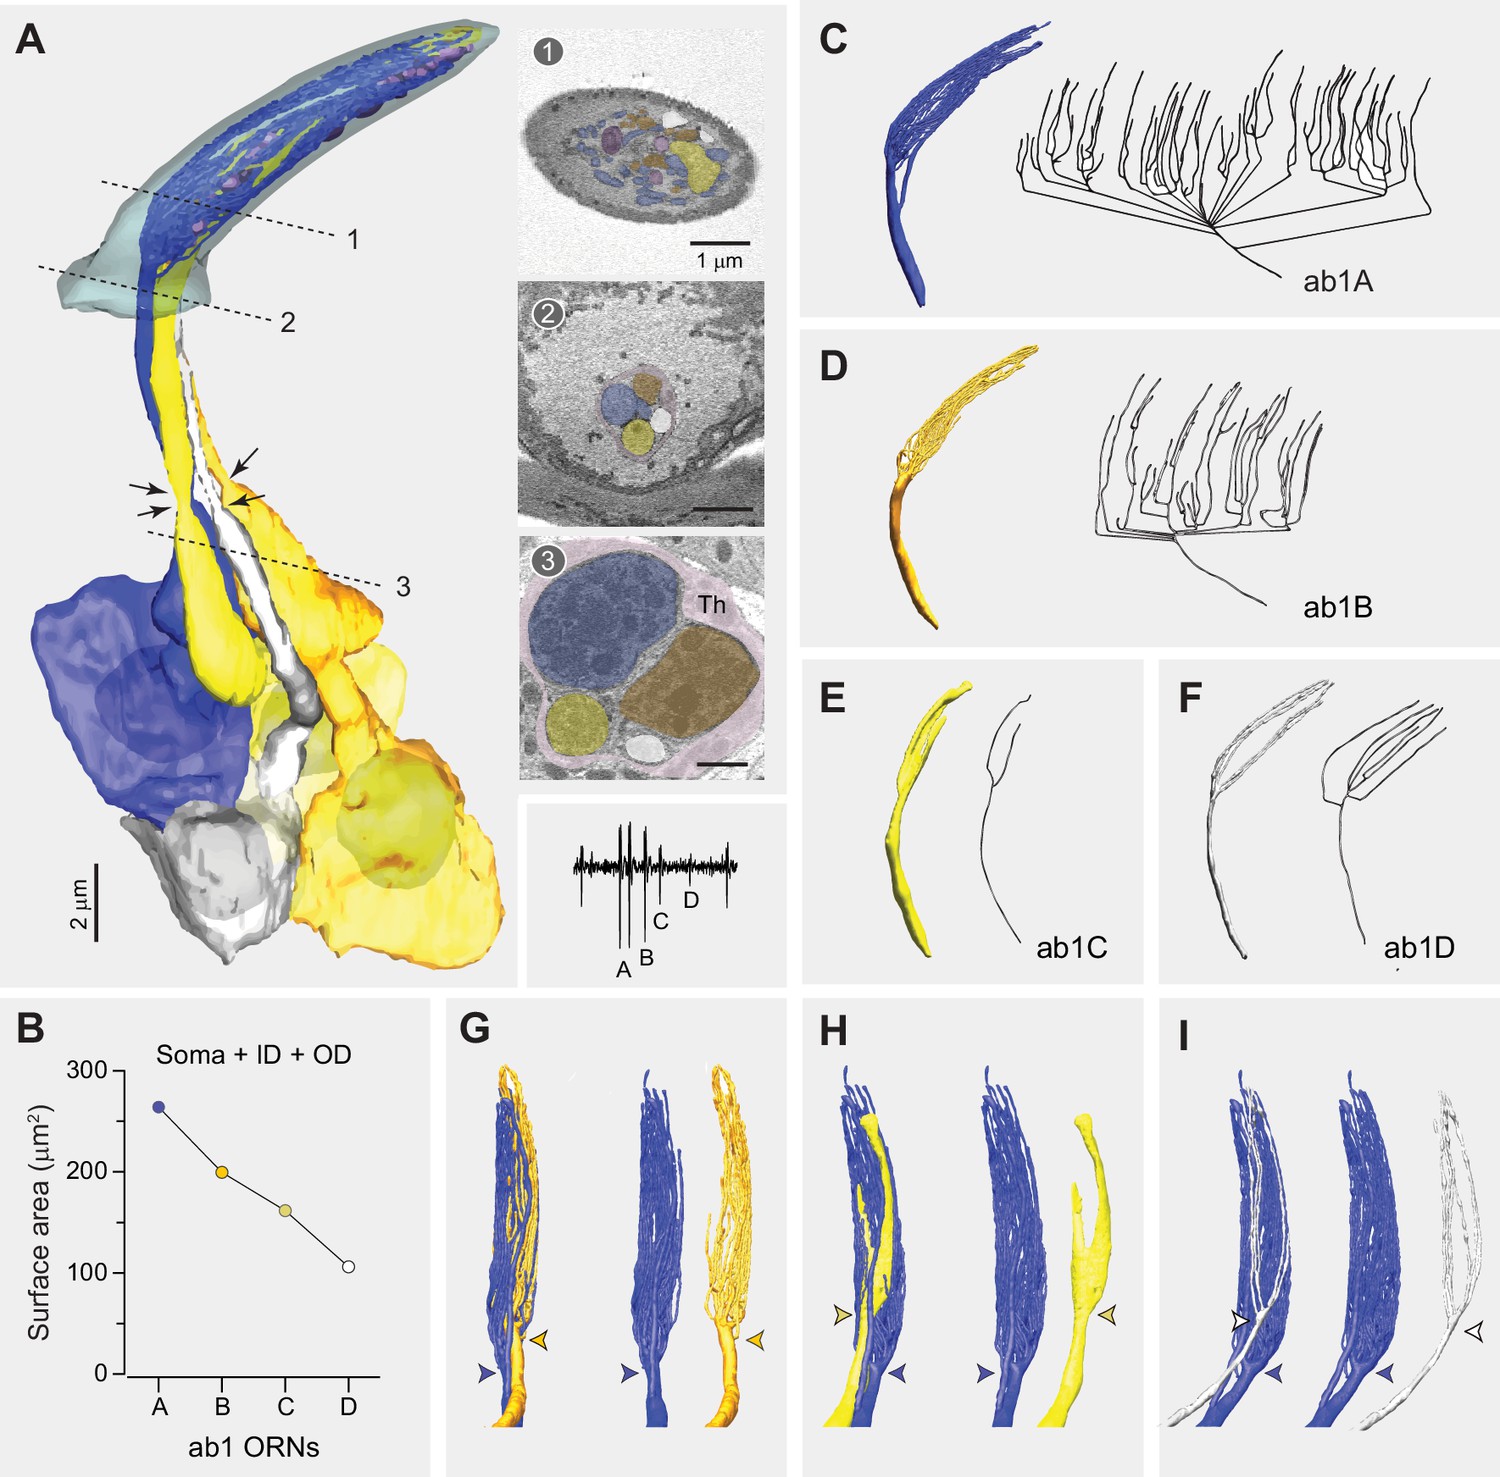
Fully reconstructed ab1 sensillum with four neurons.
(A) 3D model and serial block-face scanning electron microscopy (SBEM) images of a fully reconstructed ab1 sensillum. Olfactory receptor neurons (ORNs) are pseudocolored to indicate neuronal identities: ab1A (blue), ab1B (orange), ab1C (yellow), and ab1D (white). Dashed lines mark the positions of corresponding SBEM images on the right: (1) sensillum lumen containing the outer dendrites; (2) proximal region of the outer dendrites; and (3) the inner dendrites surrounded by processes of the thecogen cell (Th). Arrows indicate the positions of ciliary constriction, which demarcates the inner and outer dendritic segments. Inset: a representative trace from single-sensillum recording showing the relative extracellular spike amplitudes of the ab1 ORNs. Scale bars: 2 μm for 3D models and 1 μm for SBEM images. (B) Combined surface areas of the ORN soma, inner dendrite (ID), and outer dendrites (OD). (C–F) 3D models and corresponding 2D projections of the outer dendritic branches of ab1A (C), ab1B (D), ab1C (E), and ab1D (F). (G–I) Spatial relationship between the dendritic branches ab1A and those of its neighboring neurons. Colored arrowheads indicate the primary branching points or flattening position. See also Figure 2—source data 1 for ab1 ORN morphometrics and Video 1.
-
Figure 2—source data 1
ab1 olfactory receptor neuron (ORN) morphometrics.
- https://cdn.elifesciences.org/articles/106389/elife-106389-fig2-data1-v1.xlsx
Figure 2—figure supplement 1
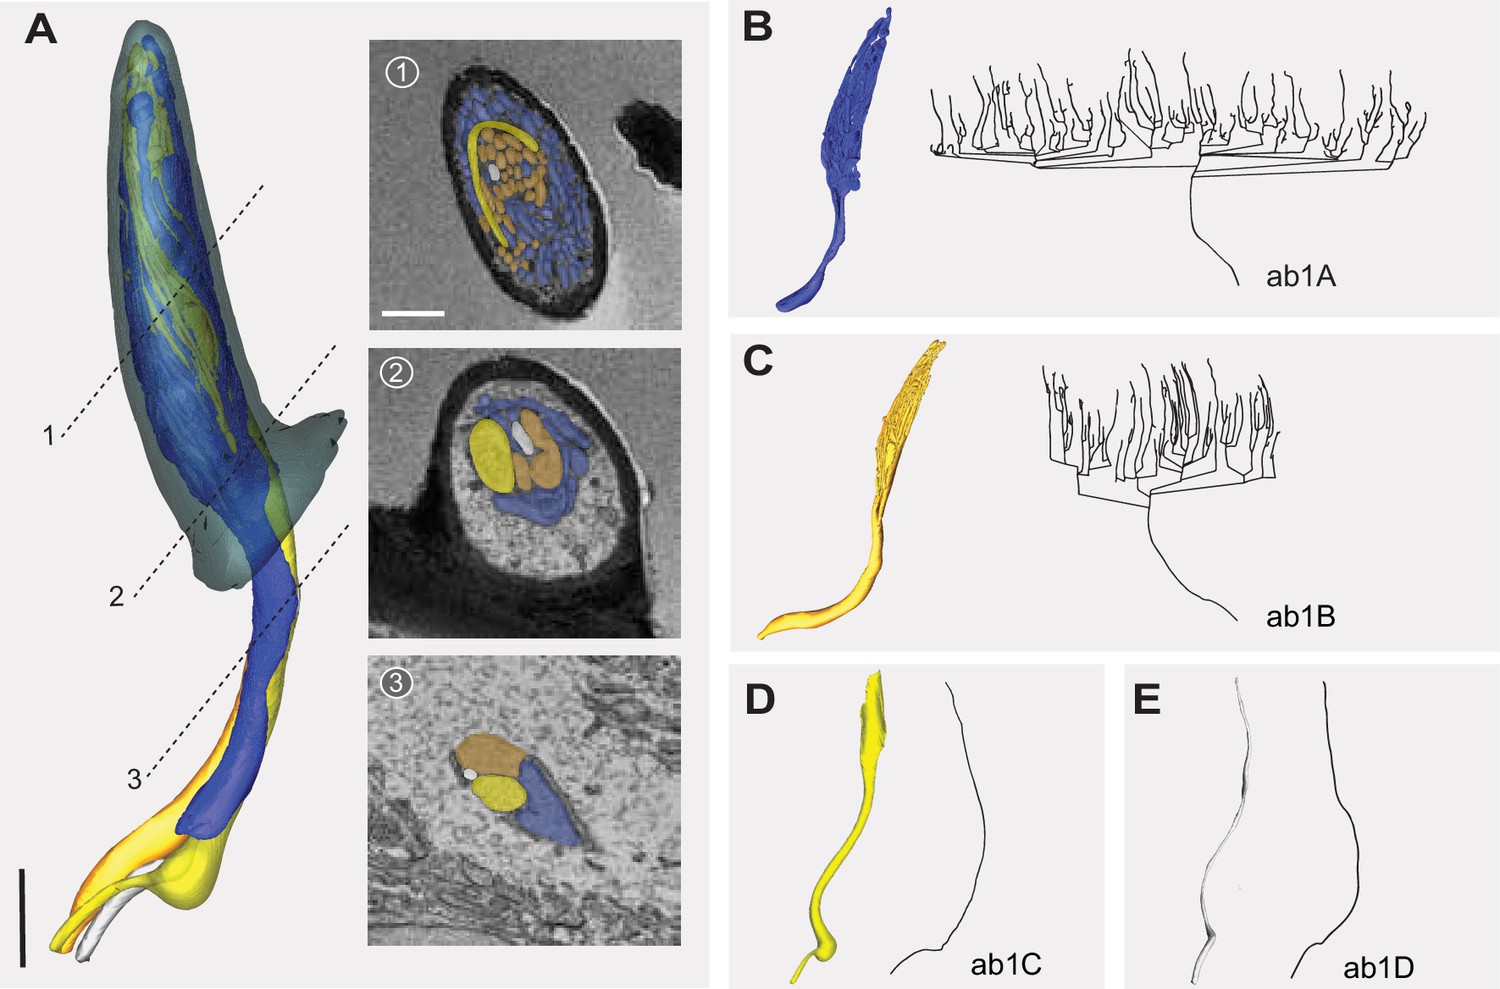
Partially reconstructed ab1 sensillum with four neurons.
(A) 3D model and serial block-face scanning electron microscopy (SBEM) images of a partially reconstructed ab1 sensillum from another SBEM volume. Olfactory receptor neurons (ORNs) are pseudocolored to indicate neuronal identities: ab1A (blue), ab1B (orange), ab1C (yellow), and ab1D (white). Dashed lines mark the positions of corresponding SBEM images on the right: (1) highly branched outer dendrites; (2) proximal outer dendrites; and (3) unbranched segments of outer dendrites. The somata and some inner dendrites were truncated during SBEM image acquisition. (B–E) 3D models and corresponding 2D projections of the outer dendritic branches of ab1A (B), ab1B (C), ab1C (D), and ab1D (E). Scale bars: 2 μm for 3D models and 1 μm for SBEM images.
Figure 3
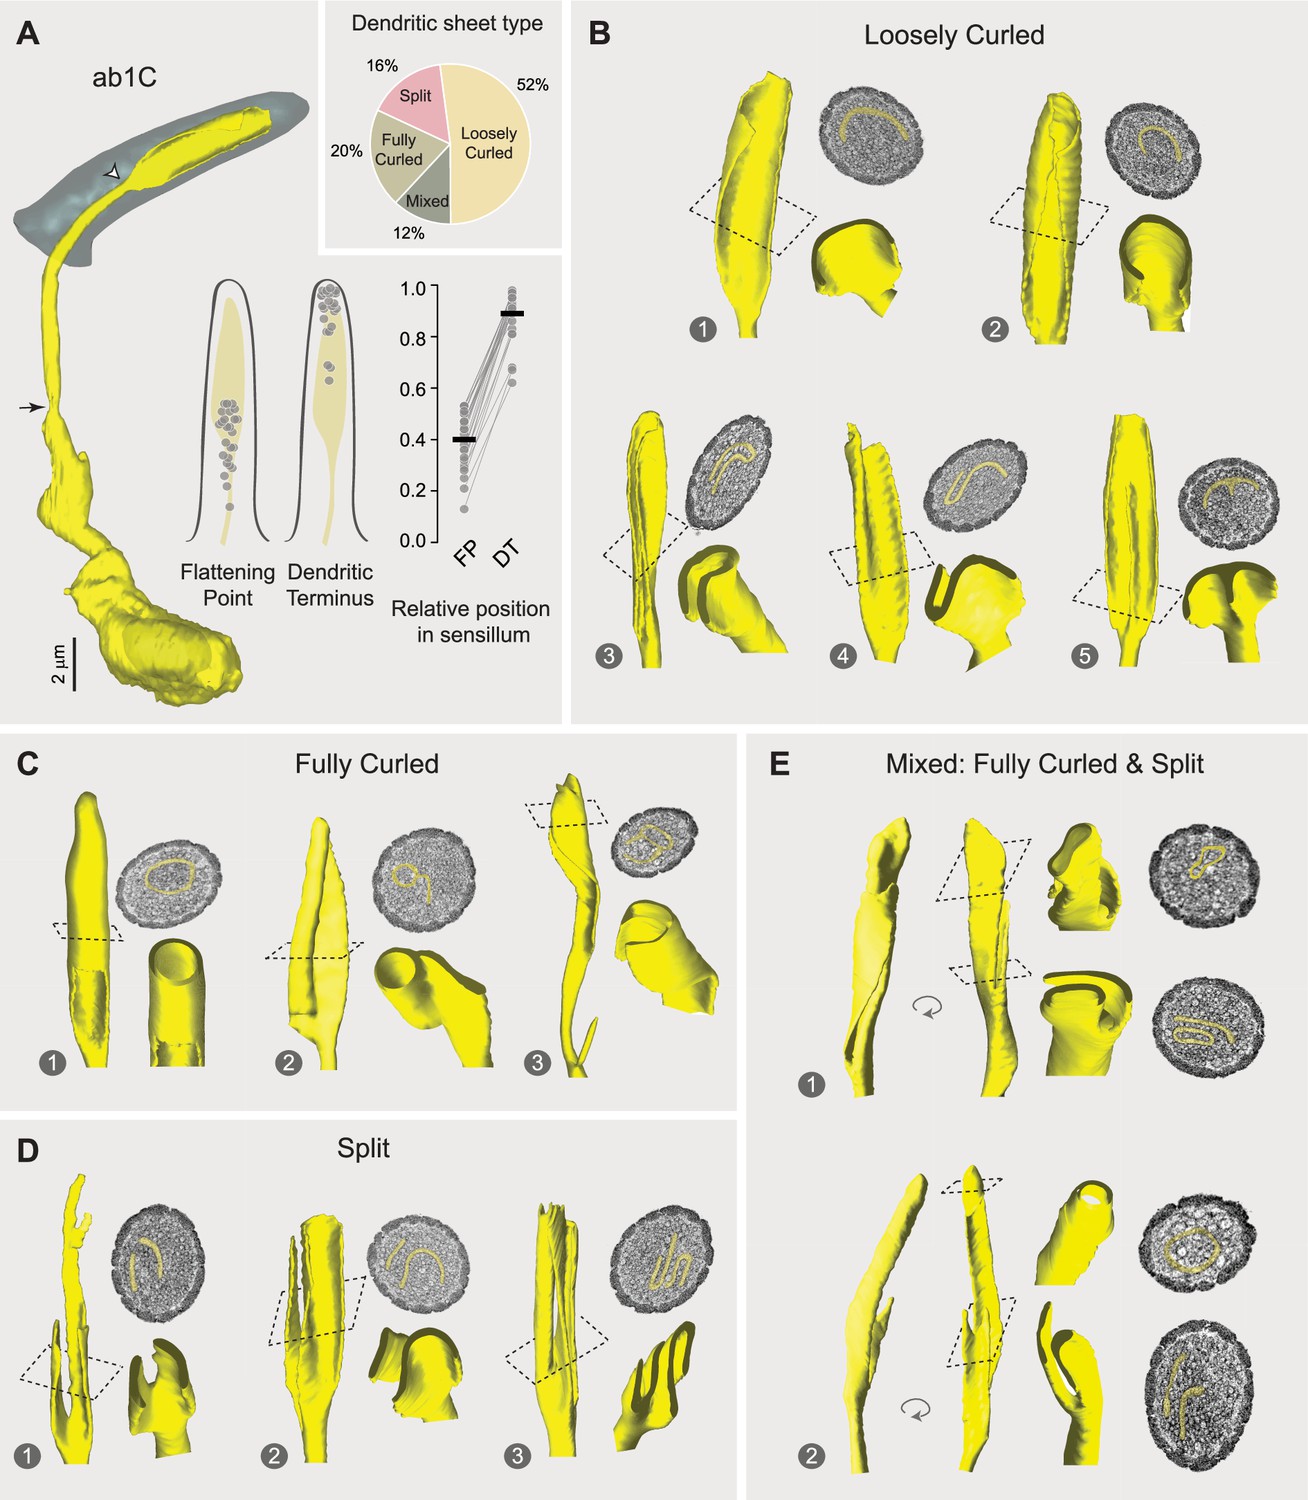
Morphological diversity across ab1C outer dendrites.
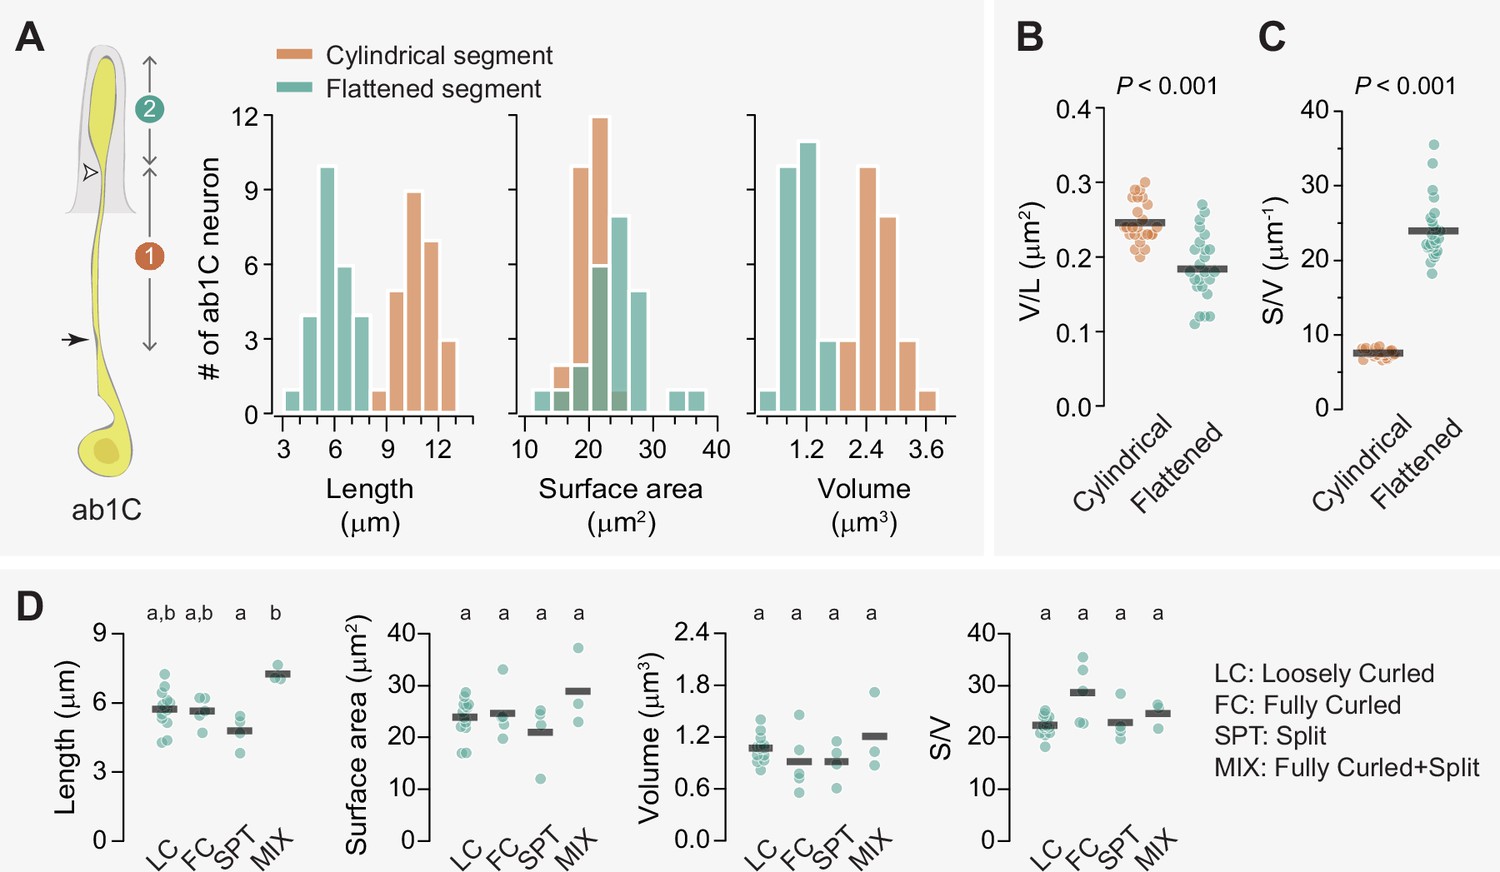
(A) Left panel: 3D model of an ab1C neuron (yellow) and its associated sensillum cuticle (gray). Arrow indicates ciliary constriction, marking the beginning of the outer (sensory) dendrite. White arrowhead marks the location where dendritic flattening occurs. Middle panel: Positions of the flattening point (FP) and dendritic terminus (DT) relative to the cuticle length. Filled gray circles represent the relative positions of individual ab1C neurons. Right panel: Similar to the middle panel, but with lines connecting data points from the same neurons. The cuticle base and tip are designated as 0 and 1, respectively. Horizontal bars indicate the mean positions (n=25). Inset: Pie chart illustrating the distribution of the four outer dendritic morphological categories across the ab1C population. (B–E) Representative 3D models, top-down clipped views, and corresponding cross-sectional EM images are shown for each of the four morphological categories: loosely curled (B), fully curled (C), split (D), and mixed (E). ab1C dendritic sheets are pseudocolored in yellow in sample EM images. See also Video 2.
Figure 4
Flattening increases the surface area-to-volume ratio of the ab1C outer dendrite.
(A) Left panel: Illustration of an ab1C neuron. Arrow indicates the position of ciliary constriction. White arrowhead marks the location where dendritic flattening occurs. Segment #1: cylindrical outer dendrite; segment #2: flattened outer dendrite. Right panels: Distributions of length, surface area, and volume for the cylindrical (coral) or flattened (teal) outer dendritic segments across the ab1C population (n=25). (B–C) Quantitative comparisons of the volume per unit length (B) and surface area-to-volume ratio (C) for the cylindrical (coral) and flattened (teal) outer dendritic segments. Each filled circle represents data from an individual neuron, with horizontal bars indicating the mean values (n=25). Statistical significance was determined using paired two-tailed t-test. (D) Quantitative comparisons of morphometric features for ab1C flattened segments across different morphological categories. Each filled circle represents data from an individual ab1C neuron, with horizontal bars indicating the mean values. Statistical significance is determined by Kruskal-Wallis one-way ANOVA on ranks and denoted by different letters. For example, labels ‘a’ and ‘b’ indicate a significant difference between groups (p<0.05), whereas labels with identical or shared letters (e.g., ‘a’ and ‘a’, ‘a,b’ and ‘a’, or ‘a,b’ and ‘b’) indicate no significant difference. Also see Figure 4—source data 1 for ab1C dendrite morphometrics.
-
Figure 4—source data 1
ab1C dendrite morphometrics.
- https://cdn.elifesciences.org/articles/106389/elife-106389-fig4-data1-v1.xlsx
Figure 5
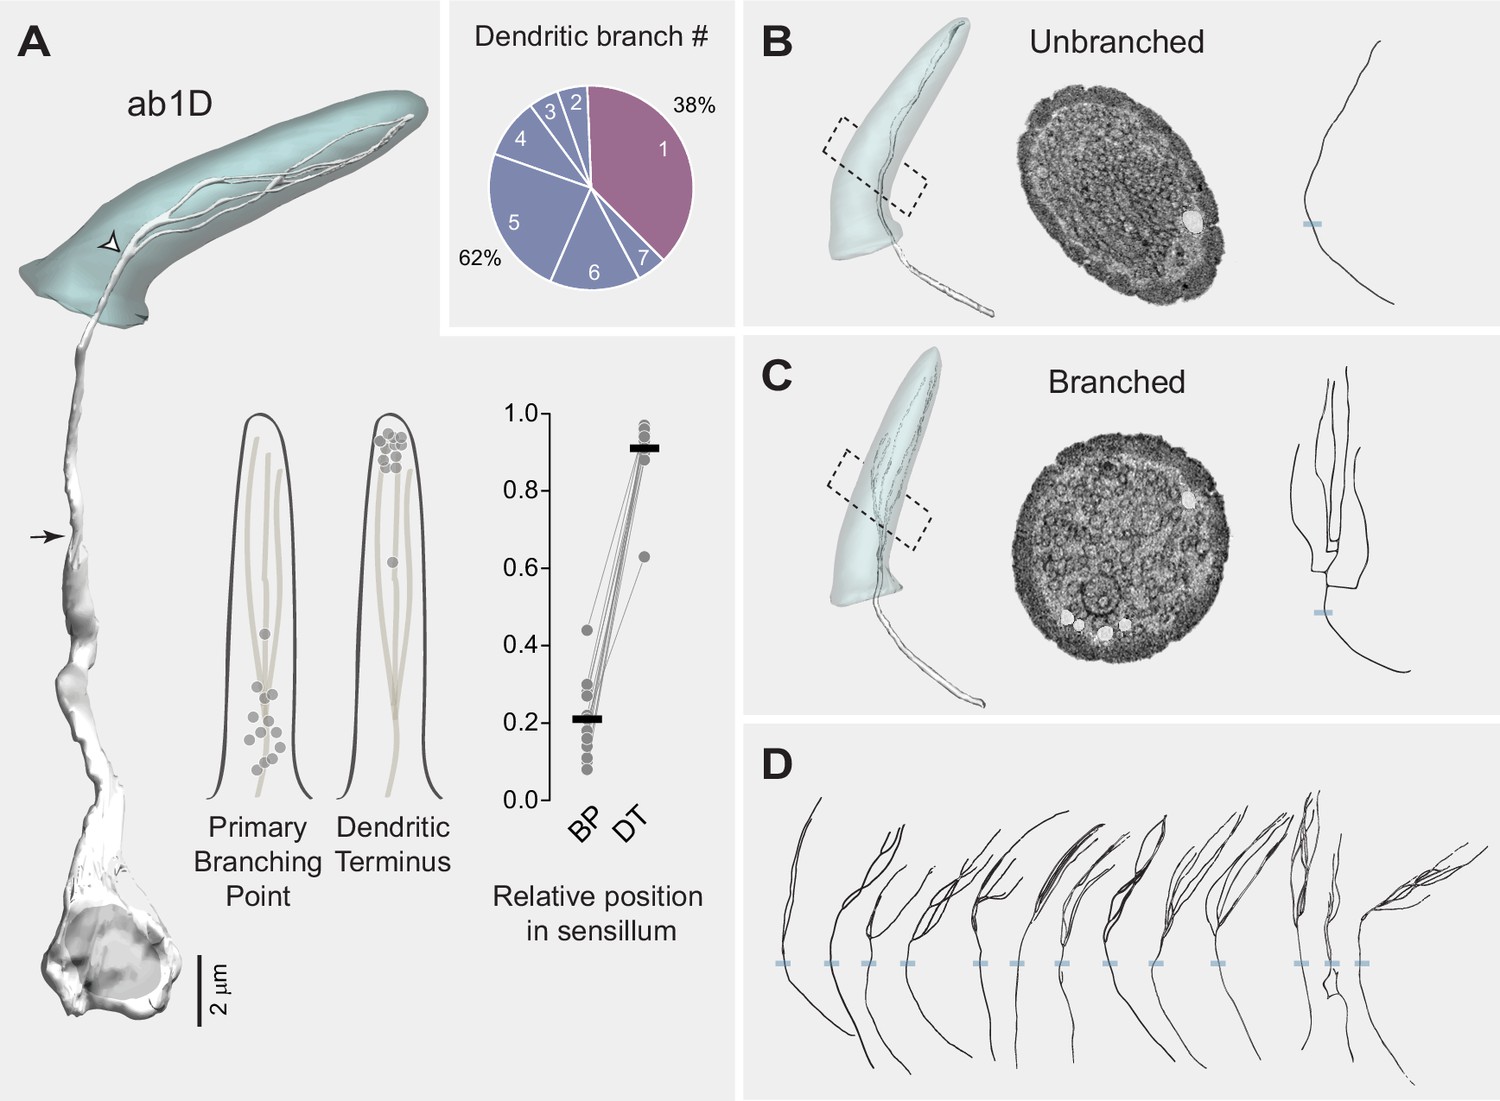
Heterogeneity in ab1D branching pattern.
(A) Left panel: 3D model of an ab1D neuron (white) and its associated sensillum cuticle (gray). Arrow indicates ciliary constriction, marking the beginning of the outer (sensory) dendrite. White arrowhead marks the primary branching point where dendritic branching starts. Middle panel: Positions of the primary branching point (BP) and dendritic terminus (DT) relative to the cuticle length. Filled gray circles represent the relative positions of individual ab1D neurons with branched dendrites. Right panel: Similar to the middle panel, but with lines connecting data points from the same neurons. The cuticle base and tip are designated as 0 and 1, respectively. Horizontal bars indicate the average positions of the segmented ab1D neurons (n=13). Inset: Pie chart illustrating the distribution of the two dendritic branching categories across the ab1D population (n=21). (B–C) Representative 3D models, corresponding cross-sectional EM images, and 2D projections of dendritic skeletons are shown for the two morphological categories: unbranched (B) and branched (C). Blue bars mark the positions of cuticular bases. ab1D dendrites are pseudocolored in white in sample EM images. (D) Dendritic skeletons for the 13 segmented ab1D neurons with branched outer dendrites, with increasing branch numbers arranged from left to right.
Figure 6
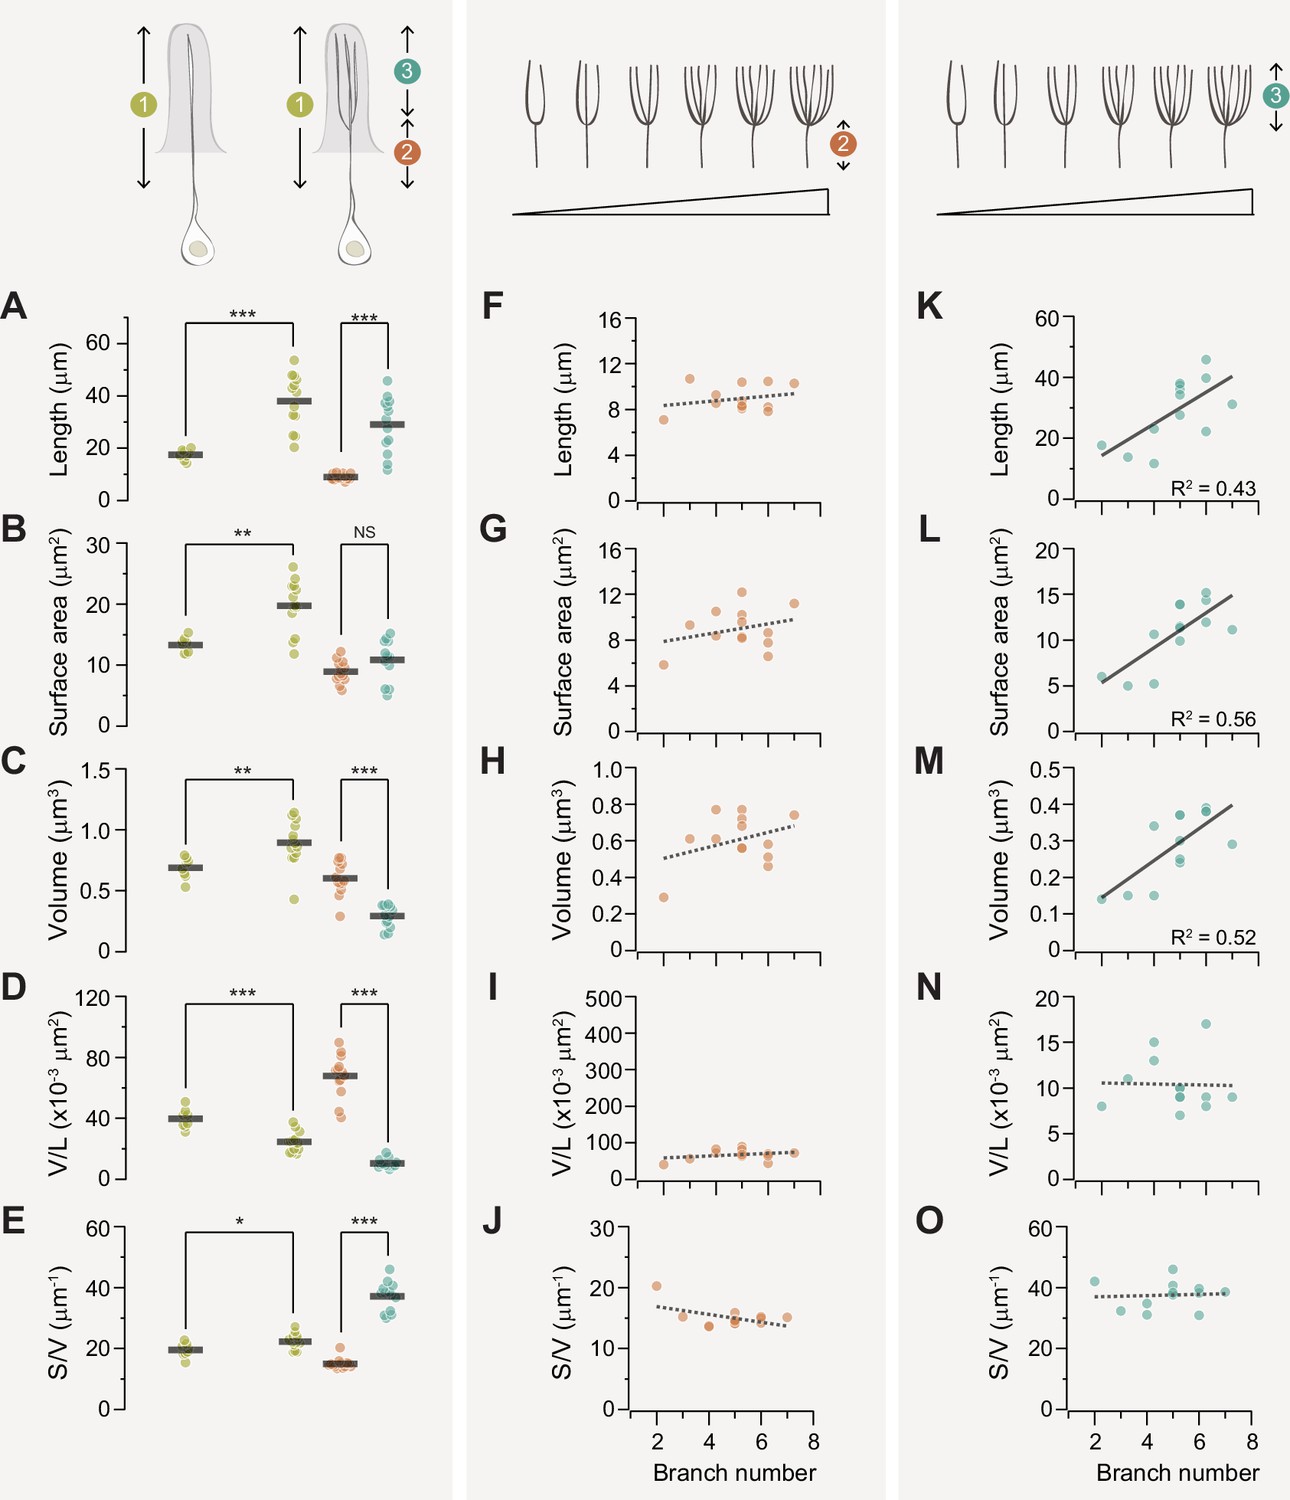
Branching enhances the surface area-to-volume ratio of the ab1D outer dendrite.
(A–E) Quantitative comparisons of outer dendrites morphometric properties, including total length (A), surface area (B), volume (C), volume per unit length (D), and surface area-to-volume ratio (E). Data are presented for the entire outer dendrite (summed morphometrics, segment 1 in mustard), proximal unbranched (segment 2 in coral), and distal branched segments (segment 3 in teal). For branched ab1D neurons, segment 3 represents the summed morphometric measurements of all dendritic branches above the primary branch point, while segment 1 includes the combined values of segments 2 and 3. Each filled circle represents data from an individual neuron, with horizontal bars indicating the mean values (n=8 for unbranched neurons; n=13 for branched neurons). Statistical significance was determined using Mann-Whitney rank sum test for comparisons between two ’segment 1’, and paired t-test for comparison between segments 2 and 3. *p<0.05; **p<0.01; ***p<0.005. (F–J) For branched ab1D dendrites, correlation analysis of the morphometric properties of the proximal outer dendrite (segment 2, coral) in relation to the number of dendritic branches. Parameters include the length (F), surface area (G), volume (H), volume per unit length (I), and surface area-to-volume ratio (J). (K–O) Similar to (F–J) but with the summed morphometric measurements of the distal outer dendritic segments (segment 3, teal). Linear fits are shown, with dashed lines indicating R2<0.4 and solid lines indicating R2>0.4. Also see Figure 6—source data 1 for ab1D dendrite morphometrics.
-
Figure 6—source data 1
ab1D dendrite morphometrics.
- https://cdn.elifesciences.org/articles/106389/elife-106389-fig6-data1-v1.xlsx
Figure 7
Auxiliary cells in the ab1 sensillum.
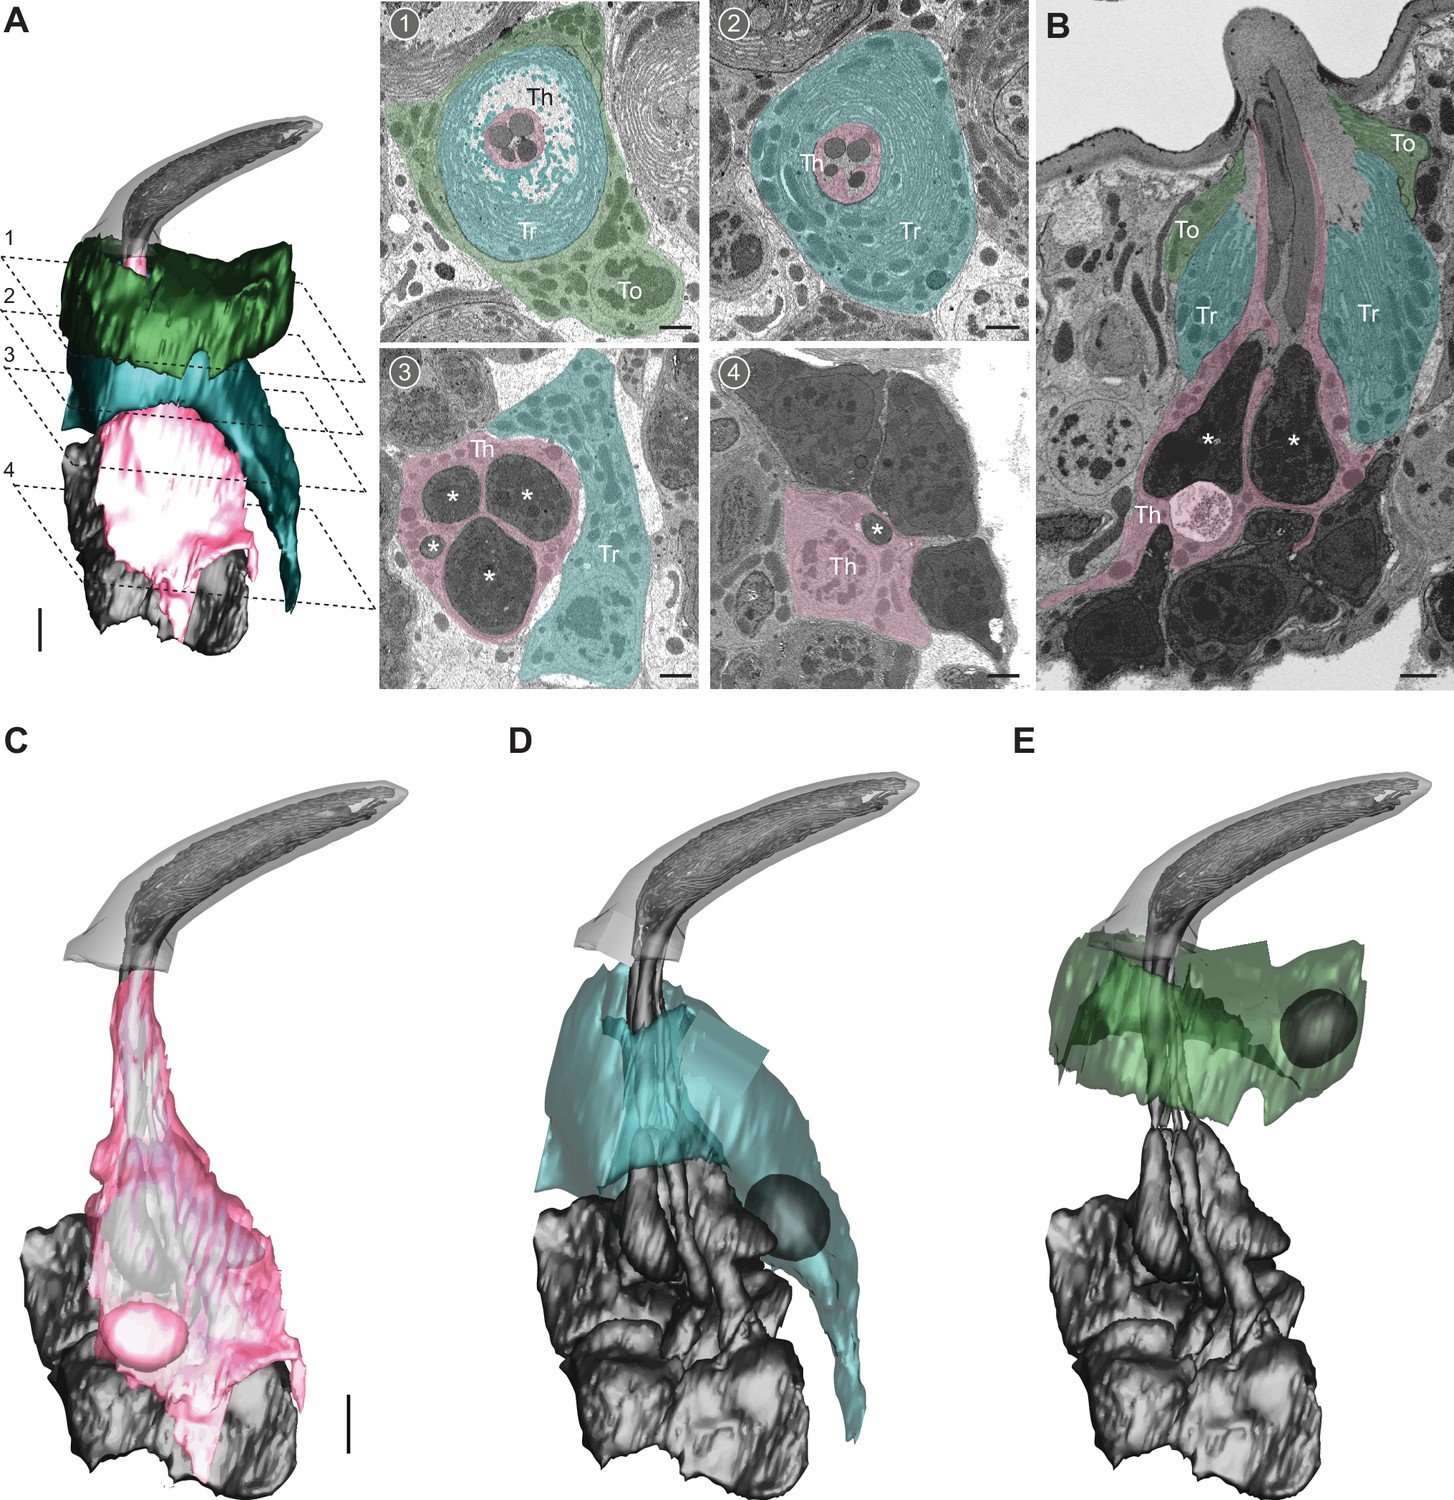
(A) 3D model and serial block-face scanning electron microscopy (SBEM) images of an ab1 sensillum. Cells are pseudocolored to indicate identities: olfactory receptor neurons (ORNs) (gray), thecogen cell (pink, Th), trichogen cell (turquoise, Tr), tormogen cell (green, To). Dashed lines mark positions of the corresponding SBEM images: (1–2) outer dendritic region beneath the cuticle; (3) inner dendrites (asterisks); (4) ORN somas. (B) A longitudinal sensillum section rendered by IMOD. (C–E) 3D models of individual auxiliary cells: thecogen (C), trichogen (D), and tormogen (E). For simplicity, microlamellae of trichogen and tormogen cells were not segmented and thus not shown in 3D models. Scale bars: 2 μm for 3D models and 1 μm for SBEM images. See also Video 3.
Author response image 1

Homotypic ab2A ORNs display similar odorant sensitivity.
(A) Single-sensillum recording. Raster plots of ab2A/Or59b ORN spike responses. Six ab2A ORNs from the same antenna were recorded per fly. Odor stimulus: methyl acetate (10-6). (B) Dose-response relationships of peak spike responses, normalized to the maximum response of the ORN to facilitate comparison of odor sensitivity. Each curve represents responses from a single ab2A ORN fitted with the Hill equation (n=36 ab2 sensilla from 6 flies). Responses recorded from the same antenna are indicated by the same color. Statistical comparisons between different ab2A ORNs from the same antenna (P > 0.99) or across flies (P > 0.99) were performed by two-way ANOVA. (C) Quantification of individual pEC50 values from (B), defined as -logEC50.
Videos
Video 1
3D dendritic models of ab1A, B, C, and D neurons.
Color codes are as indicated in Figure 2.
Video 2
3D models representing distinct morphological types of ab1C dendrites.
Video 3
3D models of auxiliary cells in the ab1 sensillum.
Tables
Table 1
Morphometric data for the outer dendritic segments of ab1C and ab1D (mean ± SD).
| ORN type | Length (μm) | Surface area (μm2) | Volume (μm3) | V/L | S/V | ||||||||||
|---|---|---|---|---|---|---|---|---|---|---|---|---|---|---|---|
| ab1C | Proximal | Distal | Total | Proximal | Distal | Total | Proximal | Distal | Total | Proximal | Distal | Total | Proximal | Distal | Total |
| Loosely curled (n=13) | 10.67±0.86 | 5.73±0.84 | 16.40±1.41 | 19.82±2.10 | 23.90±3.69 | 43.72±3.91 | 2.60±0.34 | 1.07±0.16 | 3.68±0.36 | 0.24±0.02 | 0.19±0.04 | 0.22±0.02 | 7.64±0.44 | 22.32±1.96 | 11.93±0.93 |
| Fully curled (n=5) | 11.62±0.88 | 5.64±0.62 | 17.27±0.78 | 20.86±2.03 | 24.66±5.03 | 45.52±4.37 | 2.73±0.26 | 0.91±0.35 | 3.64±0.43 | 0.24±0.03 | 0.16±0.06 | 0.21±0.03 | 7.67±0.72 | 28.61±5.80 | 12.56±1.07 |
| Split (n=4) | 10.76±0.59 | 4.78±0.71 | 15.54±0.48 | 20.33±2.61 | 21.00±6.12 | 41.33±7.32 | 2.80±0.49 | 0.91±0.23 | 3.71±0.66 | 0.26±0.03 | 0.20±0.07 | 0.24±0.05 | 7.32±0.48 | 22.88±3.82 | 11.21±1.60 |
| Mixed (n=3) | 9.38±0.68 | 7.26±0.33 | 16.64±0.93 | 18.07±1.43 | 28.92±7.44 | 47.00±6.73 | 2.40±0.16 | 1.21±0.45 | 3.61±0.30 | 0.26±0.03 | 0.17±0.07 | 0.19±0.02 | 7.54±0.66 | 24.58±2.51 | 12.99±0.84 |
| Total (n=25) | 10.72±0.97 | 5.74±0.95 | 16.47±1.19 | 19.90±2.09 | 24.19±4.89 | 44.09±4.81 | 2.64±0.33 | 1.03±0.25 | 3.67±0.39 | 0.25±0.03 | 0.18±0.05 | 0.22±0.03 | 7.58±0.50 | 23.94±3.93 | 12.07±1.11 |
| ab1D | |||||||||||||||
| Unbranched (n=8) | NA | NA | 17.47±1.85 | NA | NA | 13.29±1.18 | NA | NA | 0.69±0.08 | NA | NA | 0.040±0.006 | NA | NA | 19.50±2.13 |
| Branched (n=13) | 8.94±1.11 | 29.09±10.25 | 38.83±10.05 | 8.97±1.72 | 10.77±3.30 | 19.74±4.12 | 0.60±0.10 | 0.30±0.10 | 0.90±0.20 | 0.068±0.014 | 0.010±0.003 | 0.025±0.006 | 15.03±1.63 | 37.51±4.18 | 22.25±2.65 |
| Total (n=21) | 30.20±12.78 | 17.28±4.57 | 0.82±0.18 | 0.030±0.010 | 21.20±2.81 | ||||||||||
Additional files
Download links
A two-part list of links to download the article, or parts of the article, in various formats.
Downloads (link to download the article as PDF)
Open citations (links to open the citations from this article in various online reference manager services)
Cite this article (links to download the citations from this article in formats compatible with various reference manager tools)
Population-level morphological analysis of paired CO2- and odor-sensing olfactory neurons in D. melanogaster via volume electron microscopy
eLife 14:RP106389.
https://doi.org/10.7554/eLife.106389.3


