Occupancy of the HbYX hydrophobic pocket is sufficient to induce gate opening in the archaeal 20S proteasomes
- Department of Biochemistry and Molecular Medicine, West Virginia University School of Medicine, United States
- Department of Neuroscience, Rockefeller Neuroscience Institute, West Virginia University, United States
Figures
Figure 1 with 2 supplements
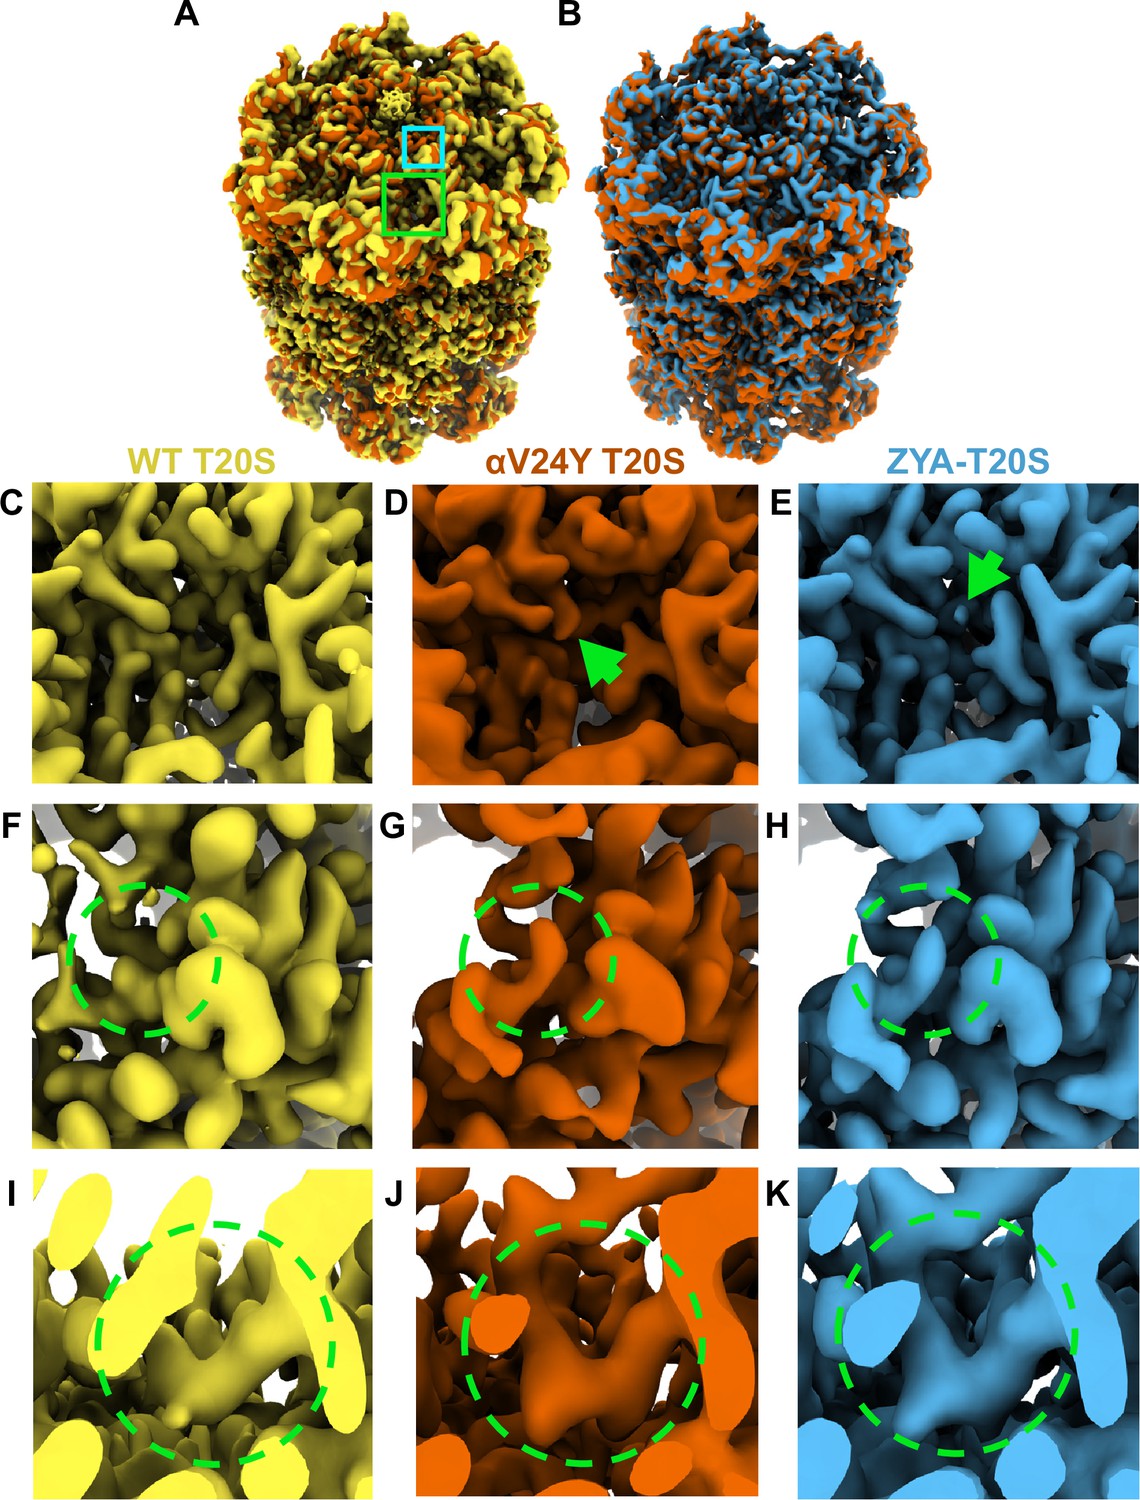
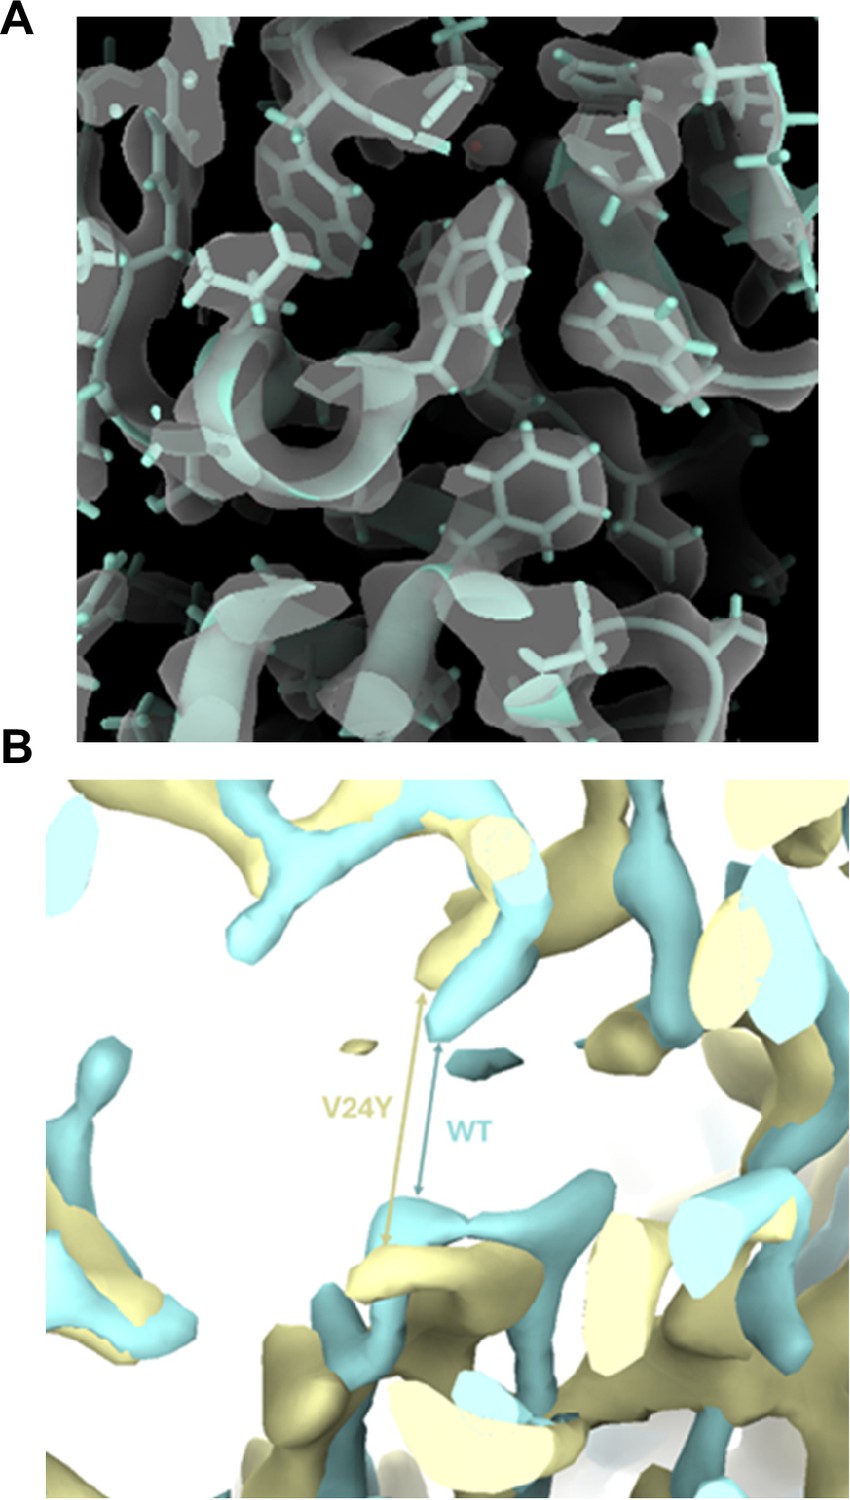
Overlay of cryo-EM maps shows αV24Y T20S has similar conformational changes as ZYA bound T20S and is in the gate-open state.
(A) Overlay of wild-type (WT) T20S (yellow) and αV24Y T20S (red) electron density maps, showing the α and β rings. Green box outlines an intersubunit pocket and marks the zoomed region within C-E. Neon Blue box outlines the YDR motif and marks the zoomed region shown in F-H. Whole maps were aligned to one another. (B) Overlay of αV24Y T20S (red) and ZYA-T20S (blue) electron density maps, showing the α and β rings. V24Y T20S shows similar but larger conformational changes than does ZYA-T20S. (C) Close up of the intersubunit pocket in the WT T20S (yellow) electron density map, highlighted in (A) in the larger neon green box outline. (D, E) Same as C, but for αV24Y T20S (red) and ZYA-T20S (blue). Arrows point to the density corresponding to αV24Y and Z of ZYA, respectively. (F) Close up of the WT T20S (yellow) electron density map, corresponding to the YDR motif, the missing density for tyrosine is highlighted by the neon green dotted circle, which is expected in the closed state. The relative position of the close up is indicated by the smaller neon blue box outline in A. (G, H) Same as F, but for αV24Y T20S (red) and ZYA-T20S (blue). Neon green dotted circle highlights the YDR tyrosine side chain density, which is expected to be in this position in the open gate conformation. (I) Close up of the WT T20S (yellow) electron density map, corresponding to the IT Switch, highlighted by the neon green dotted circle. (J, K) Same as (I) but for αV24Y T20S (red) and ZYA-T20S (blue). Changes in the conformation of the IT switch indicates switching from the closed to the open state.
Figure 1—figure supplement 1
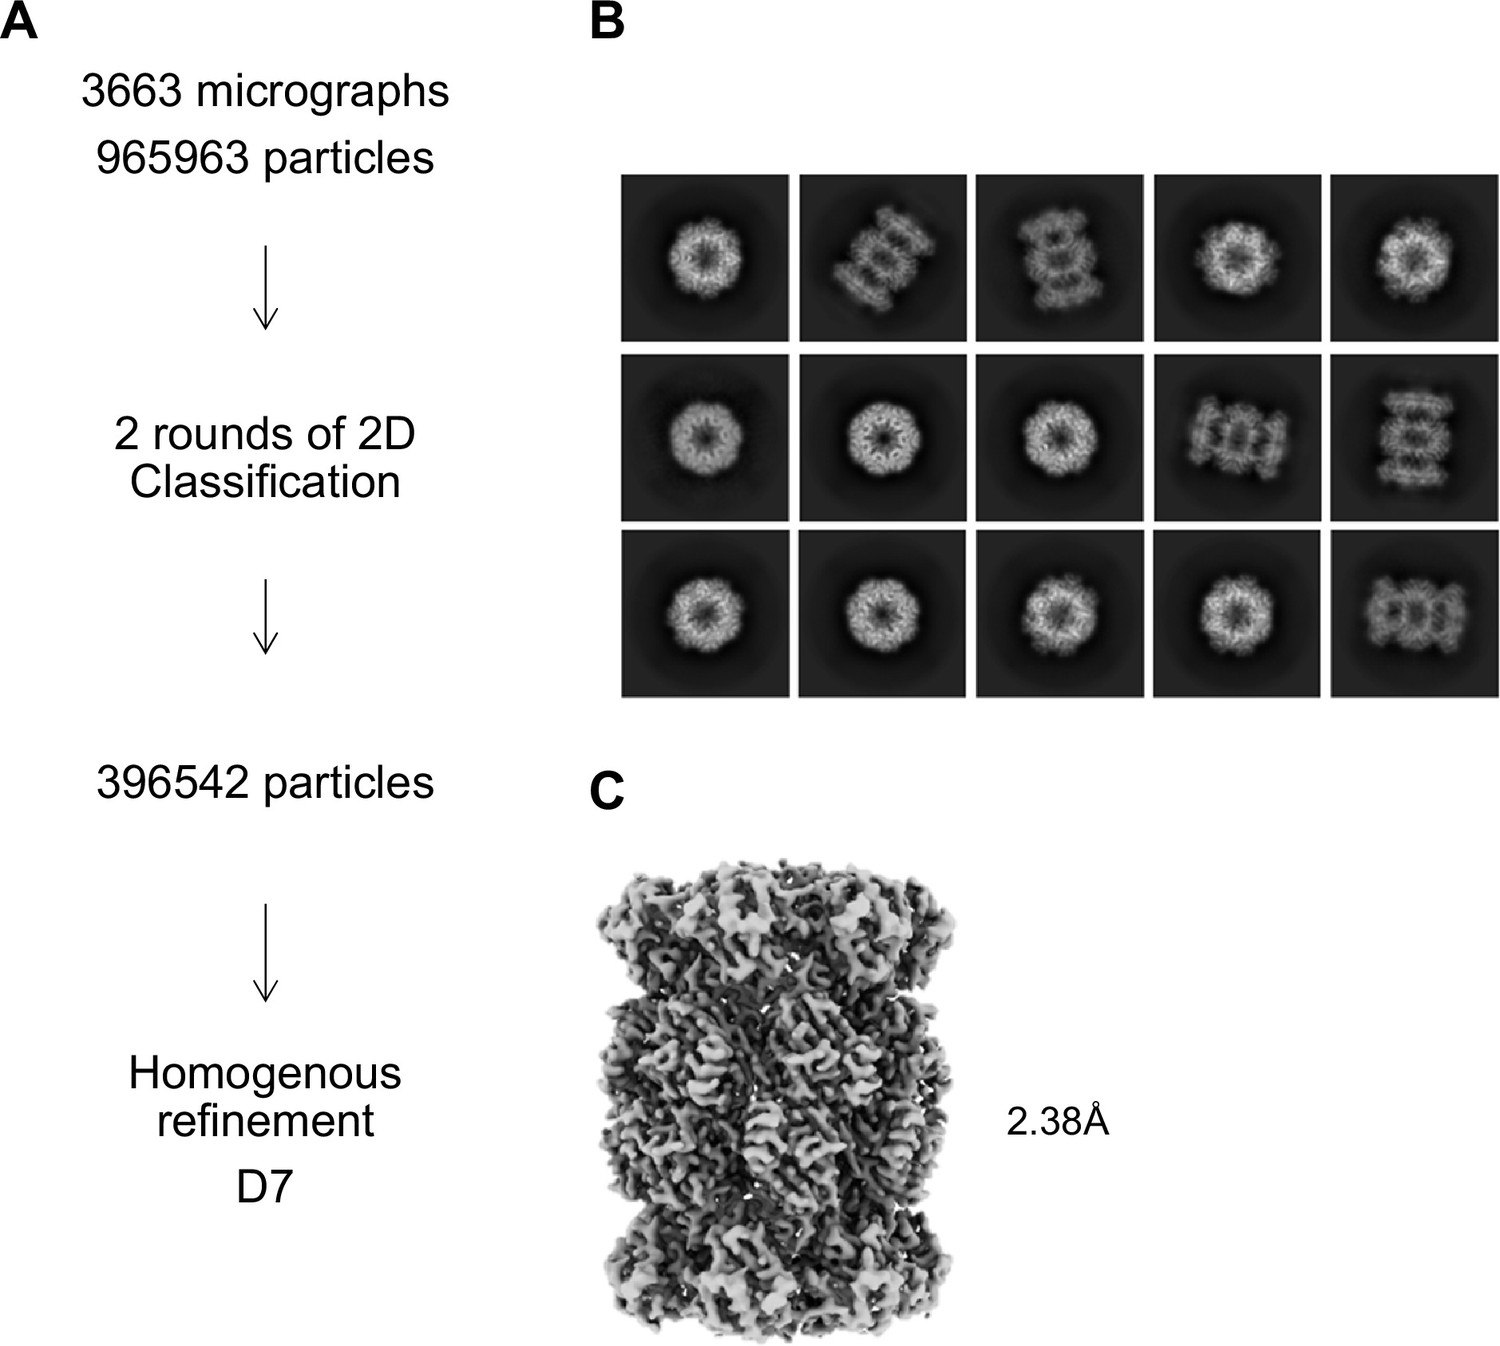
αV24Y T20S Processing Scheme.
(A) Cryo-EM workflow for alphaV24Y T20S. All steps were performed in Cryosparc. (B) Final 2D class averages after two rounds of 2D Classification are shown with a mixture of top and size views. (C) Homogeneous refinement of class of particles that showed the open gate conformation.
Figure 1—figure supplement 2
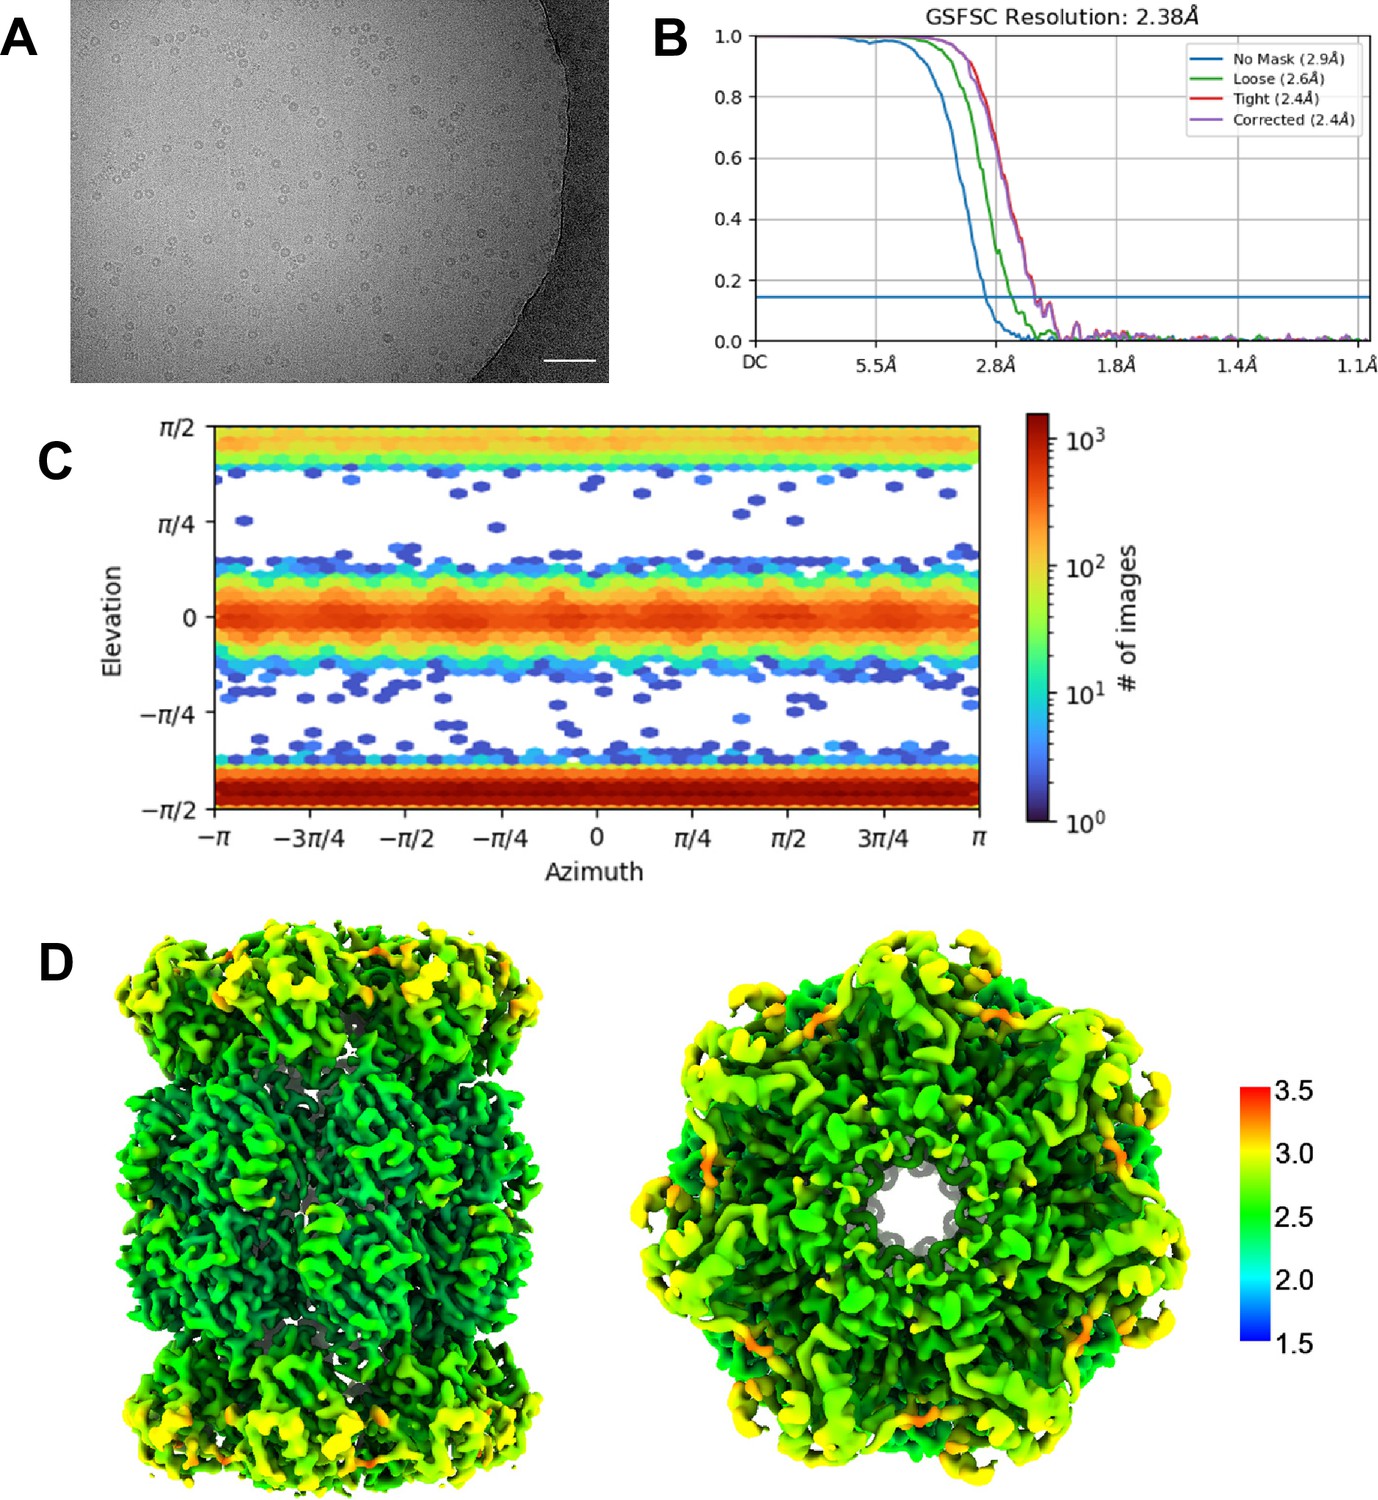
αV24Y T20S Validation.
(A) Micrograph representative showing αV24Y T20S. Scale bar represents 5 nm. (B) Standard FSC-0.143 graph showing corrected 2.38 Å resolution. (C) View of particle angle distribution showing a mixture of side and top view particles. (D) Particles from selected ab initio model were refined with homogenous refinement and D7 symmetry applied. D7 symmetry was confirmed as appropriate by homogenous refinement with C1 symmetry; the resulting C1 map was copied, then flipped 180° around the twofold axis then rotated 180° about the sevenfold axis. The flipped and rotated map was essentially identical to the original, confirming D7 symmetry of the complex. Final 2.38 Å D7 map was colored in Chimera to show range of resolution of 3D reconstructed map.
Figure 2
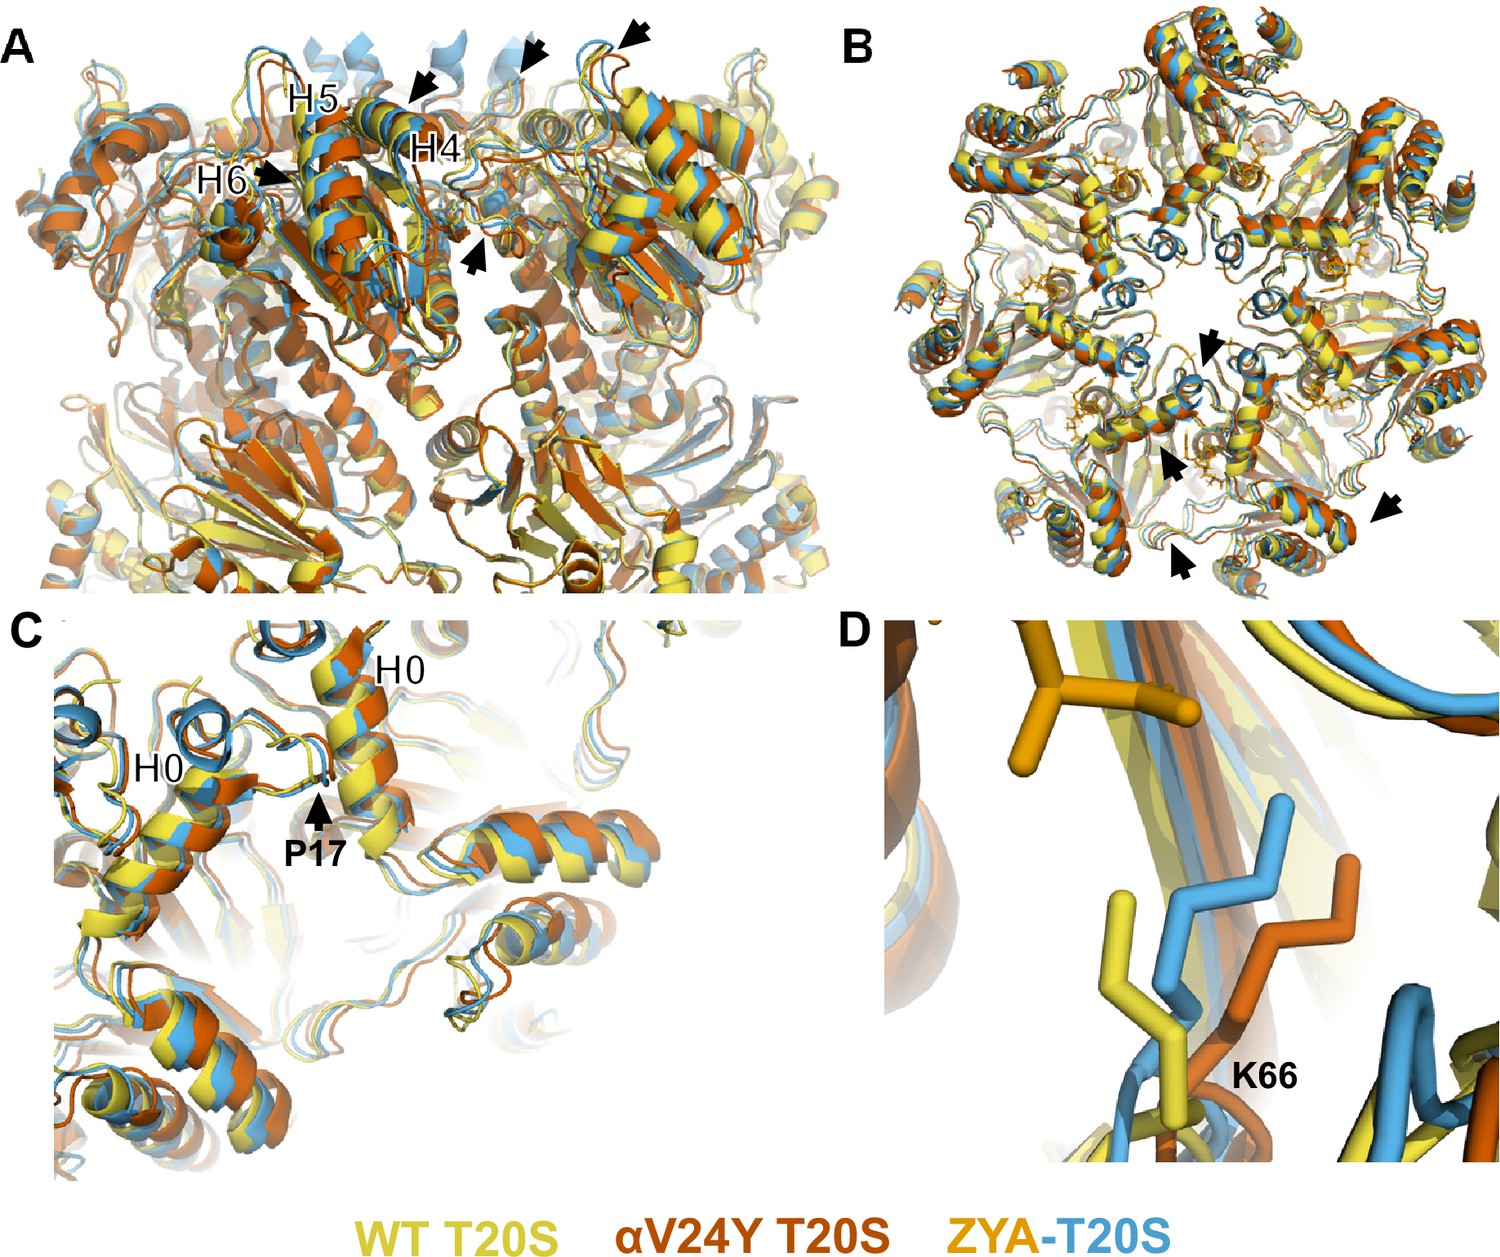
Atomic model of αV24Y T20S compared to wild-type (WT) and ZYA-T20S shows it has undergone HbYX-dependent conformational changes associated with 20 S gate-opening.
(A) Atomic model overlay of WT T20S (yellow), αV24Y T20S (red), and ZYA-T20S (blue) with bound ZYA (gold), aligned by the β rings to show conformational changes in the α subunits. Top half of sideview of 20 S is shown. Conformational changes in the α-ring are clearly visible (black arrows). Helix 4, 5, and 6 are labeled with black asterisks outlined in white. (B) Top view of A. Conformational changes noted by (black arrows). (C) Close up view of one of the α intersubunit pockets as in B. αPro17 is shown with a black arrow. Helix 0 is labeled with a black asterisk outlined in white. (D) Close up view of αK66 which is labeled and shown in sticks. Models in panel b through d are aligned to show intersubunit conformational changes (i.e. aligned by β rings).
Figure 3 with 2 supplements
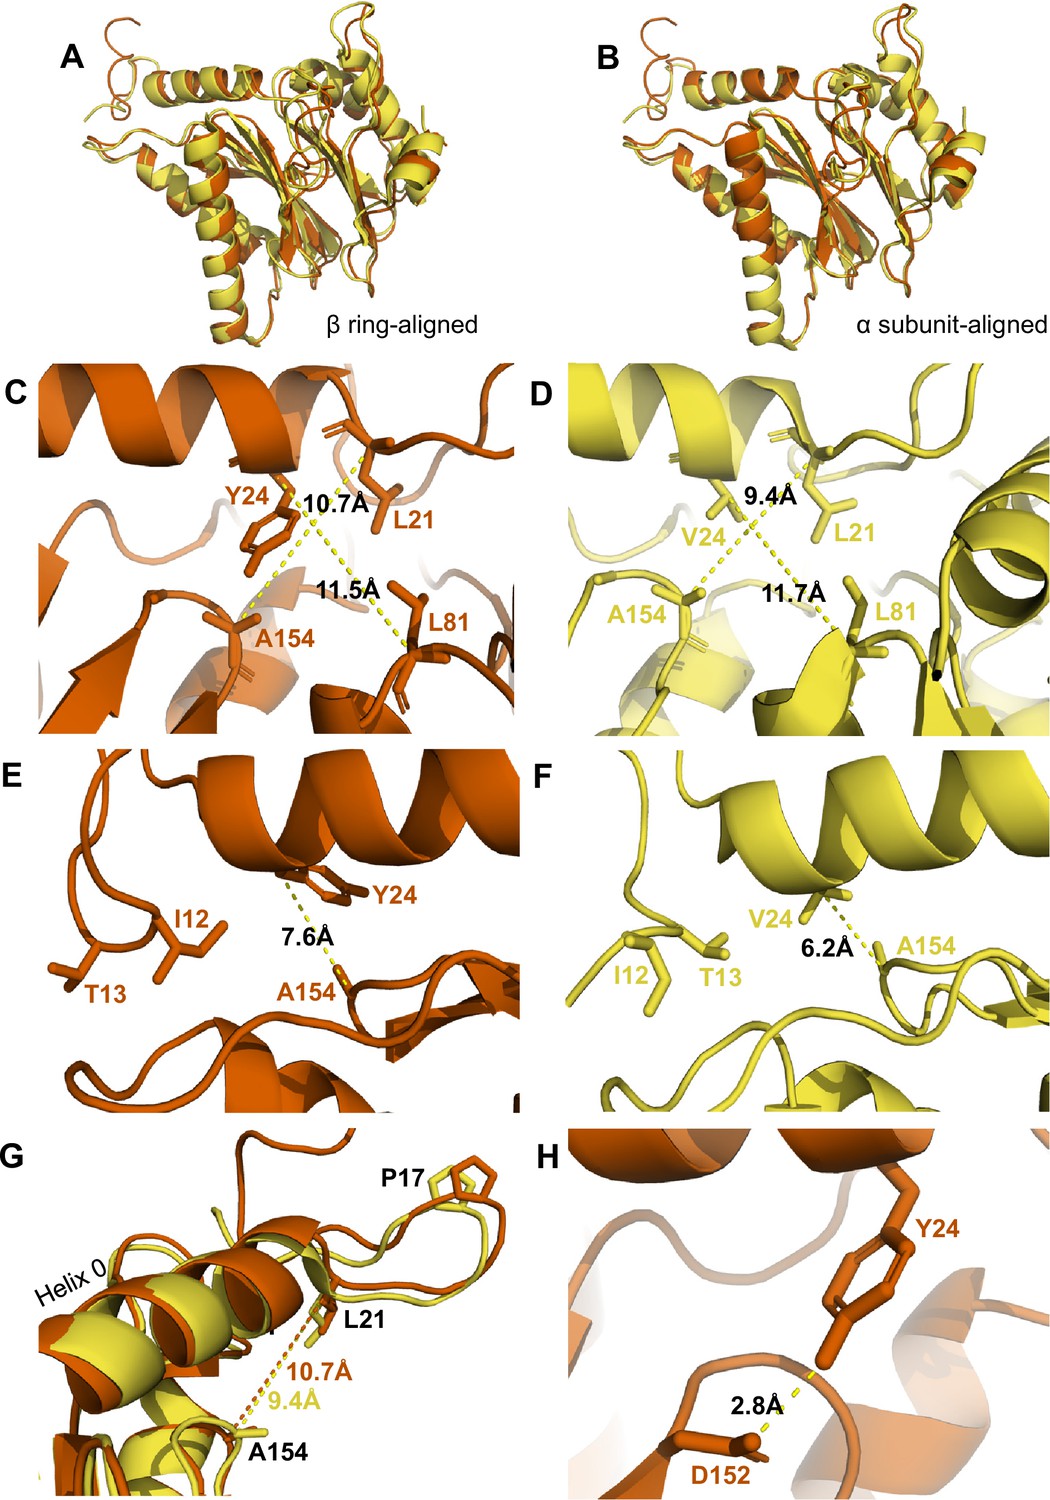
αV24Y mutation induces intrasubunit conformational changes in the HbYX hydrophobic pocket, IT switch pocket, and P17 loop.
(A) Overlay of wild-type (WT) T20S (yellow) and αV24Y T20S (red) α subunit models, aligned by the β rings. (B) Same as A except the models were aligned according to individual α subunit. (C) Close up of the intersubunit pocket in αV24Y T20S (red), showing distances between the α-carbon selected residues (labeled and shown in sticks) to demonstrate conformational changes when compared to the WT T20S (yellow) model in D. Models are aligned by individual α subunit. (D) Same as C except it is the WT T20S (yellow) model. (E) Close up on the residues of the IT Switch (sticks) and αV24Y (sticks), showing the distance between the α-carbon of αV24Y and αA154 (sticks) to demonstrate conformational changes in the open state, when compared to the WT T20S (yellow) model in F. Models are aligned by individual α subunit. (F) Same as E except it is the WT T20S (yellow) model. (G) Close up of Helix 0 and selected surrounding residues (shown in sticks) in an overlay of WT T20S (yellow) and αV24Y T20S (red) α subunits, aligned by individual α subunit. Distances are measured between α-carbons and colored according to the model it corresponds to. (H) Close up of αV24Y (shown in sticks) in the αV24Y T20S model, demonstrating its side chain’s polar interaction (yellow dotted line) with αD152 (shown in sticks).
Figure 3—figure supplement 1
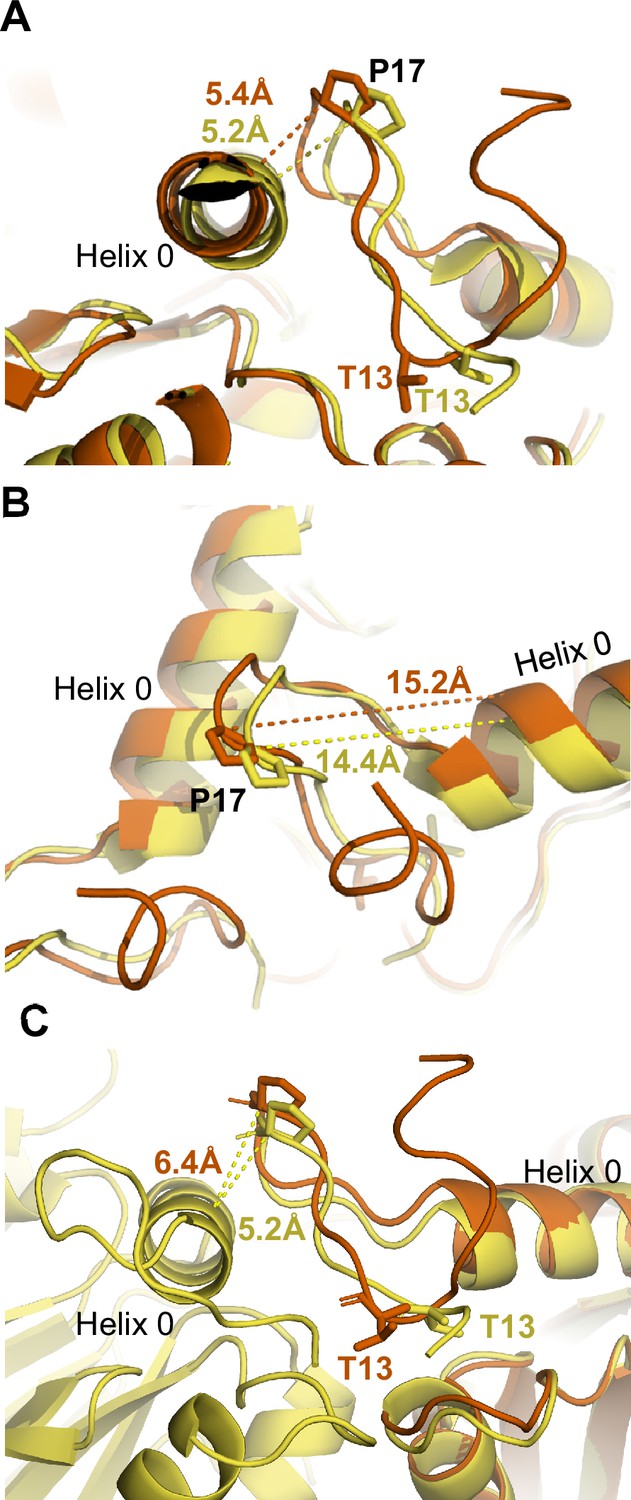
Additional measurements in the intersubunit pocket in V24Y T20S.
Complementary to Figure 3. (A) Measurement between P17 and neighboring Helix 0 for β ring-aligned wild-type (WT) and αV24Y T20S structures representing absence of intersubunit conformational differences in this distance. (B) Measurement between P17 and its own Helix 0 (E25) shows intrasubunit changes to this distance. (C) Close up of intrasubunit conformational change in the IT switch and αP17 loop providing flexibility to allow for intersubunit rigid body rotation. Distance shown are intrasubunit conformational change in the αV24Y T20S model and do not represent the global conformational changes, as the P17 packing against the neighboring Helix 0 is similar in open and closed states (SFig. 3 a).
Figure 3—figure supplement 2
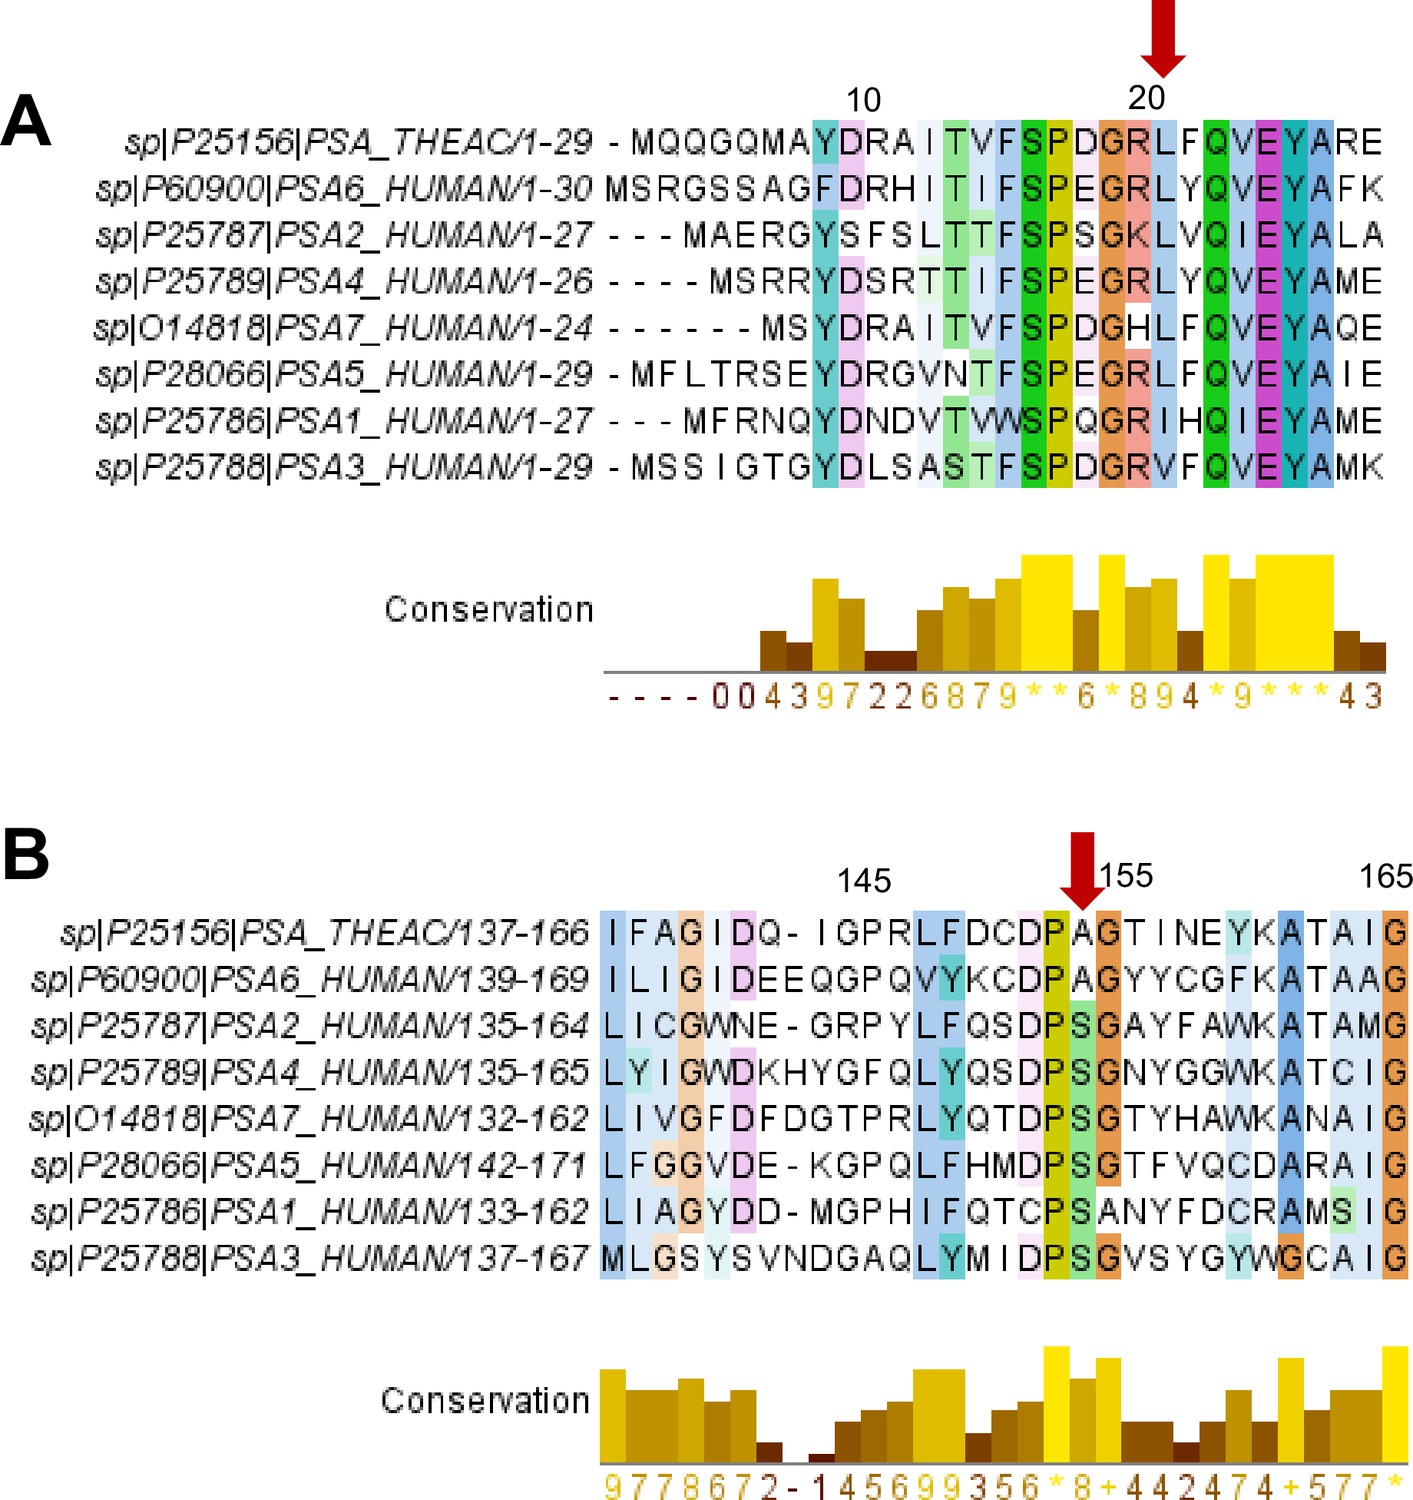
Conservation of T20S residues with human 20 S α subunits.
(A) Alignment showing sequences in the first 30 positions of the α subunits of T20S and H20S (listed according to gene names). Alignment was performed using ClustalΩ. Conversation and figure was generated using Jalview 2.11.2.5. Alignments are colored using the Clustal color scheme and color intensity indicates conservation (darkest: highly conserved). The bar graph in yellow indicates the conservation score, accounting for size, charge, hydrophobicity, and polarity. Red arrow points to αL21 and the corresponding residues in the alignment. (B) Same as (A) except the alignment shows sequences in the positions 137–166 of the α subunits of T20S and H20S (listed according to gene names). The red arrow points to αA154 and the corresponding residues in the alignment.
Figure 4 with 4 supplements
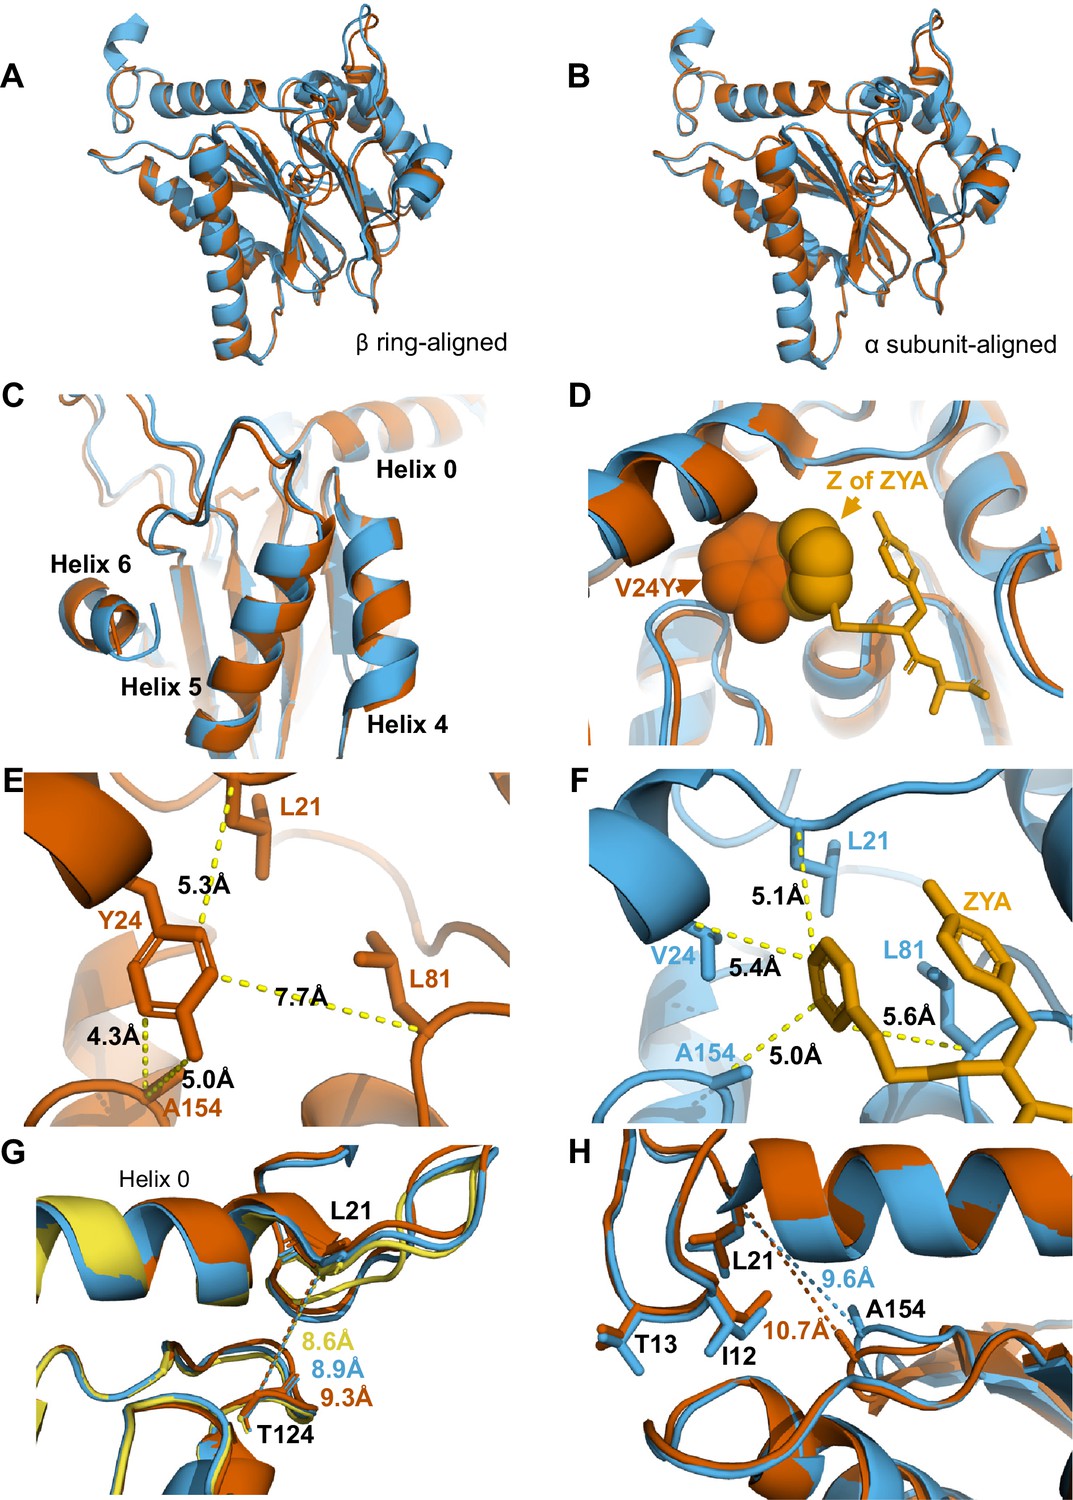
αV24Y mutation and ZYA binding both induce similar intrasubunit conformational changes.
(A) Same as 3 A except for αV24Y T20S (red) and ZYA-T20S (blue). Models are aligned by the β ring. (B) Same as 3B except for αV24Y T20S (red) and ZYA-T20S (blue). Models are aligned by individual α subunit. (C) Same as B except showing a close up of the Helix 4, 5, and 6 bundle. (D) αV24Y T20S and ZYA-T20S are aligned by β subunits and αV24Y side chain and carboxybenzyl group (Z) of ZYA are both shown in space-fill model to appreciate the level of spatial overlap between the αV24Y tyrosine ring (red) and the Z ring (gold) of ZYA, demonstrating they each occupy the same HbYX hydrophobic pocket in the T20S. (E) Close up of the αV24Y T20S (red) α intersubunit pocket showing measurements between the αV24Y tyrosine and labeled α carbons (shown in sticks). Comparison against F indirectly demonstrates the position of αV24Y’s side chain relative to the carboxybenzyl group of ZYA in the ZYA-T20S model. (F) Measurements of distances between ZYA’s carboxybenzyl group (gold) and the α-carbon of surrounding residues (shown in sticks) in the ZYA-T20S model (blue). (G) The HbYX hydrophobic pocket measurement: αT124 to αL21 (main chain shown in sticks) distance in WT T20S (yellow), αV24Y T20S (red), and ZYA-T20S (blue). (H) Same as 3E & F, except with alignment of ZYA-T20S (blue) and αV24Y T20S (red) α subunit models. Distances noted are colored according to the models they correspond to representing intrasubunit differences.
Figure 4—figure supplement 1
αV24Y T20S differs from wild-type (WT) T20S.
(A) Close up of αV24Y T20S sharpened map and model, demonstrating quality of map and model fit in the shown region. (B) Overlay of CCP-EM generated confidence maps for αV24Y T20S (yellow) and WT T20S (cyan), indicating statistically significant conformational changes. Maps were set at a threshold of 0.01 false discovery rate (FDR). View is similar to Figure 4H showing clear conformational changes in A154 relative to helix 0. Arrows point out the distance differences between the same two residues in the WT or the V24Y maps. Gaussian smoothing was applied to both maps.
Figure 4—figure supplement 2
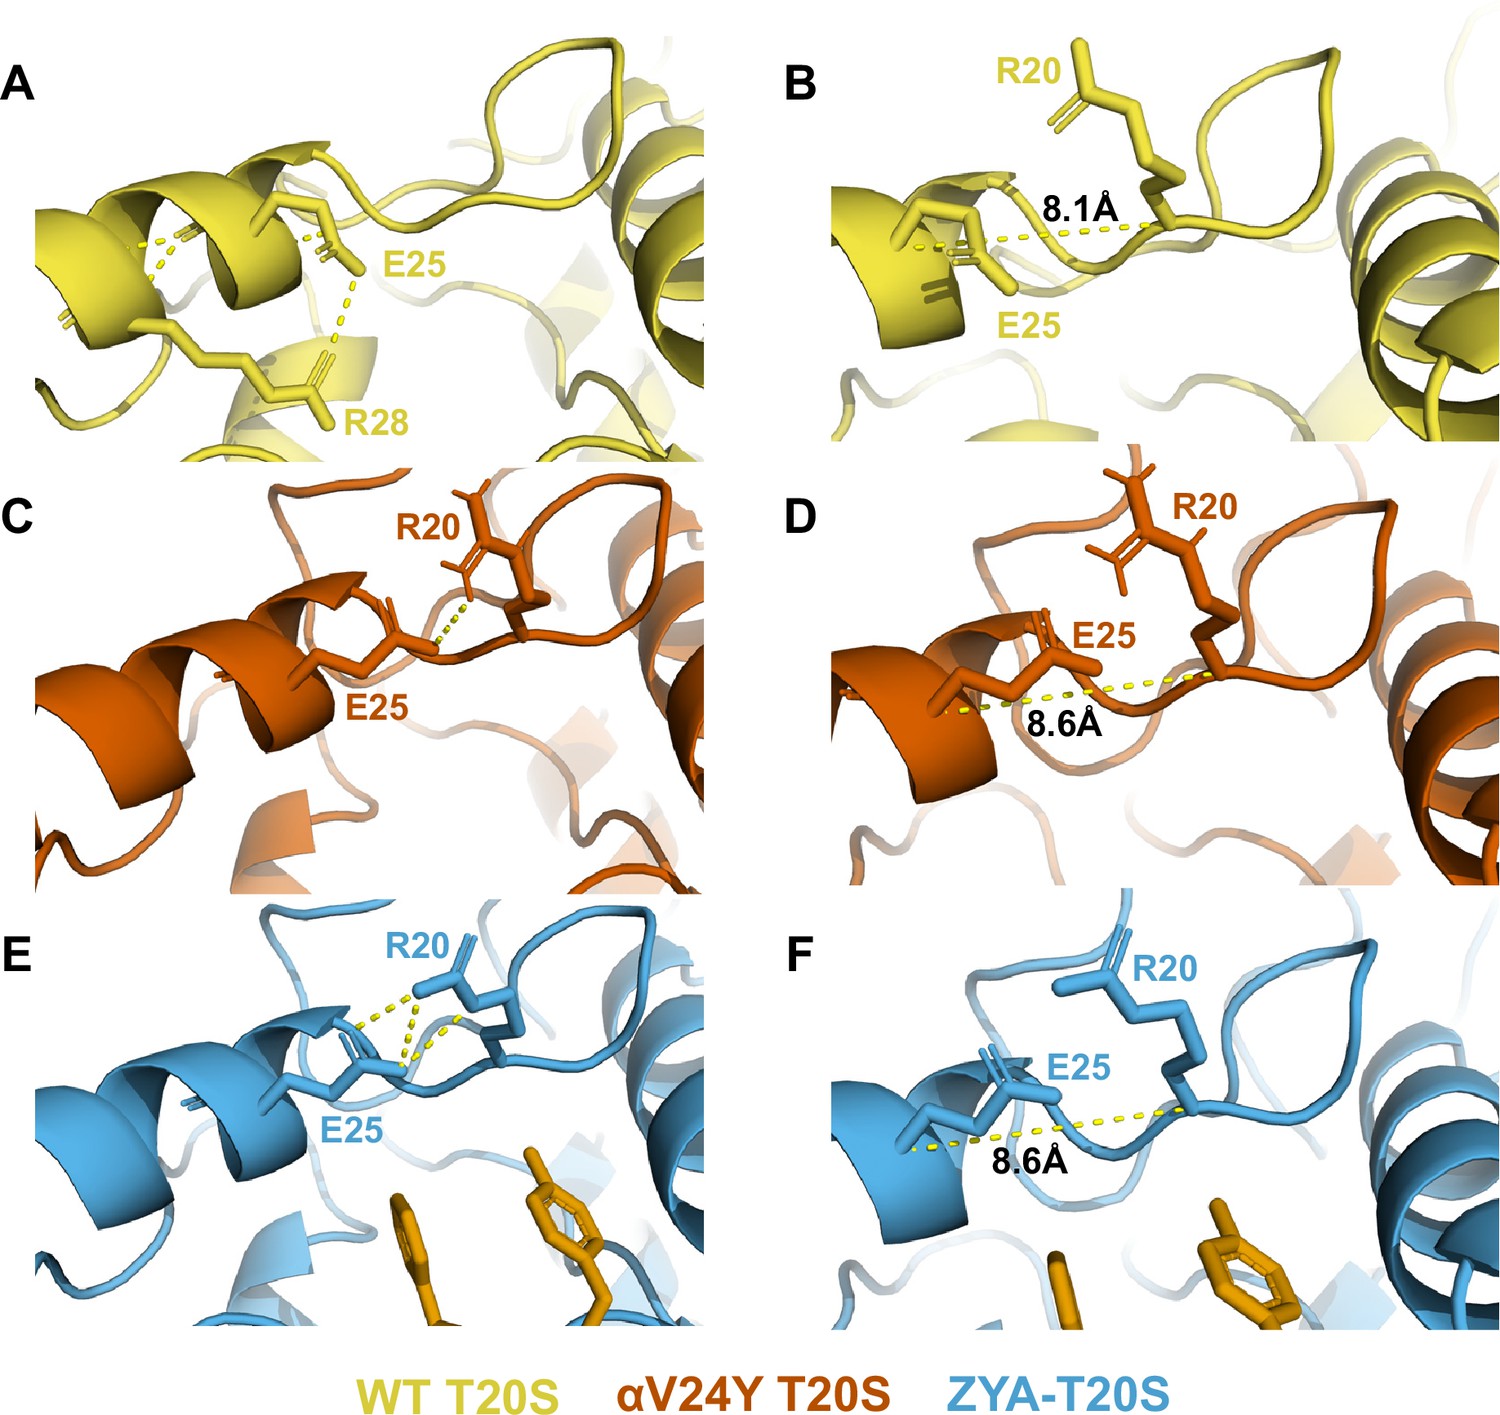
V24Y mutation and ZYA binding both alter E25’s H-bonding partner.
E25 hydrogen bonding is affected by hydrophobic group occupancy in the HbYX hydrophobic pocket as it is positioned at the top of this pocket. (A) E25 is H-bonded to R28 in the WT T20S. (B) Distance between E25 and R20 in the wild-type (WT) T20S. (C) E25 H-bonds with R20 in the V24Y T20S. (D) Distance between E25 and R20 in the V24Y T20S. (E) E25 H-bonds with R20 in ZYA-T20S structure. (F) Distance between E25 and R20 in the ZYA-T20S.
Figure 4—figure supplement 3
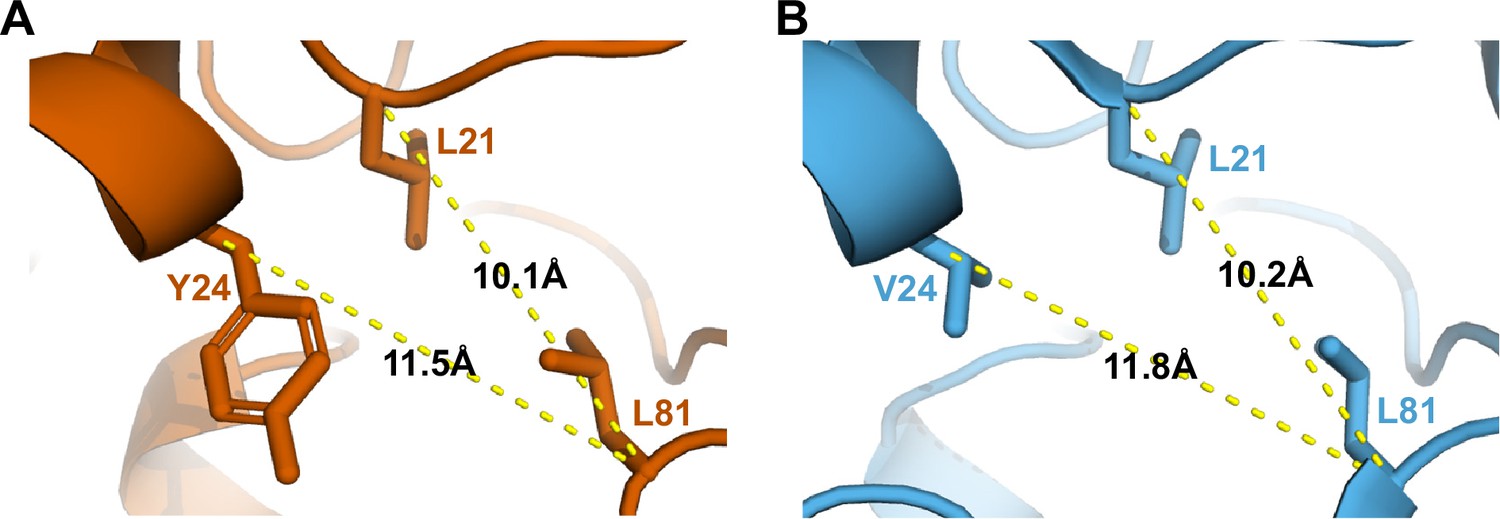
Comparison of HbYX hydrophobic pocket in V24Y T20S and ZYA-T20S structures.
(A) Distances between the α-carbon of selected residues (shown in sticks) to be compared against B to demonstrate the similarities and minimal level of intrasubunit conformational changes between these structures. (B) Same as A except the ZYA-T20S model (blue) was used.
Figure 4—figure supplement 4
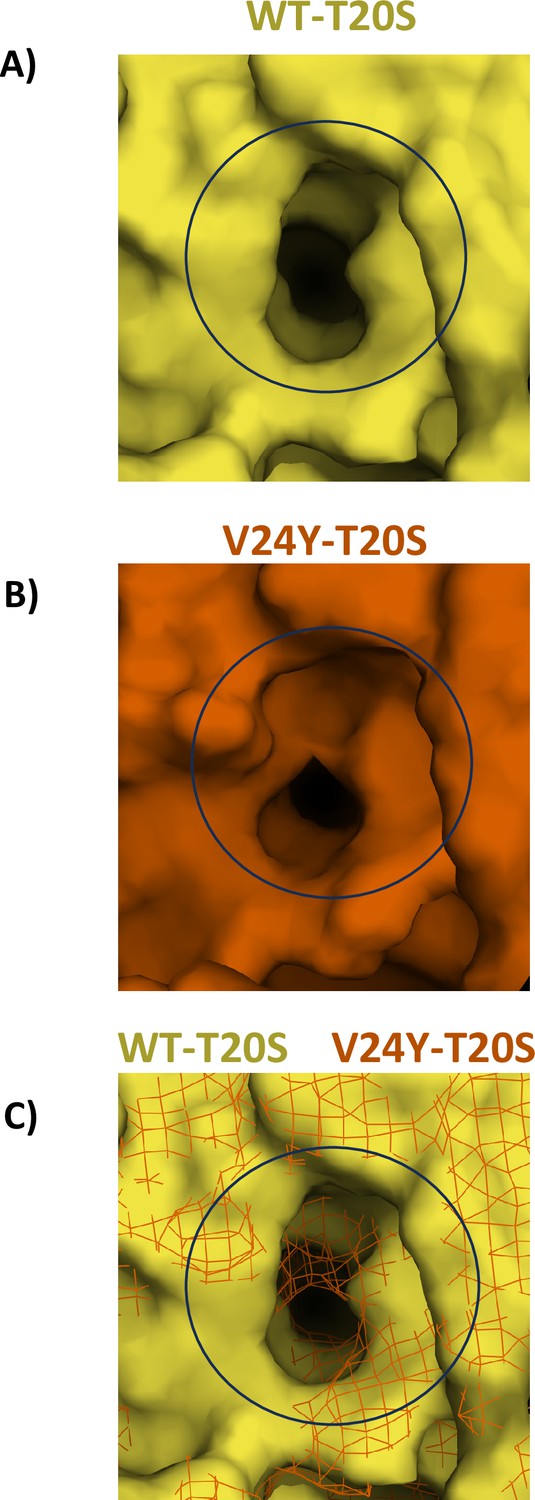
Comparison of surface area of HbYX hydrophobic pocket in WT T20S and V24Y T20S structures.
Wild-type (WT) (A) and V24Y (B) T20S models are presented with molecular surfaces (Pymol) with a focus on the hydrophobic pocket (center of black circle). (C) The two subunits that compose the intersubunit pocket for the WT and V24Y T20S were aligned and WT T20S was represented with a surface and V24Y T20S represented as a mesh to show the degree to which the V24Y mutation increases occupancy of the hydrophobic pocket (black circle).
Figure 5
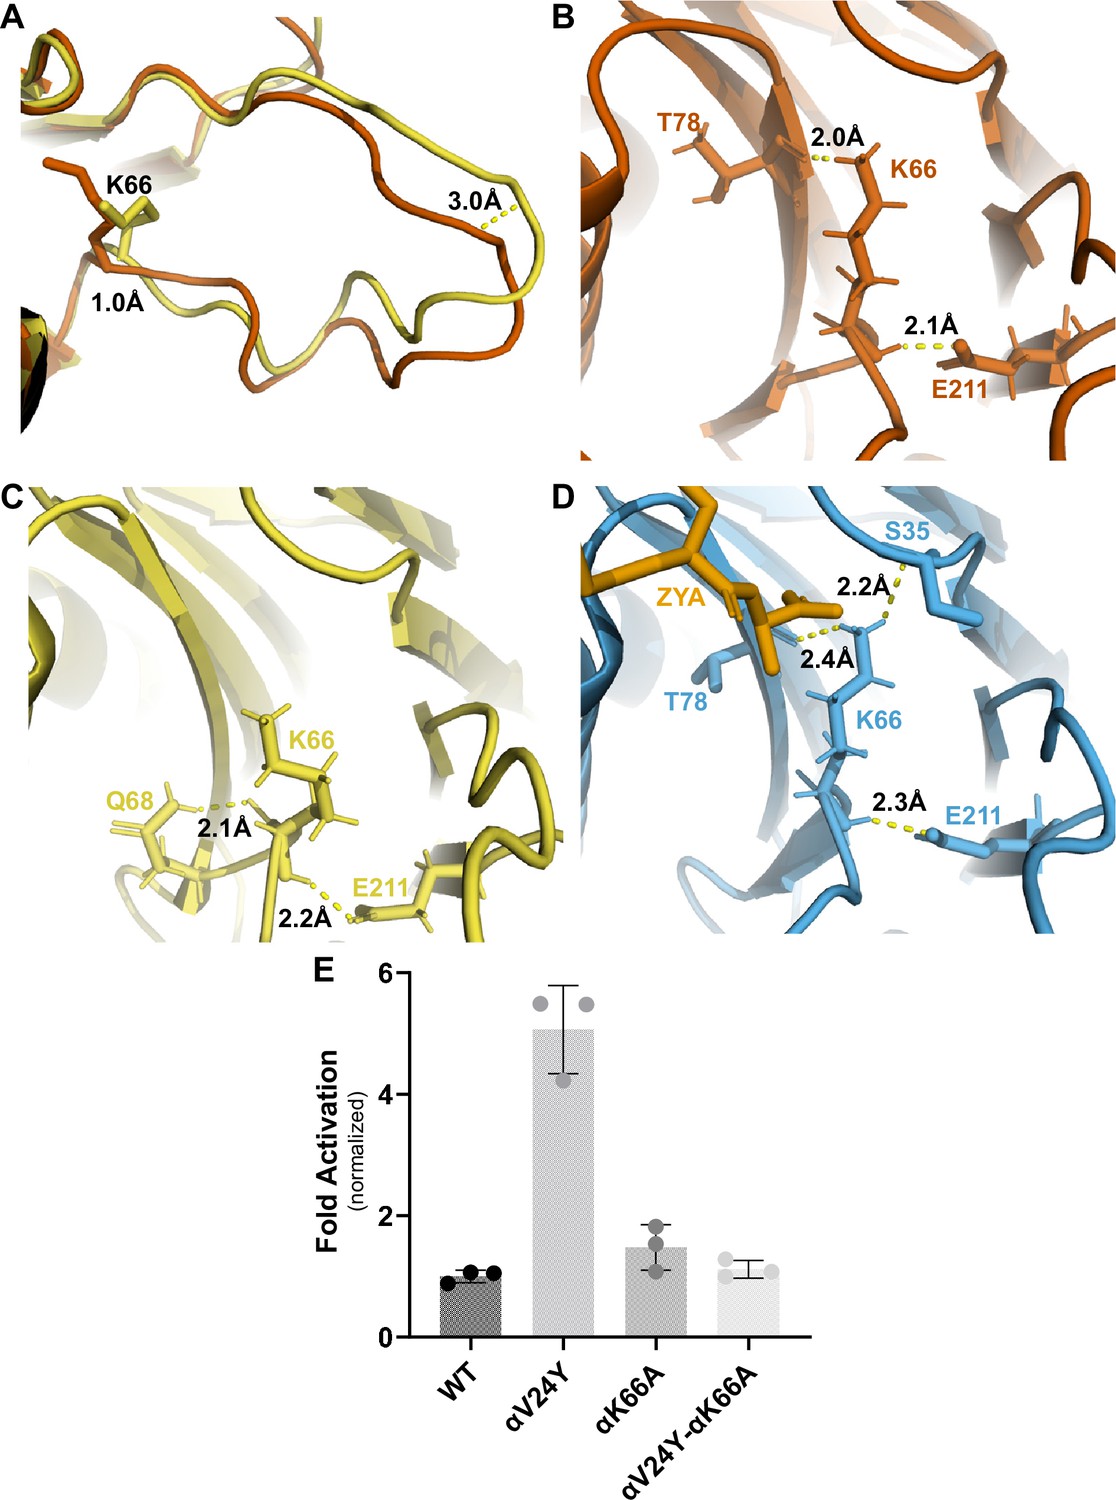
αK66 plays a key role in stabilizing the open state of the T20S, even in the absence of proteasome activator binding.
(A) Overlay of wild-type (WT) T20S (yellow) and αV24Y T20S (red), aligned by individual α subunits, showing a close up of the αK66 (shown in sticks) back loop. Distance measured demonstrates the extent of intrasubunit conformational changes in the ‘back loop’ and K66 α carbon. (B) Close up of αV24Y T20S (red) model, showing the polar interactions (yellow dotted lines) between αK66 and surrounding residues (shown in sticks). Distances are measured between the exact atoms involved in the polar interactions. (C) Same as B except it is the WT T20S (yellow) model. (D) Same as B except it is the ZYA-T20S (blue) model and ZYA (gold). (E) WT T20S and mutants were measured for activity based on LFP degradation rate (rfu/min), normalized to the WT T20S as a control. Data (means) are representative of three or more independent experiments, each performed in triplicate. Error bars represent ± standard deviation.
Figure 6
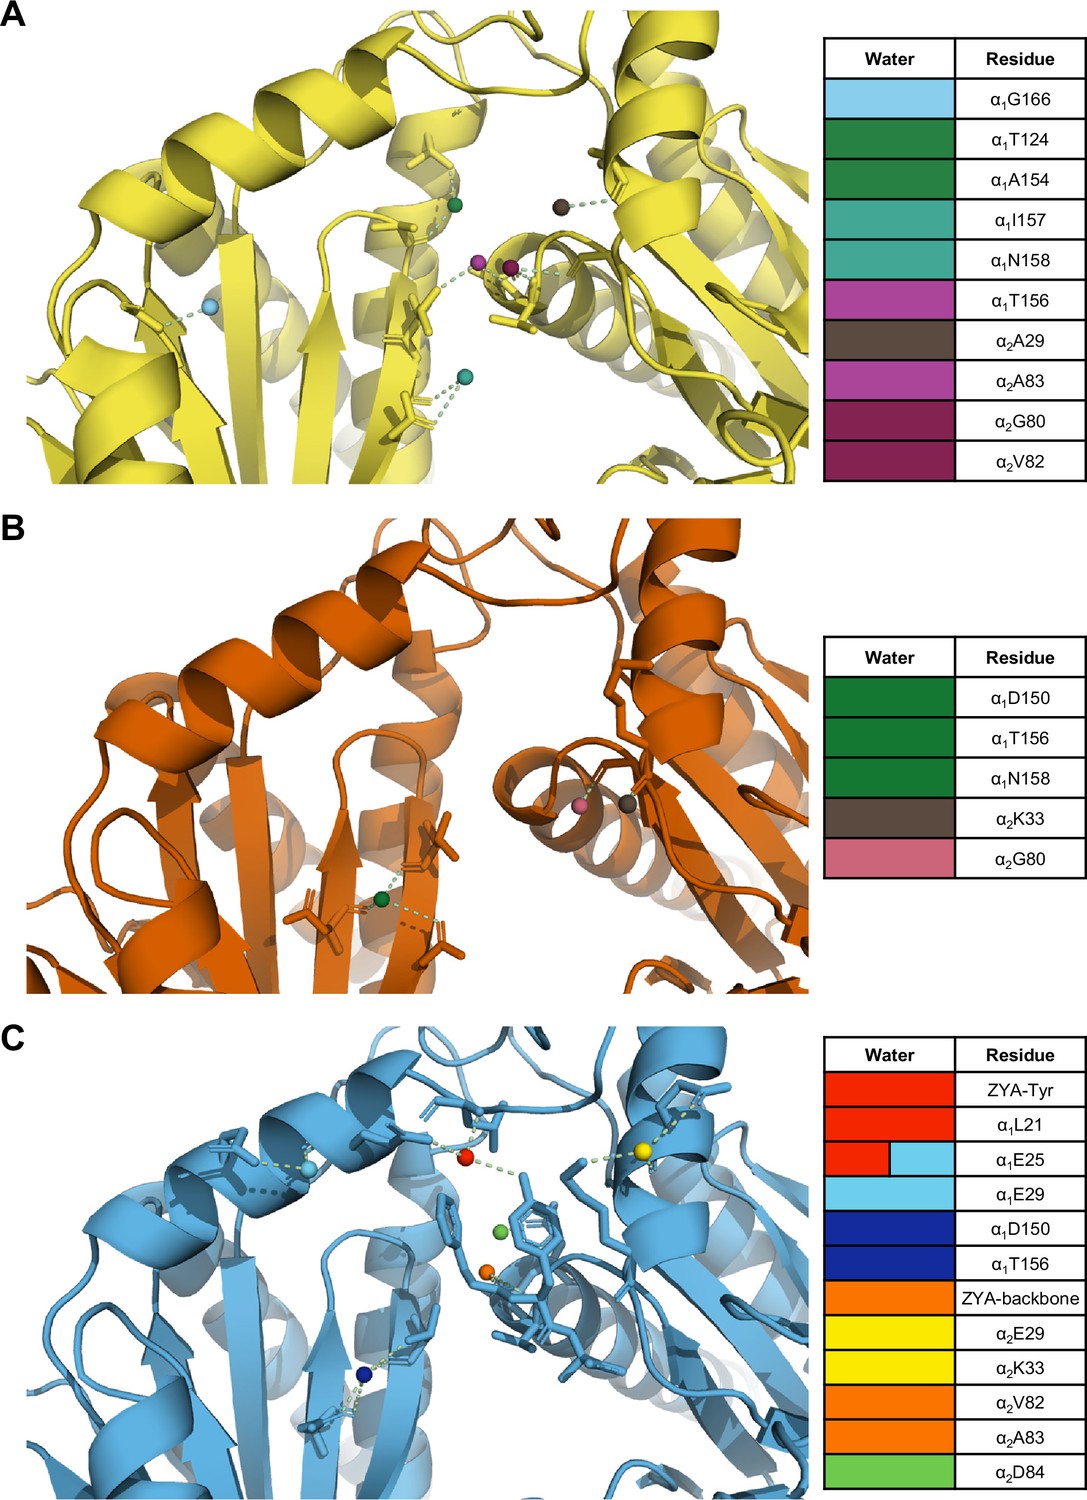
The interunit pocket of the αV24Y T20S is less populated with waters, relative to ZYA T20S and wild-type (WT) T20S.
(A) Intersubunit pocket of WT T20S model (yellow) showing waters (spheres) and their interactions (yellow dotted lines) with the residues (shown in sticks, listed in table) in the intersubunit pocket. Spheres are colored individually and match the colors on the table (right) to identify residues it interacts with. (B, C) Same as A except αV24Y T20S model (red) and ZYA-T20S model (blue).
Figure 7 with 2 supplements
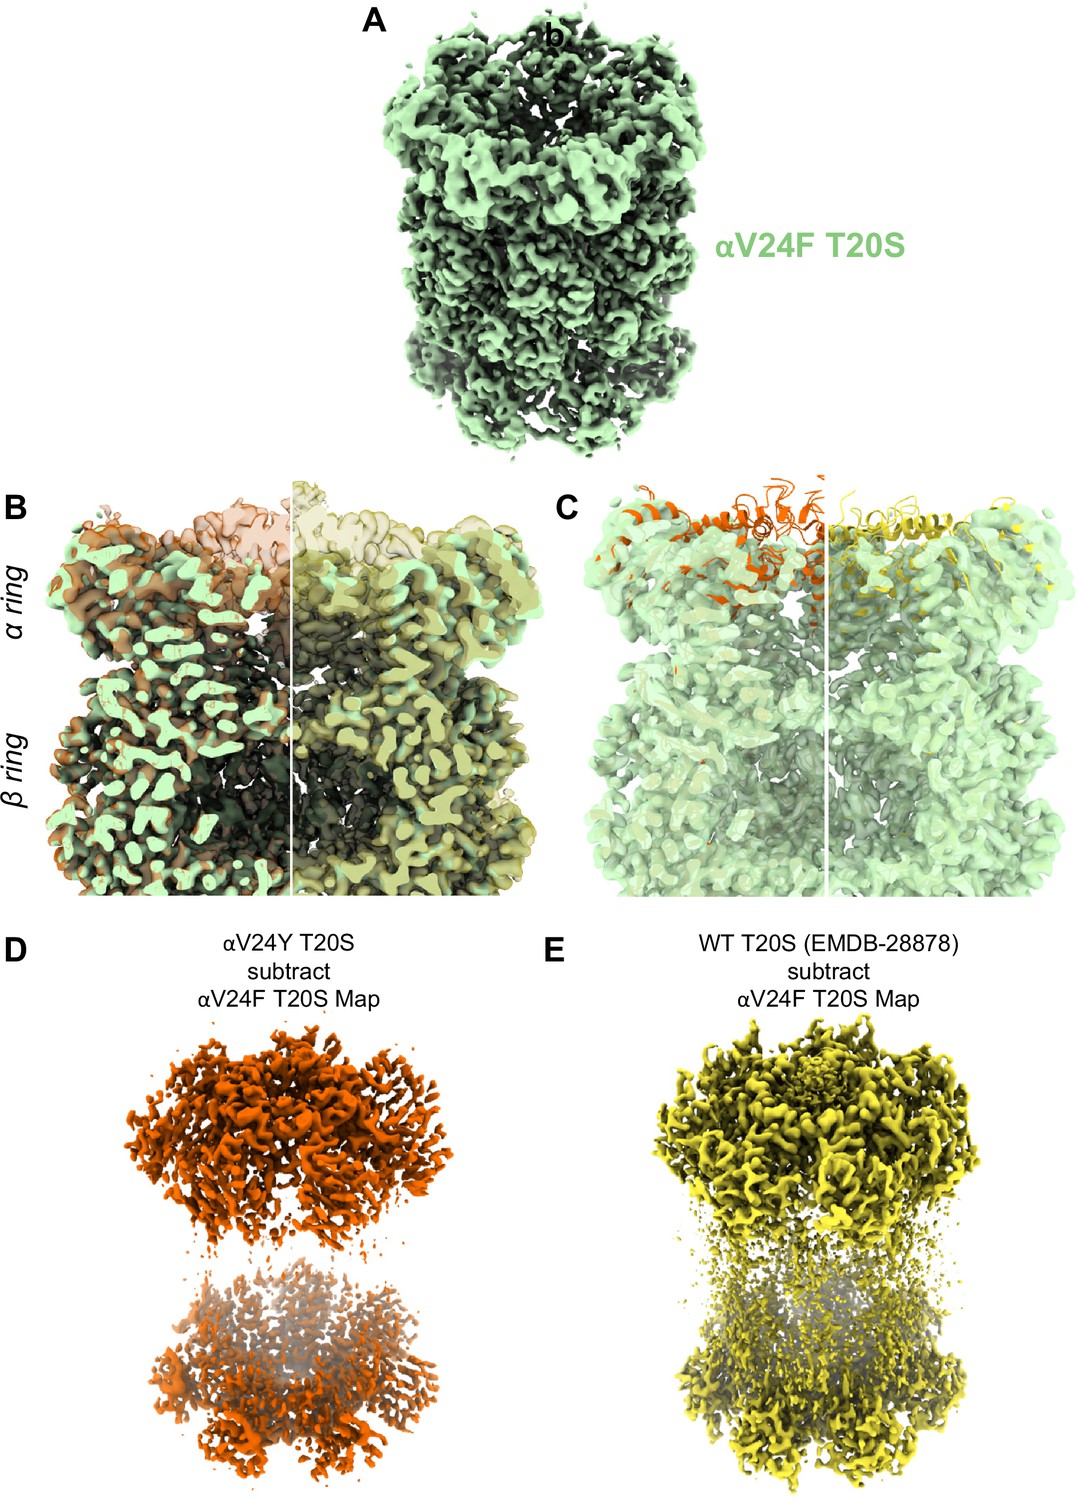
A large portion of the N-terminal domain of the αV24F T20S mutant is unstructured.
(A) Angled view of αV24F T20S 2.2 Å electron density map (green), showing the α and β rings. (B) Overlay of αV24F T20S map with αV24Y T20S map (red; transparent surface; left) and wild-type (WT) T20S map (yellow; transparent surface; right). (C) Same as B except αV24Y T20S model (red, cartoon, left) and WT T20S model (yellow; cartoon; right). (D) Difference map generated by subtracting αV24F T20S map from αV24Y T20S map, using ChimeraX. (E) Same as (D) except WT T20S map instead of αV24Y T20S map.
Figure 7—figure supplement 1
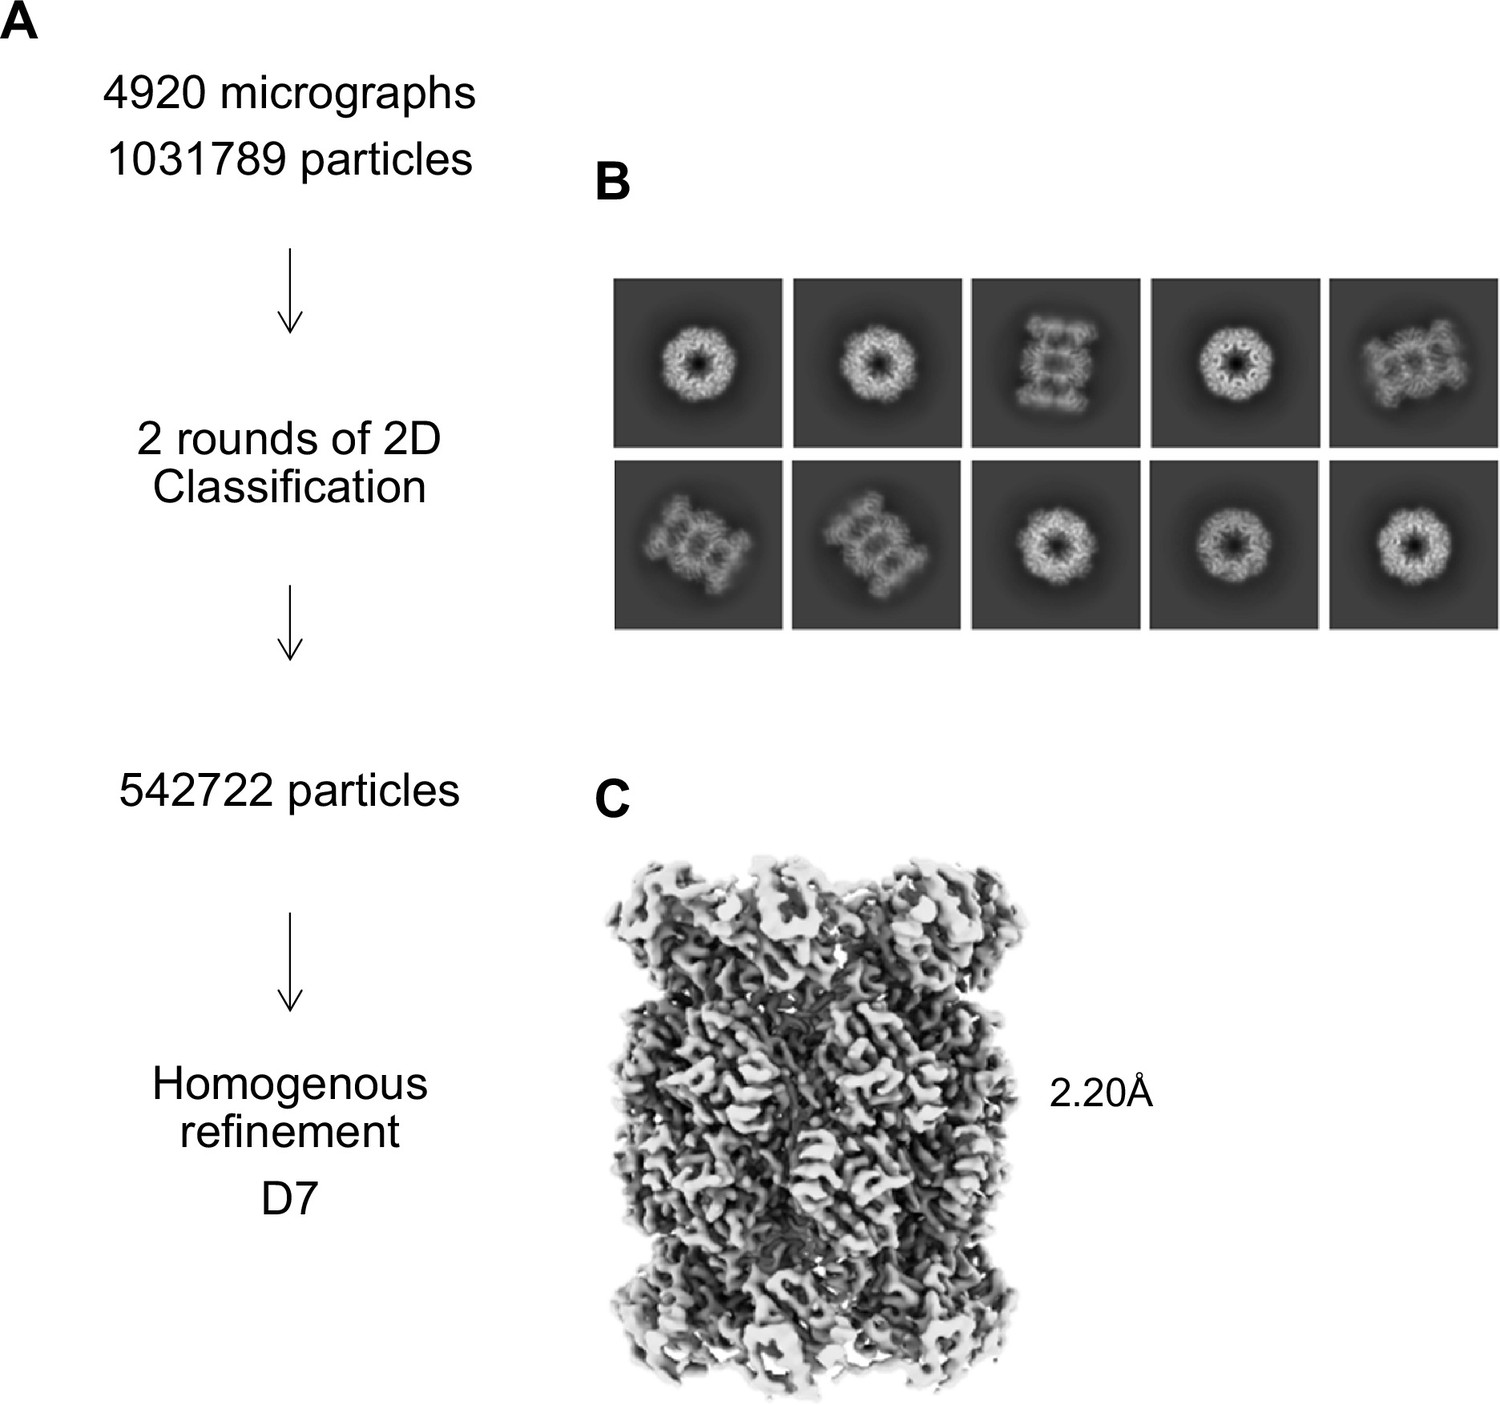
αV24F T20S Processing Scheme.
(A) Cryo-EM workflow for αV24F T20S. All steps were performed in Cryosparc. (B) Final 2D class averages after two rounds of 2D Classification are shown with a mixture of top and size views. (C) Homogeneous refinement of class of particles that showed the open gate conformation.
Figure 7—figure supplement 2
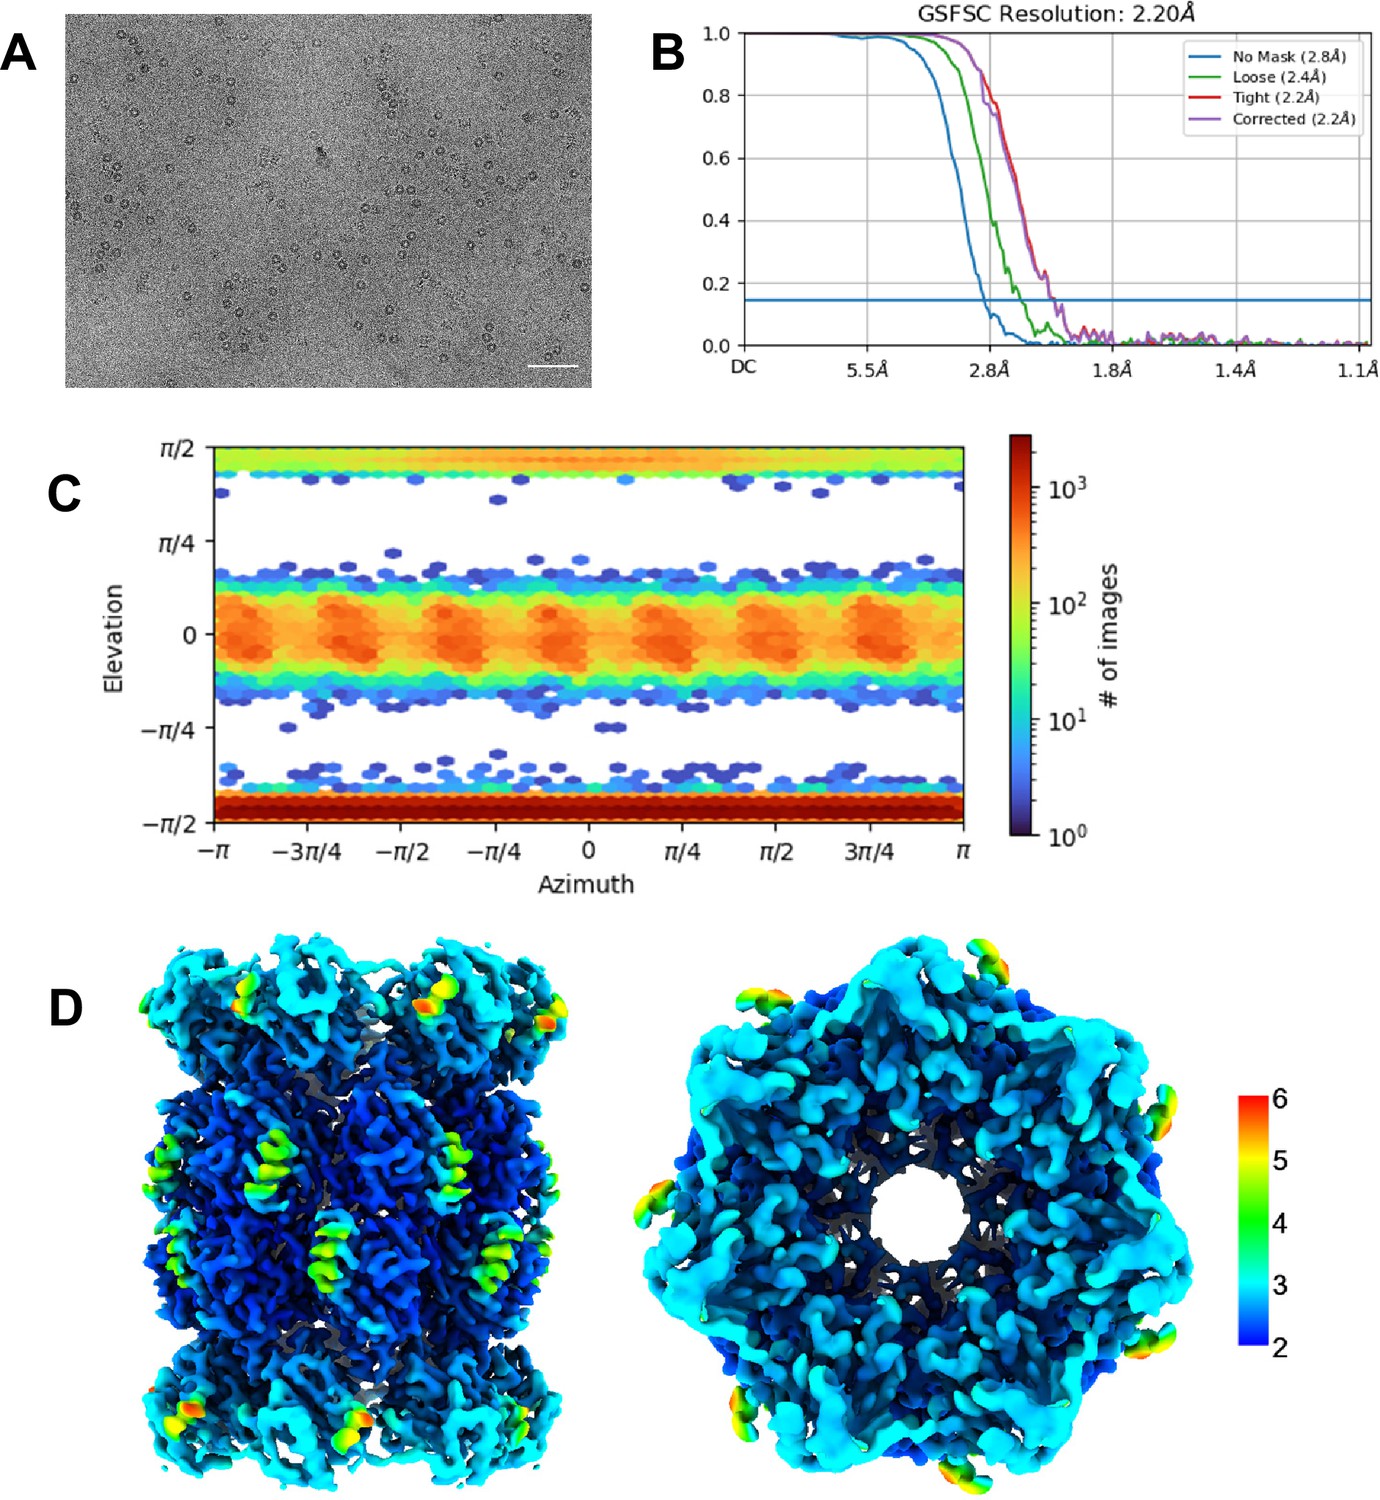
αV24Y T20S Validation.
(A) Micrograph representative showing αV24F T20S. Scale bar represents 5 nm. (B) Standard FSC-0.143 graph showing corrected 2.20 Å resolution. (C) View of particle angle distribution showing a mixture of side and top view particles. (D) Particles from selected ab initio model were refined with homogenous refinement and D7 symmetry applied (D7 symmetry was appropriately confirmed as discussed in SFig. 2d). Final 2.20 Å D7 map was colored in Chimera to show range of resolution of 3D reconstructed map.
Figure 8

Model for induction of gate opening by binding of the Hb group binding to the HbYX hydrophobic site in the 20 S intersubunit pockets.
Binding of the Hb group of the HbYX motif, or tyrosine of αV24Y, is expected to initiate an allosteric chain of events that leads to 20 S gate opening. Hb group binding causes.
Additional files
Download links
A two-part list of links to download the article, or parts of the article, in various formats.
Downloads (link to download the article as PDF)
Open citations (links to open the citations from this article in various online reference manager services)
Cite this article (links to download the citations from this article in formats compatible with various reference manager tools)
Occupancy of the HbYX hydrophobic pocket is sufficient to induce gate opening in the archaeal 20S proteasomes
eLife 14:RP106611.
https://doi.org/10.7554/eLife.106611.3


