Targeted protein degradation by KLHDC2 ligands identified by high-throughput screening
- Department of Chemistry, Scripps Research, United States
- Department of Integrative Structural and Computational Biology, Scripps Research, United States
- Chemical & Biological Integrative Research Center, Korea Institute of Science and Technology, Republic of Korea
- Department of Biology, Calibr-Skaggs at Scripps Research, United States
Figures
Figure 1 with 1 supplement
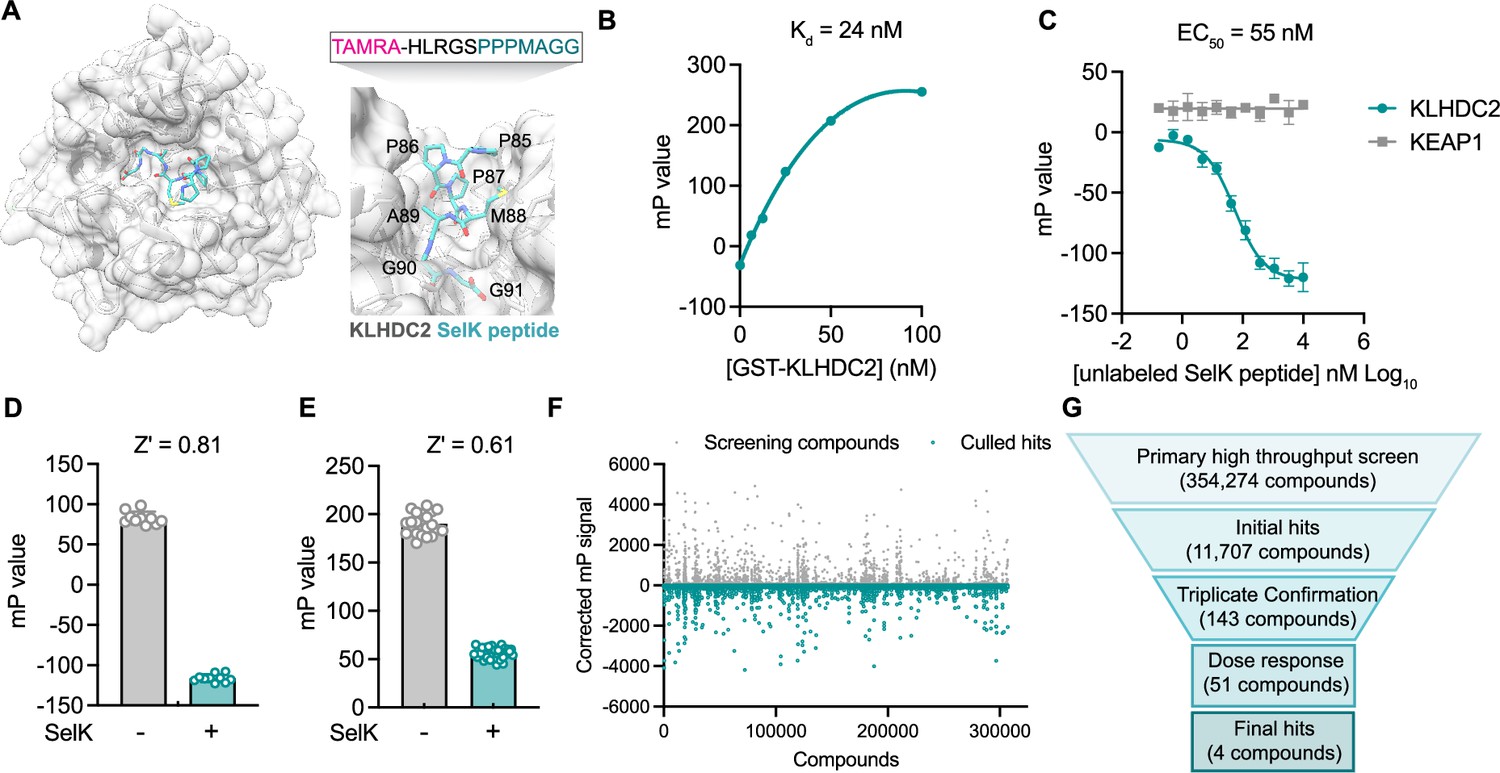
A fluorescence polarization-based screen identifies ligands of the Kelch domain of KLHDC2.
(A) Structure of the Kelch domain of KLHDC2 from PDB 6DO3 bound to PPPMAGG, C-terminal peptide from SelK (left). Interface of SelK peptide (teal) bound to KLHDC2 (right) with TAMRA-labeled peptide used in this work above. (B) Fluorescence polarization signal of TAMRA-SelK peptide in response to increasing concentrations of GST-KLHDC2. (C) Fluorescence polarization signal from KLHDC2 and KEAP1 assays in response to increasing concentrations of unlabeled SelK peptide (n=3; mean and s.e.m.). Fluorescence polarization signals in Z’-based determination assays with and without unlabeled SelK peptide (1 µM) in 384-well (D) and 1536-well (E) assays (n=20). (F) Corrected fluorescence polarization signal from the primary screening campaign with hits noted in teal. (G) Screening funnel depicting the high-throughput screening campaign.
-
Figure 1—source data 1
Raw data corresponding to Figure 1B–F.
- https://cdn.elifesciences.org/articles/106844/elife-106844-fig1-data1-v1.xlsx
Figure 1—figure supplement 1
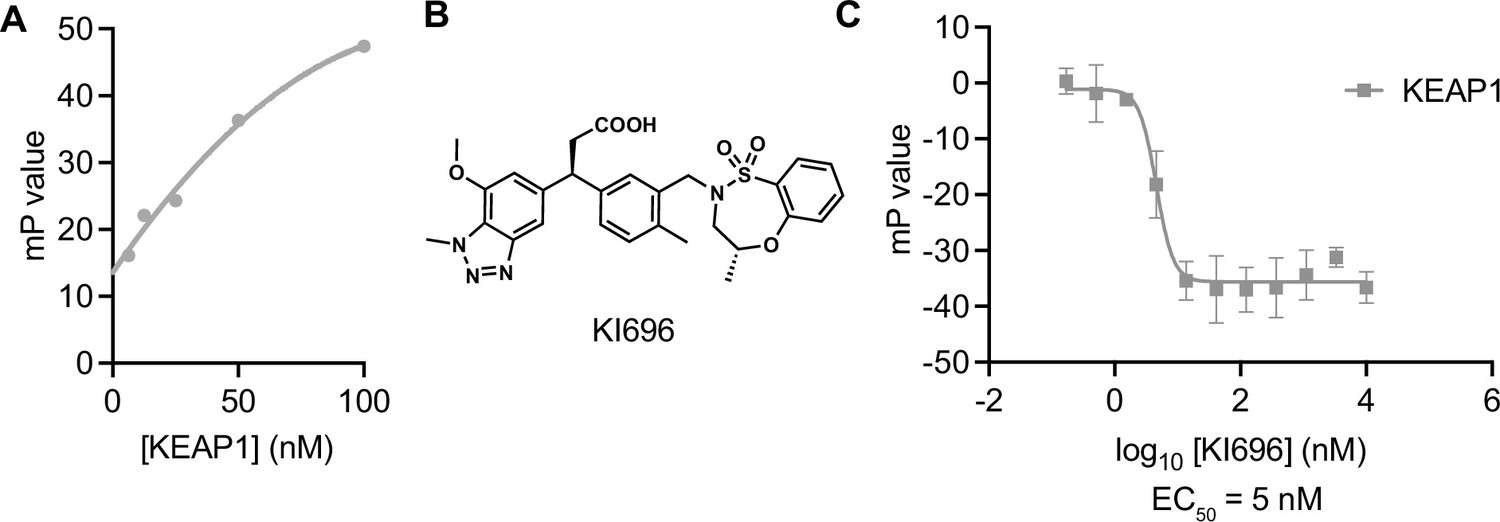
A fluorescence polarization-based control assay with Kelch domain-containing protein KEAP1.
(A) Fluorescence polarization signal of TAMRA-conjugated NRF2 peptide in response to increasing concentrations of KEAP1. (B) Structure of KEAP1 Kelch domain ligand KI696. (C) Fluorescence polarization signal in response to the indicated concentrations of KI696 in the KEAP1 assay. n=3; mean and s.e.m.
Figure 2 with 1 supplement
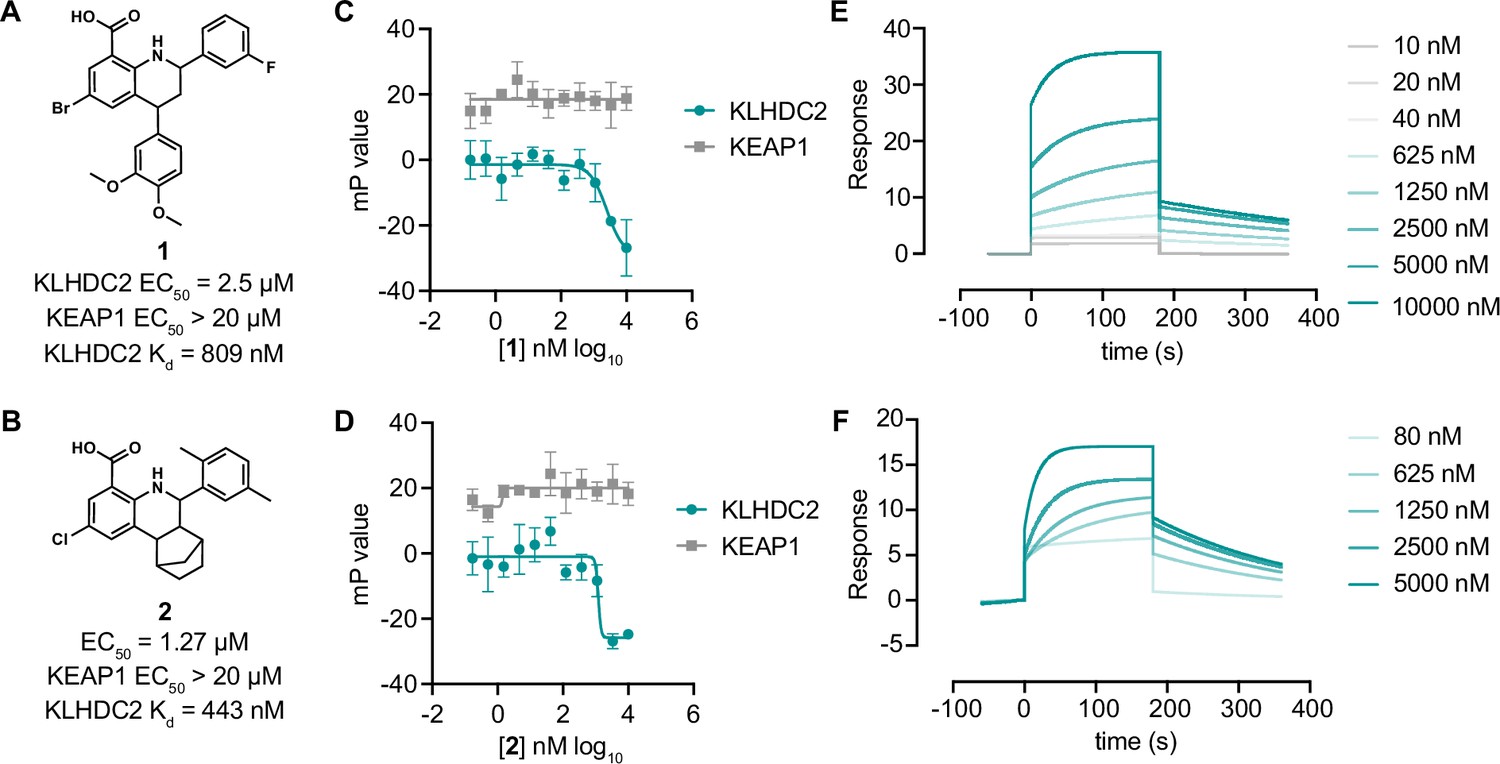
Tetrahydroquinoline-based KLHDC2 ligands.
Structures and summary of activities of compounds 1 (A) and 2 (B). (C) Fluorescence polarization signal from KLHDC2 and KEAP1 assays in response to increasing concentrations of 1 (C) and 2 (D) (n=3; mean and s.e.m.). Representative surface plasmon resonance (SPR) sensorgrams of KLHDC2 binding from the indicated concentrations of 1 (E) and 2 (F).
-
Figure 2—source data 1
Raw data corresponding to Figure 2C–F.
- https://cdn.elifesciences.org/articles/106844/elife-106844-fig2-data1-v1.xlsx
Figure 2—figure supplement 1
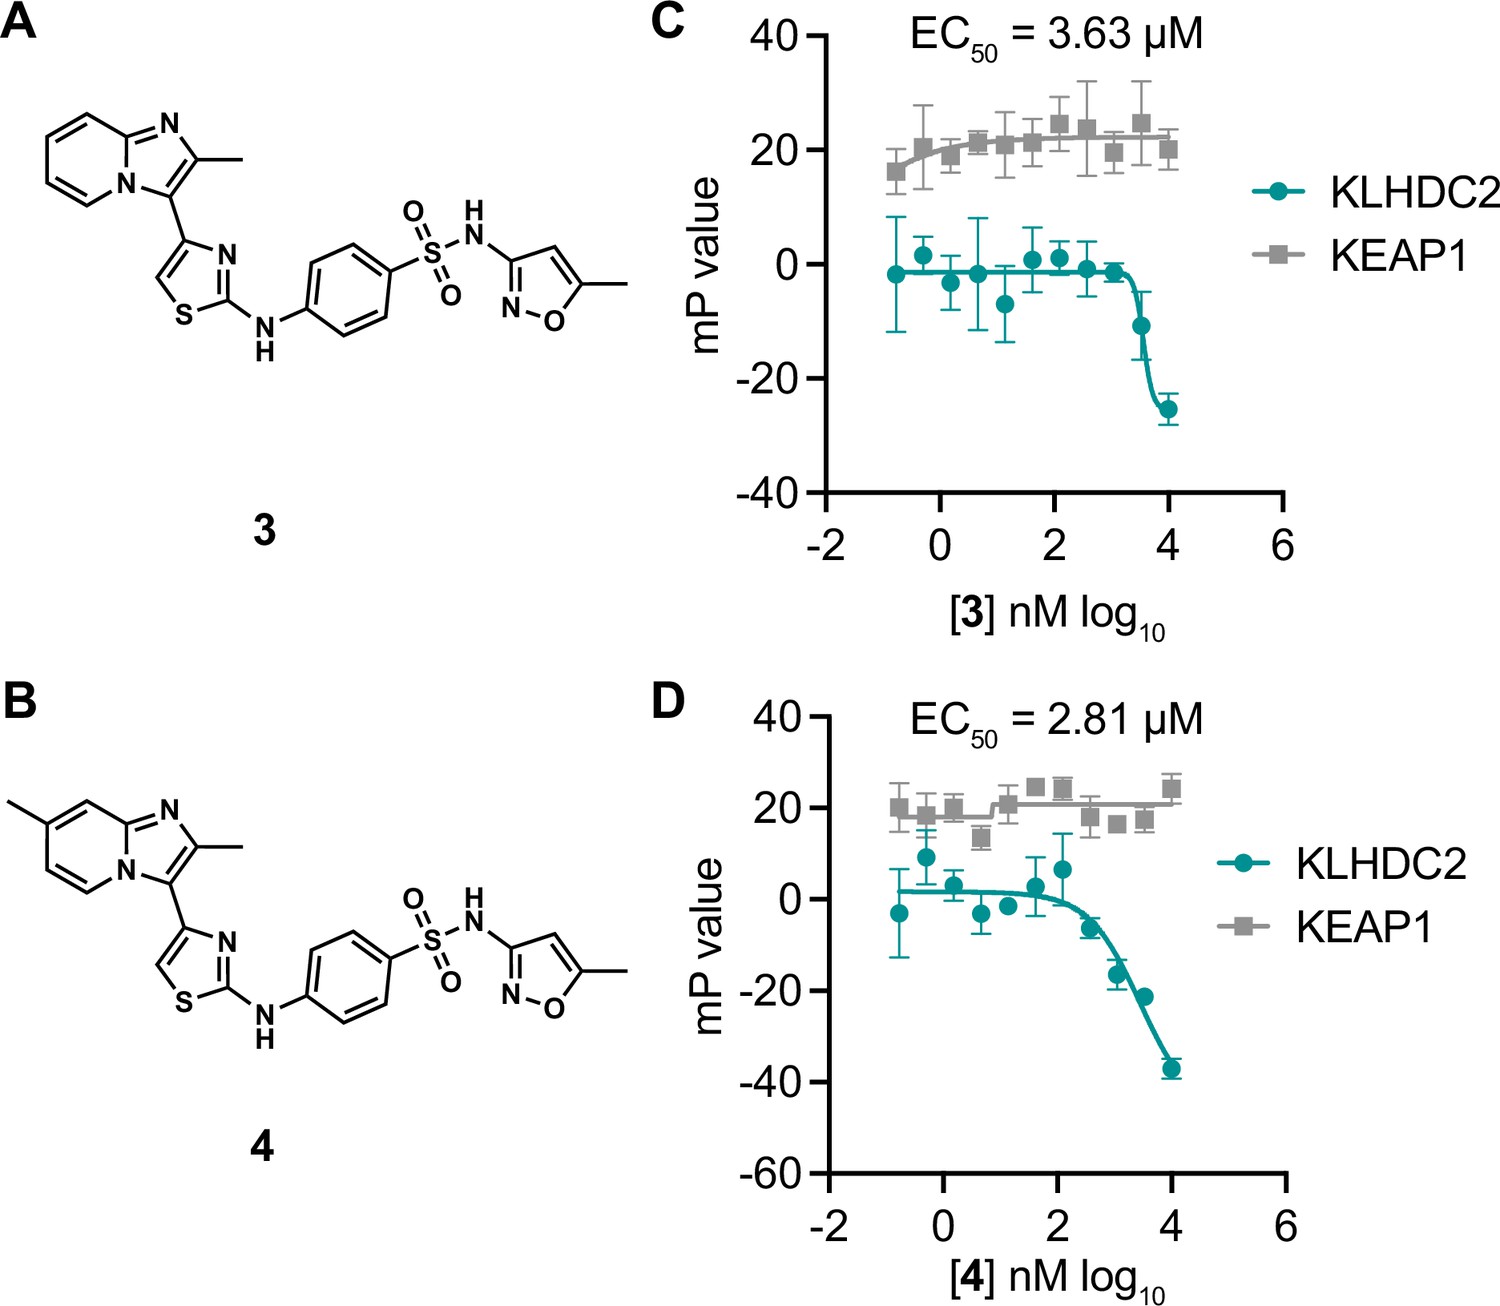
A 2-amino thiazole-based KLHDC2 ligand scaffold.
Structures of compounds 3 (A) and 4 (B). Fluorescence polarization signal from KLHDC2 and KEAP1 assays from the indicated concentrations of 3 (C) and 4 (D) (n=3; mean and s.e.m.).
Figure 3
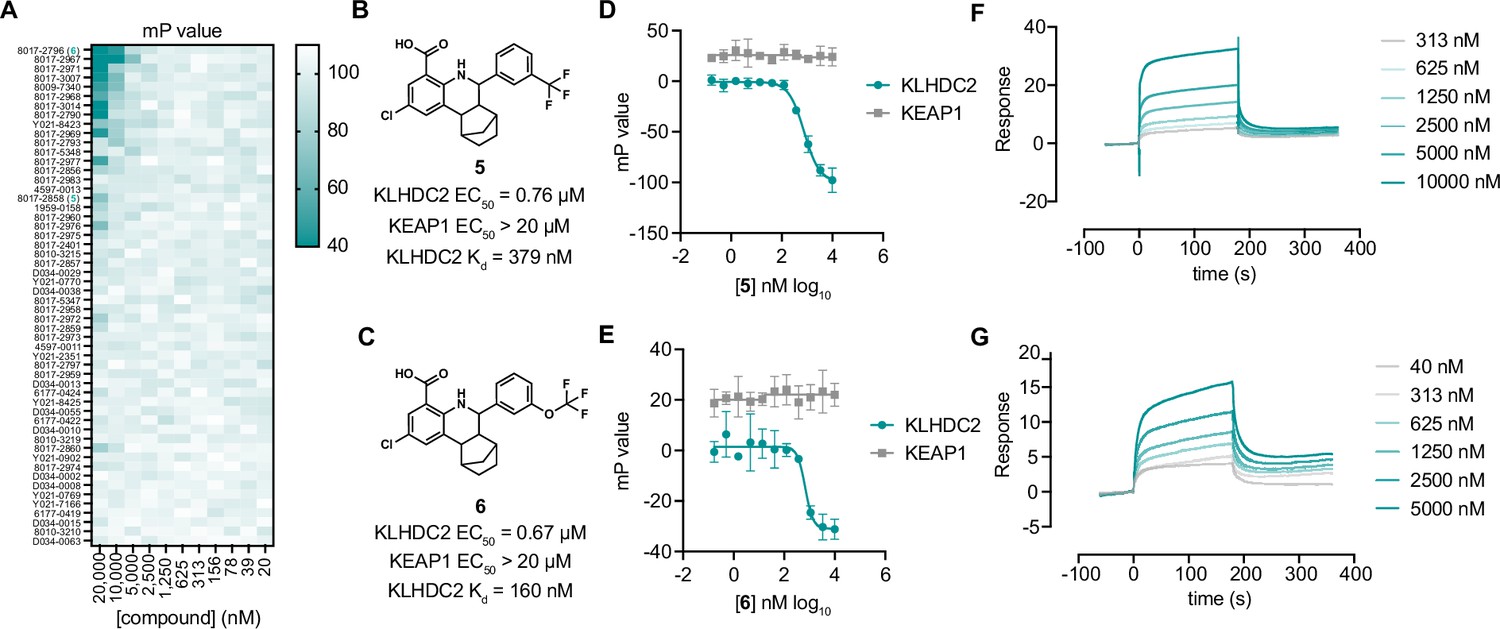
Optimization of tetrahydroquinolines as KLHDC2 ligands.
(A) Heatmap of fluorescence polarization signal in response to dose responses of the 54 related compounds. Structures and summary of activities of compounds 5 (B) and 6 (C). Fluorescence polarization signal from KLHDC2 and KEAP1 assays in response to increasing concentrations of 5 (D) and 6 (E) (n=3; mean and s.e.m.). Representative surface plasmon resonance (SPR) sensorgrams of KLHDC2 binding from the indicated concentrations of 5 (F) and 6 (G).
-
Figure 3—source data 1
Raw data corresponding to Figure 3A, D–G.
- https://cdn.elifesciences.org/articles/106844/elife-106844-fig3-data1-v1.xlsx
Figure 4
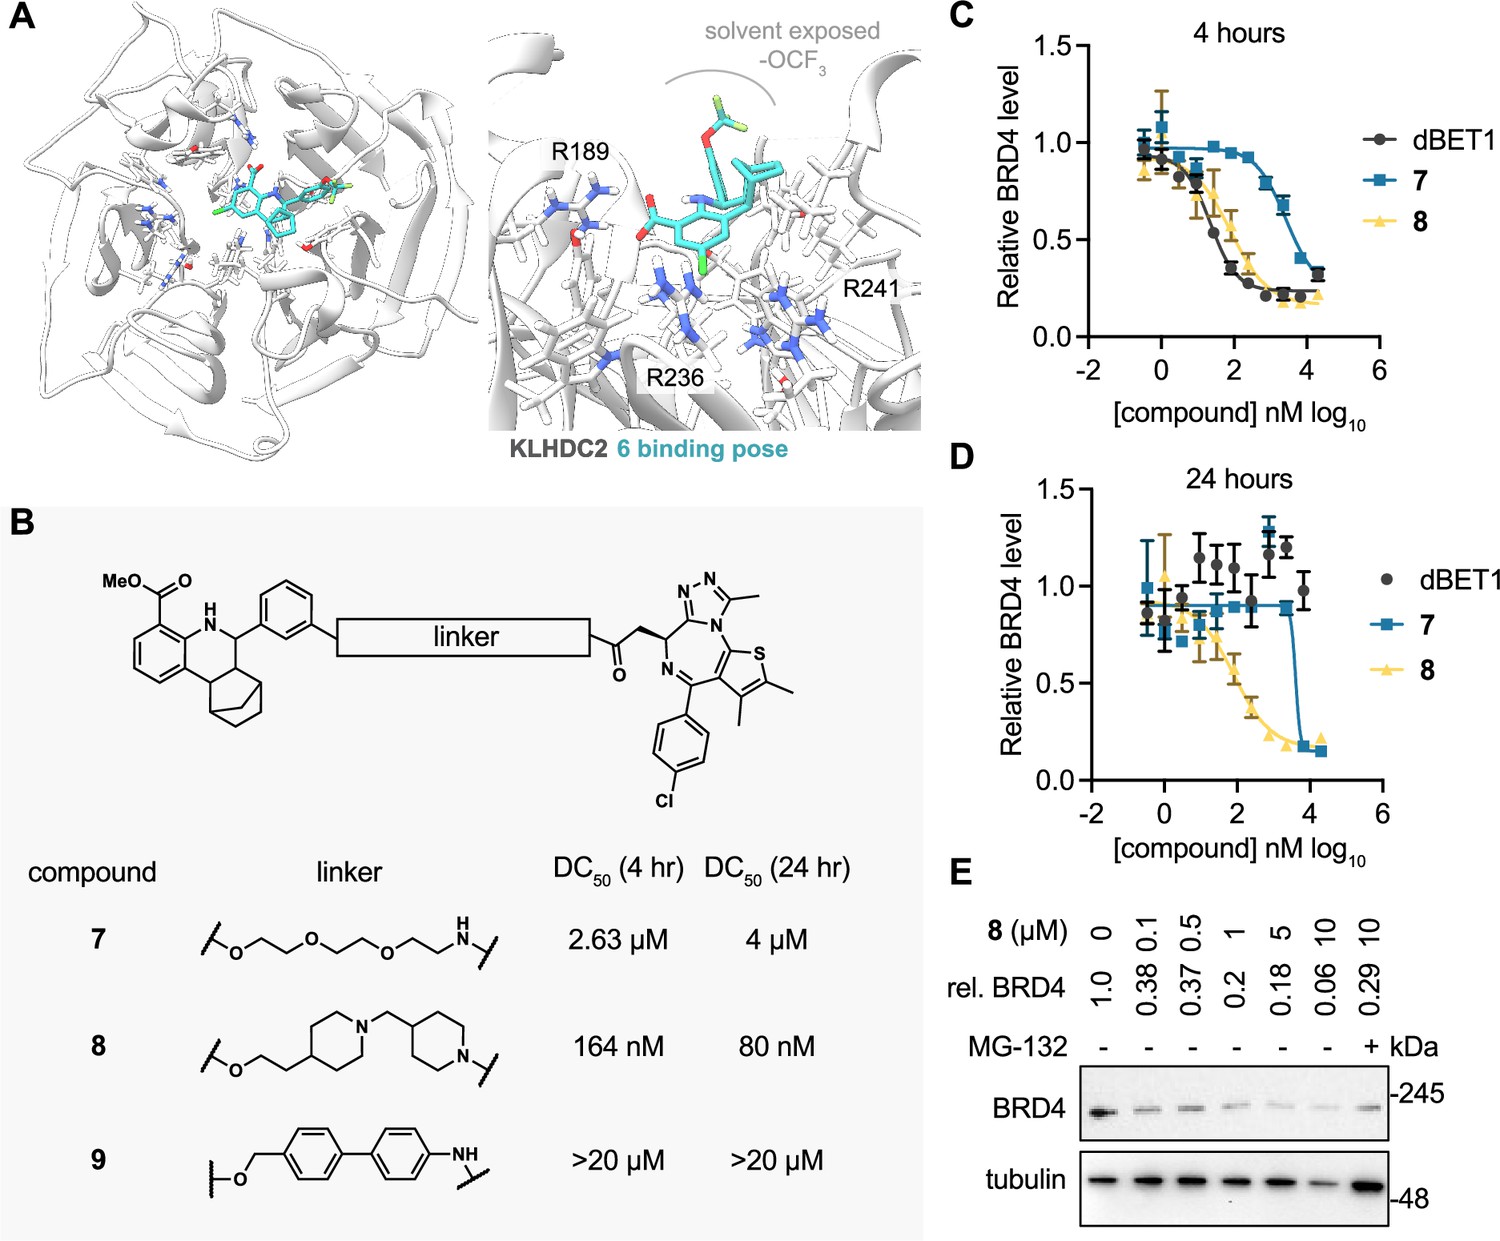
KLHDC2 ligands can be co-opted for targeted degradation of BRD4.
(A) Binding pose of compound 6 to KHLDC2 (PDB 6DO3). (B) Structure and summary of activities of the indicated proteolysis-targeting chimeras (PROTAC) molecules. Relative BRD4 levels at 4 (C) or 24 hr (D) as measured by luminescence from HEK293T cells expressing a HiBiT-tagged BRD4 transgene (n=3; mean and s.e.m.). (E) Representative western blot and densitometry-based quantification of BRD4 levels from SK-BR-3 in response to 24 hr treatment with the indicated concentrations of 8.
-
Figure 4—source data 1
Raw data corresponding to Figure 4C and D.
- https://cdn.elifesciences.org/articles/106844/elife-106844-fig4-data1-v1.xlsx
-
Figure 4—source data 2
Uncropped blots of Figure 4E.
- https://cdn.elifesciences.org/articles/106844/elife-106844-fig4-data2-v1.zip
-
Figure 4—source data 3
Original image scans of Figure 4E.
- https://cdn.elifesciences.org/articles/106844/elife-106844-fig4-data3-v1.zip
Appendix 1—scheme 1
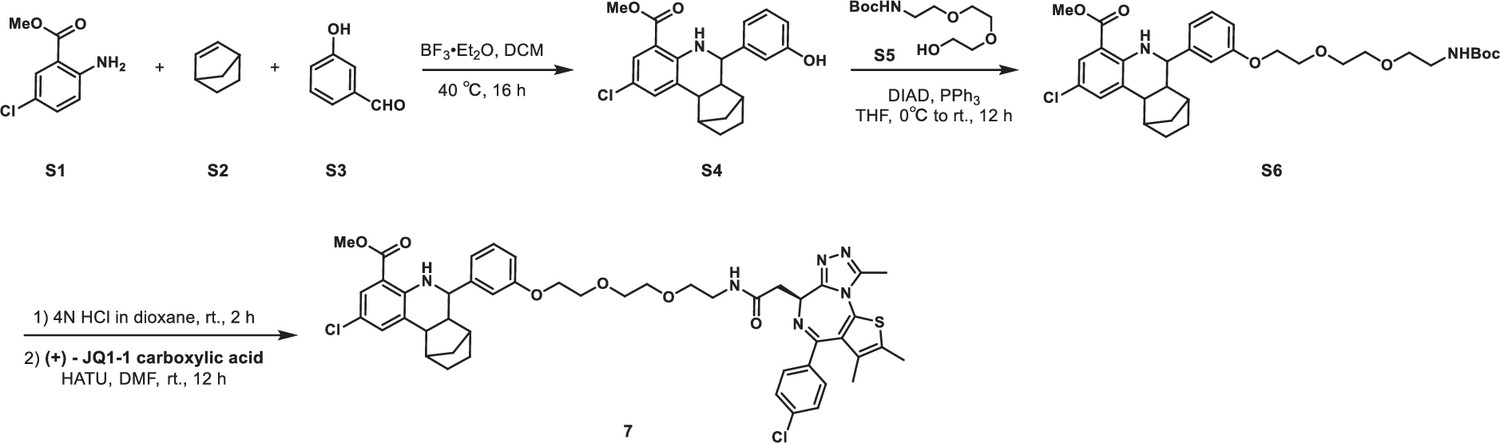
Synethic scheme of the synthesis of Compound 7.
Appendix 1—scheme 2
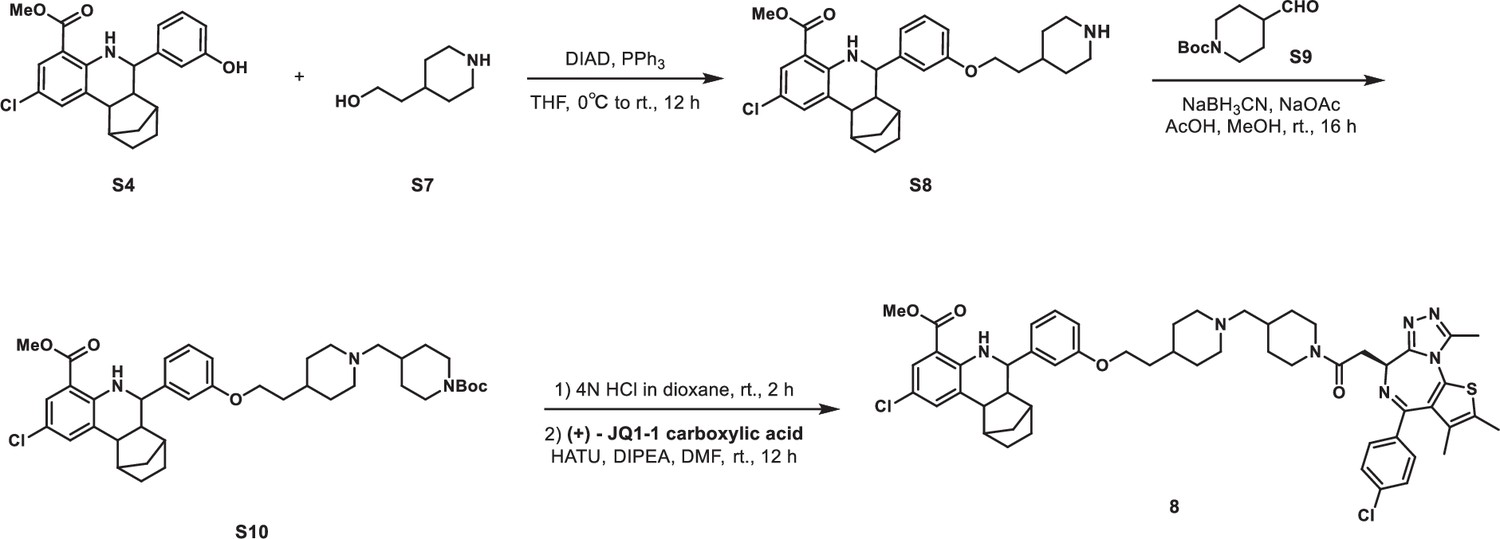
Synethic scheme of the synthesis of Compound 8.
Appendix 1—scheme 3
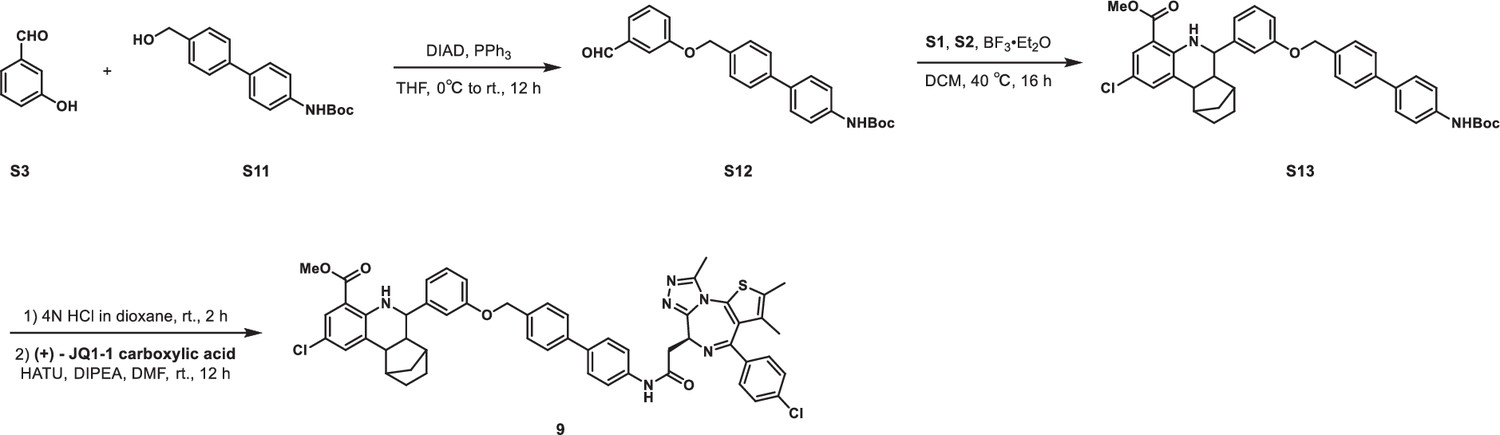
Synethic scheme of the synthesis of Compound 9.
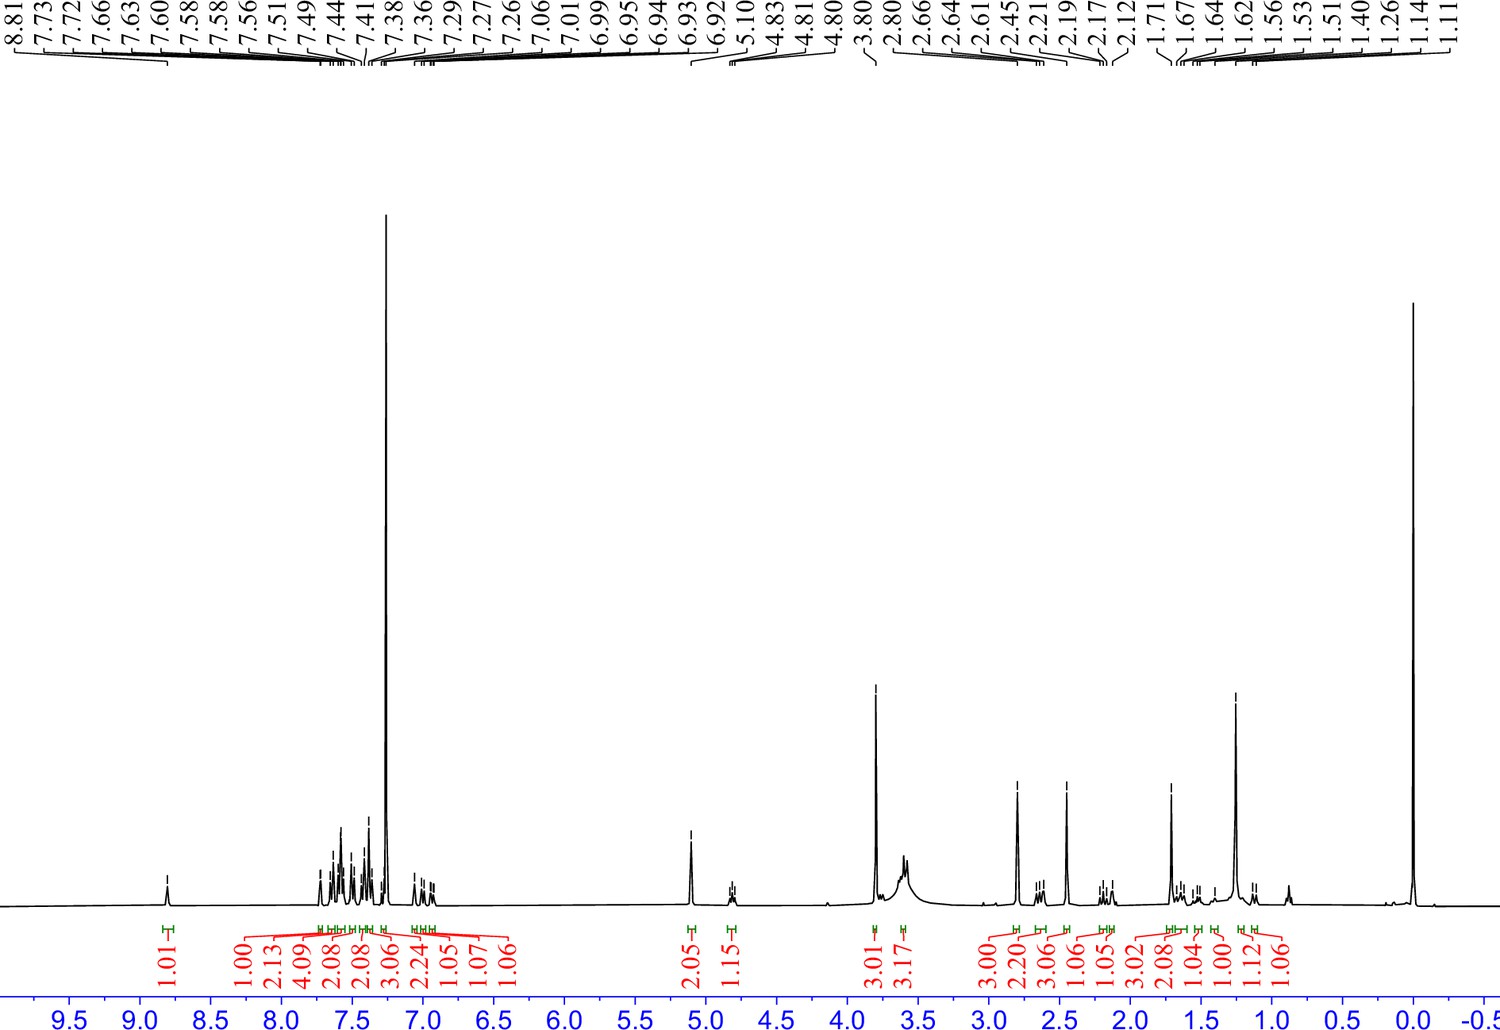
Appendix 1—figure 1
1H NMR spectra of 7 in CDCl3.
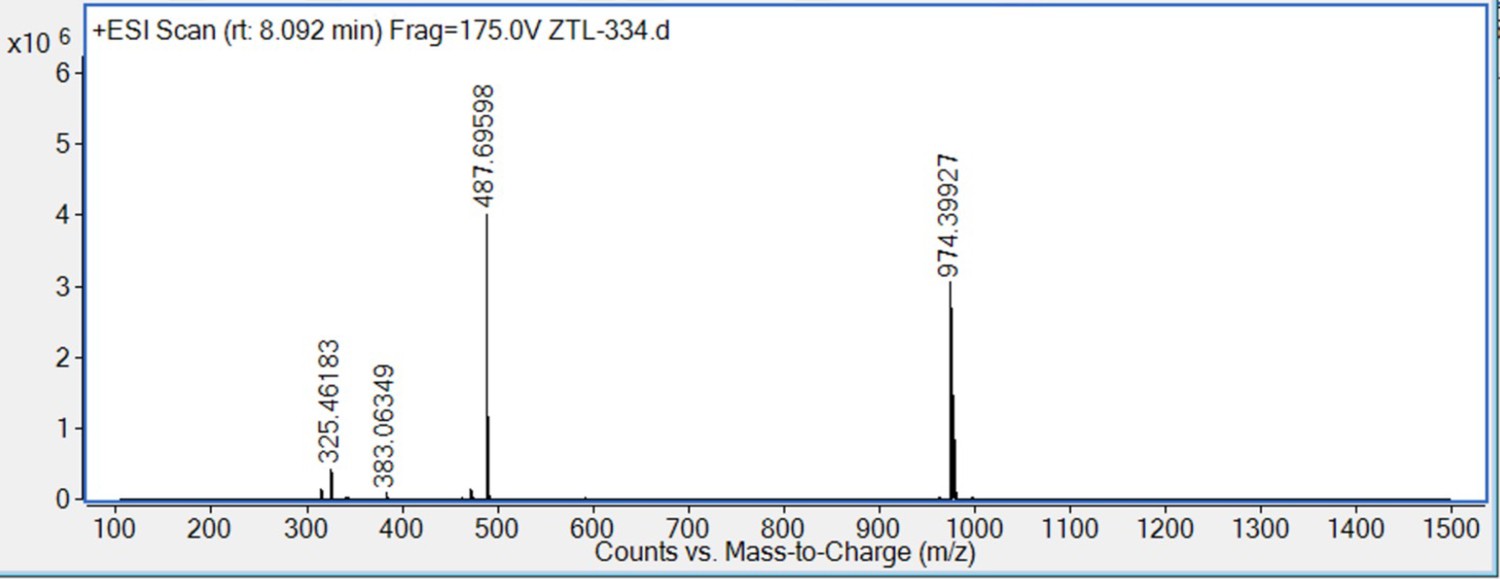
Appendix 1—figure 2
HRMS spectra of 7.
Appendix 1—figure 3
1H NMR spectra of 8 in CDCl3.
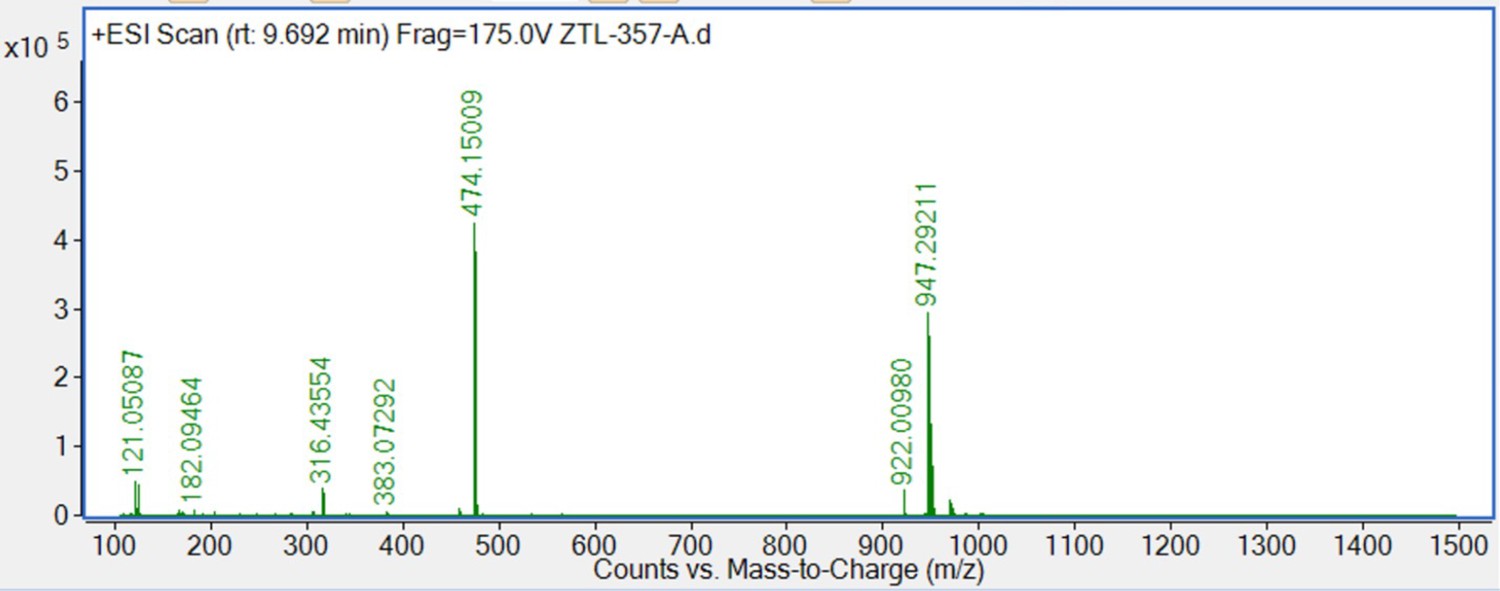
Appendix 1—figure 4
HRMS spectra of 8.
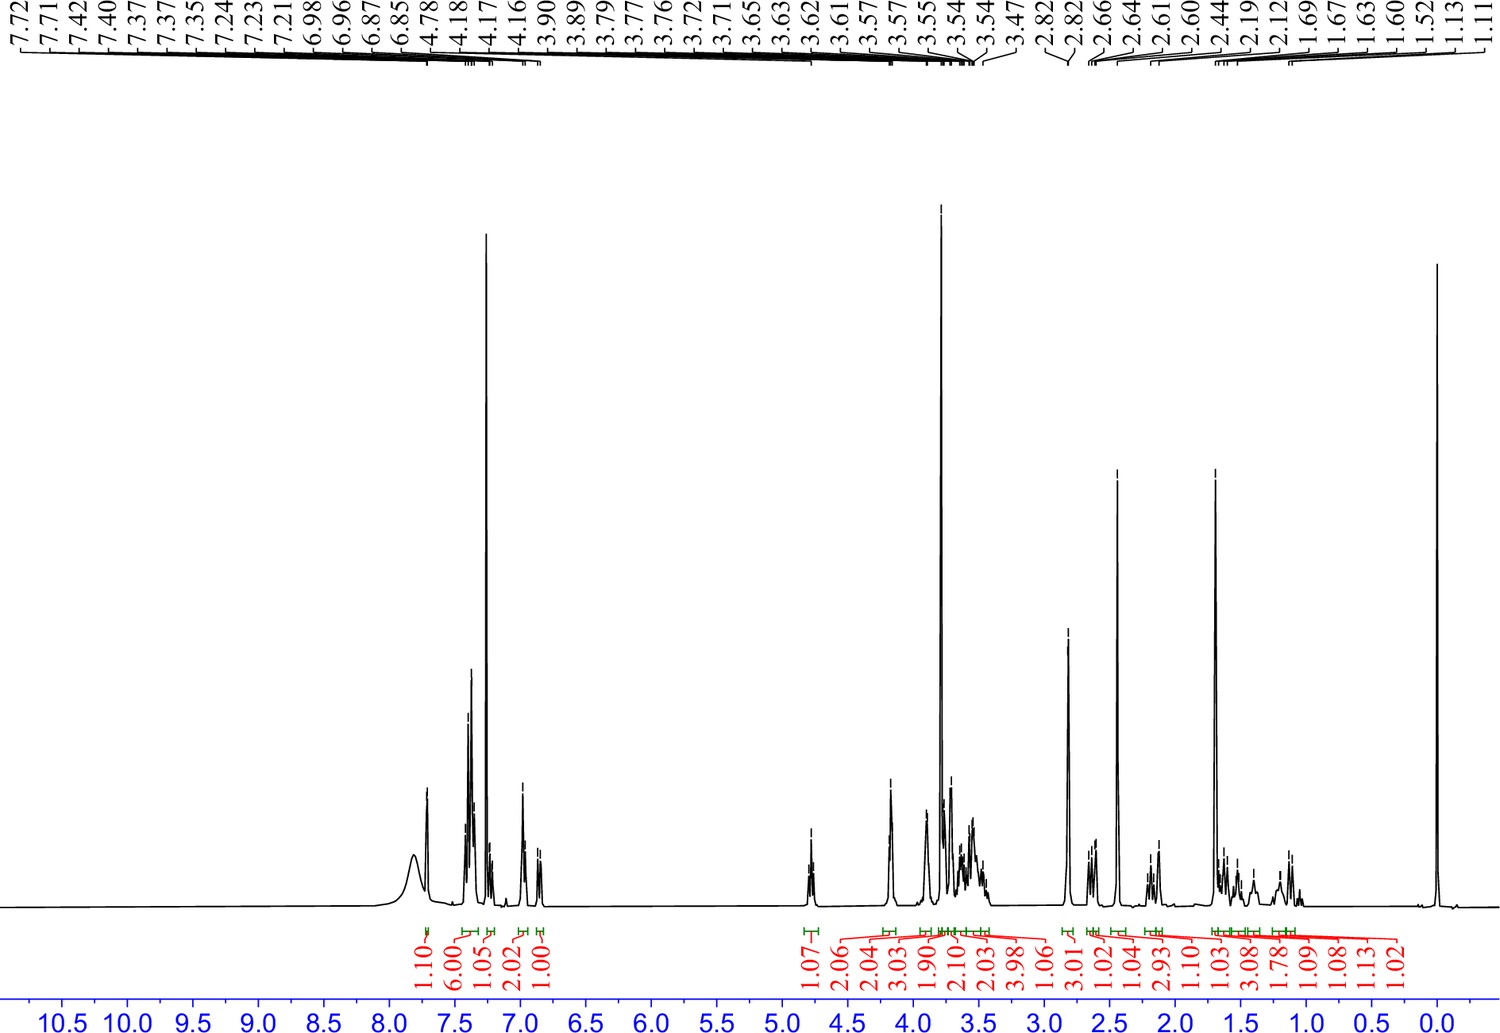
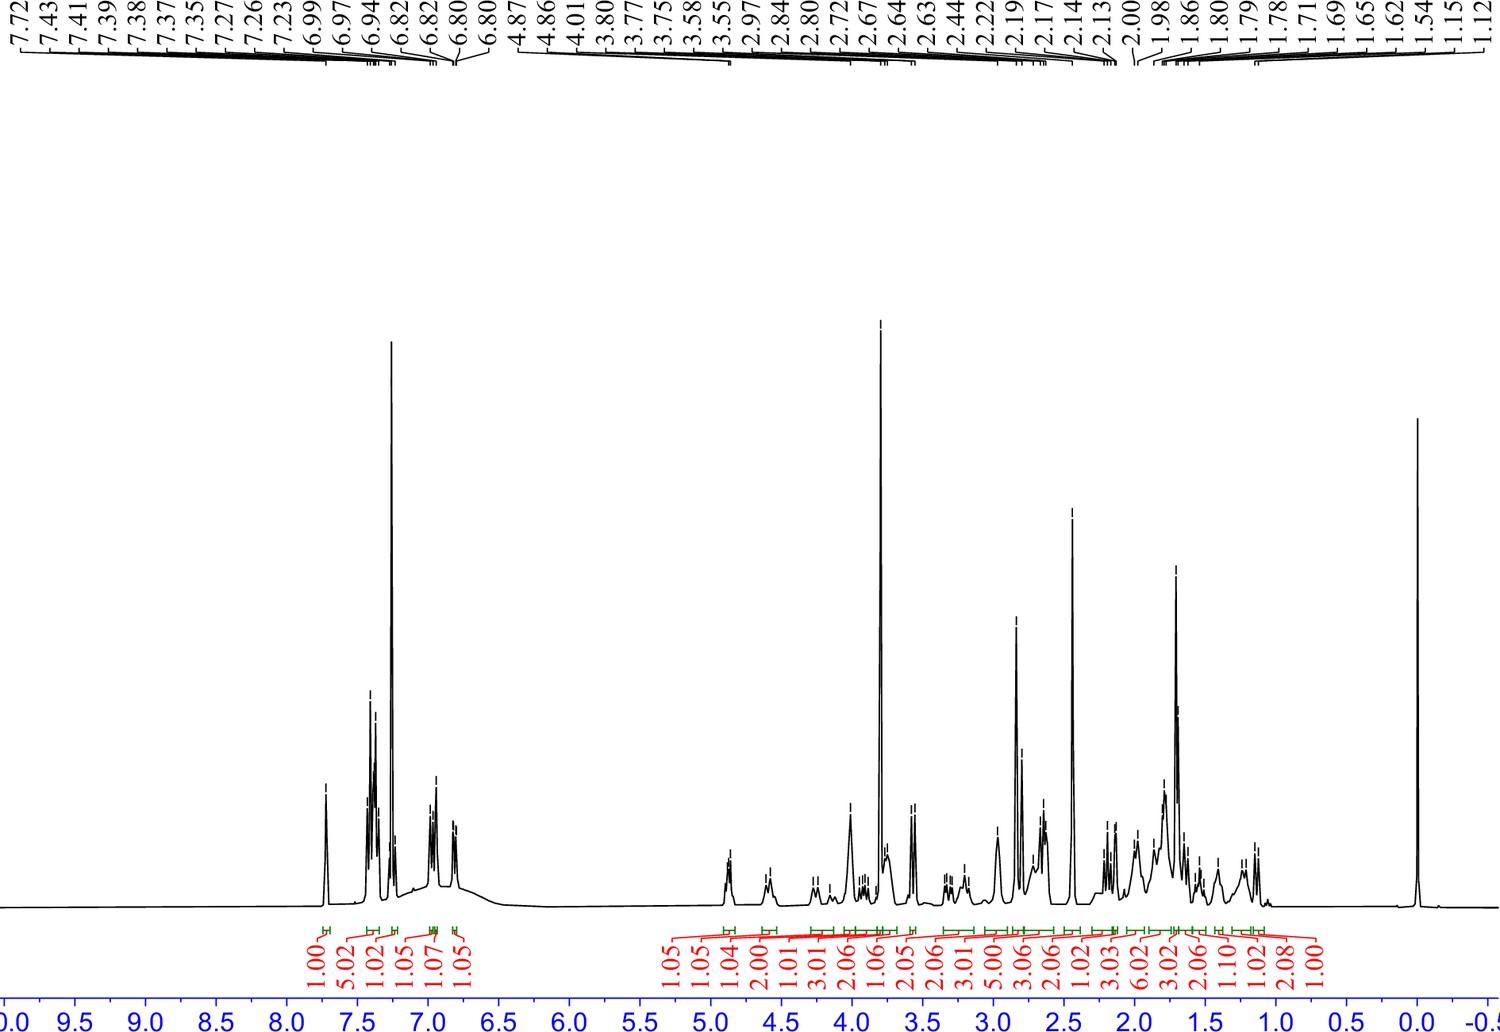
Appendix 1—figure 5
1H NMR spectra of 9 in CDCl3.
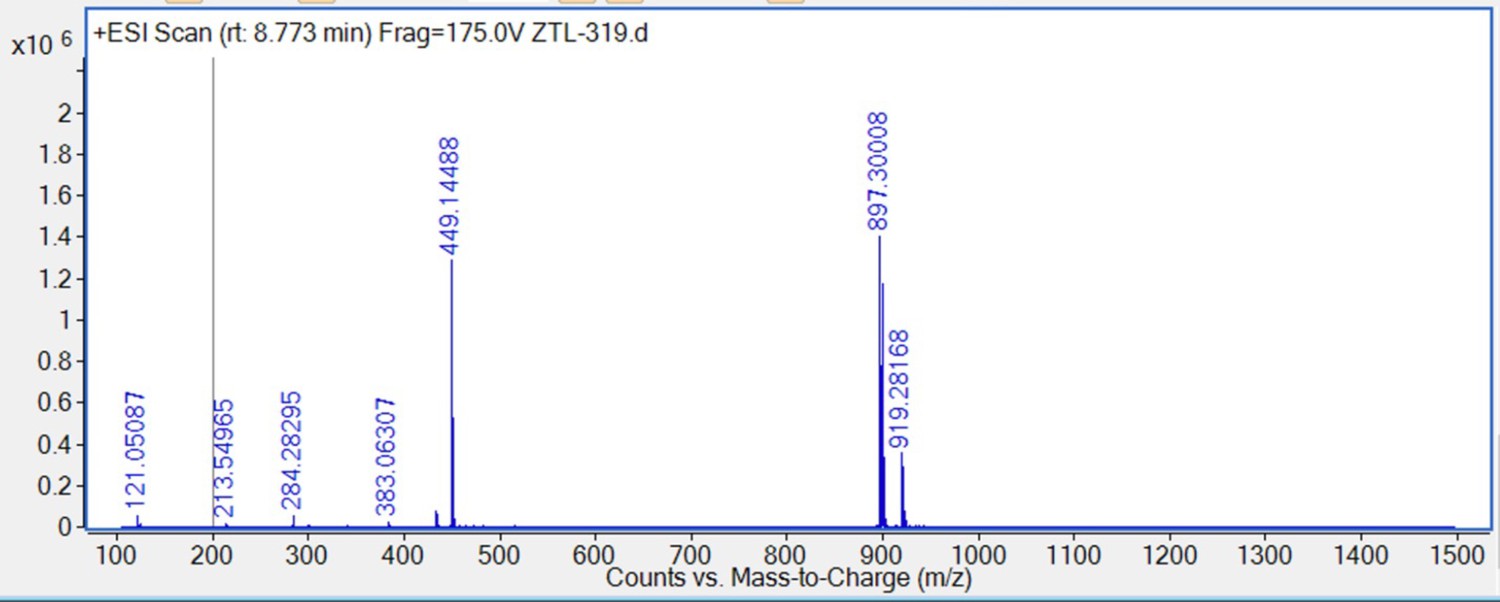
Appendix 1—figure 6
HRMS spectra of 9.
Additional files
Download links
A two-part list of links to download the article, or parts of the article, in various formats.
Downloads (link to download the article as PDF)
Open citations (links to open the citations from this article in various online reference manager services)
Cite this article (links to download the citations from this article in formats compatible with various reference manager tools)
Targeted protein degradation by KLHDC2 ligands identified by high-throughput screening
eLife 14:RP106844.
https://doi.org/10.7554/eLife.106844.2


