Weak evidence for heritable changes in response to selection by aphids in Arabidopsis accessions
- MWSchmid GmbH, Switzerland
- Department of Plant and Microbial Biology, University of Zurich, Switzerland
- Zurich-Basel Plant Science Center, University of Zurich, ETH Zurich, University of Basel, Switzerland
- Department of Evolutionary Biology and Environmental Studies, University of Zurich, Switzerland
- Department of Geography, University of Zurich, Switzerland
Figures
Figure 1
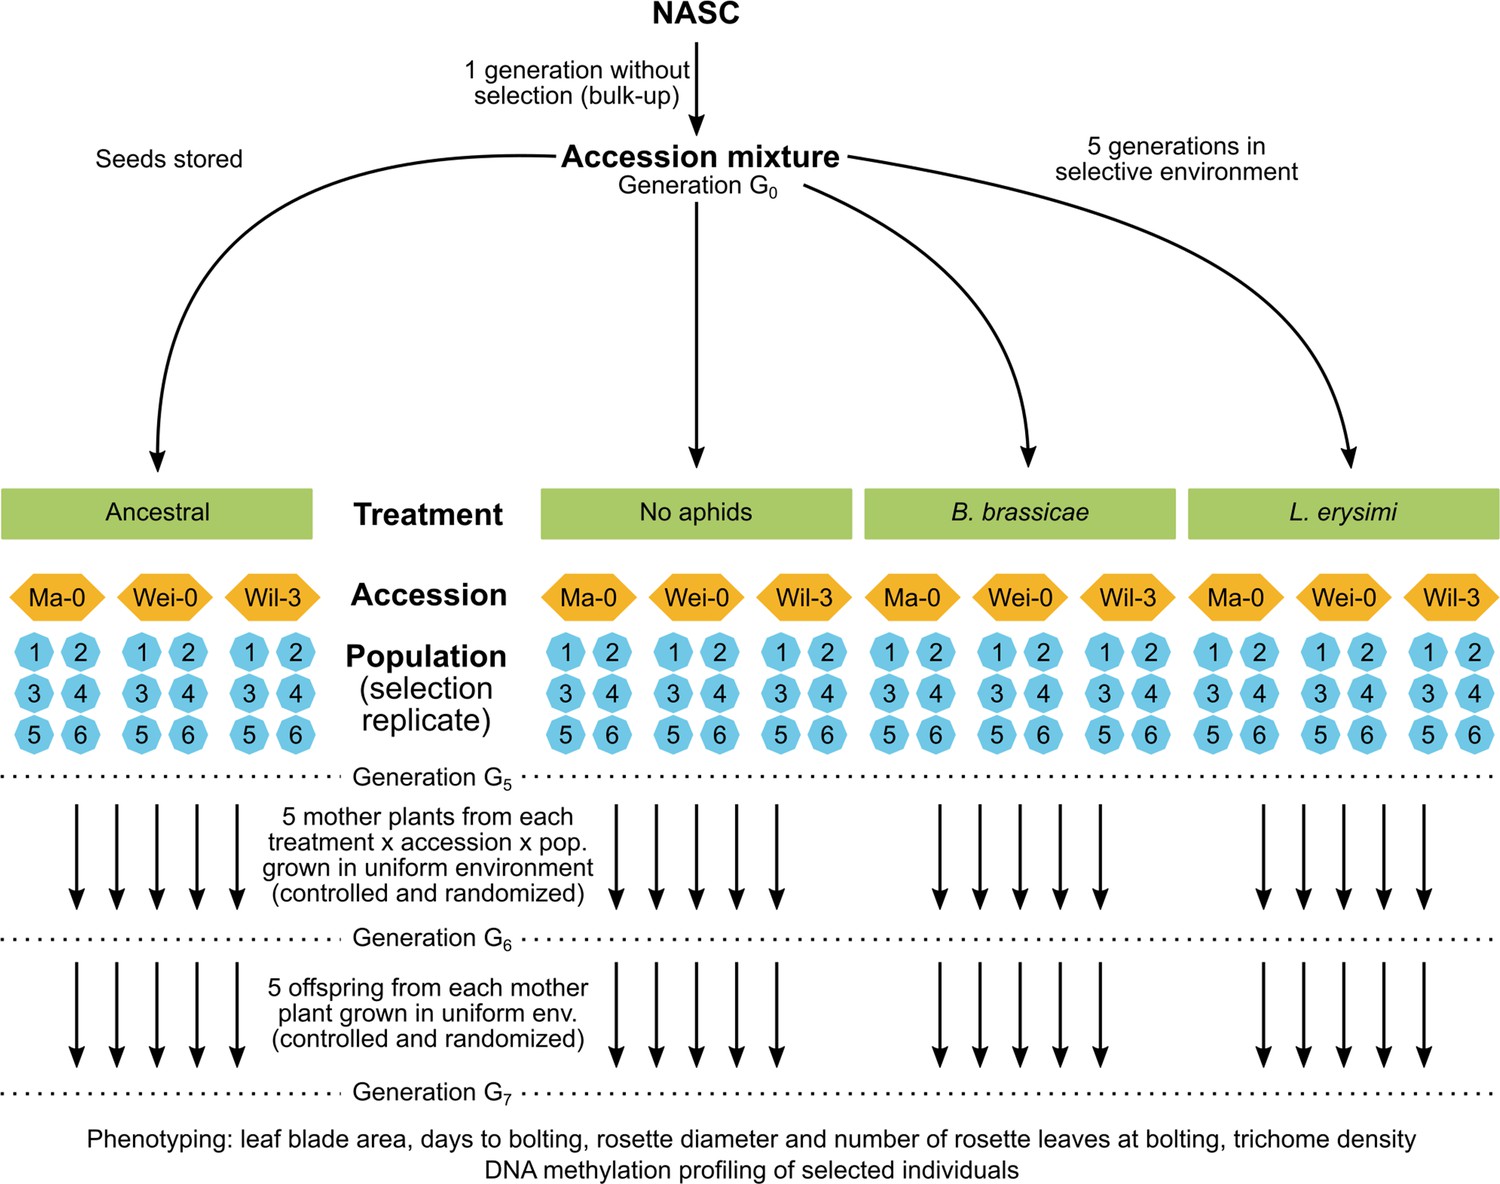
Schematic of the original experimental design (top) and the current study (bottom).
Figure 2
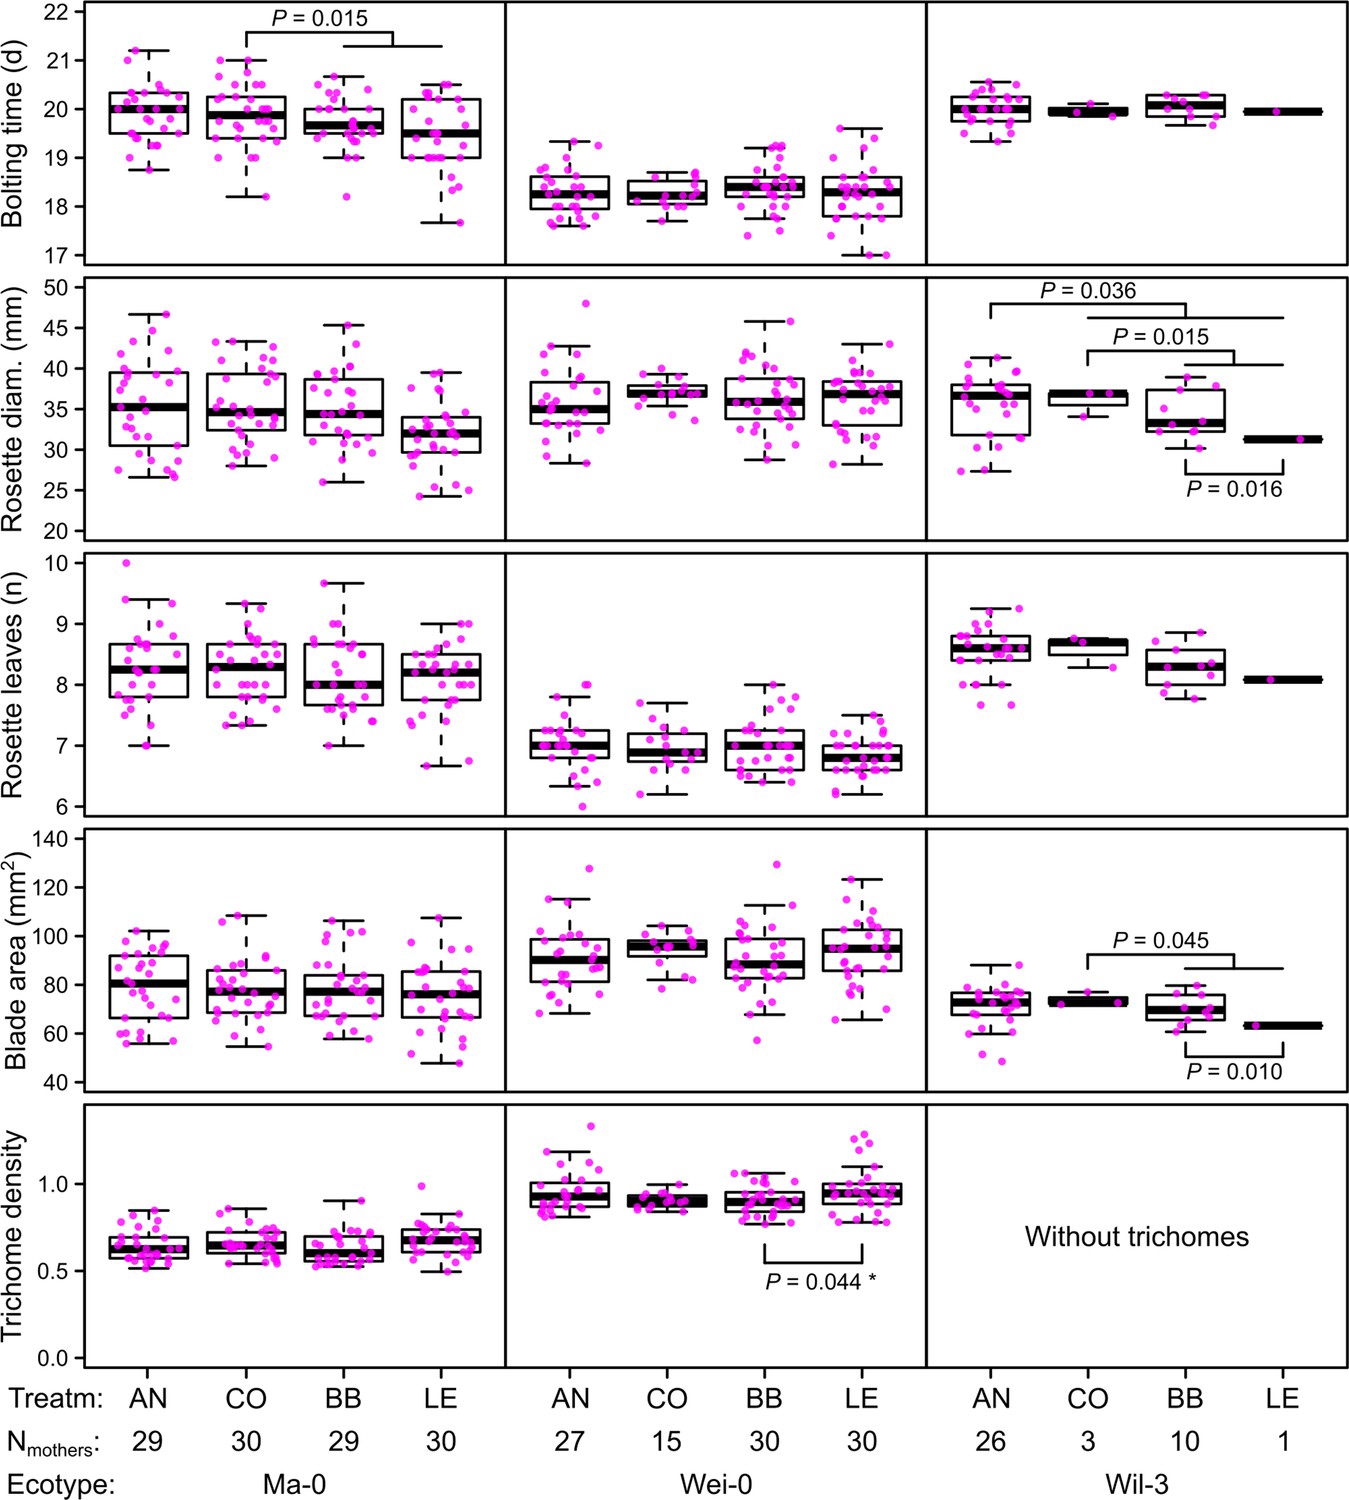
Phenotypes measured in the G7 generation averaged by the ID of the maternal lines from the G6 generation.
p-values for contrasts with p<0.05 are indicated (based on the analyses done per accession). p-values with asterisk were not significant when outliers were removed (see Figure 3). Boxplots were drawn with the function graphics::boxplot() in R. The box extends from the 25th to the 75th percentile. The wiskers extend to the most extreme data point which is no more than 1.5 times the interquartile range from the box.
Figure 3
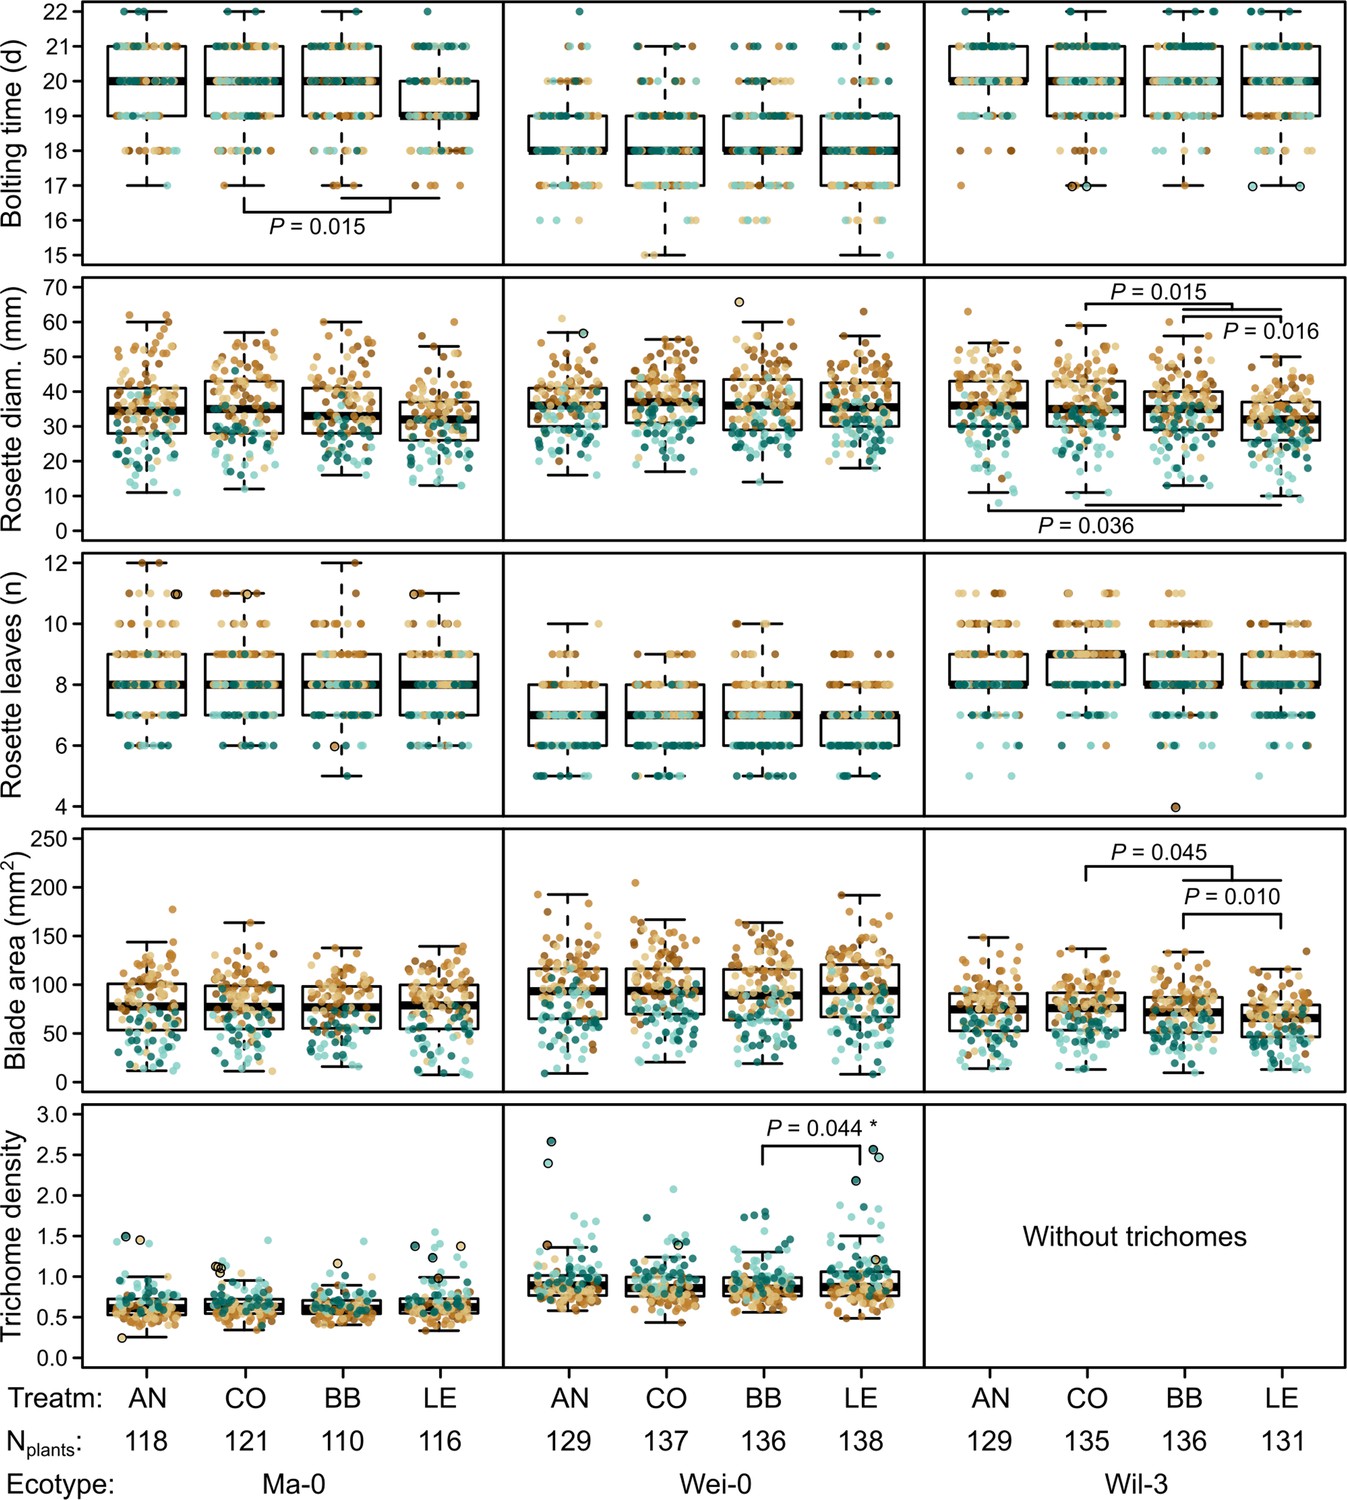
Phenotypes measured in the G7 generation.
Brown and green colors represent plants from blocks 1–3 and 4–5, respectively (slower growth in blocks 4–5). Dots with black outlines were identified as outliers. The number of plants available for the test differed slightly between the measurements. The number of plants given at the bottom of the figure corresponds to the minimal number of plants (i.e., for each phenotype there were at least Nplants plants). It varies by 2–3 plants per accession and treatment as some measures were missing. p-values for contrasts with p<0.05 are indicated (based on the analyses done per accession). p-values with asterisks were not significant when outliers were removed. Boxplots were drawn with the function graphics::boxplot() in R. The box extends from the 25th to the 75th percentile. The wiskers extend to the most extreme data point which is no more than 1.5 times the interquartile range from the box.
Figure 4
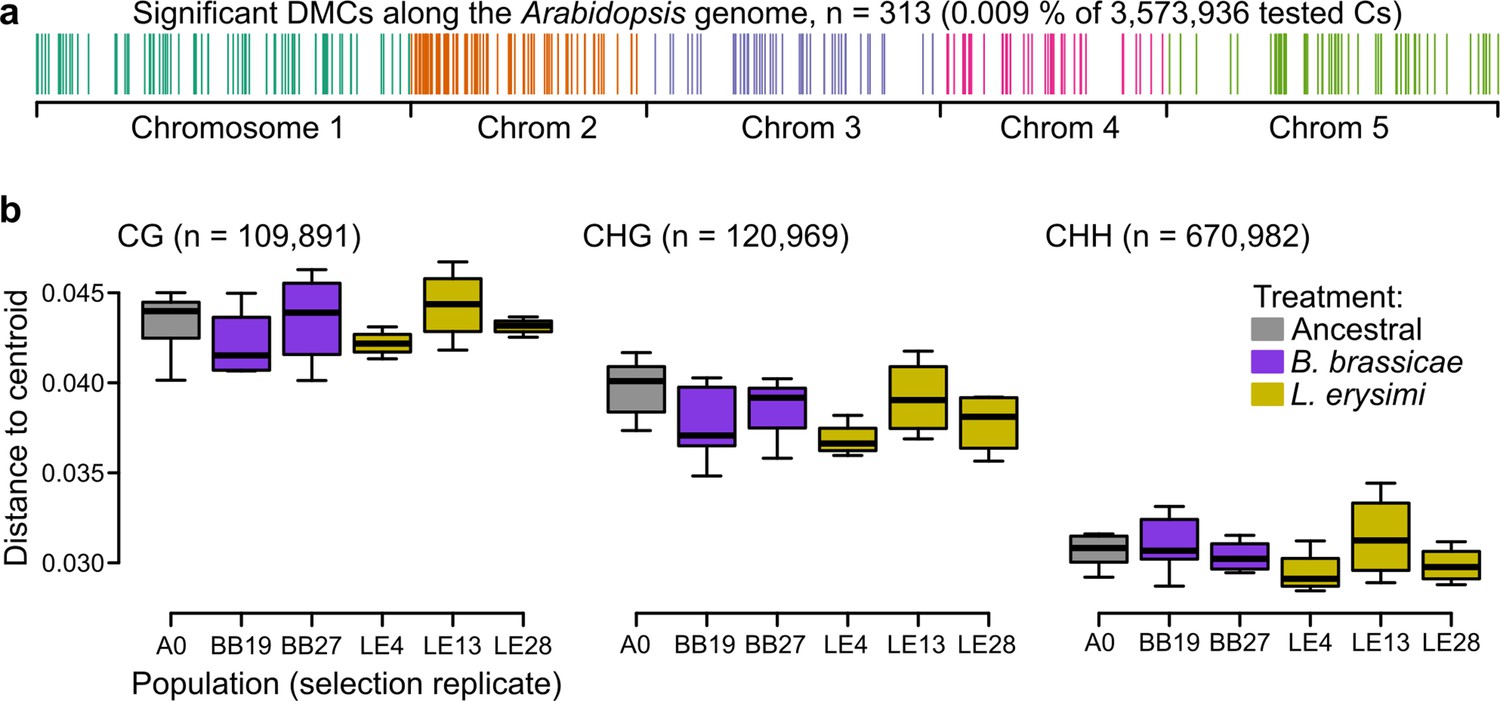
Epigenetic differences between ancestral and selected populations using a subset of mothers from the accession Wei-0.
(a) Location of the differentially methylated cytosines along the genome. (b) Epigenetic variation within different populations (selection replicates), i.e., distances to each centroid. Only populations with at least four individuals are shown. Number of individuals per population: A0: 7, BB19: 5, BB27: 4, LE4: 4, LE13: 4, LE28: 4 (not shown: BB14 and BB16 with only two individuals each). No overall and no pairwise p-value was smaller than 0.05. Boxplots were drawn with the function graphics::boxplot() in R. The box extends from the 25th to the 75th percentile. The wiskers extend to the most extreme data point which is no more than 1.5 times the interquartile range from the box.
Figure 5
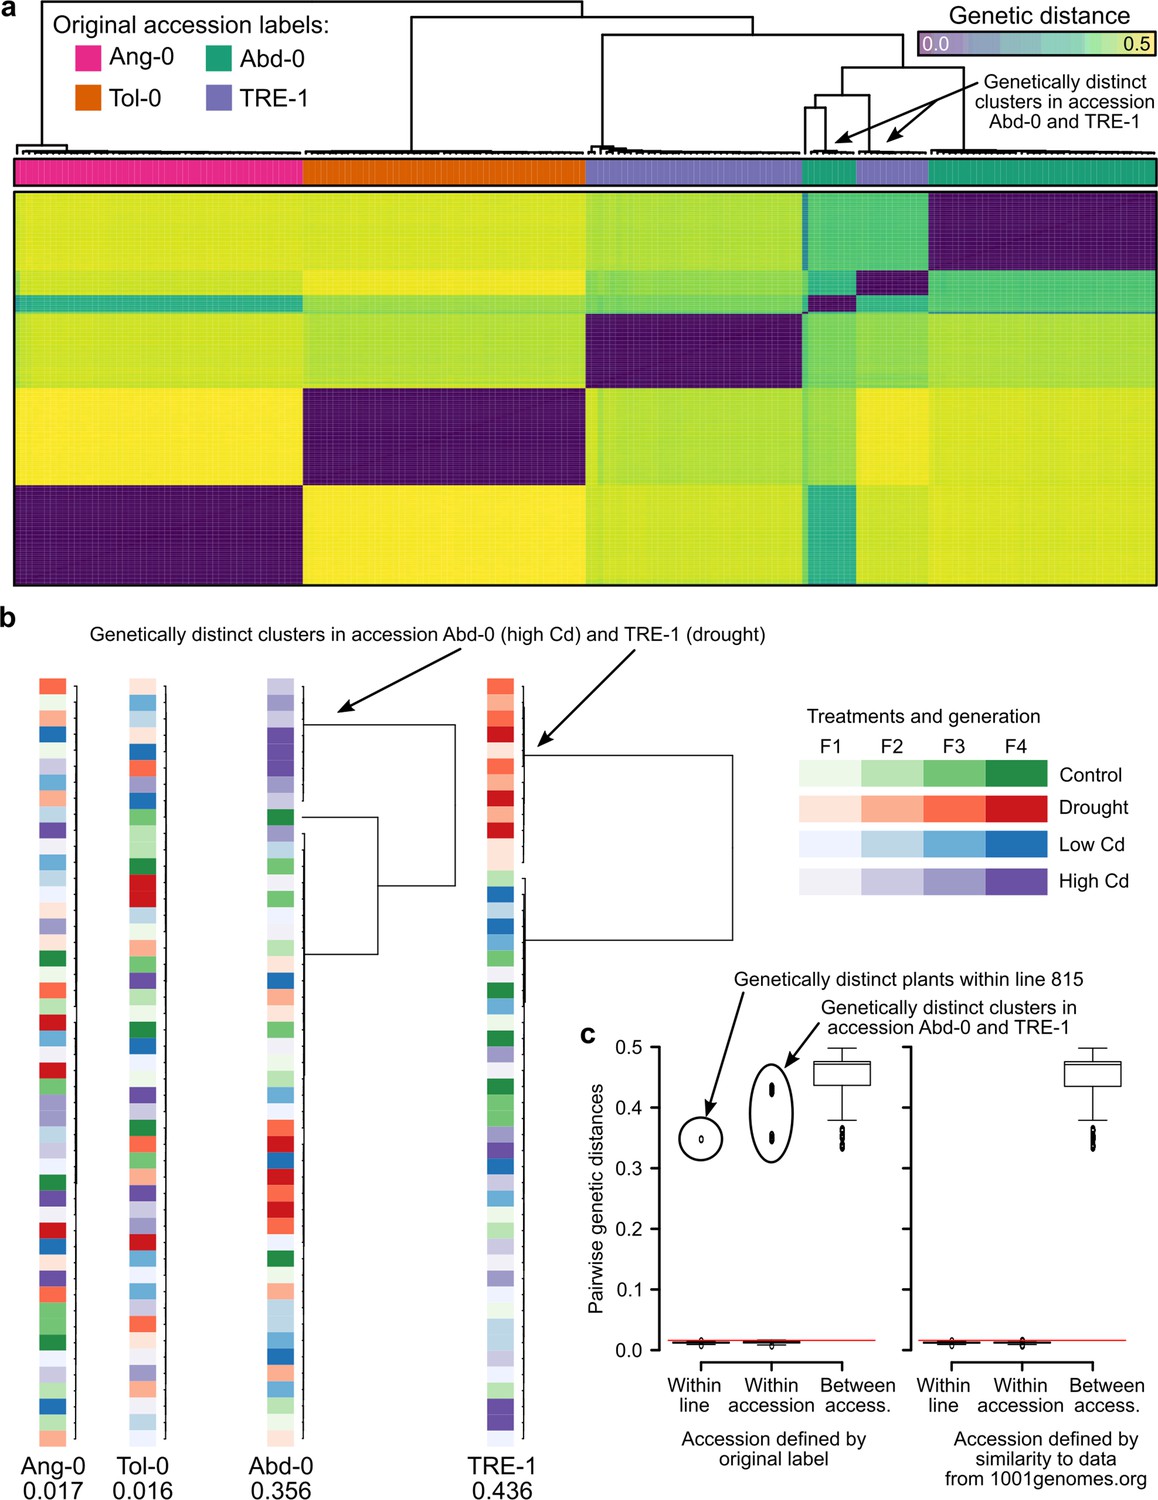
Genetic differentiation between some treatments in the study of Lin et al., 2024.
(a) Genetic distances between the 190 RNA-seq samples from Lin et al., 2024. The two genetic clusters diverging from the rest of their accession group are highlighted. (b) Within accession-label genetic distances, drawn to scale. Maximal distance given below the label, colored according to treatment and generation. The two treatments that have been assigned the wrong accessions are highlighted. (c) Pairwise genetic distances within lines (plants of the same lineage, i.e., single-seed descendants), within accessions, and between accessions using either the original accession labels from Lin et al., 2024 (left; 26) or the accessions assigned based on genetic similarity to the data available at 1001genomes.org (right). The red line demarcates the distance equal to the average of within-line distances plus three standard deviations. Boxplots were drawn with the function graphics::boxplot() in R. The box extends from the 25th to the 75th percentile. The wiskers extend to the most extreme data point which is no more than 1.5 times the interquartile range from the box.
Tables
Table 1
Percent sum of squares explained by model terms and p-values using all three accessions.
Contrasts of a term are marked with indents. Complete output and further results for individual accessions are given in Supplementary files 1 and 2.
| Blade area | Time to bolting | Rosette diameter | Number of rosette leaves | |||||
|---|---|---|---|---|---|---|---|---|
| Model term | % SS | p-value | % SS | p-value | % SS | p-value | % SS | p-value |
| Blocks | 46.97 | <0.001 | 6.55 | <0.001 | 43.23 | <0.001 | 27.1 | <0.001 |
| >Blocks 1–3 vs. blocks 4–5 (EX) | 41.85 | <0.001 | 0.51 | <0.001 | 39.62 | <0.001 | 26.42 | <0.001 |
| >Remaining blocks | 5.12 | <0.001 | 6.04 | <0.001 | 3.61 | <0.001 | 0.68 | <0.001 |
| Selection treatments (ST) | 0.1 | 0.887 | 0.24 | 0.925 | 0.76 | 0.033 | 0.5 | 0.782 |
| >Ancestral vs. rest (AN) | 0.02 | 0.742 | 0.06 | 0.735 | 0.11 | 0.222 | 0.24 | 0.484 |
| >Control vs. treated (CO) | 0.07 | 0.495 | 0.05 | 0.757 | 0.33 | 0.043 | 0.21 | 0.506 |
| >B. brassicae vs. L. erysimi (SE) | 0.01 | 0.852 | 0.13 | 0.624 | 0.32 | 0.047 | 0.05 | 0.746 |
| Original replicate population (LI) | 2.38 | <0.001 | 8.82 | <0.001 | 1.18 | <0.001 | 7.88 | <0.001 |
| Accession (ET) | 8.16 | <0.001 | 23.23 | <0.001 | 2.2 | <0.001 | 14.7 | <0.001 |
| ET:ST | 0.42 | 0.026 | 0.34 | 0.41 | 0.62 | 0.002 | 0.16 | 0.655 |
| >ET:AN | 0.05 | 0.315 | 0.09 | 0.427 | 0.35 | 0.001 | 0.12 | 0.238 |
| >ET:CO | 0.06 | 0.288 | 0.22 | 0.153 | 0.01 | 0.84 | 0.01 | 0.843 |
| >ET:SE | 0.31 | 0.005 | 0.03 | 0.776 | 0.26 | 0.005 | 0.03 | 0.707 |
| ET:LI | 0.37 | 0.443 | 0.88 | 0.076 | 0.3 | 0.864 | 0.66 | 0.175 |
| Mothers | 6.07 | 0.007 | 8.11 | 0.216 | 7.38 | 0.024 | 6.81 | 0.342 |
Table 2
Percent sum of squares explained by model terms and p-values using only accessions Ma-0 and Wei-0.
Contrasts of a term are marked with indents. Complete output and further results for individual accessions are given in Supplementary files 1 and 2.
| Blade area | Time to bolting | Rosette diameter | Number of rosette leaves | Trichome density | ||||||
|---|---|---|---|---|---|---|---|---|---|---|
| Model term | % SS | p-value | % SS | p-value | % SS | p-value | % SS | p-value | % SS | p-value |
| Blocks | 48.54 | <0.001 | 5.91 | <0.001 | 42.45 | <0.001 | 29.24 | <0.001 | 28.97 | <0.001 |
| >Blocks 1–3 vs. blocks 4–5 (EX) | 43.45 | <0.001 | 0.28 | 0.026 | 38.73 | <0.001 | 27.94 | <0.001 | 25.28 | <0.001 |
| >Remaining blocks | 5.09 | <0.001 | 5.63 | <0.001 | 3.72 | <0.001 | 1.3 | <0.001 | 3.69 | <0.001 |
| Selection treatments (ST) | 0.06 | 0.926 | 0.53 | 0.827 | 0.19 | 0.613 | 0.19 | 0.941 | 0.18 | 0.901 |
| >Ancestral vs. rest (AN) | 0 | 0.955 | 0.17 | 0.597 | 0 | 0.888 | 0.11 | 0.641 | 0 | 0.936 |
| >Control vs. treated (CO) | 0 | 0.908 | 0.21 | 0.561 | 0.1 | 0.338 | 0.07 | 0.715 | 0.02 | 0.801 |
| >B. brassicae vs. L. erysimi (SE) | 0.06 | 0.515 | 0.15 | 0.628 | 0.09 | 0.367 | 0.01 | 0.874 | 0.16 | 0.49 |
| Original replicate population (LI) | 2.16 | <0.001 | 9.5 | <0.001 | 1.67 | 0.002 | 7.96 | <0.001 | 4.99 | <0.001 |
| Accession (ET) | 5.78 | <0.001 | 18.5 | <0.001 | 2.46 | <0.001 | 11.78 | <0.001 | 13.98 | <0.001 |
| ET:ST | 0.12 | 0.424 | 0.42 | 0.349 | 0.38 | 0.036 | 0.04 | 0.799 | 0.07 | 0.572 |
| >ET:AN | 0.02 | 0.471 | 0.19 | 0.225 | 0.13 | 0.06 | 0.02 | 0.51 | 0.04 | 0.304 |
| >ET:CO | 0.03 | 0.394 | 0.18 | 0.241 | 0.01 | 0.588 | 0.02 | 0.522 | 0.02 | 0.422 |
| >ET:SE | 0.07 | 0.222 | 0.05 | 0.515 | 0.24 | 0.017 | 0 | 0.775 | 0.01 | 0.66 |
| ET:LI | 0.34 | 0.241 | 0.89 | 0.048 | 0.21 | 0.775 | 0.3 | 0.609 | 0.28 | 0.597 |
| Mothers | 7.69 | 0.023 | 11.27 | 0.319 | 9.16 | 0.2 | 10.2 | 0.106 | 8.25 | 0.46 |
Table 3
Gene Ontology (GO) enrichment among genes mapped by differentially methylated cytosines (DMCs).
‘Found’ indicates the number of different genes with the term that were mapped by DMCs. ‘Expected’ refers to the number of genes that were expected to be mapped by DMCs if six DMCs were randomly distributed.
| GO.ID | Term | Found | Expected | p-value |
|---|---|---|---|---|
| GO:0070646 | Protein modification by small protein removal | 7 | 1.53 | 0.00083 |
| GO:0016571 | Histone methylation | 10 | 3.07 | 0.00101 |
| GO:0008284 | Positive regulation of cell proliferation | 5 | 0.8 | 0.00119 |
| GO:0042732 | D-xylose metabolic process | 3 | 0.3 | 0.00321 |
| GO:0006487 | Protein N-linked glycosylation | 5 | 1.03 | 0.0036 |
| GO:0071702 | Organic substance transport | 25 | 11.89 | 0.00423 |
| GO:0015691 | Cadmium ion transport | 2 | 0.11 | 0.00455 |
| GO:0009834 | Plant-type secondary cell wall biogenesis | 3 | 0.35 | 0.00482 |
| GO:0006306 | DNA methylation | 7 | 2.09 | 0.00492 |
| GO:0006342 | Chromatin silencing | 8 | 2.86 | 0.00794 |
| GO:0071705 | Nitrogen compound transport | 23 | 11.74 | 0.00931 |
| GO:0050665 | Hydrogen peroxide biosynthetic process | 4 | 0.83 | 0.00945 |
| GO:1905039 | Carboxylic acid transmembrane transport | 2 | 0.15 | 0.00945 |
Additional files
-
Supplementary file 1
Collection of workbooks with results from the different analyses.
The files are named as <phenotype > _<data set>.xlsx. For each phenotype, there are analyses with all three accessions (‘all’), only the two accessions with trichomes (‘NoWil3’), or with only one accession (‘OnlyWei0’, ‘OnlyMa0’, and ‘OnlyWil3’). For each of them, there is one version with all data included and one in which the extreme values were removed (‘.outliersRemoved’). For example: bladeArea_all.outliersRemoved.xlsx refers to the analysis of the blade area using all three accessions and removing extreme values. Within each workbook, there are three sheets for untransformed data (‘y’), log-transformed data (‘logy’), and square-root-transformed data (‘sqrty’). Within each sheet, the output of the two models tested either with the regular linear model (lm) or the random effects model (lmer) is given. In case of the regular lm output, alternative F- and p-values (F_altern and P_altern) refer to the tests against the correct error stratum (i.e., nested model). The columns F and P contain the F- and p-values from tests against the residuals. Regarding the model terms: ‘__Blocks’ is the five-level factor of experimental blocks that was split into two contrasts (‘EX’ and ‘BL’); ‘__Selection’ is the four-level factor with the selection treatments that was split into three contrasts (‘AN’, ‘CO’, and ‘SE’). ‘__Selection_X_accession/experiment’ is accordingly the interaction of the four-level factor with the selection treatments and the accession (‘ET’) or the ‘EX’ contrast. Abbreviations: Df: degrees-of-freedom, SS: sum of squares, MS: mean squares, F: F-value, P: p-value, F_altern: F-value of nested model, P_altern: p-value of nested model, perc_SS: % sum of squares explained by the term.
- https://cdn.elifesciences.org/articles/106930/elife-106930-supp1-v1.zip
-
Supplementary file 2
A workbook containing tables from the power estimations.
For each phenotype, power was estimated using all three accessions or only the two accessions with trichomes. In case of trichome density, only the latter is available. Each table contains the percentage of significant outcomes for a given simulation and factor/contrast of interest (based on 1,000 simulations). The simulations are named as <type > _<effect size>. There were five different types of simulations with effect sizes ranging from 1% to 20%: (‘step’) differences between all four groups with step sizes of 1%, 5%, 10%, 15%, and 20% between each group (with the level following AN<CO<BB<LE, note that the largest difference here is 60%); (‘onlyAn’) only different in ancestors; (‘onlyCo’) only different in controls; (‘onlySe’) different in both selection treatments; (‘onlyLe’) different in only one selection treatment.
- https://cdn.elifesciences.org/articles/106930/elife-106930-supp2-v1.xlsx
-
Supplementary file 3
Table with the samples from Lin et al., 2024.
Given are the sample IDs, line ID, treatment, generation, accession label (used by Lin et al., 2024), and the accession assignments based on the genotypes inferred from the RNA-seq data and the publicly available data from 1001 Arabidopsis accessions (this study).
- https://cdn.elifesciences.org/articles/106930/elife-106930-supp3-v1.csv
-
Supplementary file 4
Table with the phenotype data.
Rosette diameter in mm, blade area in mm2. Factors are labeled as described in ‘Materials and methods’.
- https://cdn.elifesciences.org/articles/106930/elife-106930-supp4-v1.xlsx
-
MDAR checklist
- https://cdn.elifesciences.org/articles/106930/elife-106930-mdarchecklist1-v1.docx
Download links
A two-part list of links to download the article, or parts of the article, in various formats.
Downloads (link to download the article as PDF)
Open citations (links to open the citations from this article in various online reference manager services)
Cite this article (links to download the citations from this article in formats compatible with various reference manager tools)
Weak evidence for heritable changes in response to selection by aphids in Arabidopsis accessions
eLife 14:RP106930.
https://doi.org/10.7554/eLife.106930.3


