ATP-release pannexin channels are gated by lysophospholipids
- Department of Molecular Medicine, Cornell University, United States
- Boyce Thompson Institute, Cornell University, United States
- Department of Chemistry and Chemical Biology, Cornell University, United States
- Department of Clinical Sciences, College of Veterinary Medicine, Cornell University, United States
- Department of Molecular Biology and Genetics, Cornell University, United States
- Howard Hughes Medical Institute, United States
Figures
Figure 1 with 2 supplements
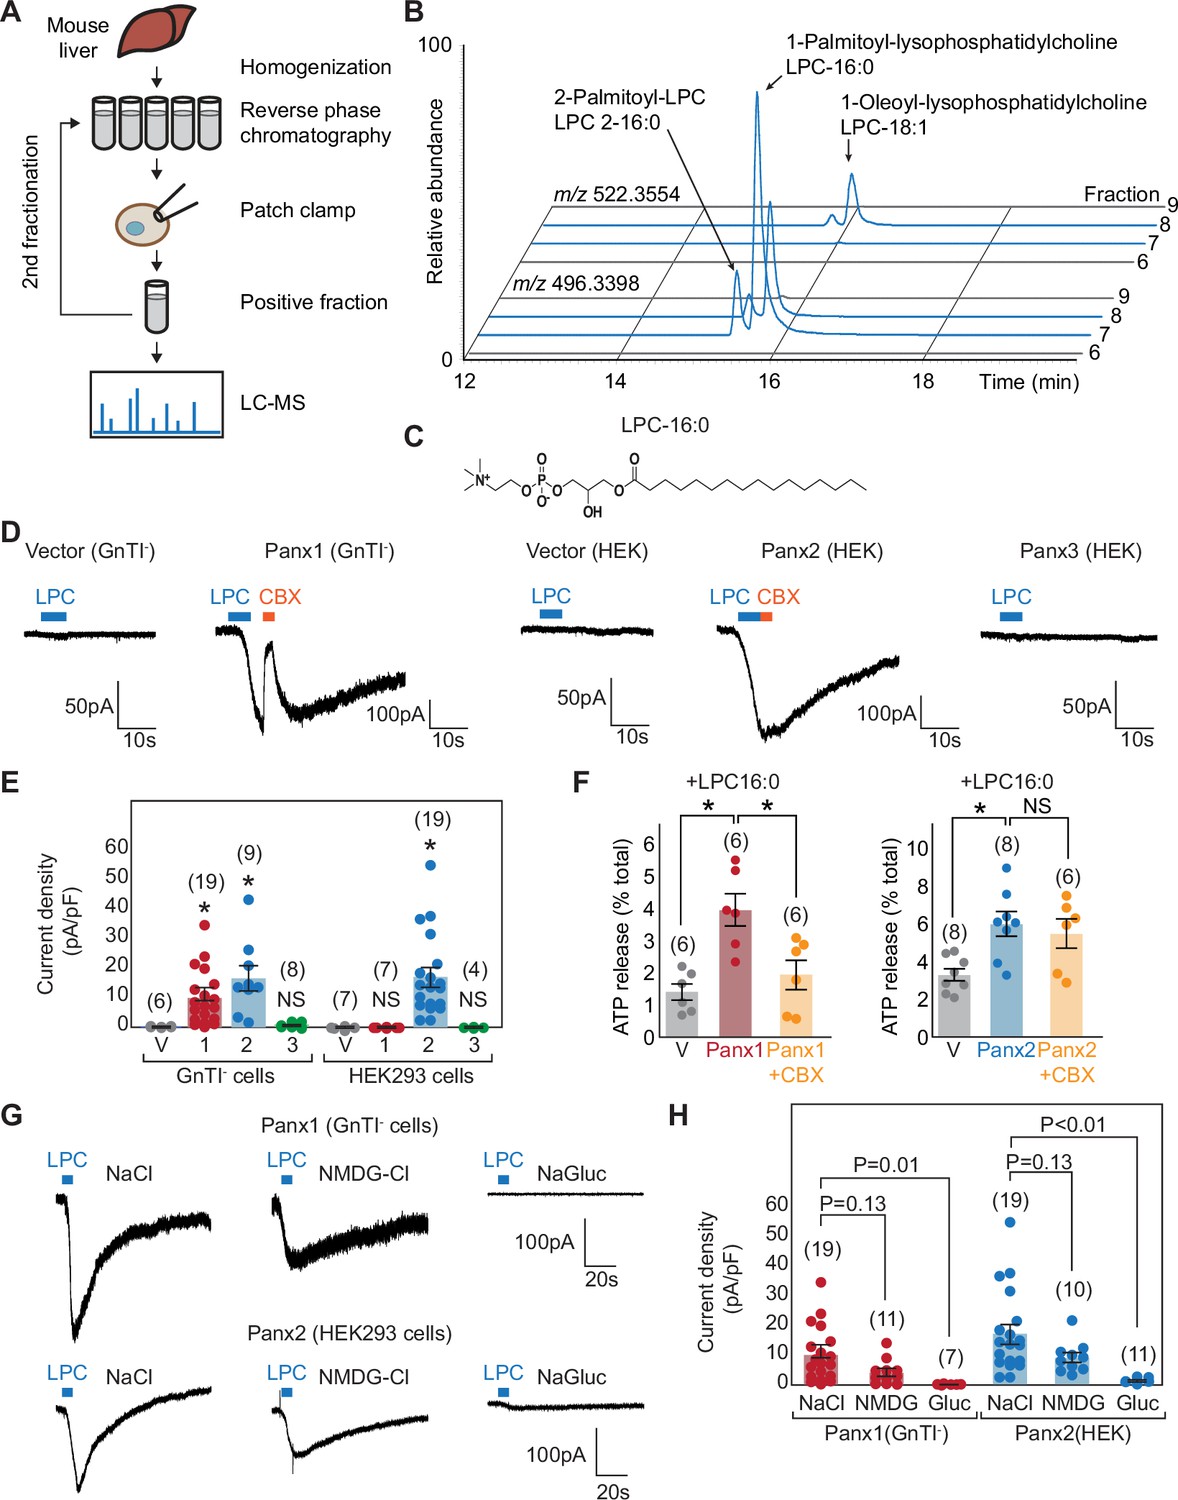
Metabolomic screening identifies LPC-16:0 as a pannexin agonist.
(A) Schematic of the metabolite screen. Organic extracts of mouse liver tissues were fractionated via reverse-phase chromatography and assessed for their ability to stimulate Panx1+GS or Panx2 using whole-cell patch-clamp. Active fractions were analyzed by HPLC-HRMS. (B) Extracted ion chromatograms for fractions #5–8 from the second round of Panx1 activity-guided fractionation. (C) Chemical structure of LPC-16:0. (D) Representative whole-cell patch-clamp traces. (E) Quantification of peak current densities triggered by LPC-16:0. Wildtype pannexins were expressed in indicated cells. (F) ATP release induced by application of LPC-16:0 to Panx1-expressing GnTI- (left; 10 μM at 3 min) and Panx2-expressing HEK293 (right; 30 μM at 3 min) cells. Data are expressed as percent of total ATP released upon membrane solubilization. P values were calculated using unpaired t-test with unequal variances. An asterisk denotes p<0.01. Error bars represent SEM. (G) Representative whole cell currents of Panx1 and Panx2 stimulated by LPC-16:0 in buffers containing different anions and cations. (H) Quantification of peak current densities in different buffers. Voltage-clamp recordings were performed at –60 mV. Blue bars indicate application of LPC-16:0 (7 μM), and orange bars indicate application of carbenoxolone (50 μM). The number of recordings from different cells for each experiment (biological replicates) is shown in parenthesis. One-way ANOVA followed by Dunnett’s test was used to assess statistical significance. V indicates the vector control.
-
Figure 1—source data 1
Electrophysiology and ATP release assay data used for Figure 1.
- https://cdn.elifesciences.org/articles/107067/elife-107067-fig1-data1-v1.xlsx
Figure 1—figure supplement 1
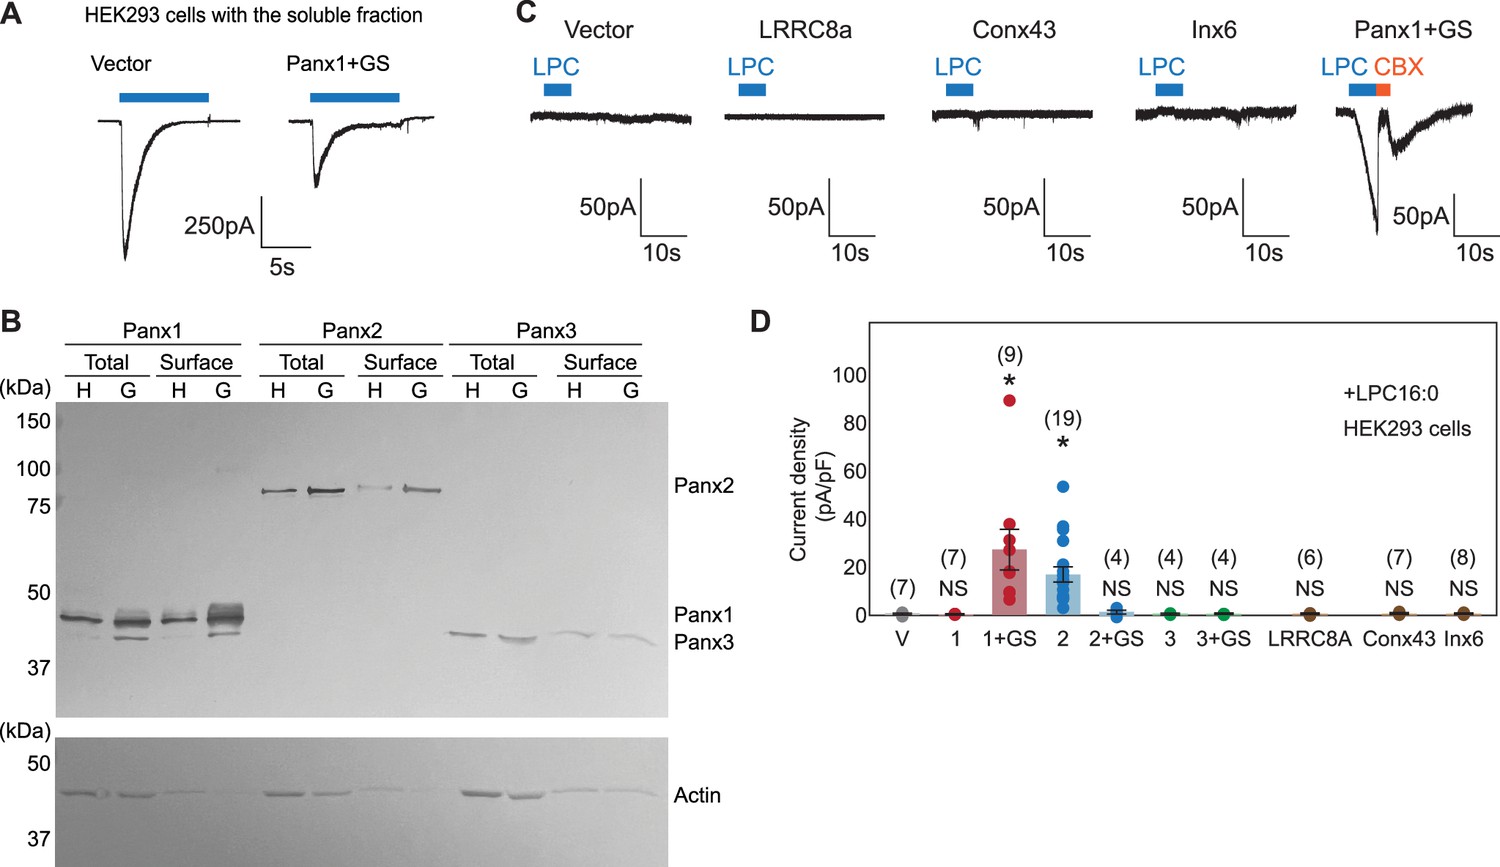
Characteristics of the pannexins and other large pore forming channels used in this study.
(A) Representative whole-cell patch-clamp traces with the soluble fraction from mouse liver extract. Vector (left) or Panx1+GS (right) were expressed in HEK293 cells and voltage clamp recordings were performed at –60 mV. The blue bars indicate application of the soluble fractions. (B) Cell surface biotinylation pulldown to determine surface protein levels of heterologously-expressed pannexins in HEK293 (H) and HEK293S GnTI- (G) cells. Representative western blots for the total and surface biotinylated samples are shown. Top: anti-FLAG; bottom; anti-actin. Three individual experiments using different batches of cells (biological replicates) were performed. (C) and (D) Whole-cell patch-clamp recordings of various constructs used in this study. Representative whole-cell patch-clamp traces (C) and quantification of the peak currents (D) obtained with LPC-16:0 (7 μM). Pannexins and other members of the large-pore channel family are expressed in HEK293 cells and voltage clamp recordings were performed at –60 mV. Blue bars indicate application of LPC-16:0 and red bars indicate application of CBX (50 μM). The number of recordings from different cells for each experiment (biological replicates) is shown in parenthesis. p values are obtained using one-way ANOVA followed by Dunnett’s t-test. Asterisks indicate p<0.01 and error bars represent SEM.
-
Figure 1—figure supplement 1—source data 1
Electrophysiology data used for Figure 1—figure supplement 1.
- https://cdn.elifesciences.org/articles/107067/elife-107067-fig1-figsupp1-data1-v1.xlsx
-
Figure 1—figure supplement 1—source data 2
Raw blot images used for Figure 1—figure supplement 1.
- https://cdn.elifesciences.org/articles/107067/elife-107067-fig1-figsupp1-data2-v1.zip
-
Figure 1—figure supplement 1—source data 3
Annotated blot images used for Figure 1—figure supplement 1.
- https://cdn.elifesciences.org/articles/107067/elife-107067-fig1-figsupp1-data3-v1.zip
Figure 1—figure supplement 2
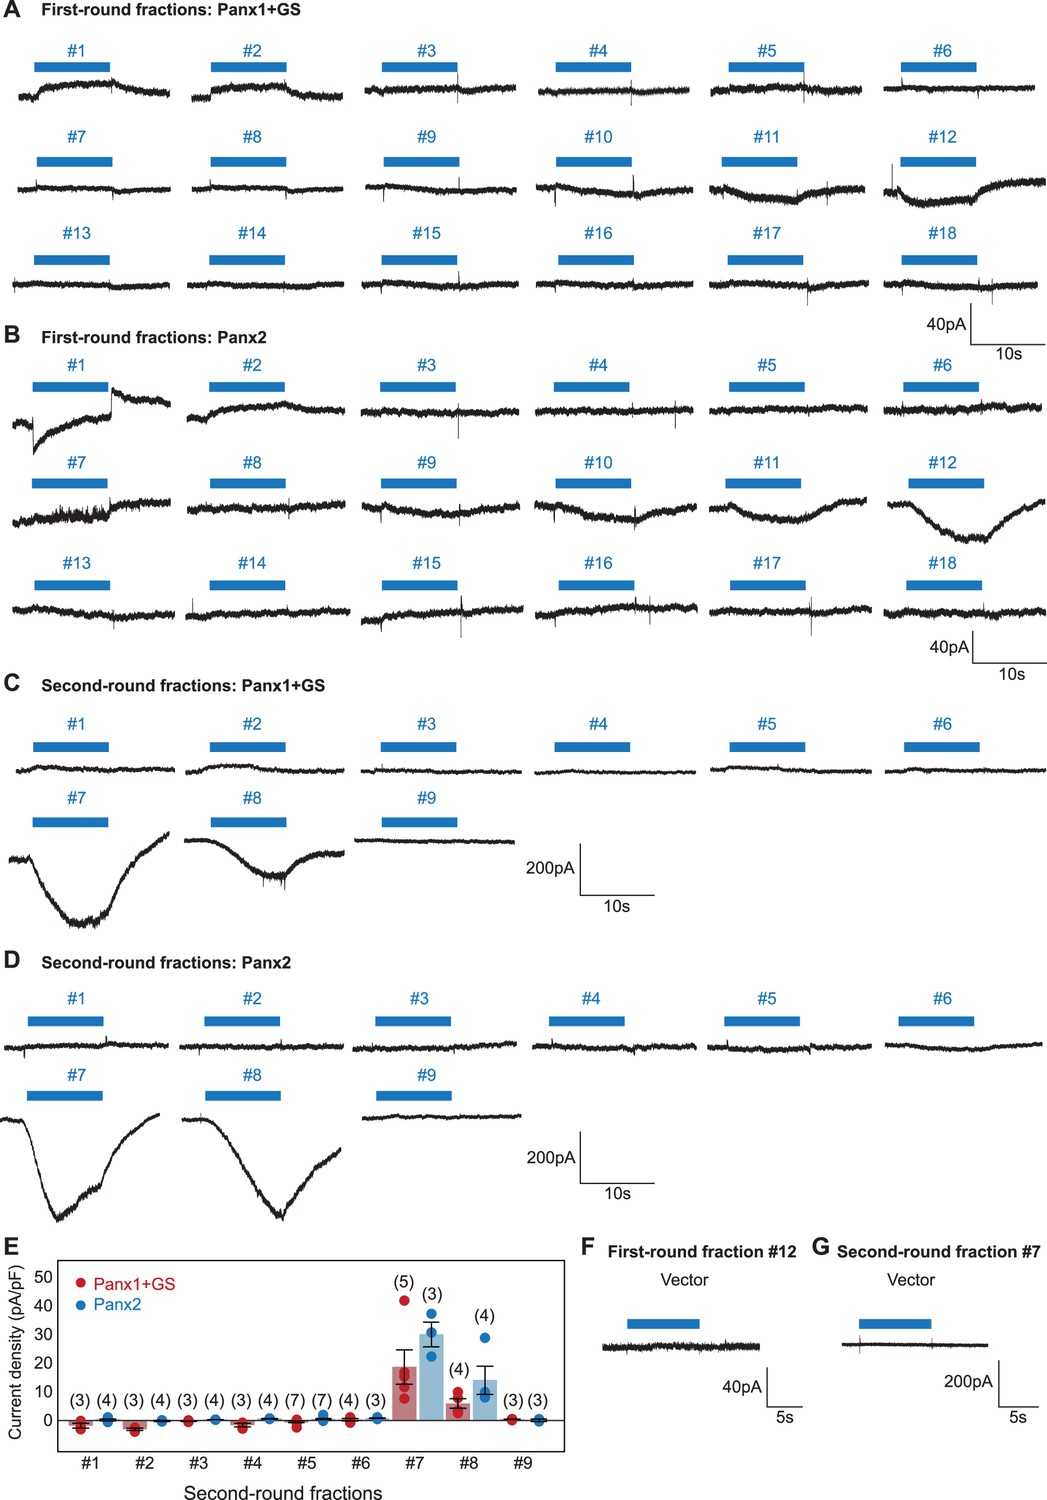
Representative whole-cell patch-clamp traces for mouse liver fractions.
(A-D) Pannexins were expressed in HEK293 cells and voltage clamp recordings were performed at –60 mV. Both the first round (A and B) and the second round (C and D) fractions are shown. Blue bars indicate application of each fraction. (E) Current densities from second-round fractions. The number of recordings from different cells for each experiment (biological replicates) is shown in parenthesis. Error bars represent SEM. (F) and (G) Whole-cell currents obtained with vector-transfected control cells. Application of fraction #12 from the first round and fraction #7 from the second round are shown.
-
Figure 1—figure supplement 2—source data 1
Electrophysiology data used for Figure 1—figure supplement 2.
- https://cdn.elifesciences.org/articles/107067/elife-107067-fig1-figsupp2-data1-v1.xlsx
Figure 2 with 1 supplement
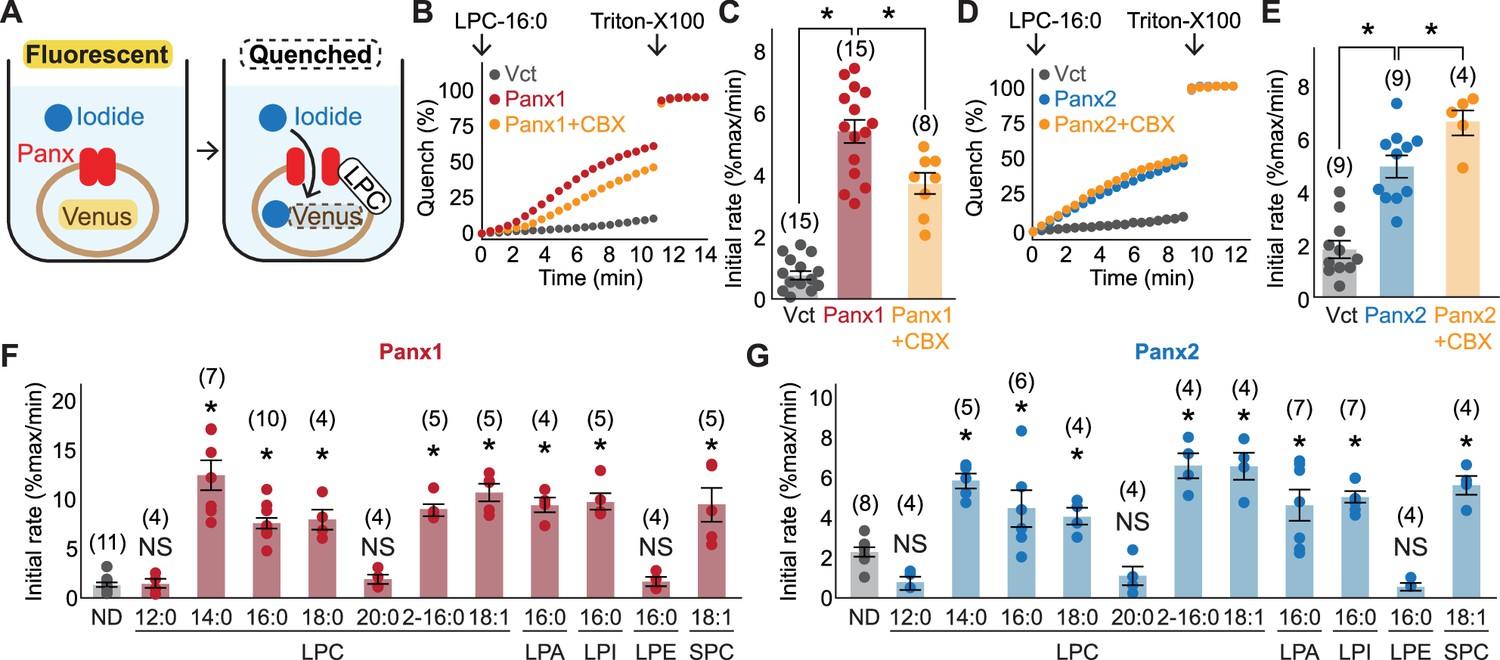
Cellular mVenus-quench assays reveal a series of lysophospholipids as pannexin agonists.
(A) Cartoon illustrating the principle of the mVenus quench assay. (B–E) Representative traces (B) for Panx1 and (D) for Panx2 and quantification of initial mVenus quenching rates (C) for Panx1 and (E) for Panx2. LPC-16:0 (30 μM) was applied with or without CBX (50 μM), and the maximum mVenus quenching was measured after cell solubilization with 1% Triton-X100. P values were calculated using unpaired t-test with unequal variances. (F) and (G) Initial mVenus quenching rates of Panx1 expressed in GnTI- cells (F) and Panx2 expressed in HEK293 cells (G). Pannexin activation was measured following addition of 60 μM sn-1 LPCs (LPC-12:0-20:0), sn-2 LPC (LPC2-16:0), a monounsaturated sn-1 (LPC-18:1), or other sn-1 lysophospholipids with different headgroups (LPA-16:0, LPI-16:0, LPE-16:0, and SPC-18:1). The number of measurements from different cells for each experiment (biological replicates) is shown in parenthesis. P values were calculated using one-way ANOVA followed by Dunnett’s t-test. Asterisks denote p<0.01. Error bars represent SEM.
-
Figure 2—source data 1
mVenus quench assay data used for Figure 2.
- https://cdn.elifesciences.org/articles/107067/elife-107067-fig2-data1-v1.xlsx
Figure 2—figure supplement 1
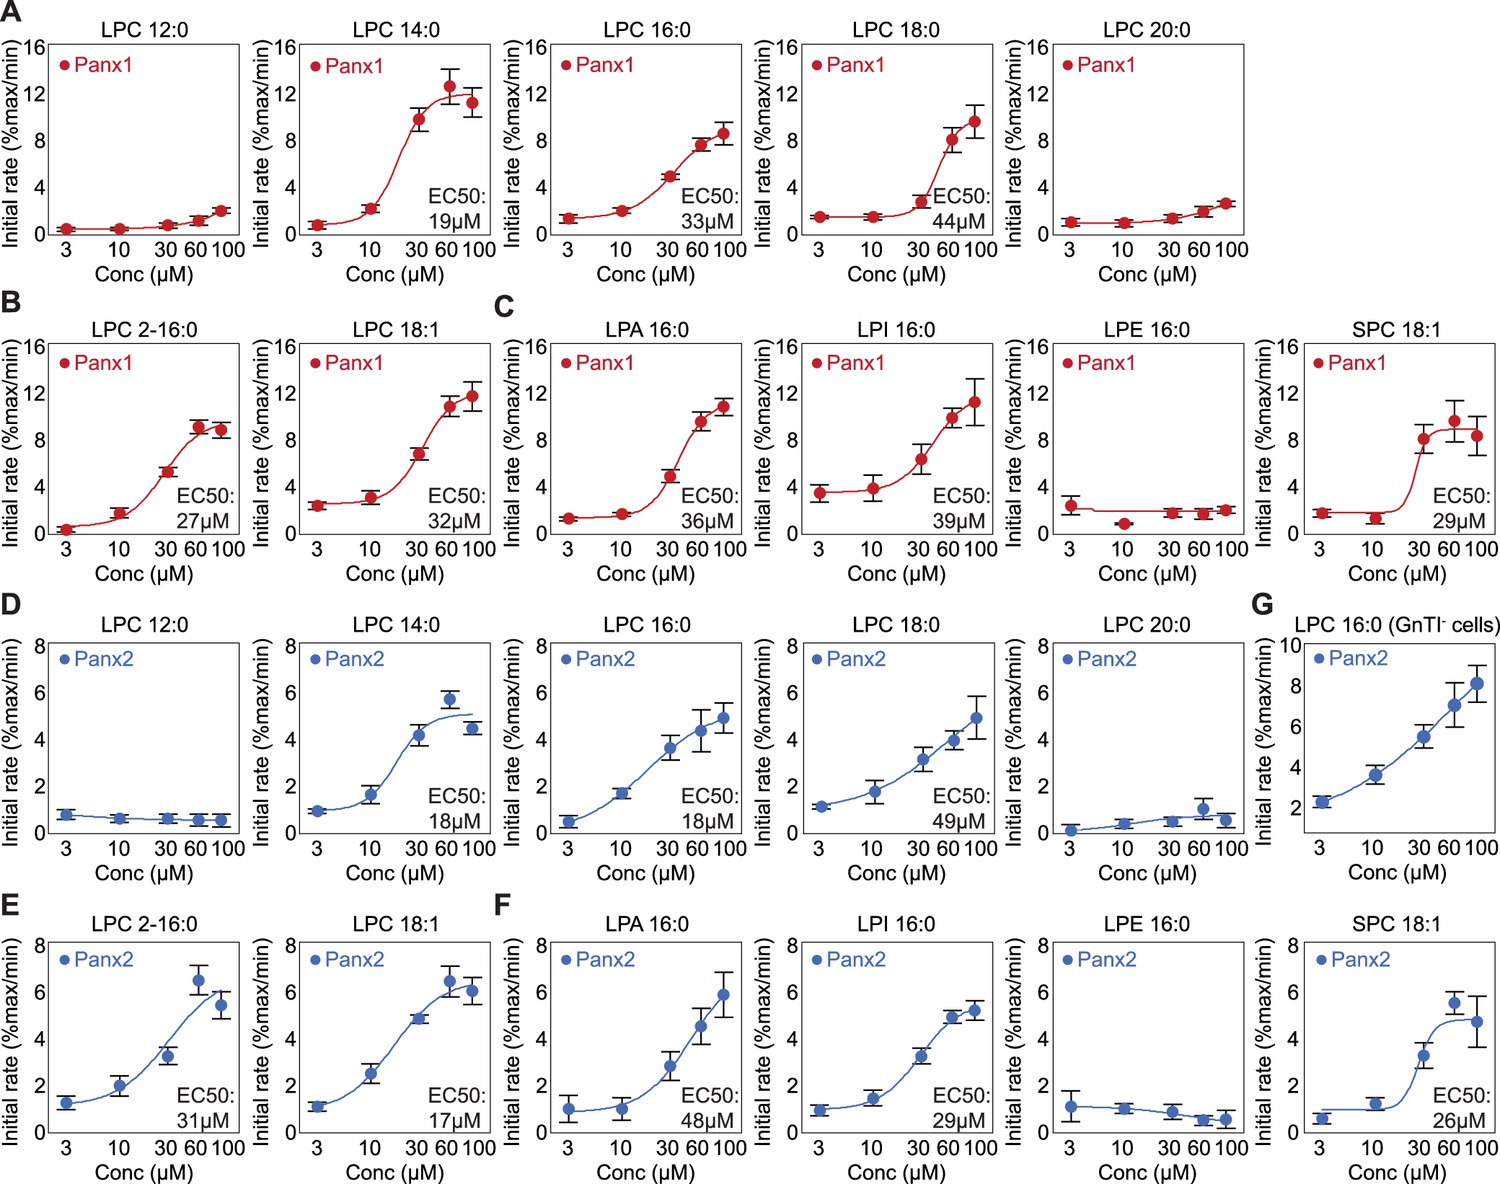
Lysophospholipid dose-response curves obtained from the mVenus quench assay.
(A-C) Panx1 dose-response curves for LPC with different chain length (A), LPC with different tail branching (B), and lysophospholipids with different headgroups (c). Wildtype Panx1 was expressed in GnTI- cells. (D–G) Wildtype Panx2 dose-response curves obtained from HEK293 cells for LPC with different chain length (D), LPC with different tail branching (E), lysophospholipids with different headgroups (F), and with LPC16:0 in GnTI- cells (G). Fluorescence of the vector control was subtracted from the total activity. Mean of at least four independent experiments are shown. The number of biological replicates is available in Figure 2—figure supplement 1—source data 1. Dose responses were fitted with the Hill equation and the EC50 values are indicated. Error bars represent SEM.
-
Figure 2—figure supplement 1—source data 1
mVenus quench assay data used for Figure 2—figure supplement 1.
- https://cdn.elifesciences.org/articles/107067/elife-107067-fig2-figsupp1-data1-v1.xlsx
Figure 3
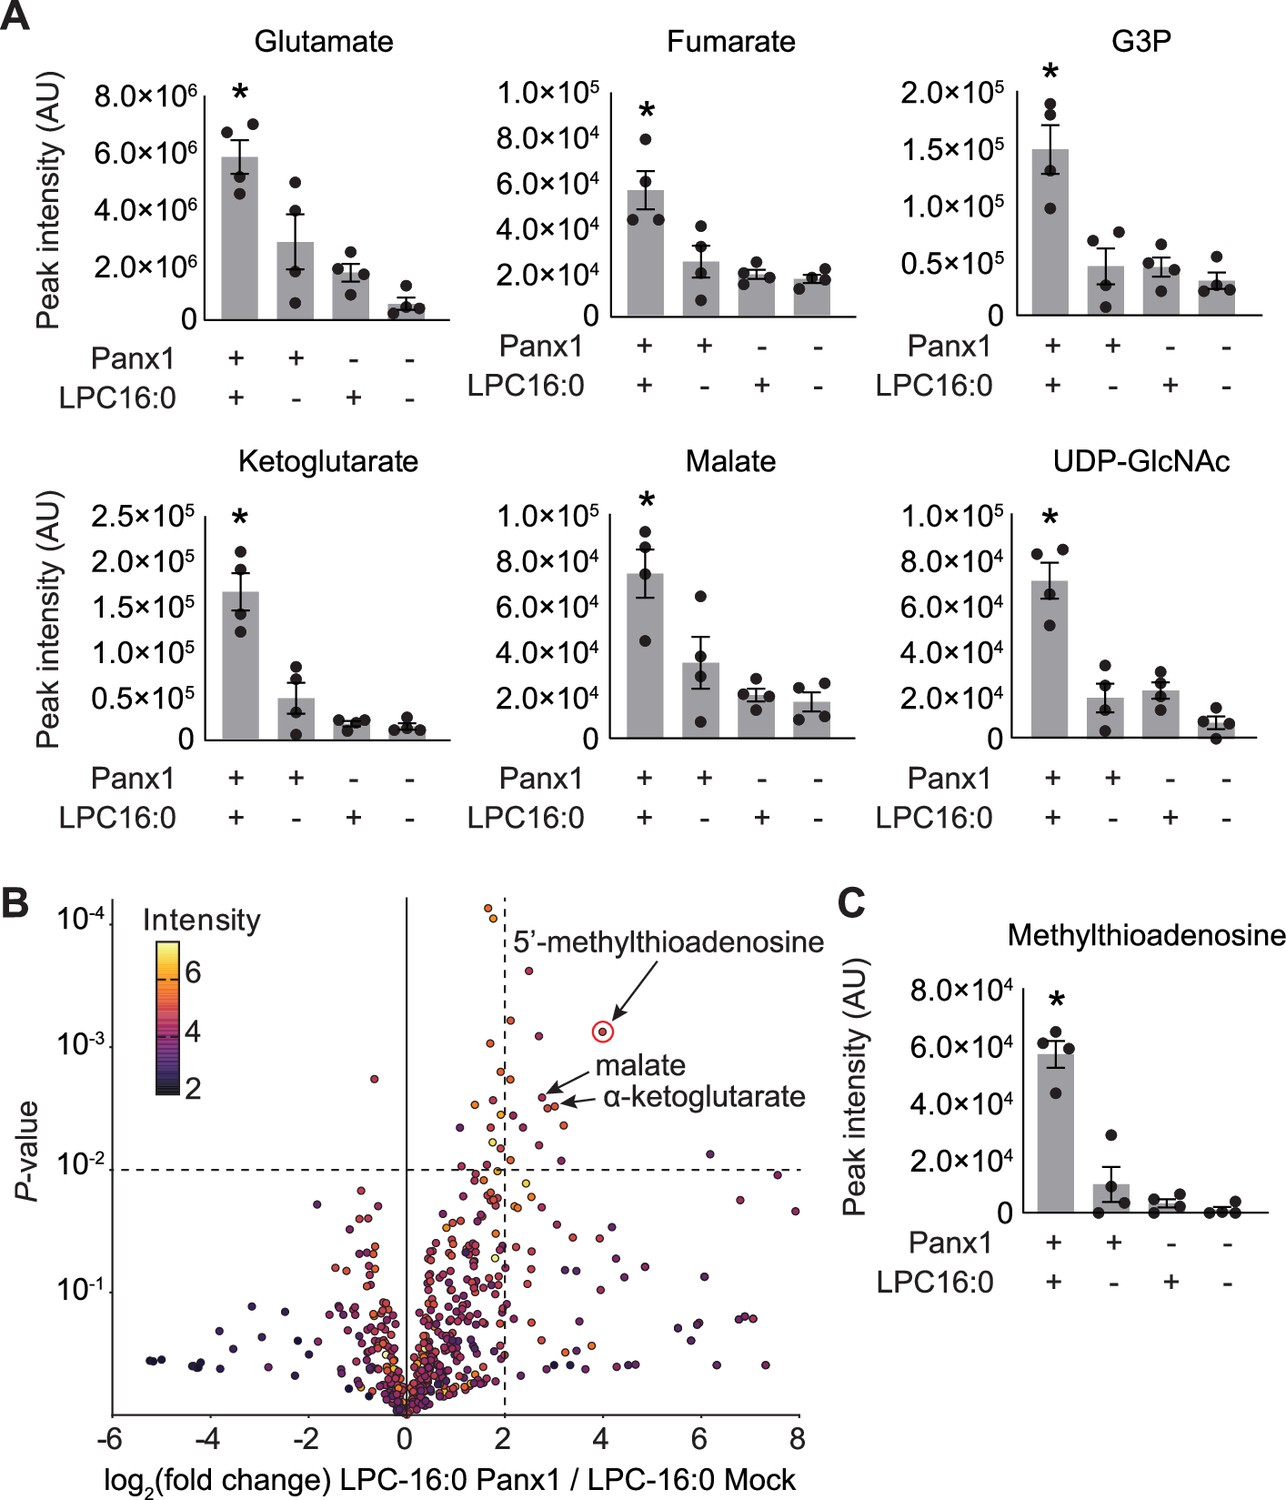
Select released signaling metabolites following LPC-16:0 stimulation of Panx1.
A Metabolites enriched in the conditioned media (CM) of cells expressing Panx1 treated with LPC-16:0 that were previously identified as Panx1 permeant using apoptotic T cells (Medina et al., 2020). (B) Comparative analysis by HPLC-HRMS of CM from cells expressing Panx1 +LPC-16:0 versus CM from vector-expressing cells treated with LPC-16:0. Volcano plot depicts subset of features detected in negative ion mode. Unadjusted p-values calculated by unpaired, two-sided t-test (see Materials and methods for details). (C) Additional metabolite discovered in this study with known roles in immunomodulation. Panx1 was expressed in GnTI- cells and the released metabolites were analyzed 45 min after the stimulation with LPC-16:0 (10 μM). N=4. p values were calculated using one-way ANOVA. Asterisks denote p<0.05. Error bars represent SEM.
-
Figure 3—source data 1
Mass spec data used for Figure 3.
- https://cdn.elifesciences.org/articles/107067/elife-107067-fig3-data1-v1.xlsx
Figure 4 with 1 supplement

Functional reconstitution of Panx1 confirms direct activation by LPC-16:0.
A Schematic representation of YO-PRO-1 uptake assay. (B) Relative YO-PRO-1 fluorescence triggered by LPC-16:0 (100 μM) with or without CBX (50 μM). Asterisks indicate p<0.01 using unpaired t-test. The number of measurements from different cells for each experiment (biological replicates) is shown in parenthesis. (C) Dose-response profile of Panx1 treated with LPC-16:0. Dose responses were fitted with the Hill equation, and the EC50 values are indicated. The number of biological replicates is available in Figure 4—source data 1. Error bars represent SEM.
-
Figure 4—source data 1
YO-PRO-1 uptake assay data used for Figure 4.
- https://cdn.elifesciences.org/articles/107067/elife-107067-fig4-data1-v1.xlsx
Figure 4—figure supplement 1
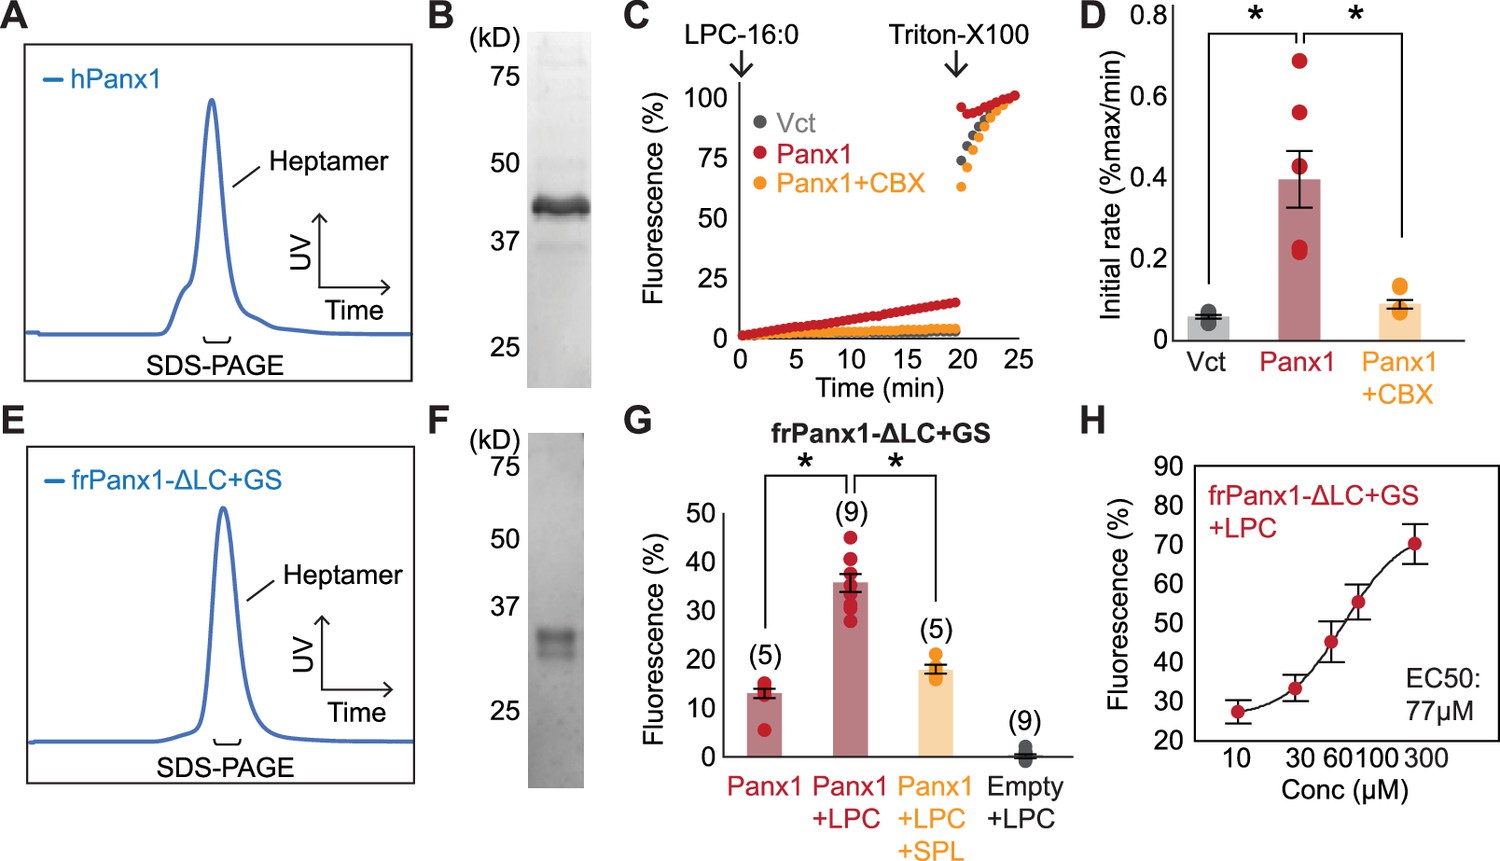
Functional reconstitution of purified Panx1.
A-D Full-length human Panx1 used for functional reconstitution. A representative SEC profile (A) and an SDS-PAGE gel image (B) of the samples purified from HEK293S GnTI- cells. Time course (C) and quantification (D) of cellular YO-PRO-1 uptake are shown. LPC-16:0 (10 μM) and CBX (50 μM) are used. N=8. P values are obtained using one-way ANOVA followed by Dunnett’s t-test. Asterisks indicate p<0.01 and error bars represent SEM. (E–H) The frog Panx1 construct (frPanx1-ΔLC+GS) used for the previous cryo-EM studies (Michalski et al., 2020). A representative SEC profile (E) and an SDS-PAGE gel image (F) of frPanx1-ΔLC+GS purified from High Five insect cells. Relative YO-PRO-1 fluorescence from frPanx1-ΔLC+GS reconstituted liposomes triggered by LPC16:0 (100 μM)(G). Spironolactone (SPL; 50 μM) was used to confirm Panx1-specific activity. p values are obtained using unpaired t-test. Asterisks indicate p<0.01. The number of measurements from different cells for each experiment (biological replicates) is shown in parenthesis. Dose-response profile of Panx1 treated with LPC-16:0 (H). The number of biological replicates is available in Figure 4—figure supplement 1—source data 1. Dose responses were fitted with the Hill equation and the EC50 values are indicated. Error bars represent SEM.
-
Figure 4—figure supplement 1—source data 1
YO-PRO-1 uptake assay data used for Figure 4—figure supplement 1.
- https://cdn.elifesciences.org/articles/107067/elife-107067-fig4-figsupp1-data1-v1.xlsx
-
Figure 4—figure supplement 1—source data 2
Raw gel images used for Figure 4—figure supplement 1.
- https://cdn.elifesciences.org/articles/107067/elife-107067-fig4-figsupp1-data2-v1.zip
-
Figure 4—figure supplement 1—source data 3
Annotated gel images used for Figure 4—figure supplement 1.
- https://cdn.elifesciences.org/articles/107067/elife-107067-fig4-figsupp1-data3-v1.zip
Figure 5
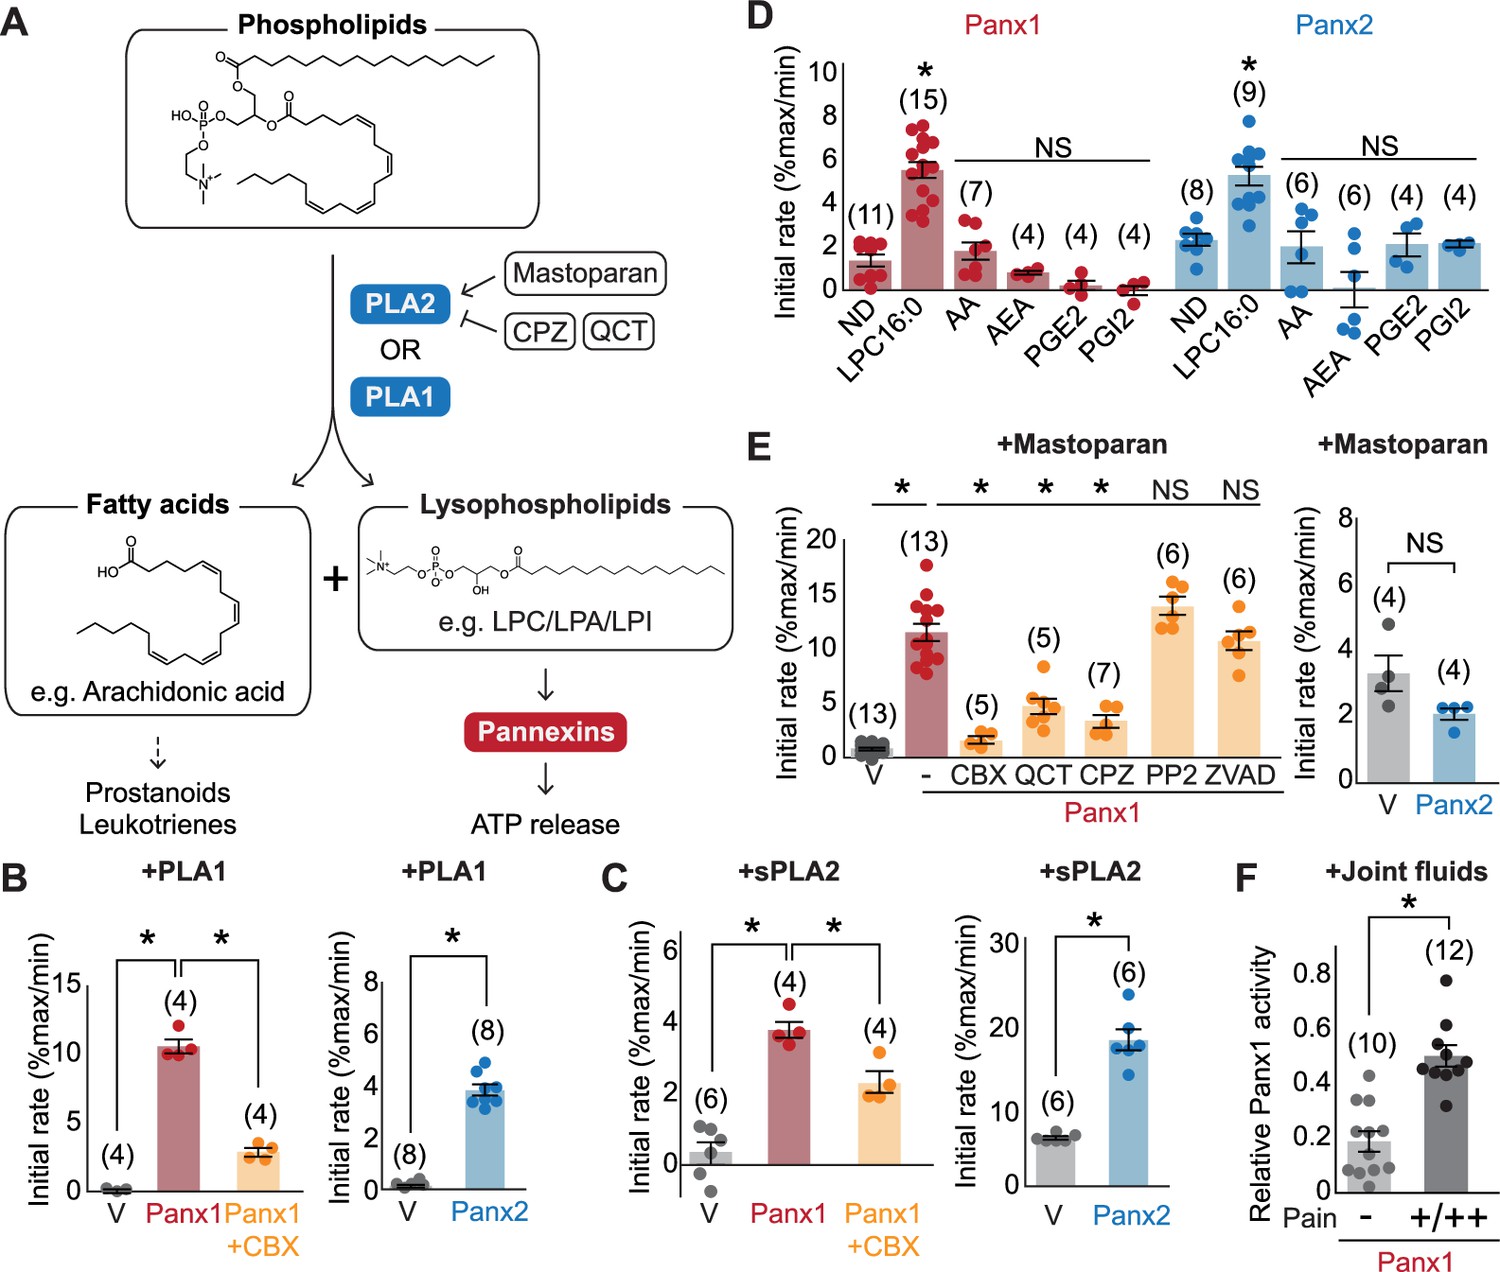
Pannexins mediate lysophospholipid signaling.
(A) Schematic illustrating lysophospholipid signaling. (B–E) Pannexin activation triggered by extracellularly applied stimuli. Normalized initial mVenus quenching rates are shown for PLA1 (B), sPLA2 (C), and major metabolic products of PLA2 (D), mastoparan with or without PLA2 inhibitors (QCT and CPZ), a Src kinase inhibitor (PP2), or a caspase inhibitor (ZVAD) (E). V indicates the vector control. Panx1 was expressed in GnTI- cells and Panx2 was expressed in HEK293 cells. (F) Panx1-dependent mVenus quenching induced by synovial fluids obtained from canine patients with mild (-) or moderate/severe (+/++) pain. The activity of each fraction was normalized to the effect of LPC-16:0 (30 μM). Each point represents a different patient. P values were calculated using unpaired Student’s t-test with unequal variances (B), (C), and (F) or using one-way ANOVA, followed by Dunnett’s t-test (D and E). The number of measurements from different cells for each experiment (biological replicates) is shown in parenthesis. Asterisks indicate p<0.01. Error bars represent SEM.
-
Figure 5—source data 1
mVenus quench assay data used for Figure 5.
- https://cdn.elifesciences.org/articles/107067/elife-107067-fig5-data1-v1.xlsx
Figure 6 with 1 supplement
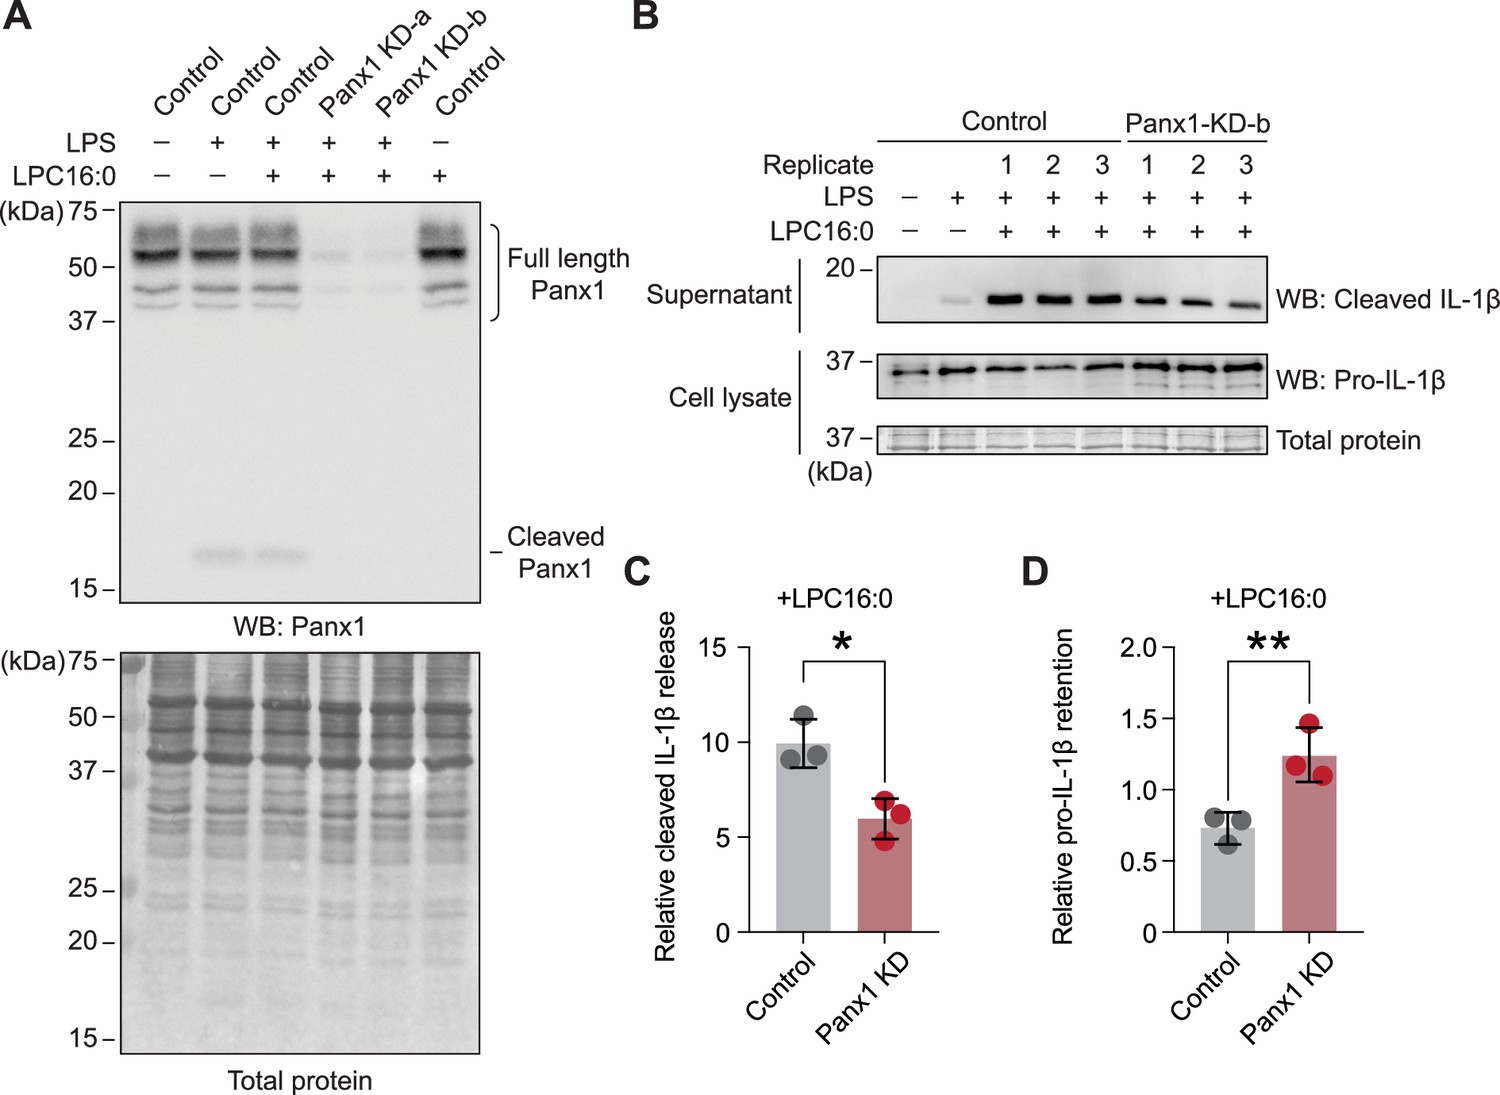
Knockdown of endogenous Panx1 reduces LPC-16:0-triggered release of cleaved IL-1β.
(A) Panx1 protein expression levels in PMA-differentiated/LPS-primed THP-1 control (shRNA-empty vector) cells or two different shPANX1 knockdown (KD) lines. (B) Cleaved IL-1β released into culture supernatant following stimulation with 50 µM LPC-16:0 for 1.5 hr. A representative blot for control and Panx1 knockdown cells is shown. (C) Densitometry (ImageJ) was used to quantify the LPC-16:0-induced release of cleaved IL-1β from control and Panx1 KD-b cells relative to the release from control cells only primed with LPS. (D) Relative amount of the retained pro-IL-1β normalized to total protein in the cells. p values were calculated using unpaired Student’s t-test. * indicates p<0.0032 and ** indicates p<0.0021. Error bars represent SD. Three individual experiments using different batches of cells (biological replicates) were performed.
-
Figure 6—source data 1
Densitometry data used for Figure 6.
- https://cdn.elifesciences.org/articles/107067/elife-107067-fig6-data1-v1.xlsx
-
Figure 6—source data 2
Raw blot images used for Figure 6.
- https://cdn.elifesciences.org/articles/107067/elife-107067-fig6-data2-v1.zip
-
Figure 6—source data 3
Annotated blot images used for Figure 6.
- https://cdn.elifesciences.org/articles/107067/elife-107067-fig6-data3-v1.zip
Figure 6—figure supplement 1
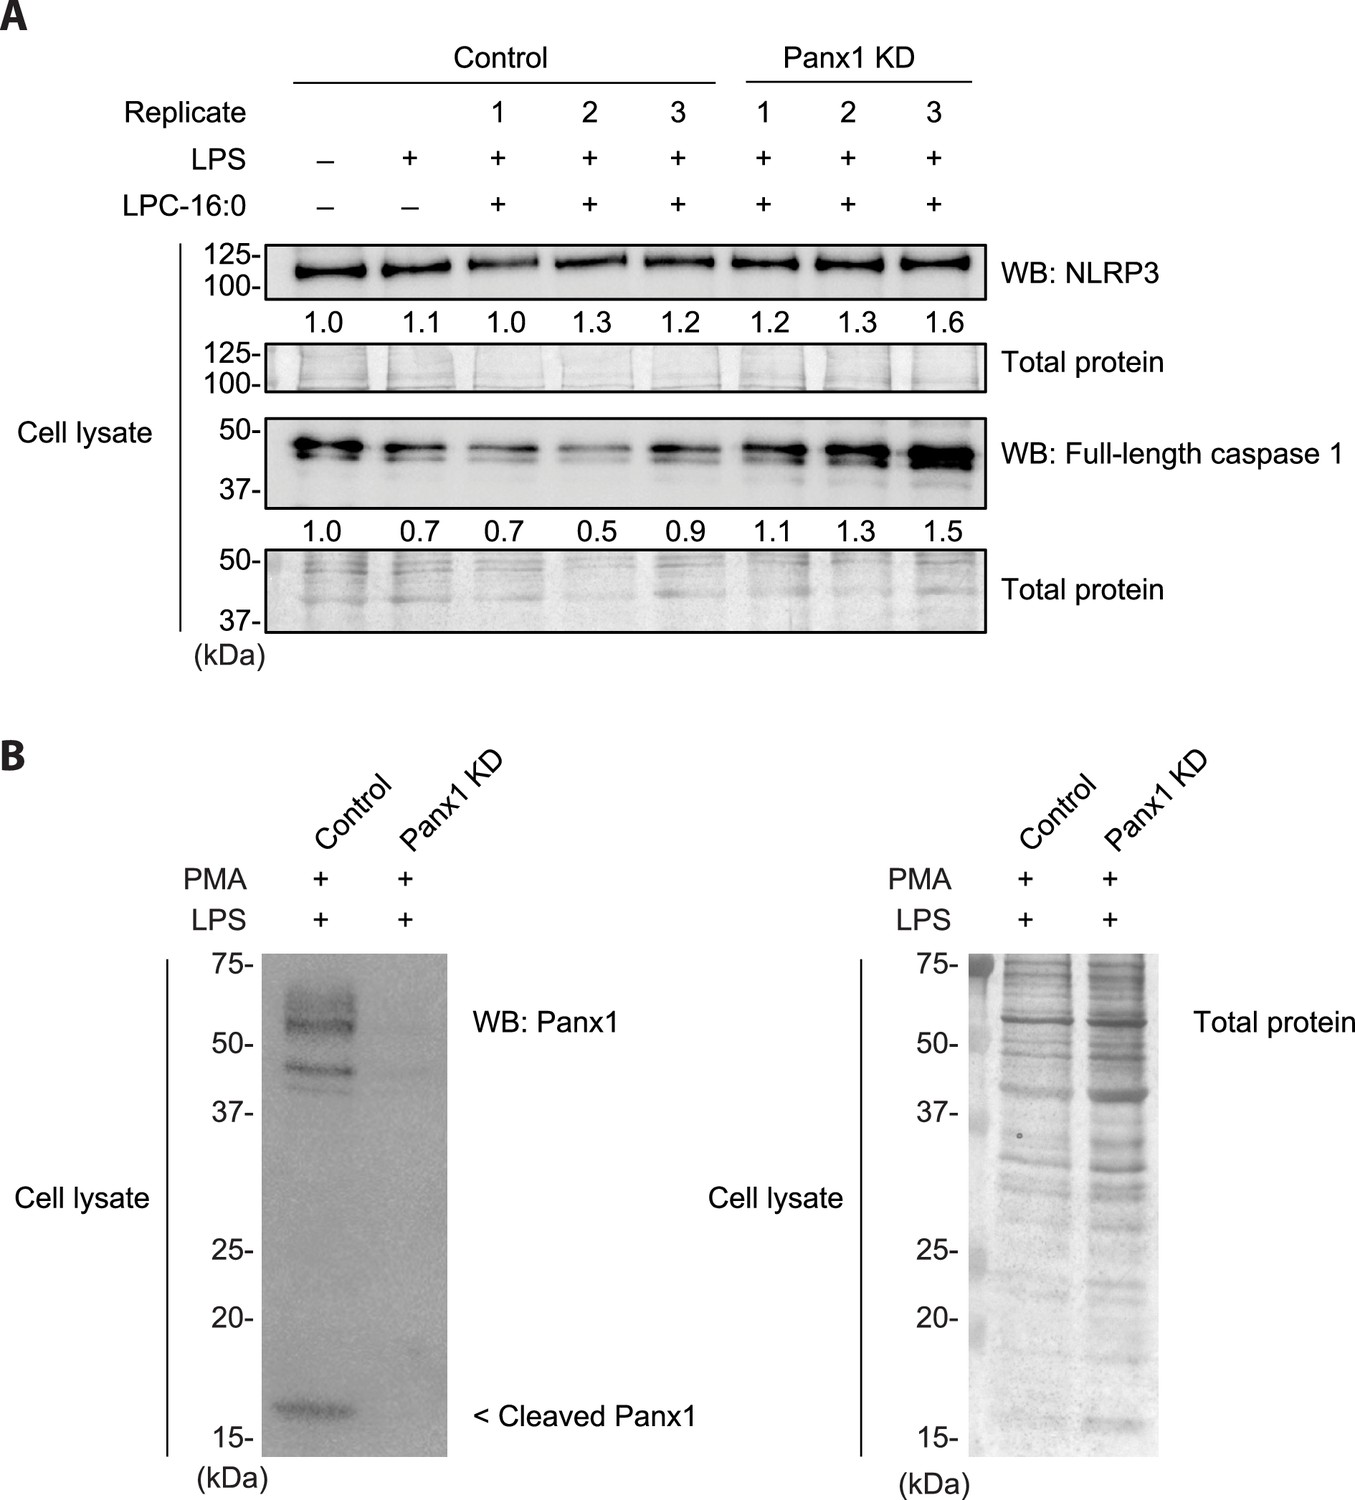
Expression of Panx1 and other inflammasome components in THP-1 cells treated with LPC16:0.
(A) Protein expression levels of NLRP3, full-length caspase 1, and (B) Panx1 in PMA-differentiated/LPS-primed THP-1 cells used in LPC16:0-induced IL-1β release experiments. Relative NLRP3 and caspase 1 levels (A) in cell lysates were quantified with densitometry by normalizing to total protein loading. Three individual experiments using different batch of cells (biological replicates) were performed.
-
Figure 6—figure supplement 1—source data 1
Raw blot images used for Figure 6—figure supplement 1.
- https://cdn.elifesciences.org/articles/107067/elife-107067-fig6-figsupp1-data1-v1.zip
-
Figure 6—figure supplement 1—source data 2
Annotated blot images used for Figure 6—figure supplement 1.
- https://cdn.elifesciences.org/articles/107067/elife-107067-fig6-figsupp1-data2-v1.zip
Figure 7
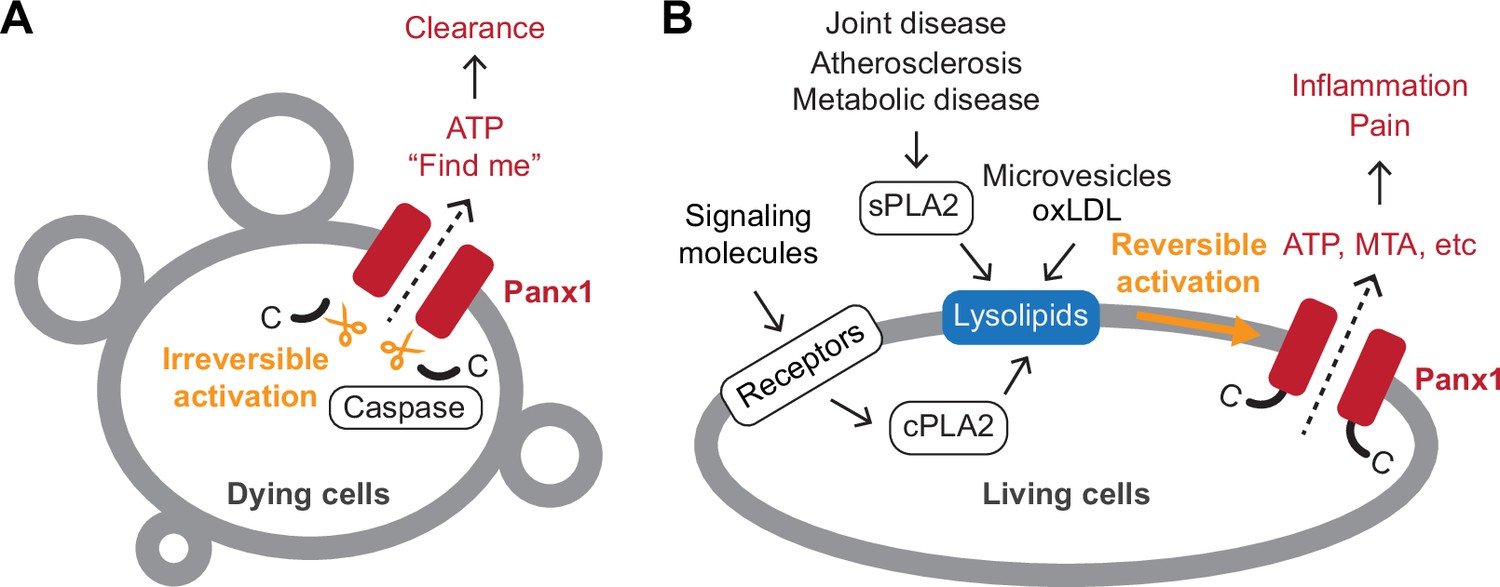
Schematic summary of Panx1-mediated signaling.
A Panx1 activation in dying cells. In dying cells, the C-terminal tails of Panx1 are cleaved by caspases, initiating an irreversible mode of Panx1 activation. This leads to the release of ‘find-me’ signals, such as ATP, which play a role in attracting phagocytic cells to the site of cell death. (B) Panx1 activation in living cells. In living cells, activation of membrane receptors such as NMDA, P2X7, TNF-α, and α1-adrenergic receptors stimulates the production of lysophospholipids via cytoplasmic phospholipase A (PLA) enzymes. Lysophospholipids are abundant in extracellular microvesicles and oxidized low-density lipoproteins (oxLDLs). They are also produced by secreted PLAs during pathological conditions, including atherosclerosis and joint or metabolic diseases. These lysophospholipids reversibly activate Panx1, leading to the release of signaling molecules crucial for inflammation and pain.
Tables
Key resources table
| Reagent type (species) or resource | Designation | Source or reference | Identifiers | Additional information |
|---|---|---|---|---|
| Peptide, recombinant protein (Homo sapiens) | Pannexin1 | UniProt | Q96RD7 | Coding DNA was synthesized and subcloned into multiple expression vectors |
| Peptide, recombinant protein (Homo sapiens) | Pannexin2 | UniProt | Q96RD6 | Coding DNA was synthesized and subcloned into multiple expression vectors |
| Peptide, recombinant protein (Homo sapiens) | Pannexin3 | UniProt | Q96QZ0 | Coding DNA was synthesized and subcloned into multiple expression vectors |
| Peptide, recombinant protein (Xenopus tropicalis) | Pannexin1 | UniProt | B3DLA5 | Coding DNA was synthesized and subcloned into multiple expression vectors |
| Peptide, recombinant protein (Homo sapiens) | Connexin-43 | UniProt | P17302 | Coding DNA was synthesized and subcloned into multiple expression vectors |
| Peptide, recombinant protein (Homo sapiens) | LRRC8A | UniProt | Q8IWT6 | Coding DNA was synthesized and subcloned into multiple expression vectors |
| Peptide, recombinant protein (Caenorhabditis elegans) | Innexin-6 | UniProt | Q9U3N4 | Coding DNA was synthesized and subcloned into multiple expression vectors |
| Recombinant DNA reagent | pIE2 (plasmid) | This paper | Kawate lab plasmid, mammalian expression vector with IRES-GFP | |
| Recombinant DNA reagent | pCNG-FB7 (plasmid) | This paper | Kawate lab plasmid, insect cell expression vector | |
| Recombinant DNA reagent | pEZT-BM (plasmid) | Addgene | 74099 | |
| Cell line (Spodoptera frugiperda) | Sf9 | ThermoFisher | 12659017 | RRID:CVCL_0549 |
| Cell line (Trichoplusia ni) | High Five | ThermoFisher | B85502 | RRID:CVCL_C190 |
| Cell line (Homo-sapiens) | HEK293 | ATCC | CRL-1573 | RRID:CVCL_0045 |
| Cell line (Homo-sapiens) | HEK293T | ATCC | CRL-3216 | RRID:CVCL_0063 |
| Cell line (Homo-sapiens) | HEK293S GnTI- | ATCC | CRL-3022 | RRID:CVCL_A785 |
| Cell line (Homo-sapiens) | THP-1 | ATCC | TIB-202 | RRID:CVCL_0006 |
| Transfected construct (Homo-sapiens) | PANX1- shRNA #1 | BROAD Institute Genetic Perturbation Platform | TRCN0000155348 | Lentiviral construct to transfect and express the shRNA |
| Transfected construct (Homo-sapiens) | PANX1- shRNA #2 | BROAD Institute Genetic Perturbation Platform | TRCN0000154636 | Lentiviral construct to transfect and express the shRNA |
| Antibody | anti-FLAG M2 (Mouse monoclonal) | Millipore Sigma | F1804 | WB (1:2000) RRID:AB_262044 |
| Antibody | anti-actin (Mouse monoclonal) | Millipore Sigma | A4700 | WB (1:2000) RRID:AB_476730 |
| Antibody | anti-Panx1 (Rabbit monoclonal) | Cell Signaling Technologies | 91137 | WB (1:1000) RRID:AB_2800167 |
| Antibody | anti-cleaved IL-1β (Rabbit monoclonal) | Cell Signaling Technologies | 83186 | WB (1:1000) RRID:AB_2800010 |
| Antibody | anti-cleaved pro-IL-1β (Mouse monoclonal) | Cell Signaling Technologies | 12242 | WB (1:1000) RRID:AB_2715503 |
| Antibody | anti-NLRP3 (Rabbit monoclonal) | Cell Signaling Technologies | 15101 | WB (1:1000) RRID:AB_2722591 |
| Antibody | anti-Caspase 1 (Mouse monoclonal) | AdipoGen | AG-20B-0048 | WB (1:1000) RRID:AB_2490257 |
| Antibody | anti-rabbit IgG HRP-linked | Cell Signaling Technologies | 7074 | WB (1:5000) RRID:AB_2099233 |
| Antibody | anti-mouse IgG HRP-linked | Cell Signaling Technologies | 7076 | WB (1:5000) RRID:AB_330924 |
Table 1
Enriched compounds in fractions 7 and 8.
| RT (min) | [M]+ | Obs. m/z | Calc. m/z | Error (ppm) | [M]- | Obs. m/z | Calc. m/z | Error (ppm) | Formula | ID |
|---|---|---|---|---|---|---|---|---|---|---|
| 15.05 | ND | - | - | - | M-H | 229.1808 | 229.1809 | 0.46 | C13H26O3 | Unknown. Likely hydroxylated fatty acid |
| 15.1 | M+H | 454.2917 | 454.2928 | 2.37 | M-H | 452.2782 | 452.2783 | 0.24 | C21H44NO7P | LPE(0/16:0)* |
| 15.12 | ND | - | - | - | M-H | 243.1964 | 243.1966 | 0.54 | C14H28O3 | Unknown. Likely hydroxylated fatty acid |
| 15.16 | M+H | 335.3047 | 335.3057 | 3.09 | ND | - | - | - | C21H38N2O | Unknown |
| 15.25 | ND | - | - | - | M-H | 241.1809 | 241.1809 | 0.06 | C14H26O3 | Unknown. Likely hydroxylated fatty acid |
| 15.32 | ND | - | - | - | M-H | 243.1964 | 243.1966 | 0.51 | C14H28O3 | Unknown. Likely hydroxylated fatty acid |
| 15.38 | M+H | 454.2918 | 454.2928 | 2.27 | M-H | 452.2781 | 452.2783 | 0.30 | C21H44NO7P | LPE(16:0/0) |
| 15.39 | M+H | 496.3388 | 496.3398 | 1.85 | M+formate | 540.3296 | 540.3307 | 2.03 | C24H51NO7P | LPC(0/16:0) |
| 15.56 | M+H | 546.3548 | 546.3554 | 1.15 | M+formate | 590.3465 | 590.3463 | –0.21 | C28H53NO7P | LPC(20:3/0)* |
| 15.68 | M+H | 496.3389 | 496.3398 | 1.80 | M+formate | 540.3297 | 540.3307 | 1.89 | C24H51NO7P | LPC(16:0/0) |
| 15.76 | M+H | 522.3548 | 522.3554 | 1.25 | M+formate | 566.3469 | 566.3463 | –0.96 | C26H53NO7P | LPC(0/18:1)* |
| 16.01 | M+H | 522.3546 | 522.3554 | 1.65 | M+formate | 566.3468 | 566.3463 | –0.86 | C26H53NO7P | LPC(18:1/0) |
| 21.86 | M+H (?) | 536.1646 | - | - | ND | - | - | - | ? | Unknown† |
-
ND; not detected.
-
*
Predicted metabolite based on molecular formula and MS/MS fragmentation.
-
†
Likely polysiloxane or similar contaminant. Detected most strongly in fraction 8, but additionally in fractions 4 and 5.
Additional files
Download links
A two-part list of links to download the article, or parts of the article, in various formats.
Downloads (link to download the article as PDF)
Open citations (links to open the citations from this article in various online reference manager services)
Cite this article (links to download the citations from this article in formats compatible with various reference manager tools)
ATP-release pannexin channels are gated by lysophospholipids
eLife 14:RP107067.
https://doi.org/10.7554/eLife.107067.2


