Glutaminase 2 is a novel negative regulator of small GTPase Rac1 and mediates p53 function in suppressing metastasis
- Rutgers, The State University of New Jersey, United States
- First Affiliated Hospital, Zhejiang University School of Medicine, China
Figures
Figure 1

Rac1 is a novel interacting protein for GLS2.
(A) The potential GLS2-interacting proteins identified by co-IP followed by LC-MS/MS analysis. Huh-1 cells expressing GLS2-Flag or cells transduced with control vectors were used for co-IP with the anti-Flag antibody followed by LC-MS/MS analysis. The potential GLS2 interacting proteins are listed with the number of peptides identified by LC-MS/MS analysis. (B) GLS2-Flag interacted with Myc-Rac1 in cells. Huh-1 cells were transduced with Myc-Rac1, GLS2-Flag and control vectors as indicated for co-IP assays using the anti-Myc (left panels) and anti-Flag antibodies (right panels), respectively. (C) GLS1-Flag did not interact with Myc-Rac1 in cells. Huh-1 cells were transduced with Myc-Rac1 and GLS1-Flag vectors for co-IP assays using the anti-Myc (left panels) and anti-Flag antibodies (right panels), respectively. (D) Endogenous GLS2 but not GLS1 interacted with endogenous Rac1 in Huh-1 and HepG2 cells detected by co-IP assays. (E) Schematic representation of vectors expressing Flag-tagged WT or serial deletion mutants of GLS2. (F) The C-terminus of GLS2, GLS2-C139, is necessary and sufficient for GLS2 to interact with Rac1. Huh-1 cells were transduced with WT or different mutant GLS2-Flag vectors listed in Figure 1E together with Myc-Rac1 vectors for co-IP assays. (G) The relative glutaminase activities of WT and different mutant GLS2. Huh-1 and HepG2 cells were transduced with WT and different mutant GLS2 vectors. The relative glutaminase activities in cells transduced with WT GLS2 vectors were designated as 100. **: p<0.001. Student’s t-test. GLS, glutaminase; IB: immunoblot; IP, immunoprecipitation; LC/MC-MS, liquid chromatography-tandem mass spectrometry; WT, wild-type.
Figure 2 with 2 supplements
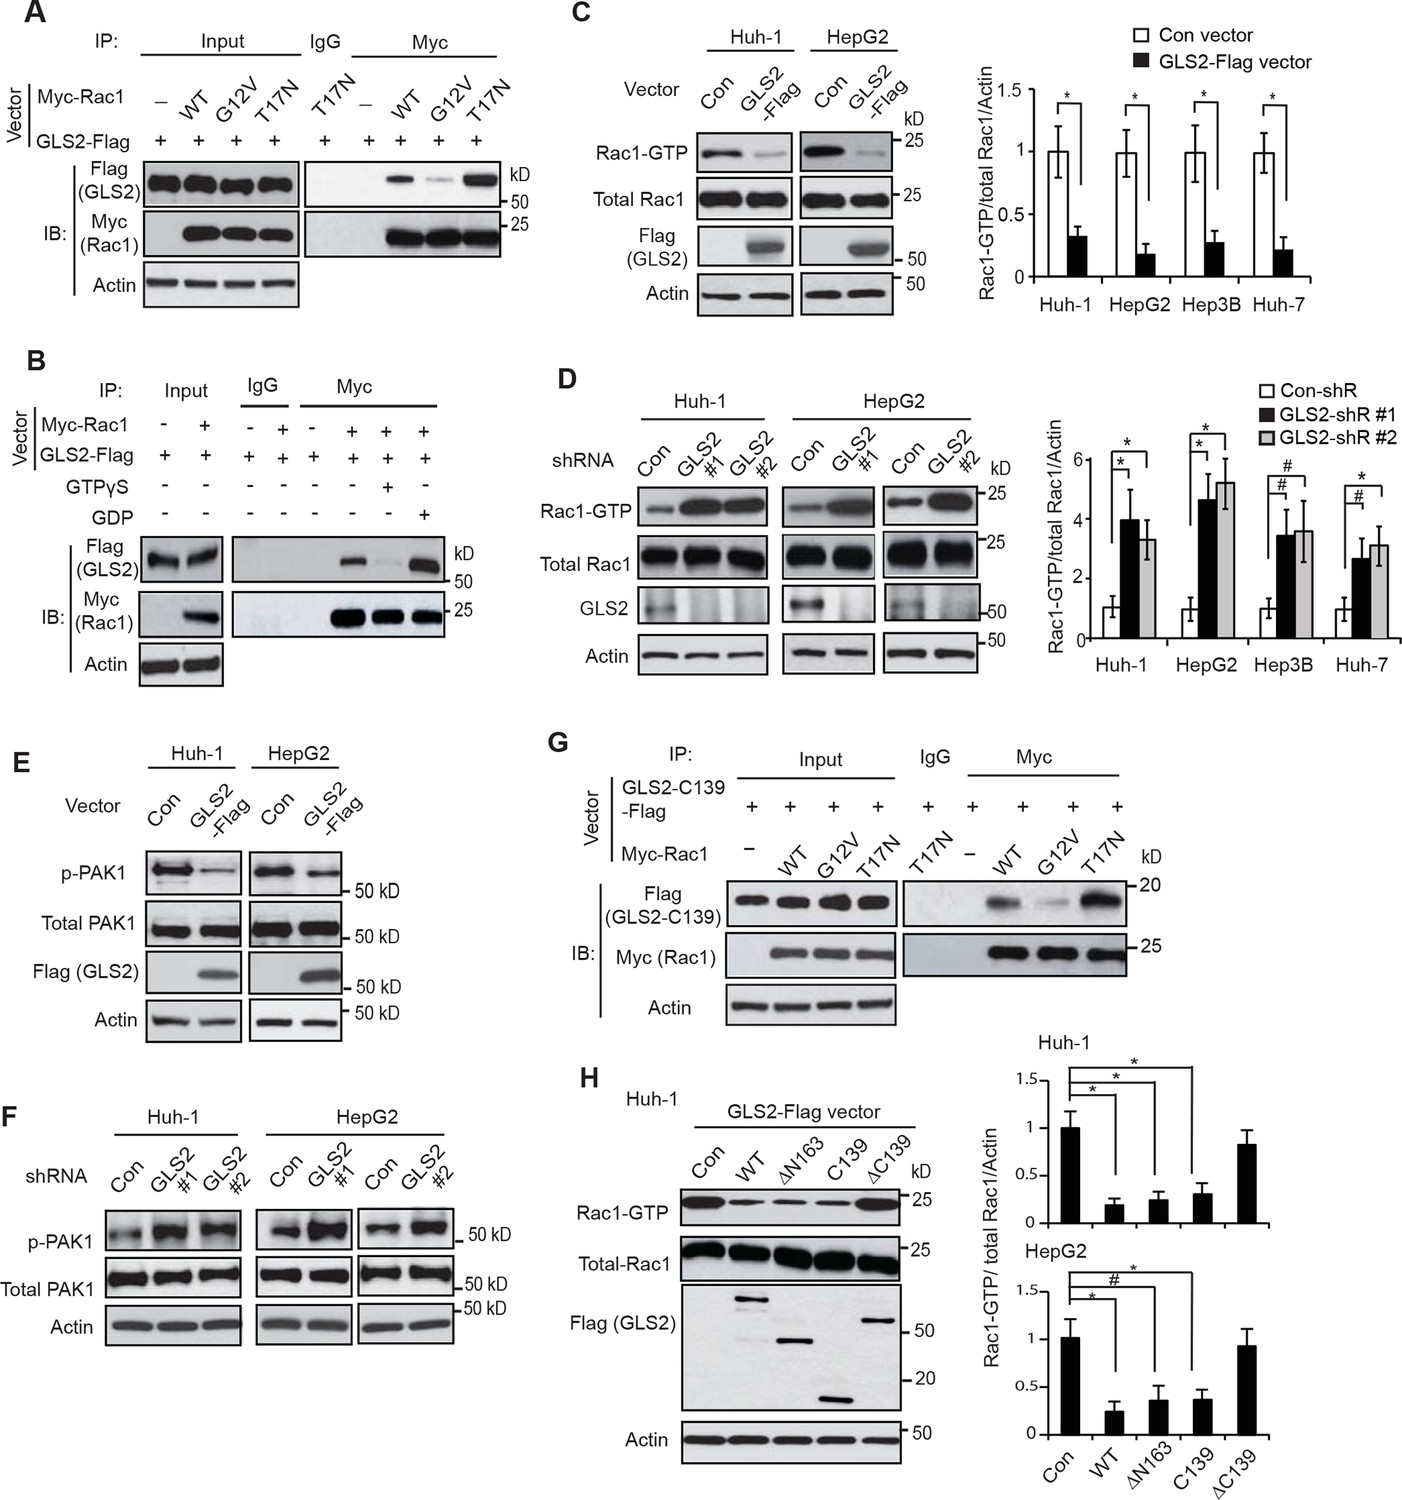
GLS2 interacts with Rac1-GDP and negatively regulates the Rac1 activity.
(A) GLS2-Flag preferentially interacted with the DN Myc-Rac1-T17N but not the CA Myc-Rac1-G12V in Huh-1 cells. Cells were transduced with GLS2-Flag vectors together with Rac1-T17N or Rac1-G12V vectors for co-IP assays. (B) GLS2-Flag preferentially bound to Rac1-GDP but not Rac1-GTP in cell lysates. Cell lysates from Huh-1 cells transduced with vectors expressing Myc-Rac1 and GLS2-Flag were pretreated with GDP or GTPγS to convert Rac1 into Rac1-GDP or Rac1-GTP form before co-IP assays. (C) Ectopic expression of GLS2 inhibited Rac1 activities represented by decreased levels of Rac1-GTP in HCC cells measured by the GST-p21-binding domain of PAK1 pull-down assays. Left panels: Represented results of Rac1 activity analysis in Huh-1 and HepG2 cells. Right panels: relative Rac1-GTP/total Rac1/Actin levels in Huh-1, HepG2, Hep3B and Huh-7 cells. Data present mean ± SD (n=3). *p<0.01; Student’s t-test. (D) Knockdown of GLS2 by shRNA vectors increased Rac1 activities in HCC cells. Left panels: Represented results of Rac1 activity analysis in Huh-1 and HepG2 cells. Right panels: relative Rac1-GTP/total Rac1 /Actin levels in Huh-1, HepG2, Hep3B and Huh-7 cells. Data present mean ± SD (n=3). *p<0.01; #p<0.05; Student’s t-test. (E) Ectopic expression of GLS2-Flag decreased the levels of p-PAK1 at Ser199/204 in Huh-1 and HepG2 cells. (F) Knockdown of GLS2 by shRNA vectors increased the levels of p-PAK1 at Ser199/204 in Huh-1 and HepG2 cells. (G) The C-terminus of GLS2, GLS2-C139, interacted with DN Myc-Rac1-T17N but not CA Myc-Rac1-G12V in Huh-1 cells detected by co-IP assays. (H) The C-terminus of GLS2, GLS2-C139, inhibited the Rac1 activity in Huh-1 and HepG2 cells. Left panels: Represented results of Rac1 activity analysis in Huh-1 cells transduced with different GLS2-Flag vectors. Right panels: relative Rac1-GTP/total Rac1/Actin levels in Huh-1 and HepG2. Data present mean ± SD (n=3). *p<0.01; #p<0.05; Student’s t-test. GDP, guanosine 5′-diphosphate; GLS, glutaminase; GTP, guanosine 5'-triphosphate; HCC, hepatocellular carcinoma; IP, immunoprecipitation; shRNA, short hairpin RNA; WT, wild type.
Figure 2—figure supplement 1
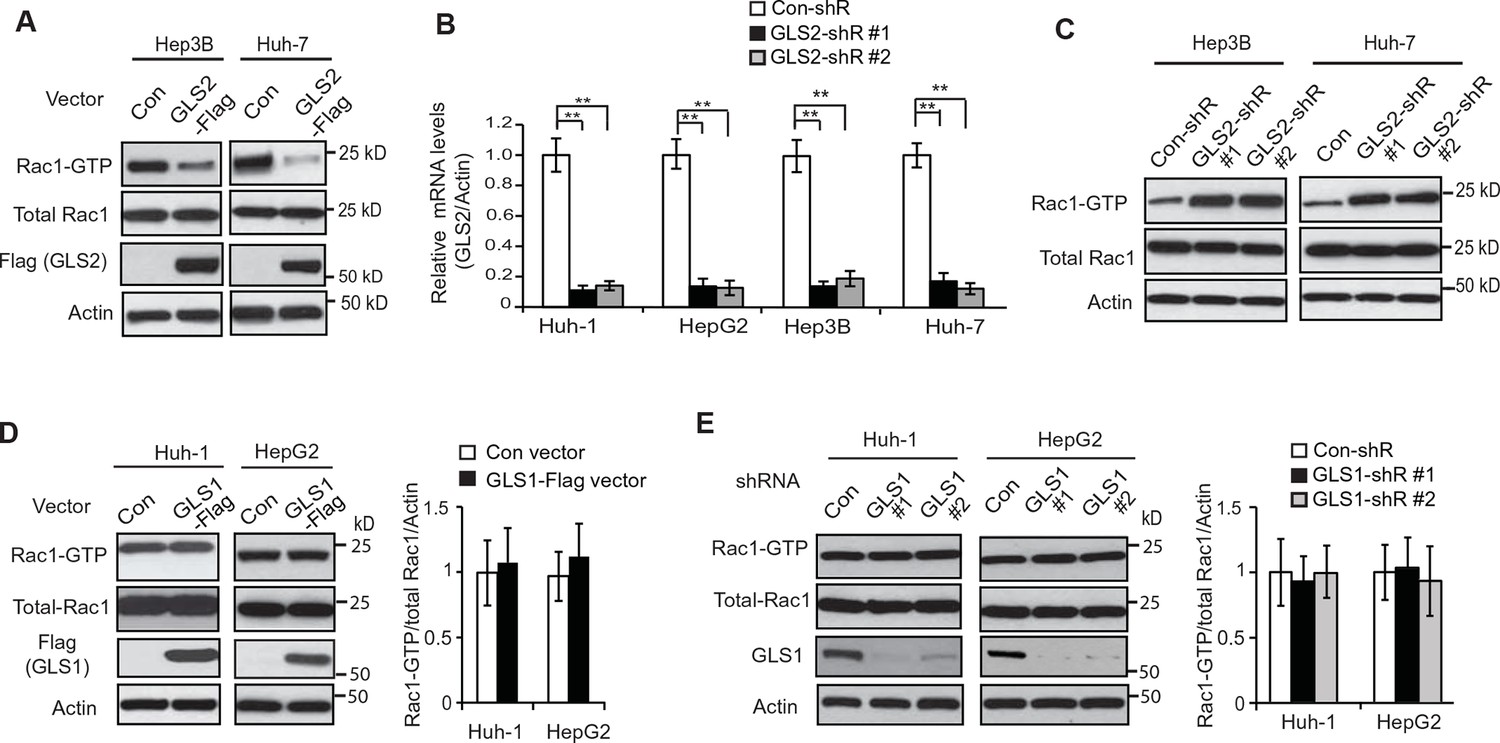
GLS2 inhibits Rac1 activity in HCC cells.
(A) Ectopic expression of GLS2-Flag inhibited Rac1 activities represented by decreased Rac1-GTP levels in Hep3B and Huh-7 cells. (B) Knockdown of GLS2 by 2 different shRNA vectors in different HCC cells detected by Taqman real-time Polymerase chain reaction assays. The messenger RNA expression of GLS2 was normalized with Actin. Data are presented as mean ± SD (n=3). **p<0.001; Student’s t-test. (C) Knockdown of endogenous GLS2 by shRNA enhanced Rac1 activities represented by increased Rac1-GTP levels in Hep3B and Huh-7 cells. GLS2 knockdown was presented in Figure 2—figure supplement 1B. (D) Ectopic expression of GLS1 did not clearly affect the Rac1 activity in Huh-1 or HepG2 cells. (E) Knockdown of endogenous GLS1 by shRNA vectors did not clearly affect the Rac1 activity in Huh-1 or HepG2 cells. In D and E: data present mean ± SD (n=3). GLS, glutaminase; GTP, guanosine 5'-triphosphate; HCC, hepatocellular carcinoma; shRNA, short hairpin RNA
Figure 2—figure supplement 2
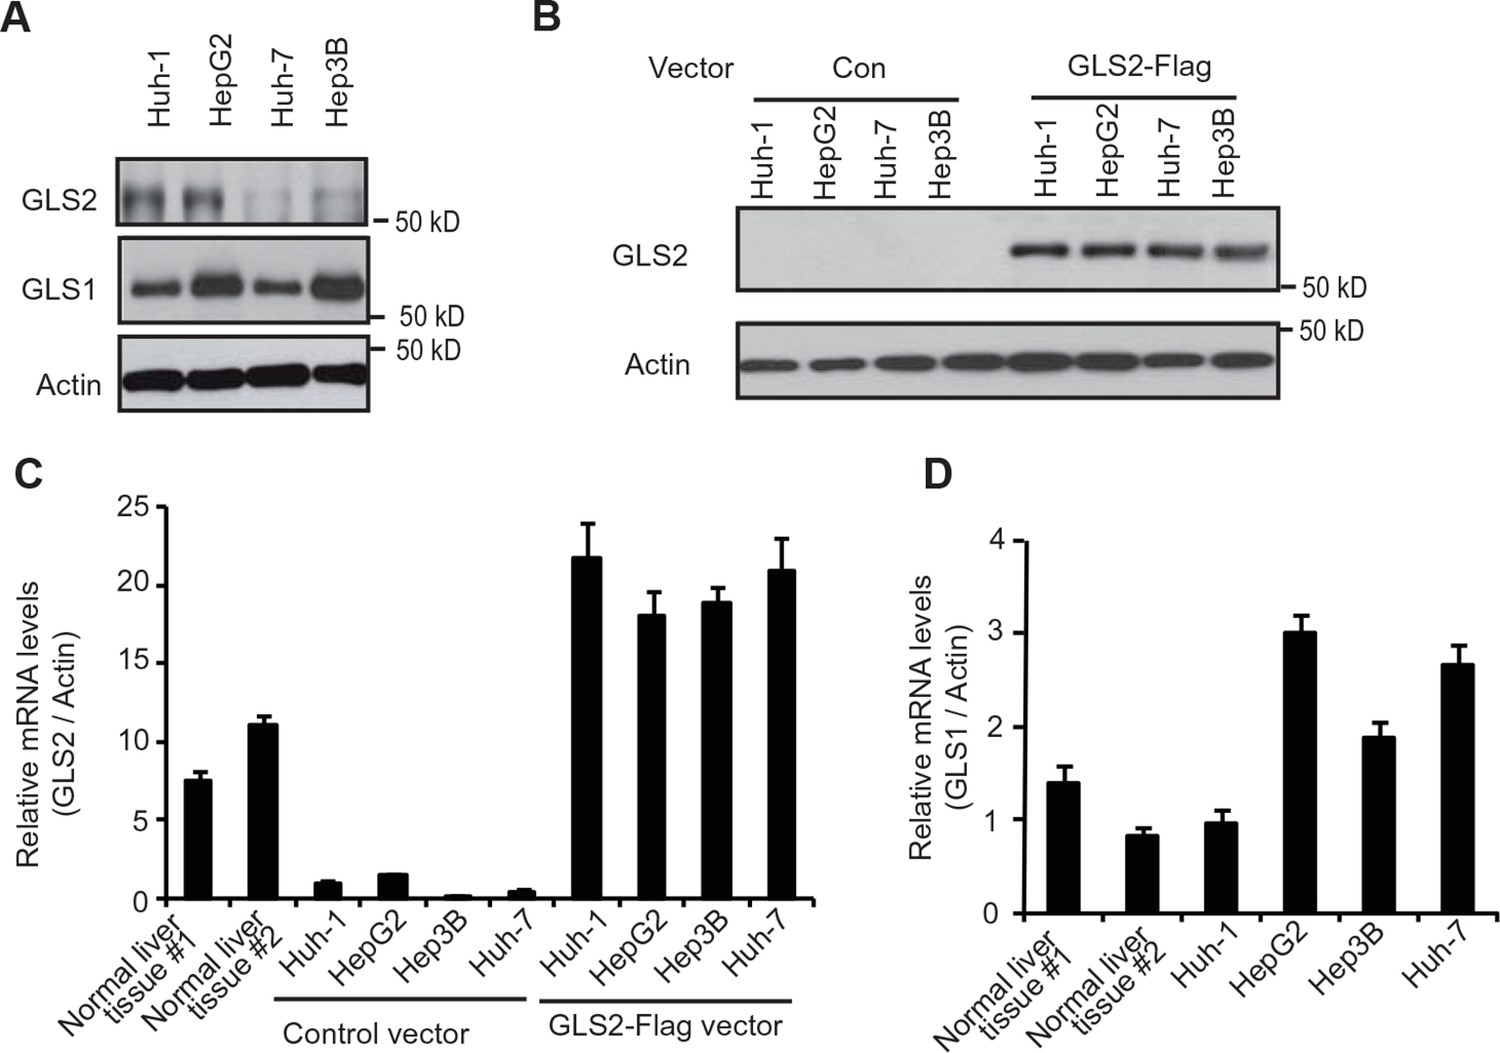
The expression of endogenous GLS2 and exogenous GLS2-Flag in HCC cells.
(A) The expression of endogenous GLS2 protein in HCC cells. To enhance the sensitivity of the anti-GLS2 antibody, endogenous GLS2 in cells was pulled down by IP assays with the anti-GLS2 antibody and detected by western blot assays. (B) The expression of exogenous GLS2-Flag protein in HCC cells. The levels of exogenous GLS2-Flag protein in HCC cells transduced with the GLS2-Flag retrovival vector were measured by western-blot assays. (C) The relative mRNA levels of GLS2 in HCC cells with or without transduction of the GLS2-Flag vector. (D) The relative mRNA levels of GLS1 in HCC cells. In C and D, the mRNA levels of GLS2 and GLS1 in cells were measured by real-time Polymerase chain reaction assays and normalized with Actin. Two normal liver tissues were used as controls. The relative mRNA levels of GLS2 (C) and GLS1 (D) in Huh-1 cells were designated as 1, respectively. GLS, glutaminase; HCC, hepatocellular carcinoma; IP, immunoprecipitation; mRNA, messenger RNA
Figure 3 with 1 supplement
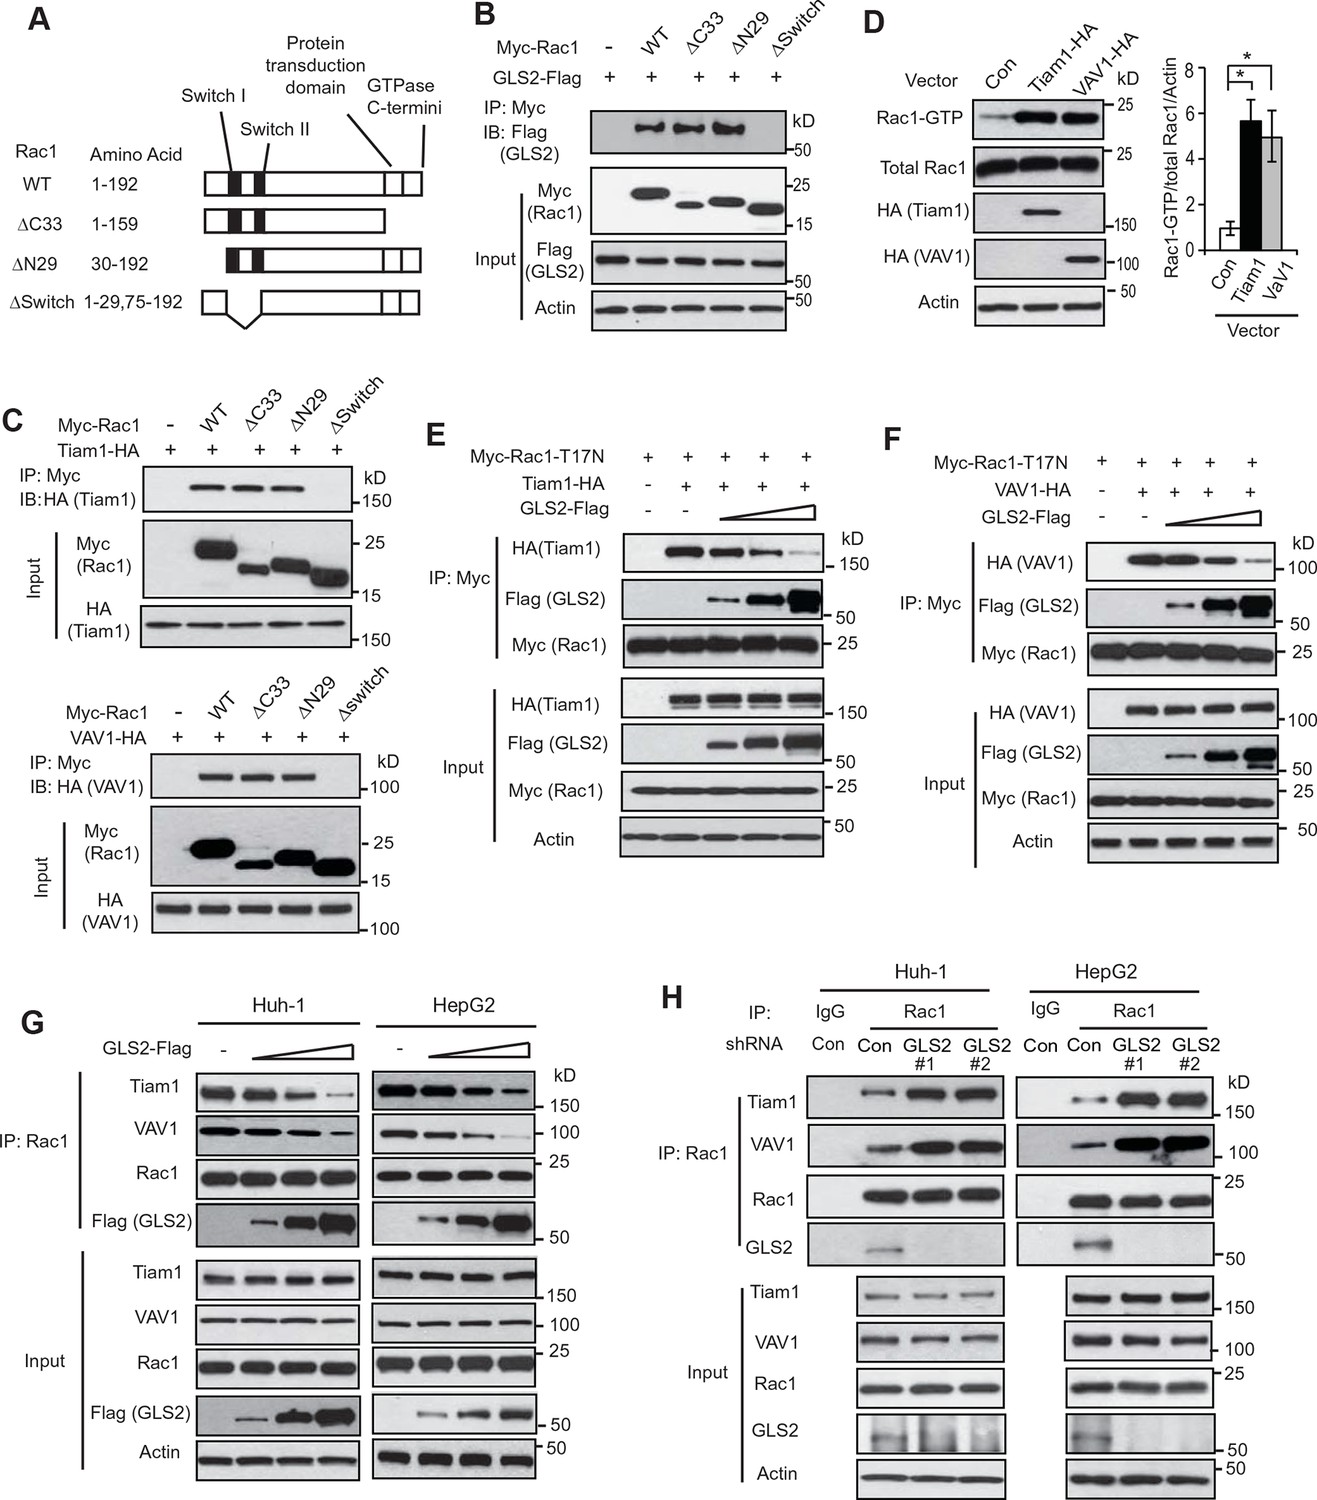
GLS2 inhibits the interaction of Rac1-GDP with Tiam1 and VAV1.
(A) Schematic representation of Rac1 deletion mutants. Myc-tagged vectors expressing WT Rac1 or serial deletion mutants were constructed. (B) GLS2 bound to Rac1 through its Switch I & II regions. Huh-1 cells were transduced with different Myc-Rac1 vectors listed in Figure 3A together with GLS2-Flag vectors for co-IP assays. (C) Tiam1 (upper panels) and VAV1 (lower panels) bound to Rac1 through its Switch I & II regions. Huh-1 cells were transduced with different Myc-Rac1 vectors listed in Figure 3A together with vectors expressing Tiam1-HA or VAV1-HA for co-IP assays. (D) Ectopic expression of Tiam1 and VAV1 activated Rac1 in cells. Huh-1 cells were transduced with vectors expressing Tiam1-HA and VAV1-HA, respectively, and Rac1 activity was analyzed. Data are presented as mean ± SD (n=3). *p<0.01; Student’s t-test. (E, F) Ectopic expression of GLS2 inhibited the interaction of DN Myc-Rac1-T17N with ectopic Tiam1-HA (E) and VAV1-HA (F) in cells. Huh-1 cells were transduced with Myc-Rac1-T17N vectors and Tiam1-HA (E) or VAV1-HA vectors (F) (2 μg), together with increasing amount of GLS2-Flag vectors (1, 3, 6 μg) for co-IP assays. (G) Ectopic expression of GLS2 inhibited the interaction of endogenous Rac1 with endogenous Tiam1 and VAV1 in cells. Huh-1 and HepG2 cells were transduced with increasing amount of GLS2-Flag expression vectors (1, 3, 6 μg) for co-IP assays. (H) Knockdown of endogenous GLS2 by shRNA vectors in Huh-1 and HepG2 cells promoted the interaction of endogenous Rac1 with endogenous Tiam1 and VAV1 as measured by co-IP assays. GLS, glutaminase; GTP, guanosine 5'-triphosphate; IP, immunoprecipitation; shRNA, short hairpin RNA; WT, wild type.
Figure 3—figure supplement 1
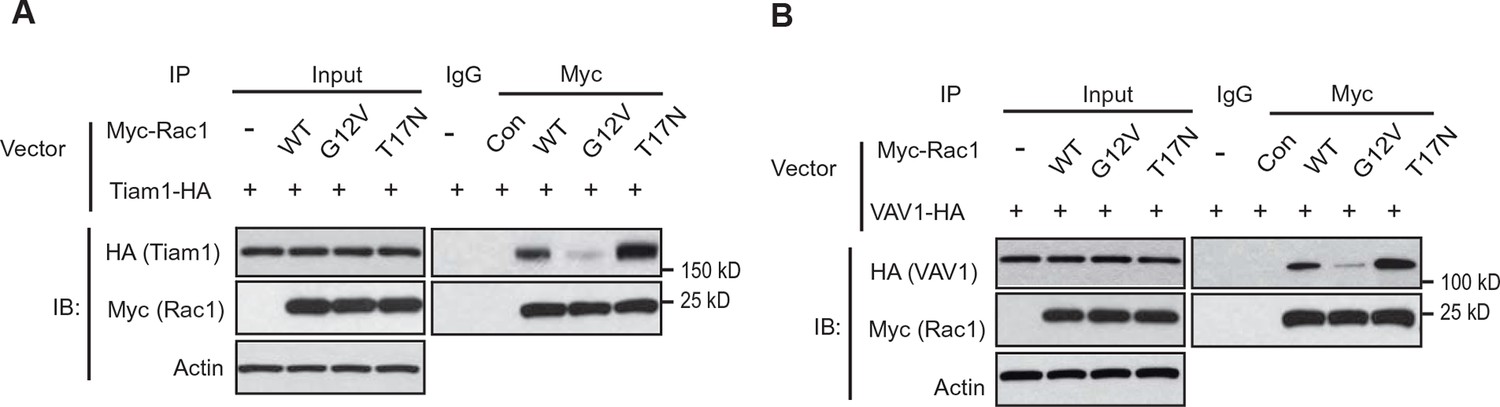
Tiam1 and VAV1 preferentially bind to Rac1-GDP.
(A) Tiam1-HA preferentially bound to the DN Myc-Rac1-T17N but not CA Myc-Rac1-G12V. Huh-1 cells were transduced with DN Rac1-T17N or CA Rac1-G12V vectors together with vectors expressing Tiam1-HA for co-IP assays. (B) VAV1-HA preferentially bound to the DN Myc-Rac1-T17N but not CA Myc-Rac1-G12V. Huh-1 cells were transduced with DN Myc-Rac1-T17N or CA Myc-Rac1-G12V vectors together with vectors expressing VAV1-HA for co-IP assays. IP, immunoprecipitation; WT, wild type.
Figure 4 with 3 supplements
GLS2 inhibits migration and invasion of HCC cells through negative regulation of Rac1.
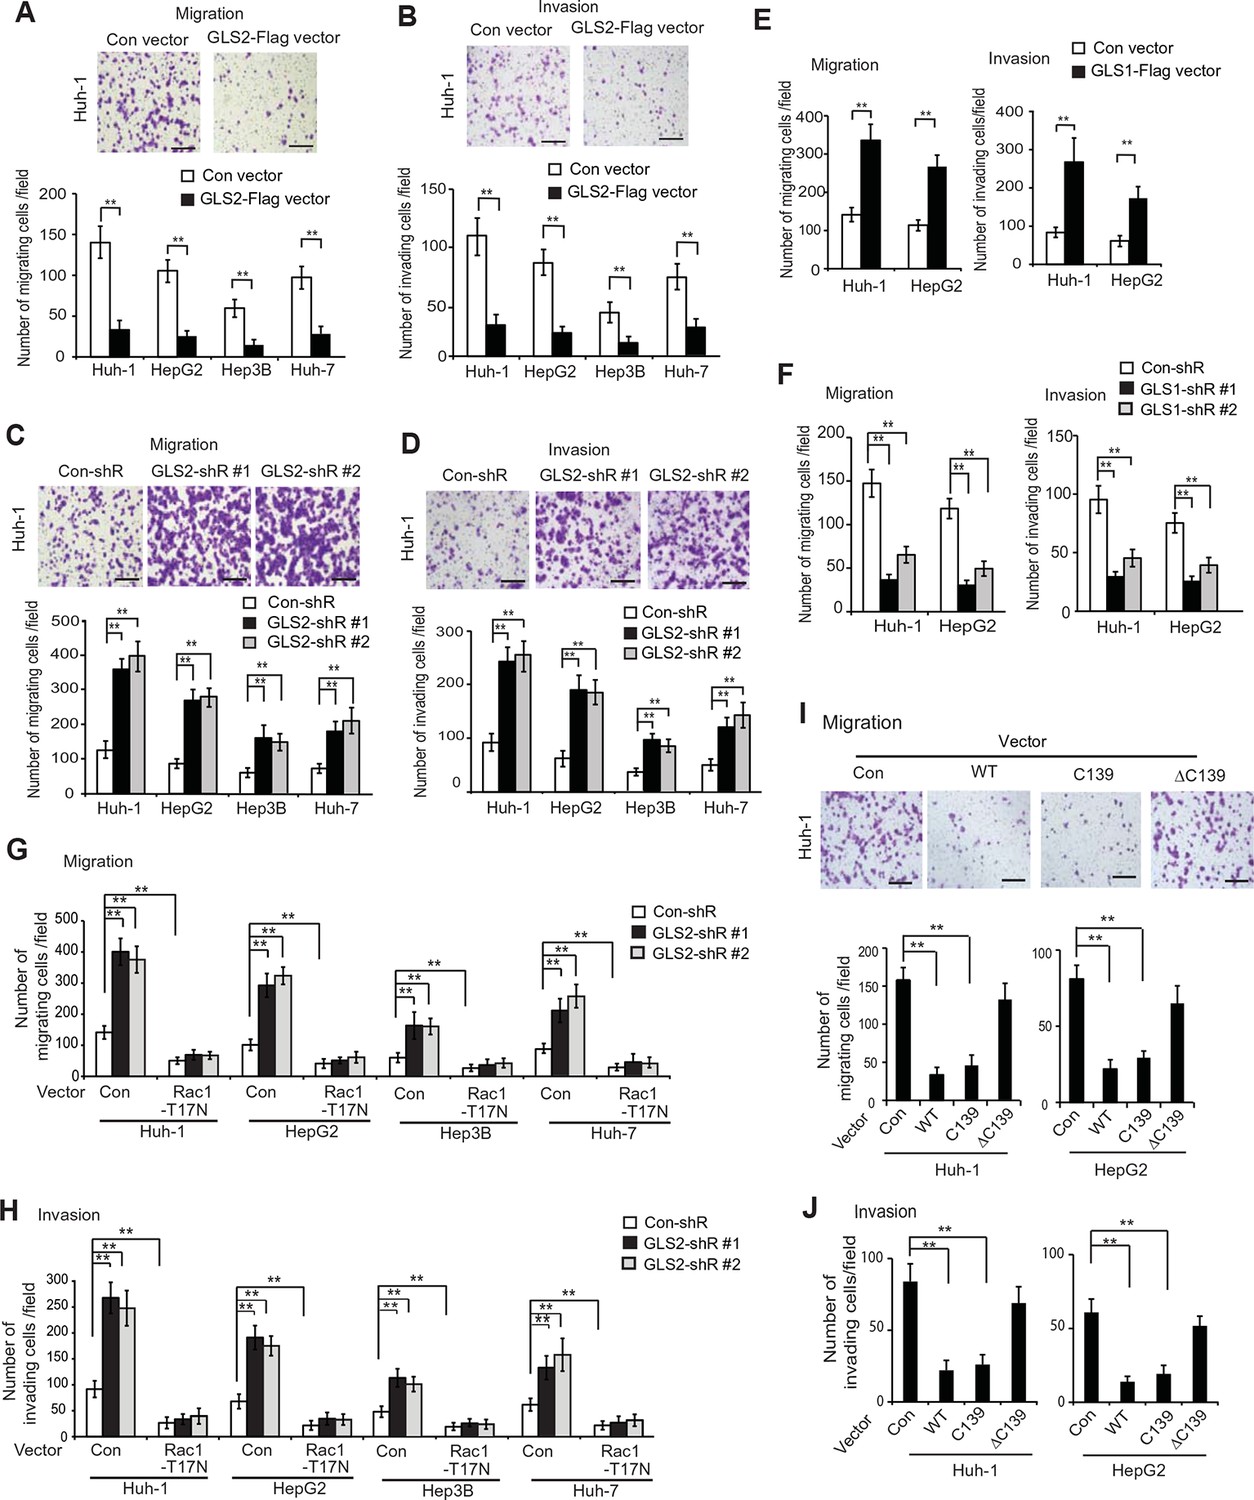
(A, B) Ectopic GLS2 expression inhibited the migration (A) and invasion (B) of different HCC cells as determined by trans-well assays. Upper panels: representative images of migrating (A) and invading (B) Huh-1 cells transduced with control (con) or GLS2-Flag vectors. Scale bars: 200 μm. Lower panels: quantification of average number of migrating (A) and invading (B) cells/field in different HCC cells transduced with control (con) or GLS2-Flag vectors. Data present mean ± SD (n=6). **p<0.001; Student’s t-test. (C, D) Knockdown of GLS2 by shRNA vectors promoted the migration (C) and invasion (D) of different HCC cells. Upper panels: representative images of migrating (C) and invading (D) Huh-1 cells with or without GLS2 knockdown. Scale bars, 200 μm. Data present mean ± SD (n=6). **p<0.001; Student’s t-test. (E) Ectopic GLS1 expression promoted the migration (left) and invasion (right) of Huh-1 and HepG2 cells as determined by trans-well assays. (F) Knockdown of GLS1 decreased the migration (left) and invasion (right) of Huh-1 and HepG2 cells. In E, F, data are presented as mean ± SD (n=6). **p<0.001; Student’s t-test. (G, H) Ectopic expression of DN Rac1-T17N largely abolished the promoting effects of GLS2 knockdown on migration (G) and invasion (H) of different HCC cells as measured by trans-well assays. Cells with knockdown of GLS2 by shRNA vectors were transduced with Rac1-T17N expression vectors for trans-well assays. Data present mean ± SD (n=6). **p<0.001; Student’s t-test. (I, J) Ectopic expression of the C-terminus of GLS2, GLS2-C139, inhibited migration (I) and invasion (J) of Huh-1 and HepG2 cells as measured by trans-well assays. Cells were transduced with different GLS2 expression vectors described in Figure 1E for assays. Upper panels in I: representative images of migrating Huh-1 cells. Data present mean ± SD (n=6). **p<0.001; Student’s t-test. GLS, glutaminase; HCC, hepatocellular carcinoma; shRNA, short hairpin RNA; WT, wild type.
Figure 4—figure supplement 1
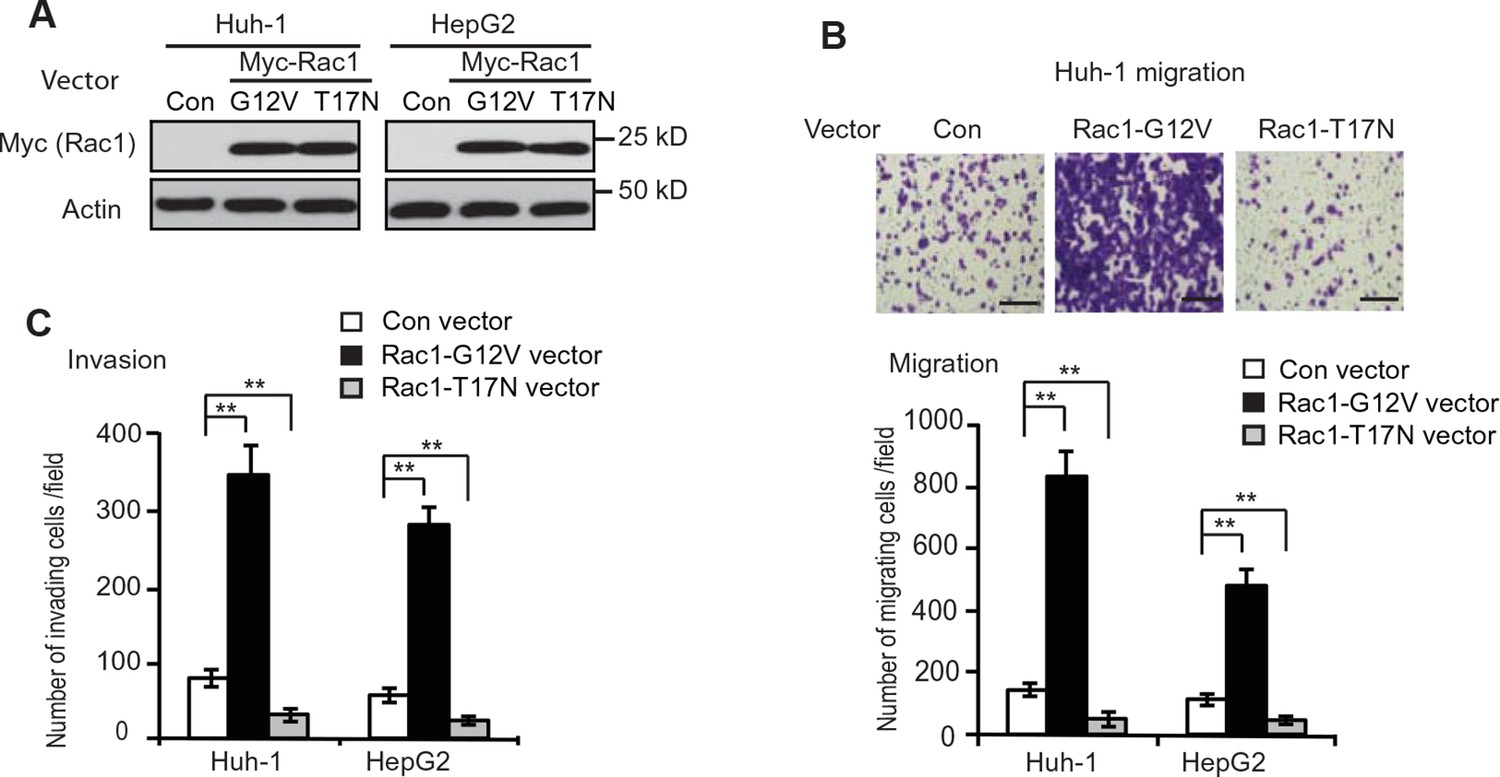
Rac1 promotes the migration and invasion of Huh-1 and HepG2 cells.
(A) Ectopic expression of CA Myc-Rac1-G12V and DN Myc-Rac1-T17N in Huh-1 and HepG2 cells detected by western-blot assays. Cells were transduced with Myc-Rac1-G12V and Myc-Rac1-T17N vectors for assays. (B) Ectopic expression of CA Myc-Rac1-G12V promoted the migration of Huh-1 and HepG2 cells, whereas ectopic expression of DN Myc-Rac1-T17N inhibited the migration of Huh-1 and HepG2 cells. Upper panels: representative images of migrating Huh-1 cells. Scale bars: 200 μm. Lower panel: quantification of average number of migrating cells/field. Data are presented as mean ± SD (n=6). **p<0.001; Student’s t-test. (C) Ectopic expression of CA Myc-Rac1-G12V promoted the invasion of Huh-1 and HepG2 cells, whereas ectopic expression of DN Myc-Rac1-T17N inhibited the invasion of Huh-1 and HepG2 cells. Data are presented as mean ± SD (n=6). **p<0.001; Student’s t-test.
Figure 4—figure supplement 2
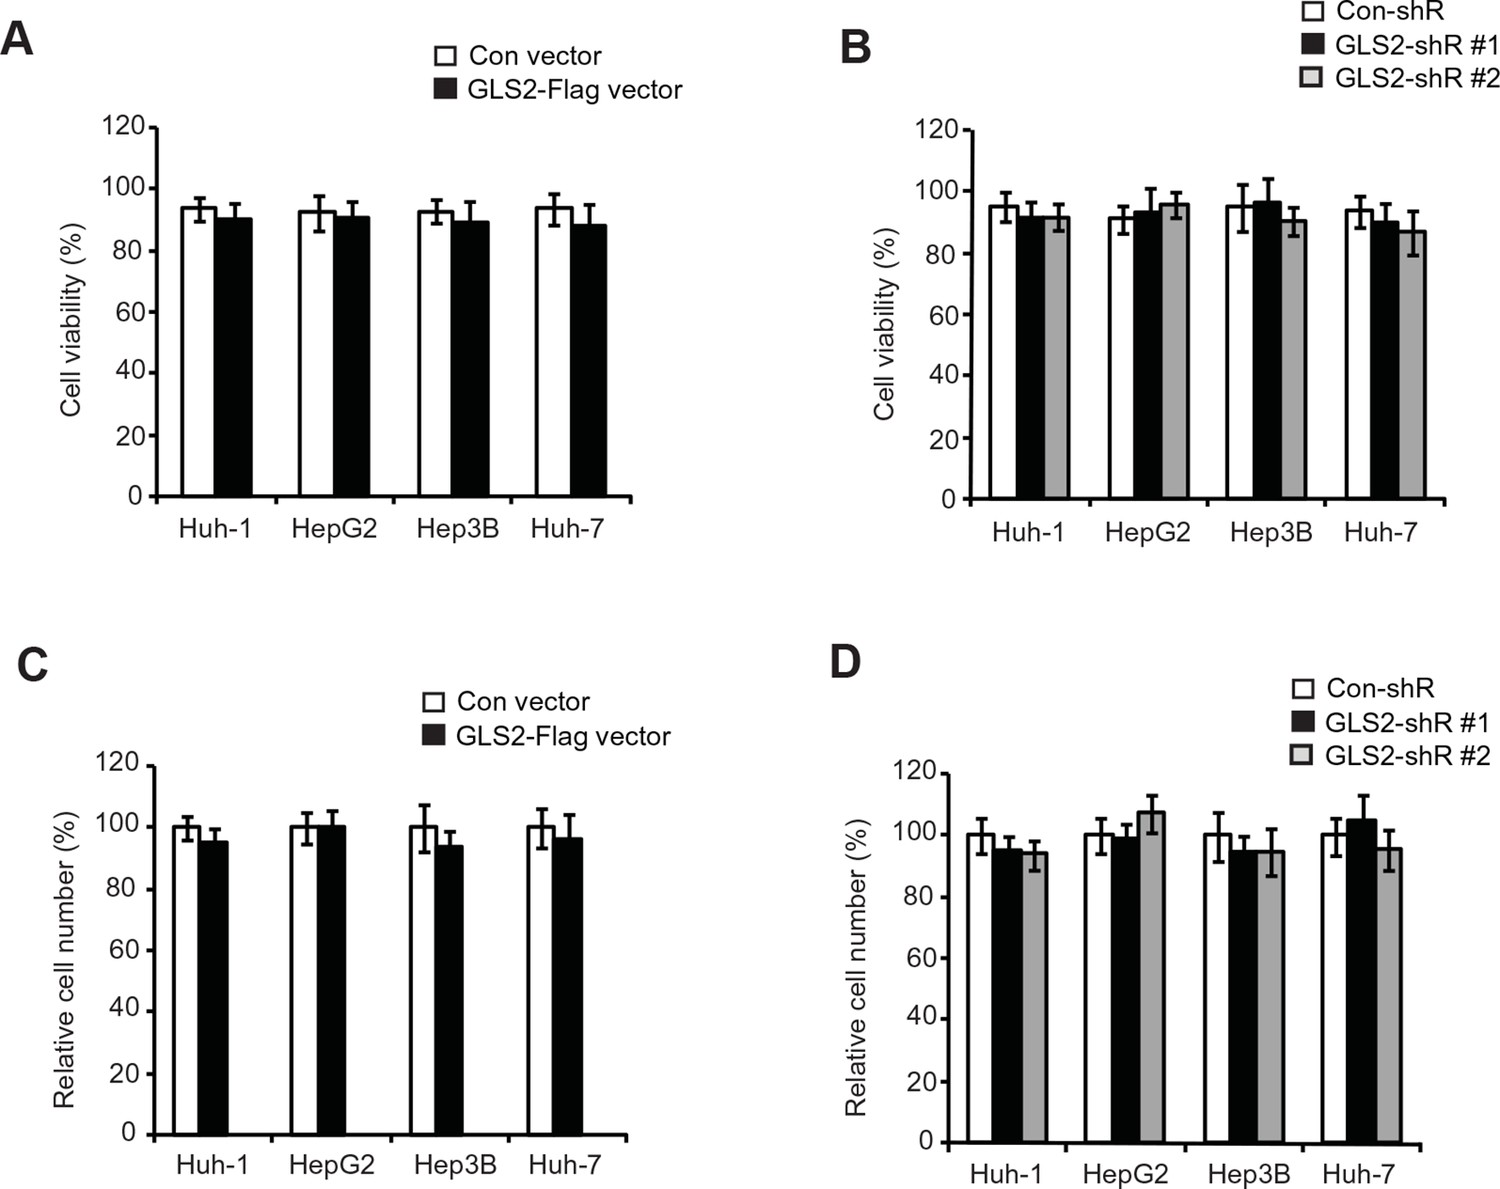
The viability and number of HCC cells with GLS2 overexpression or knockdown after being cultured in serum-free medium for 36 hr.
(A, B) The viability of HCC cells with GLS2 overexpression (A) or knockdown (B) cultured in serum-free medium for 36 hr. (C, D) The relative number of HCC cells with GLS2 overexpression (C) or knockdown (D) cultured in serum-free medium for 36 hr. Same number of cells with GLS2 overexpression or knockdown and their control cells were cultured in serum-free medium for 36 hr before the the viability and number of cells was measured in a Vi-CELL Cell Viability Analyzer (Beckman Coulter, Indianapolis, IN). The viability of cells was analyzed by the trypan blue cell exclusion method. GLS, glutaminase; HCC, hepatocellular carcinoma
Figure 4—figure supplement 3
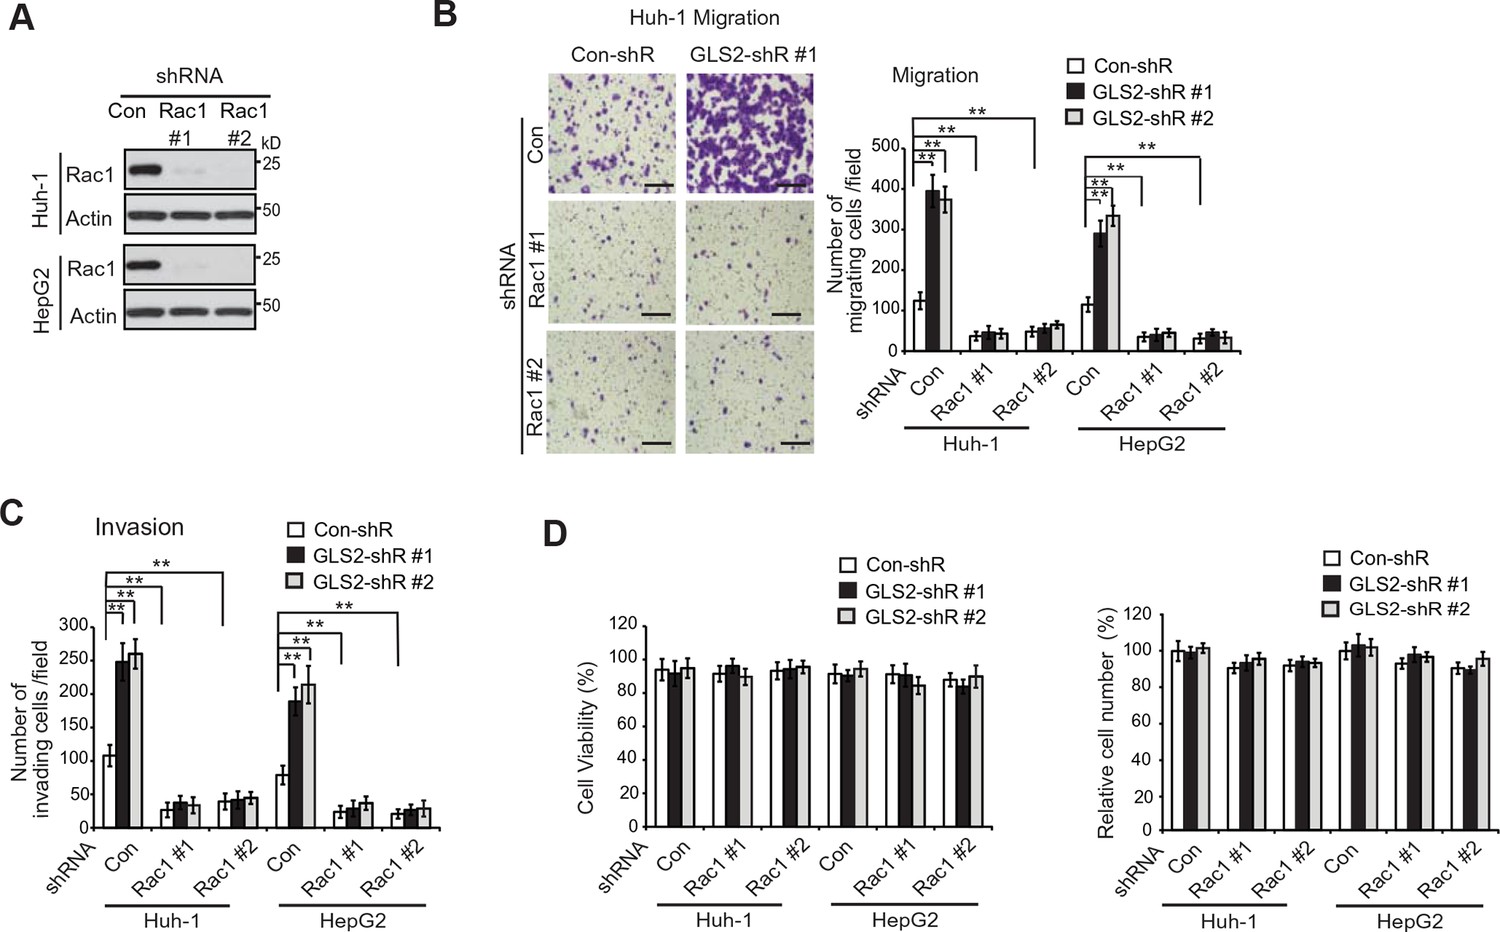
Knockdown of endogenous Rac1 largely abolishes the effect of GLS2 on migration and invasion of HCC cells.
(A) The knockdown of Rac1 by 2 different shRNA vectors in Huh-1 and HepG2 cells measured by western blot assays. (B) Knockdown of endogenous Rac1 largely abolished the promoting effects of GLS2 knockdown on migration of Huh-1 and HepG2 cells as measured by trans-well assays. The endogenous Rac1 was knocked down by shRNA vectors in Huh-1 and HepG2 cells with GLS2 knockdown. Left panels: representative images of migrating Huh-1 cells. Scale bars, 200 μm. Right panels: quantification of number of migrating cells/field. Data are presented as mean ± SD (n=6). **p<0.001; Student’s t-test. (C) Knockdown of endogenous Rac1 largely abolished the promoting effects of GLS2 knockdown on invasion of Huh-1 and HepG2 cells as measured by trans-well assays. Data are presented as mean ± SD (n=4). **p<0.001; Student’s t-test. (D) The viability (left panel) and number (right panel) of HCC cells with GLS2 and/or Rac1 knockdown cultured in serum-free medium for 36 hr. Same number of cells were cultured in serum-free medium for 36 hr before the the viability and number of cells was measured in a Vi-CELL Cell Viability Analyzer (Beckman Coulter). The viability of cells was analyzed by the trypan blue cell exclusion method. GLS, glutaminase; HCC, hepatocellular carcinoma; shRNA, short hairpin RNA.
Figure 5
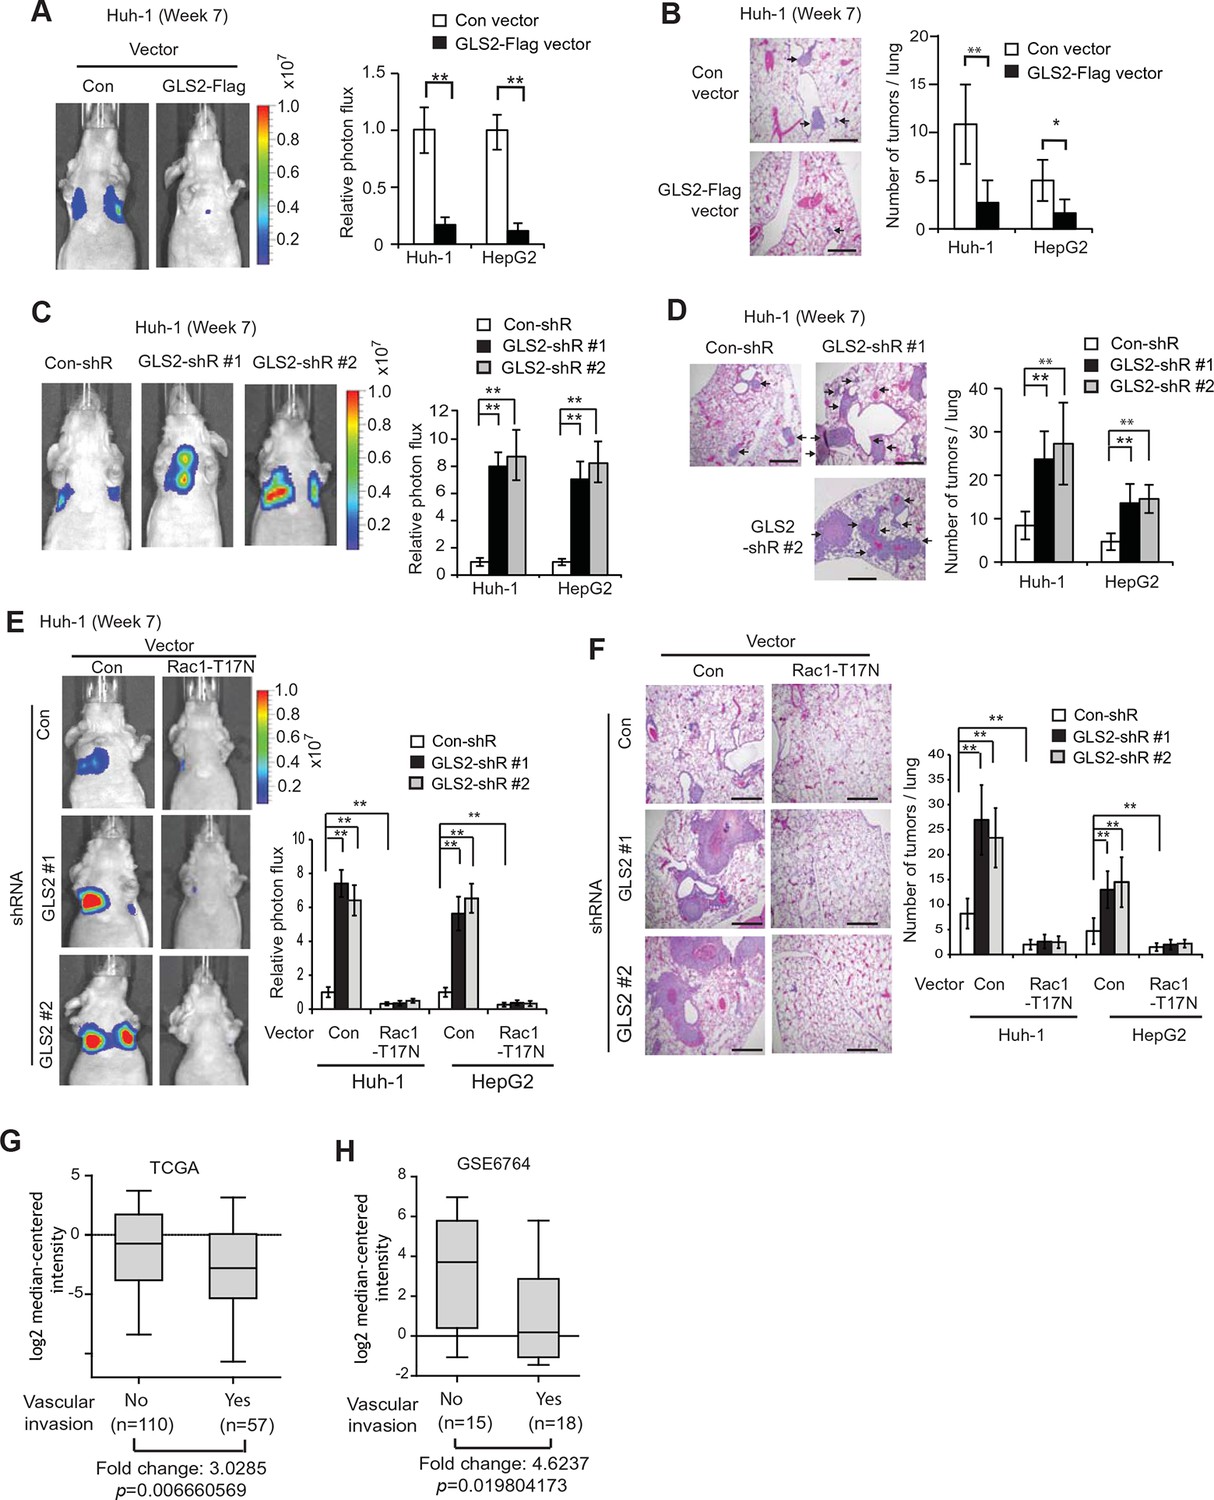
GLS2 inhibits lung metastasis of HCC cells in mice, and GLS2 expression is associated with metastasis in human HCC.
(A, B) Ectopic expression of GLS2 inhibited lung metastasis of Huh-1 and HepG2 cells in nude mice. Huh-1 and HepG2 cells with GLS2 ectopic expression were transduced with lentiviral vectors expressing luciferase for lung metastasis assays. The lung metastasis was analyzed by in vivo bioluminescence imaging (A) and histological analysis (B) at 7 weeks after inoculation of cells. Left panels in A: representative images of lung metastasis of Huh-1 cells analyzed by in vivo imaging. Right panels in A: quantification of lung photon flux (photons per second). Left panels in B: representative images of hematoxylin and eosin staining of lung metastasis of Huh-1 cells. Right panels in B: The average number of tumors/lung. (C, D) Knockdown of endogenous GLS2 by shRNA promoted lung metastasis of Huh-1 and HepG2 cells in nude mice. (E, F) Ectopic expression of DN Rac1-T17N largely abolished the promoting effects of GLS2 knockdown on lung metastasis of HCC cells in vivo. Huh-1 and HepG2 cells with stable ectopic Rac1-T17N expression and GLS2 knockdown were used for lung metastasis assays in mice. In A-F, data represent mean ± SD (n=8 mice/group). *p<0.01; **p<0.001; Student’s t-test. Scale bars, 200 μm. Arrows indicate metastatic tumors. (G, H) GLS2 expression is significantly decreased in human HCCs with metastasis compared with HCCs without metastasis. GLS2 mRNA expression in non-metastatic (without vascular invasion) and metastatic (with vascular invasion) HCCs was obtained from the TCGA (G) and GSE6764 (H). p=0.0066 in G; p=0.0198 in H; Student’s t-test. GLS, glutaminase
Figure 6 with 1 supplement
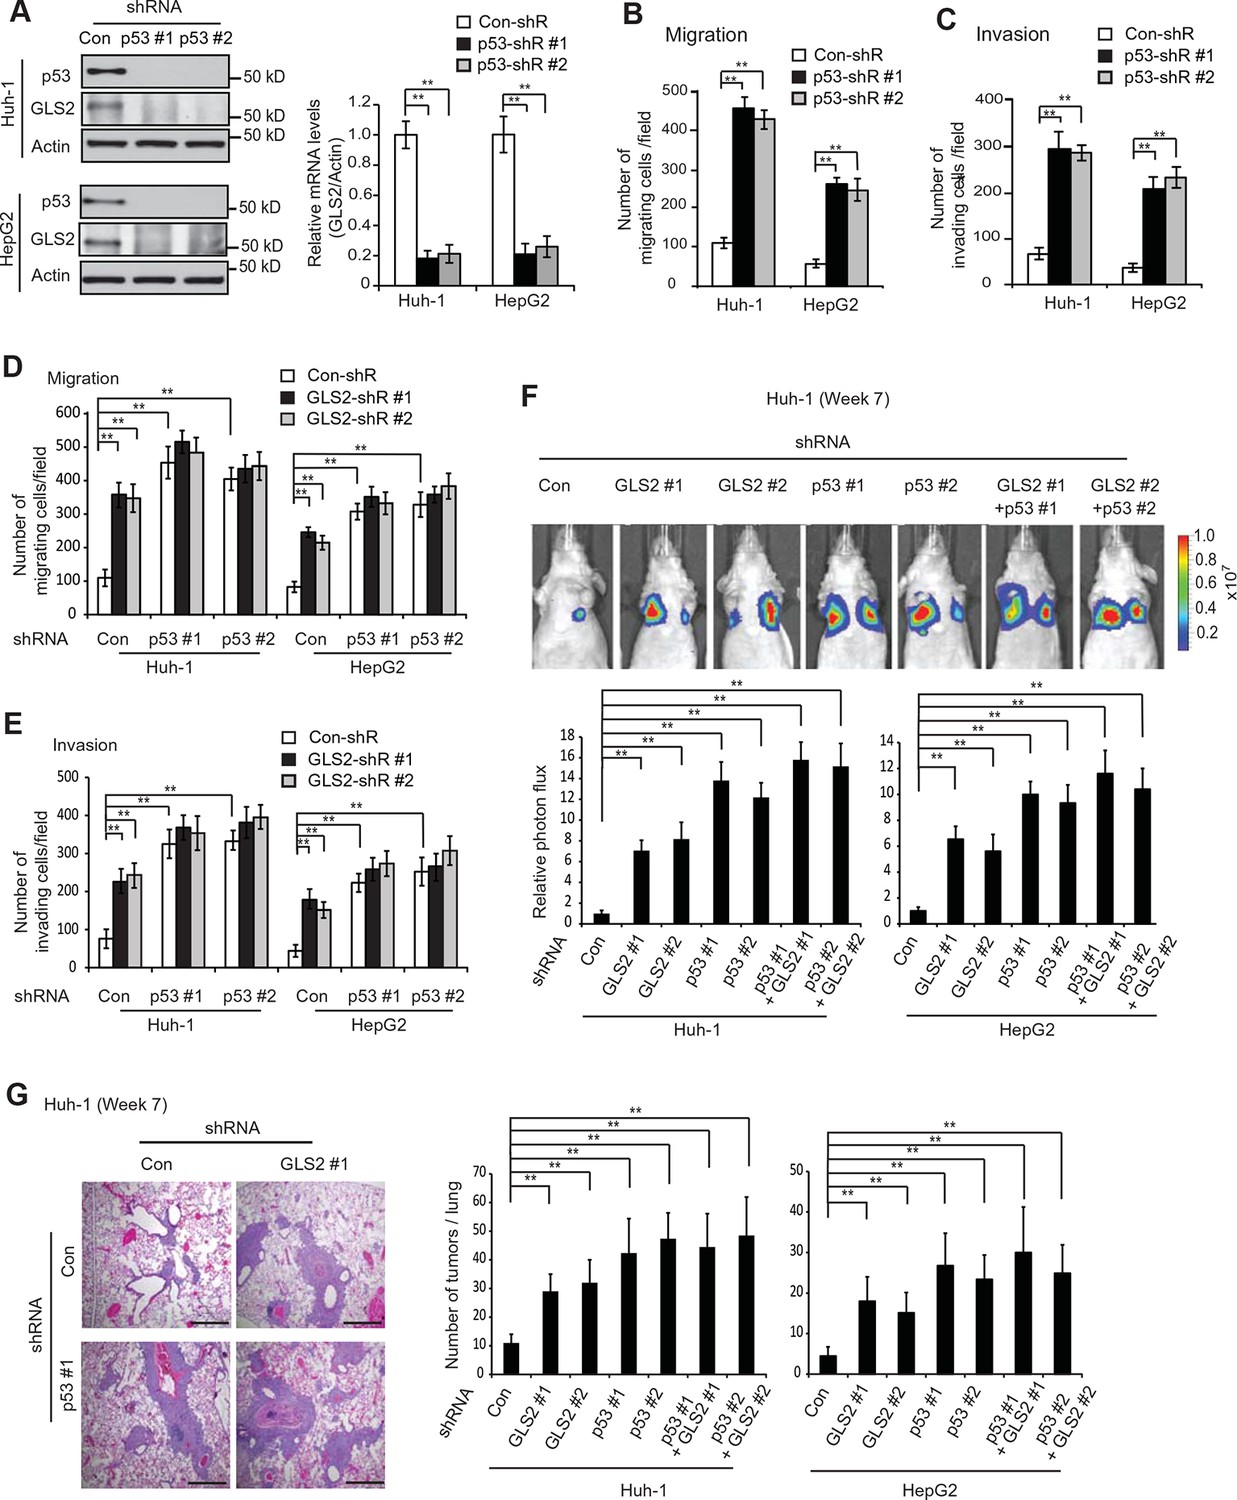
GLS2 mediates p53’s function in inhibiting migration, invasion and lung metastasis of HCC cells.
(A) Knockdown of endogenous WT p53 reduced GLS2 expression in Huh-1 and HepG2 cells as measured by western-blot (left) and Taqman real-time polymerase chain reaction assays (right), respectively. (B, C) Knockdown of p53 promoted the migration (B) and invasion (C) of Huh-1 and HepG2 cells measured by trans-well assays. (D, E) Simultaneous knockdown of GLS2 and p53 by shRNA vectors in Huh-1 and HepG2 cells did not display an addictive promoting effect on the migration (D) and invasion (E) of cells. In A–E, data represent mean ± SD (n=6). **p<0.001; Student’s t-test. (F, G) Simultaneous knockdown of GLS2 and p53 in Huh-1 and HepG2 cells did not display an addictive promoting effect on lung metastasis in vivo. Huh-1 and HepG2 cells with individual knockdown of GLS2 or p53, or simultaneous knockdown of GLS2 and p53 were used for assays. In F, lung metastasis was analyzed by in vivo bioluminescence imaging at 7 weeks after inoculation of cells. Upper panels: representative images of lung metastasis of Huh-1 cells analyzed by in vivo imaging. Lower panels: quantification of lung photon flux. In G, lung metastasis was analyzed by histological analysis at week 7. Left panels: hematoxylin and eosin staining of lung metastasis of Huh-1 cells. Scale bars: 200 μm. Right panels: The average number of tumors/lung. Data represent mean ± SD (n=10 mice/group). **p<0.001; Student’s t-test. GLS, glutaminase; HCC, hepatocellular carcinoma; shRNA, short hairpin RNA.
Figure 6—figure supplement 1
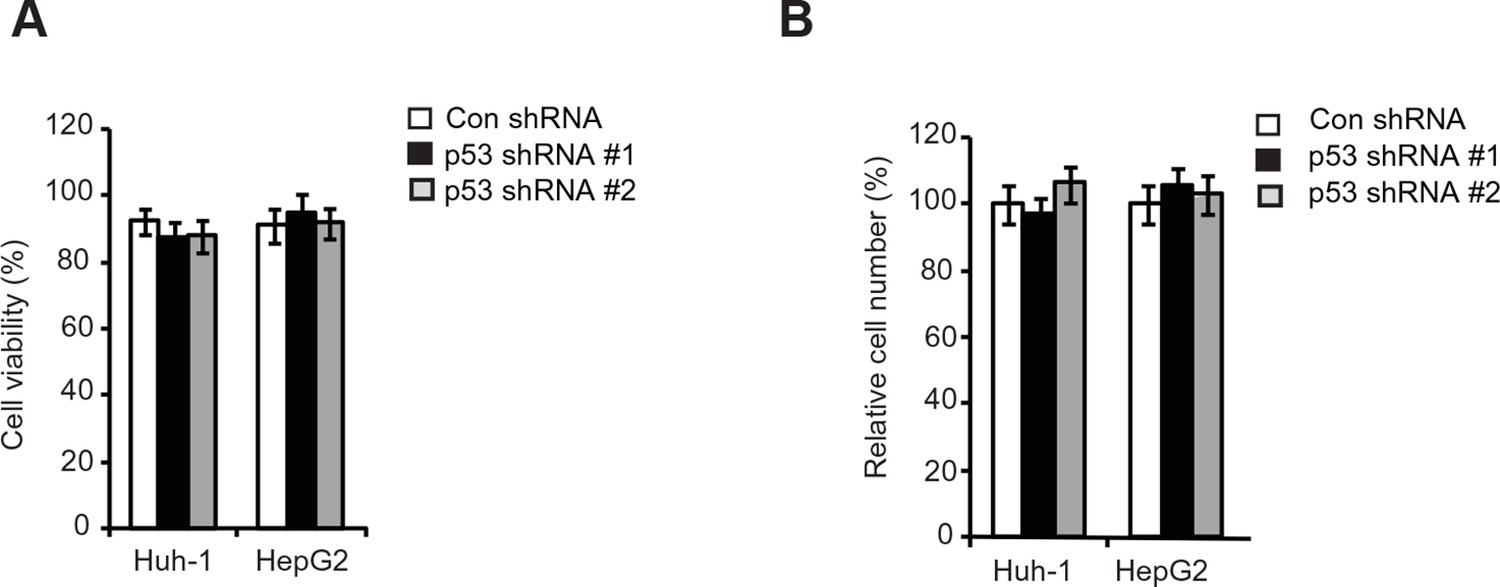
The viability and number of HCC cells with p53 knockdown cultured in serum-free medium for 36 hr.
(A, B) The viability (A) and relative number (B) of HCC cells with p53 knockdown by shRNA vectors cultured in serum-free medium for 36 hr. Same number of cells with or without p53 knockdown were cultured in serum-free medium for 36 hr before the the viability and number of cells was measured in a Vi-CELL Cell Viability Analyzer (Beckman Coulter). The viability of cells was analyzed by the trypan blue cell exclusion method. HCC, hepatocellular carcinoma; shRNA, short hairpin RNA;
Figure 7 with 1 supplement
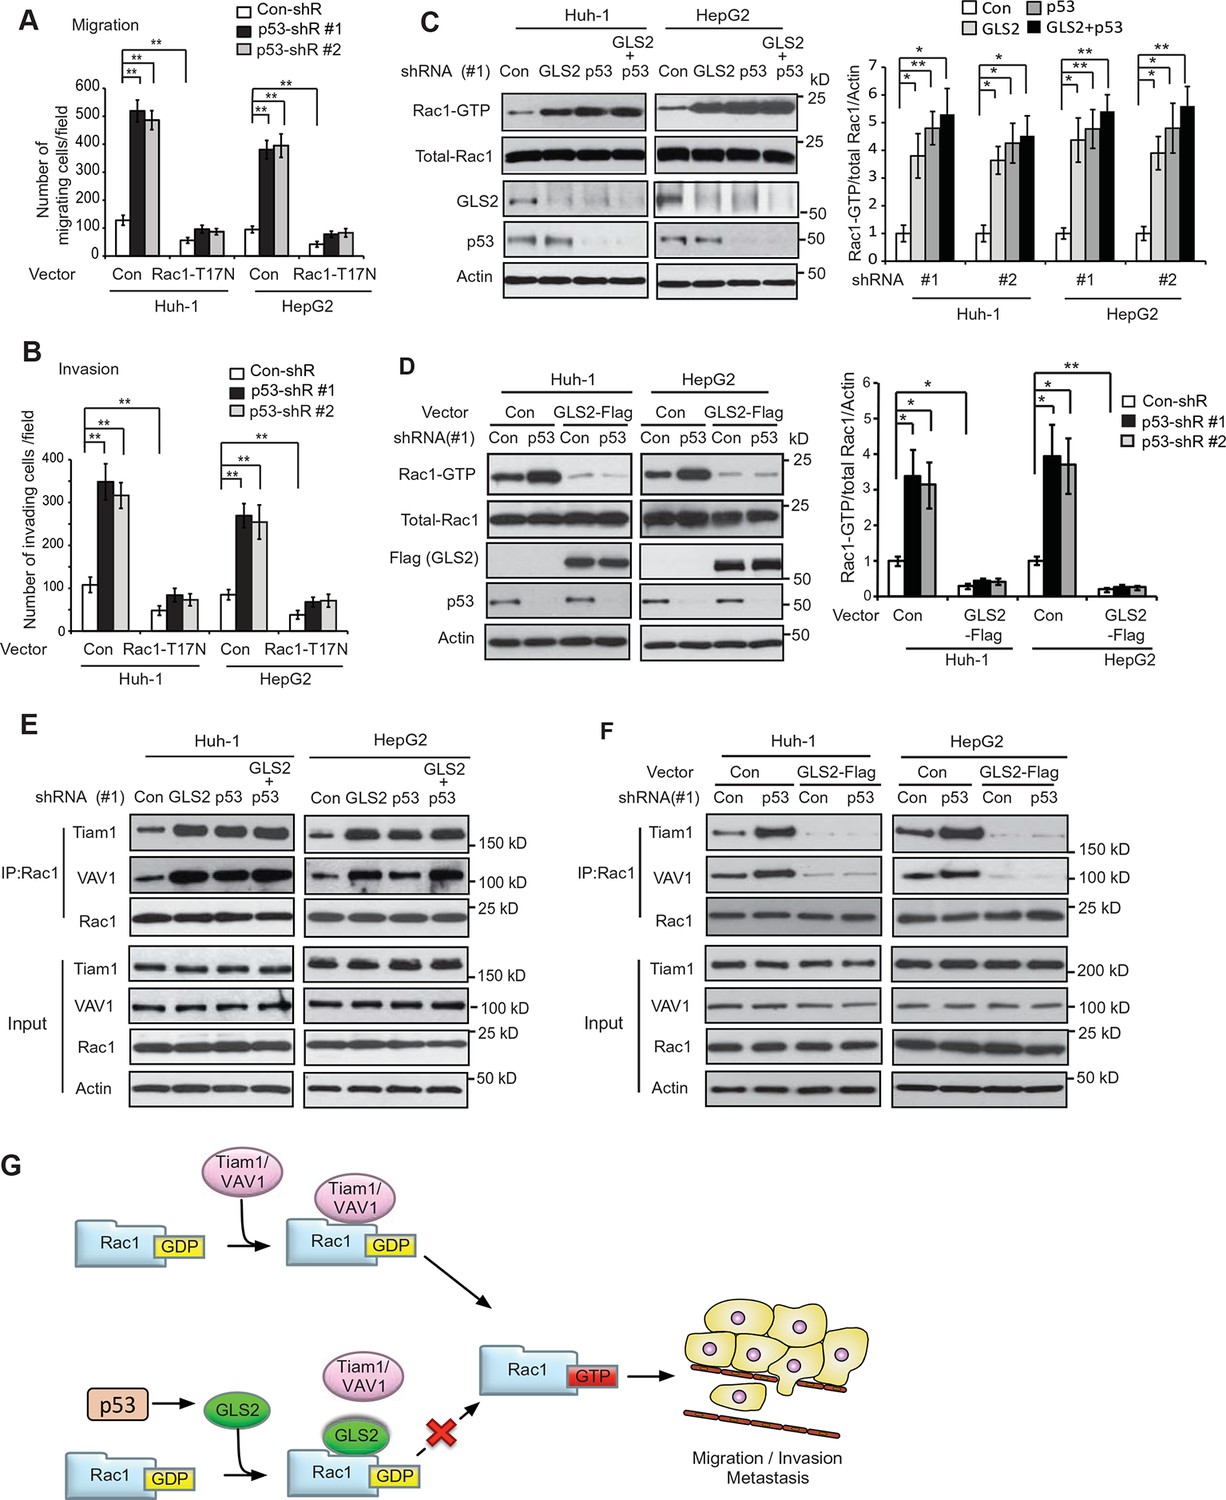
GLS2 mediates p53’s function in negative regulation of the Rac1 activity.
(A, B) Ectopic expression of DN Rac1-T17N greatly abolished the promoting effects of p53 knockdown on migration (A) and invasion (B) of Huh-1 or HepG2 cells as measured by trans-well assays. Data represent mean ± SD (n=6 in A, B). **p<0.001; Student’s t-test. (C, D) GLS2 mediates p53’s function in negative regulation of Rac1 activity in Huh-1 and HepG2 cells. In C, knockdown of p53 in cells with GLS2 knockdown did not further promote Rac1 activity. In D, GLS2 overexpression largely abolished the promoting effect of p53 knockdown on the Rac1 activity. Left panels: represented results of Rac1 activity analysis in cells transduced with #1 shRNA vectors. Right panel: relative Rac1-GTP/total Rac1/Actin levels in cells transduced with two different shRNA vectors (#1 and #2). Data represent mean ± SD (n=3). *p<0.01; **p<0.001; Student’s t-test. (E, F) p53 inhibits the interaction of Rac1 with Tiam1 and VAV1 through GLS2 in Huh-1 and HepG2 cells. In E, knockdown of p53 in cells with GLS2 knockdown did not further promote the interaction of Tiam1 and VAV1 with Rac1. The knockdown of p53 and GLS2 was shown in Figure 7C. Two shRNA vectors against p53 and GLS2, respectively, were used, and very similar results were observed. In F, GLS2 overexpression largely abolished the promoting effect of p53 knockdown on the interaction of Tiam1 and VAV1 with Rac1. (G) Proposed model for the negative regulation of Rac1 activity and cancer metastasis by GLS2 and p53. GDP, guanosine 5′-diphosphate; GLS, glutaminase; GTP, guanosine 5'-triphosphate; shRNA, short hairpin RNA.
Figure 7—figure supplement 1
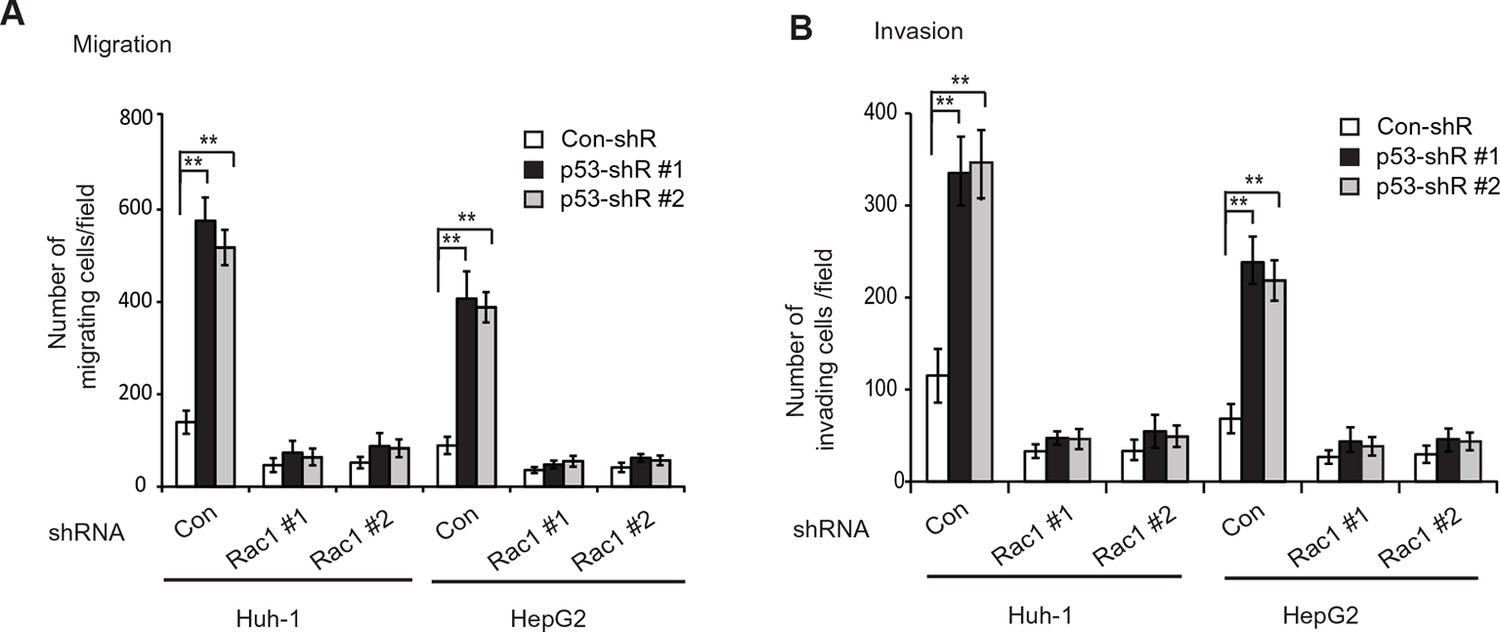
Knockdown of endogenous Rac1 greatly abolished the effects of p53 on migration and invasion of HCC cells.
(A, B) Knockdown of endogenous Rac1 greatly abolished the promoting effects of p53 knockdown on migration (A) and invasion (B) of Huh-1 and HepG2 cells. The endogenous Rac1 was knocked down by two different shRNA vectors in Huh-1 and HepG2 cells with stable p53 knockdown, and the abilities of migration (A) and invasion (B) of these cells were measured by trans-well assays. The knockdown of Rac1 was shown in Figure 4—figure supplement 3A. Data are presented as mean ± SD (n=4). **p<0.001; Student’s t-test. HCC, hepatocellular carcinoma; shRNA, short hairpin RNA.
Download links
A two-part list of links to download the article, or parts of the article, in various formats.
Downloads (link to download the article as PDF)
Open citations (links to open the citations from this article in various online reference manager services)
Cite this article (links to download the citations from this article in formats compatible with various reference manager tools)
Glutaminase 2 is a novel negative regulator of small GTPase Rac1 and mediates p53 function in suppressing metastasis
eLife 5:e10727.
https://doi.org/10.7554/eLife.10727


