Massive cortical reorganization in sighted Braille readers
- Jagiellonian University, Poland
- Institut du Cerveau et de la Moelle épinière (ICM), France
- Nencki Institute of Experimental Biology, Poland
- Academy of Special Education in Warsaw, Poland
- Institute for the Blind and Partially Sighted Children in Krakow, Poland
- University College London, United Kingdom
- The Hebrew University of Jerusalem, Israel
- Sorbonne Universite´s, UPMC Univ Paris 06, Institut de la Vision, France
Figures
Figure 1 with 3 supplements
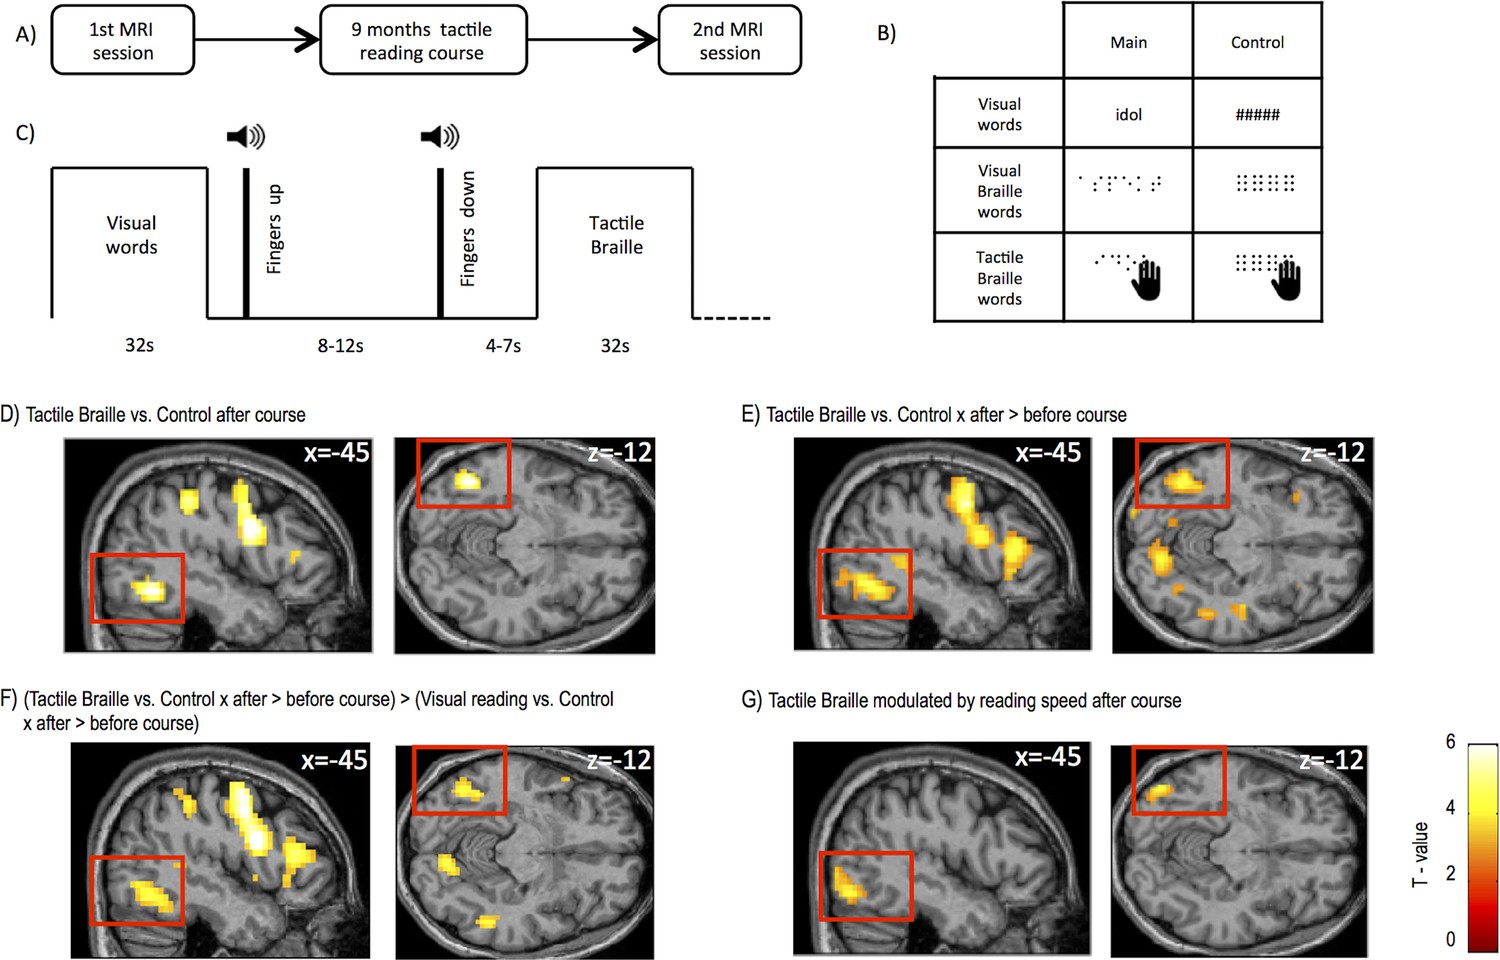
Experimental design and brain regions activated by tactile Braille reading.
(A) The study consisted of two identical MRI sessions performed before and after an intensive 9-month tactile Braille course. In the fMRI experiment (B), subjects viewed visual words written in the regular alphabet and Braille words displayed on a screen (visual Braille) and touched tactile Braille words. As a control, they viewed strings of hash signs and meaningless pseudo-Braille dots and touched meaningless pseudo-Braille dots. The experiment used a block design (C); after each block, the subjects lifted their fingers from the table on which the tactile stimuli were presented. A new board with tactile stimuli was then placed on the table, the subjects put their fingers down, and a new block began. (D) Compared to the tactile control, tactile reading after the course evoked activations in the visual word form area (VWFA), the lateral occipital area and other areas (Tables 1–3). Similar areas were activated when we computed (E) an interaction between tactile Braille/tactile control stimuli and the before- and after-course time points and for (F) an interaction between tactile Braille/tactile control vs. visual reading/visual control stimuli and the before- and after-course time points. The latter confirmed that the increase in visual cortex activation after the course was specific for tactile reading. (G) When we modeled the modulation of fMRI responses to tactile Braille by the subjects’ reading speed, the only significant whole-brain correlate with tactile reading proficiency was found in the ventral visual system (k=103 voxels). Voxel-wise thresholds: (D) p<0.001; (E–G) p<0.005; Cluster-wise thresholds: (D–F) p<0.05; (G) uncorrected, k=100 voxels. For control fMRI experiment, see Figure 1—figure supplement 1 for procedures and Figure 1—figure supplement 2 for results. For supplementary fMRI results, see Figure 1—figure supplement 3.
Figure 1—figure supplement 1
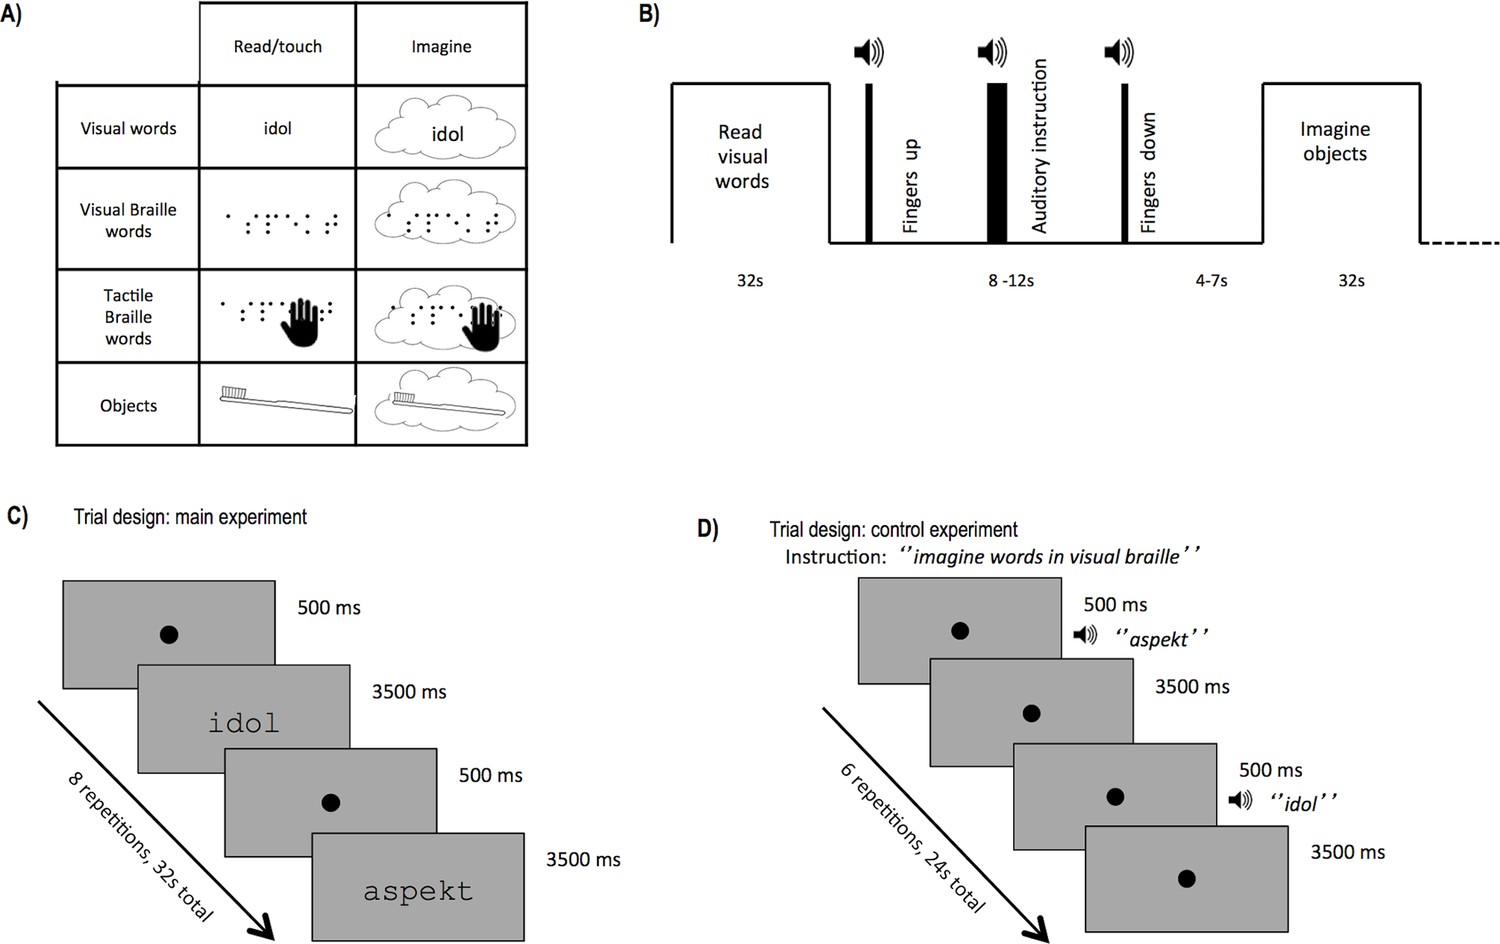
Control experiment stimuli and procedures.
(A) In the control imagery experiment, subjects were asked to read or imagine words in the regular alphabet or in visual and tactile Braille or to touch or imagine everyday objects. (B) Similar to the Main experiment (Figure 1C), stimuli in the control experiment were presented in blocks. In each block, after a sound indicating they should lift their fingers from the fiberglass table, subjects heard an auditory instruction informing them about the next task (read/touch or imagine). After 8–12 s, a sound signaled them to put their fingers down. Subjects began to read/touch/imagine after 4–7 s, when they heard the name of the stimulus to be read/touched or imagined. (C) Blocks in the main experiment consisted of 8 stimuli: words, control stimuli or fixation dots in the case of tactile conditions. Each stimulus was presented for 3500 ms and was followed by a 500 ms fixation dot, which was accompanied with a metronome tick indicating the change of the stimulus for the tactile conditions. (D) Blocks in the control imagery experiment consisted of 6 stimuli. After a 500 ms fixation dot, an auditory recording of the name of the subsequent stimulus was presented, either with (read/touch task) or without the stimulus (imagery task). For object stimuli, the block duration was the same, but only one stimulus was presented per block.
Figure 1—figure supplement 2
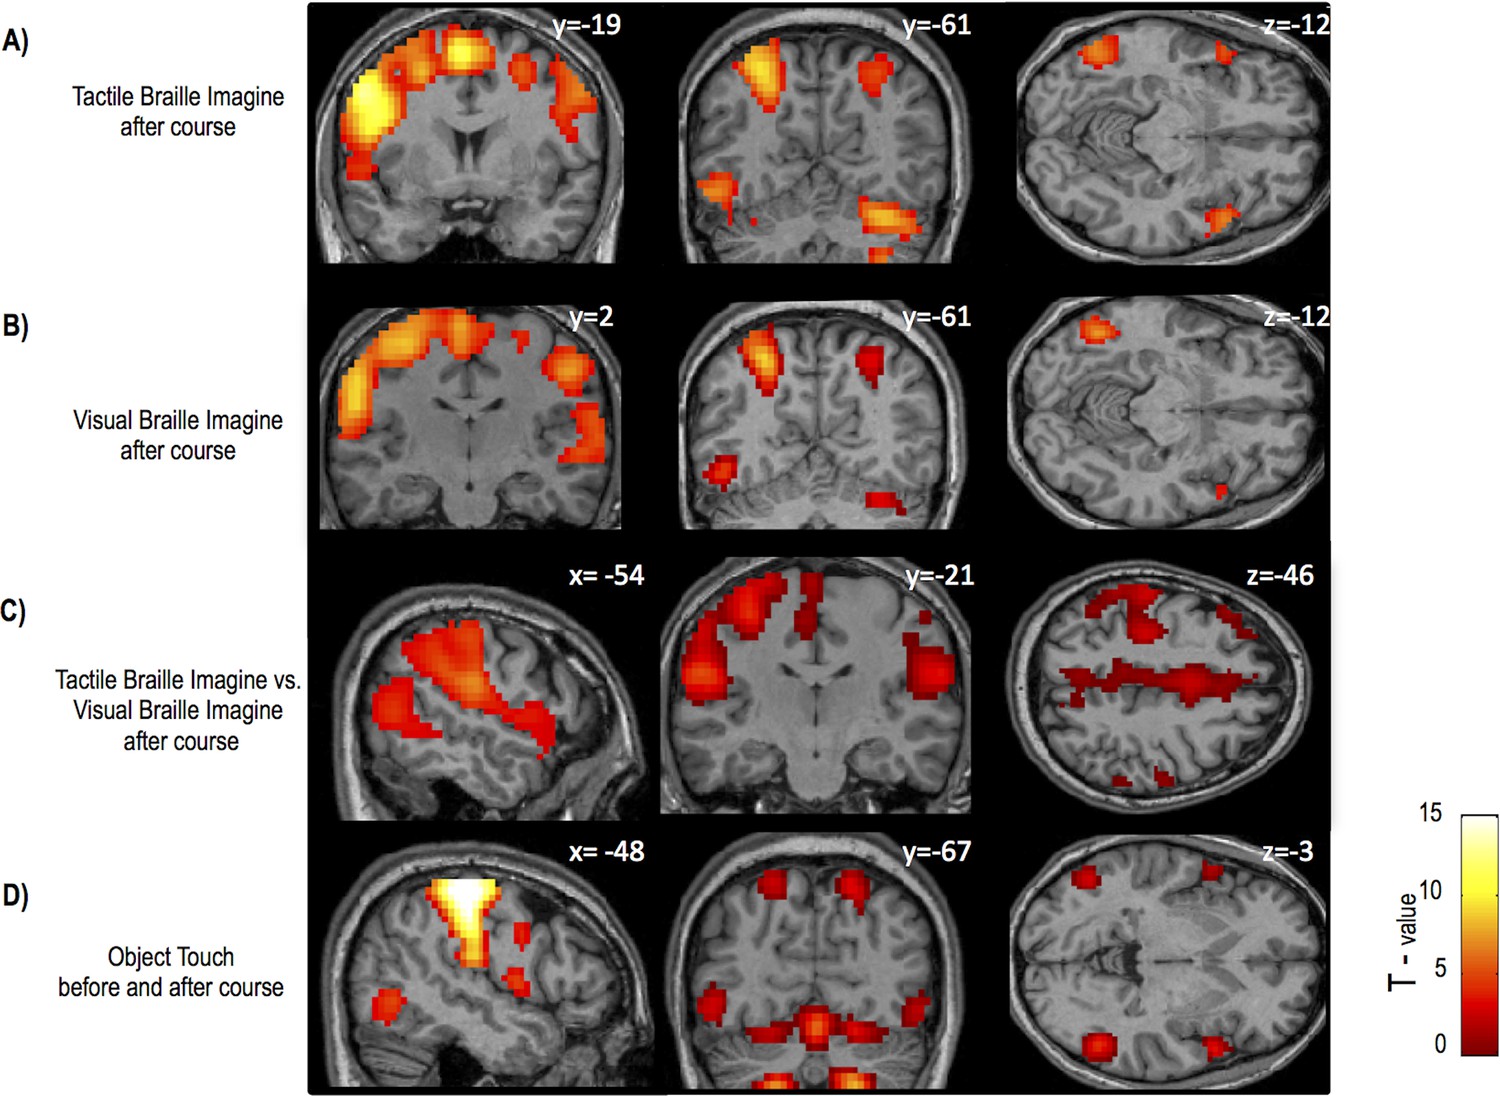
Main results of the control experiment.
(A) Imagining Tactile Braille vs. rest elicited activity in motor/somatosensory areas, the cerebellum and left occipital areas, including the VWFA. Similar results were found for (B) Visual Braille imagery. However, (C) Tactile Braille imagery more strongly activated the somatosensory and motor areas and mesial frontal regions. (D) In addition to the parietal and sensory-motor activations, touching objects vs. rest resulted in activity in lateral occipital areas bilaterally. Thresholds: A,B p = 0.001 voxel-wise, p=0.05 cluster-wise; C, D p=0.005 voxel-wise, p=0.05 cluster wise.
Figure 1—figure supplement 3
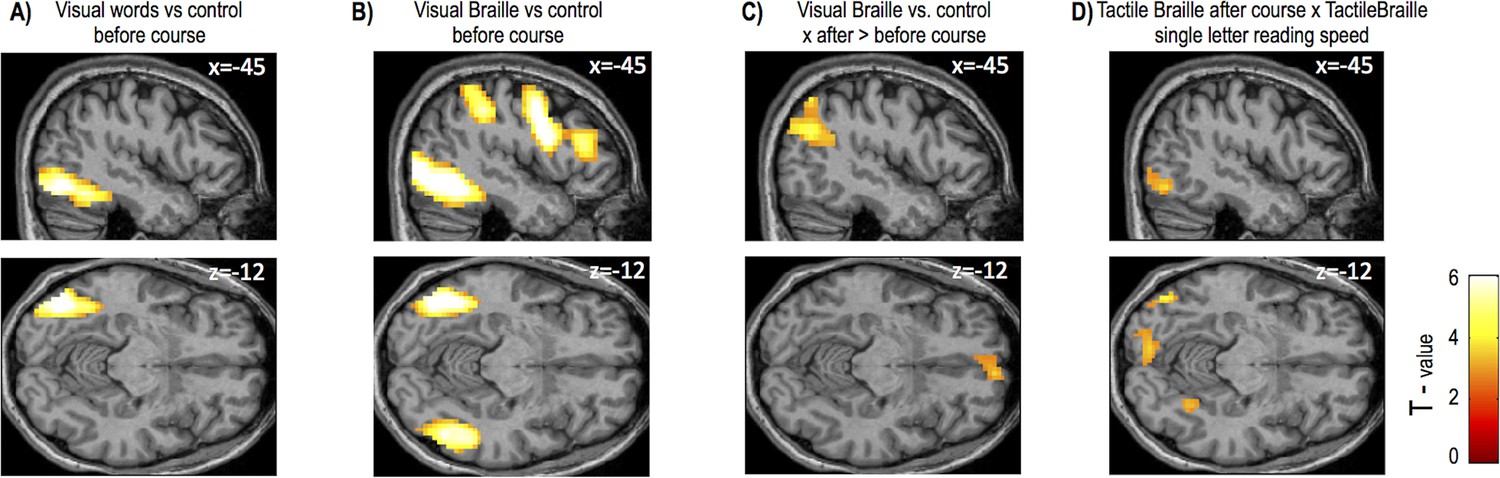
Supplementary fMRI results
(A) Visual word reading contrasted with the control task before the course activated left ventral occipital areas, including the VWFA and the middle occipital gyrus. (B) Visual Braille reading vs. control before the course elicited robust activation in occipital areas predominantly on the left side, including the VWFA and the inferior and middle occipital gyrus. Other activations included the left inferior and middle frontal gyri, the precuneus, the middle temporal gyrus and the left STS. (C) For visual Braille reading, the only increases in activation observed after the course were in the default mode network (mesial frontal cortex and bilateral temporal and parietal regions). (D) Similar to Braille word reading speed (Figure 1G), single-letter recognition speed modulated the activity for tactile Braille reading in the left occipital areas, including V1 and the fusiform gyrus (VWFA). Thresholds: A-C p=0.005 voxel-wise, p=0.05 cluster-wise; D p = 0.005 voxel-wise, uncorrected for cluster size.
Figure 2
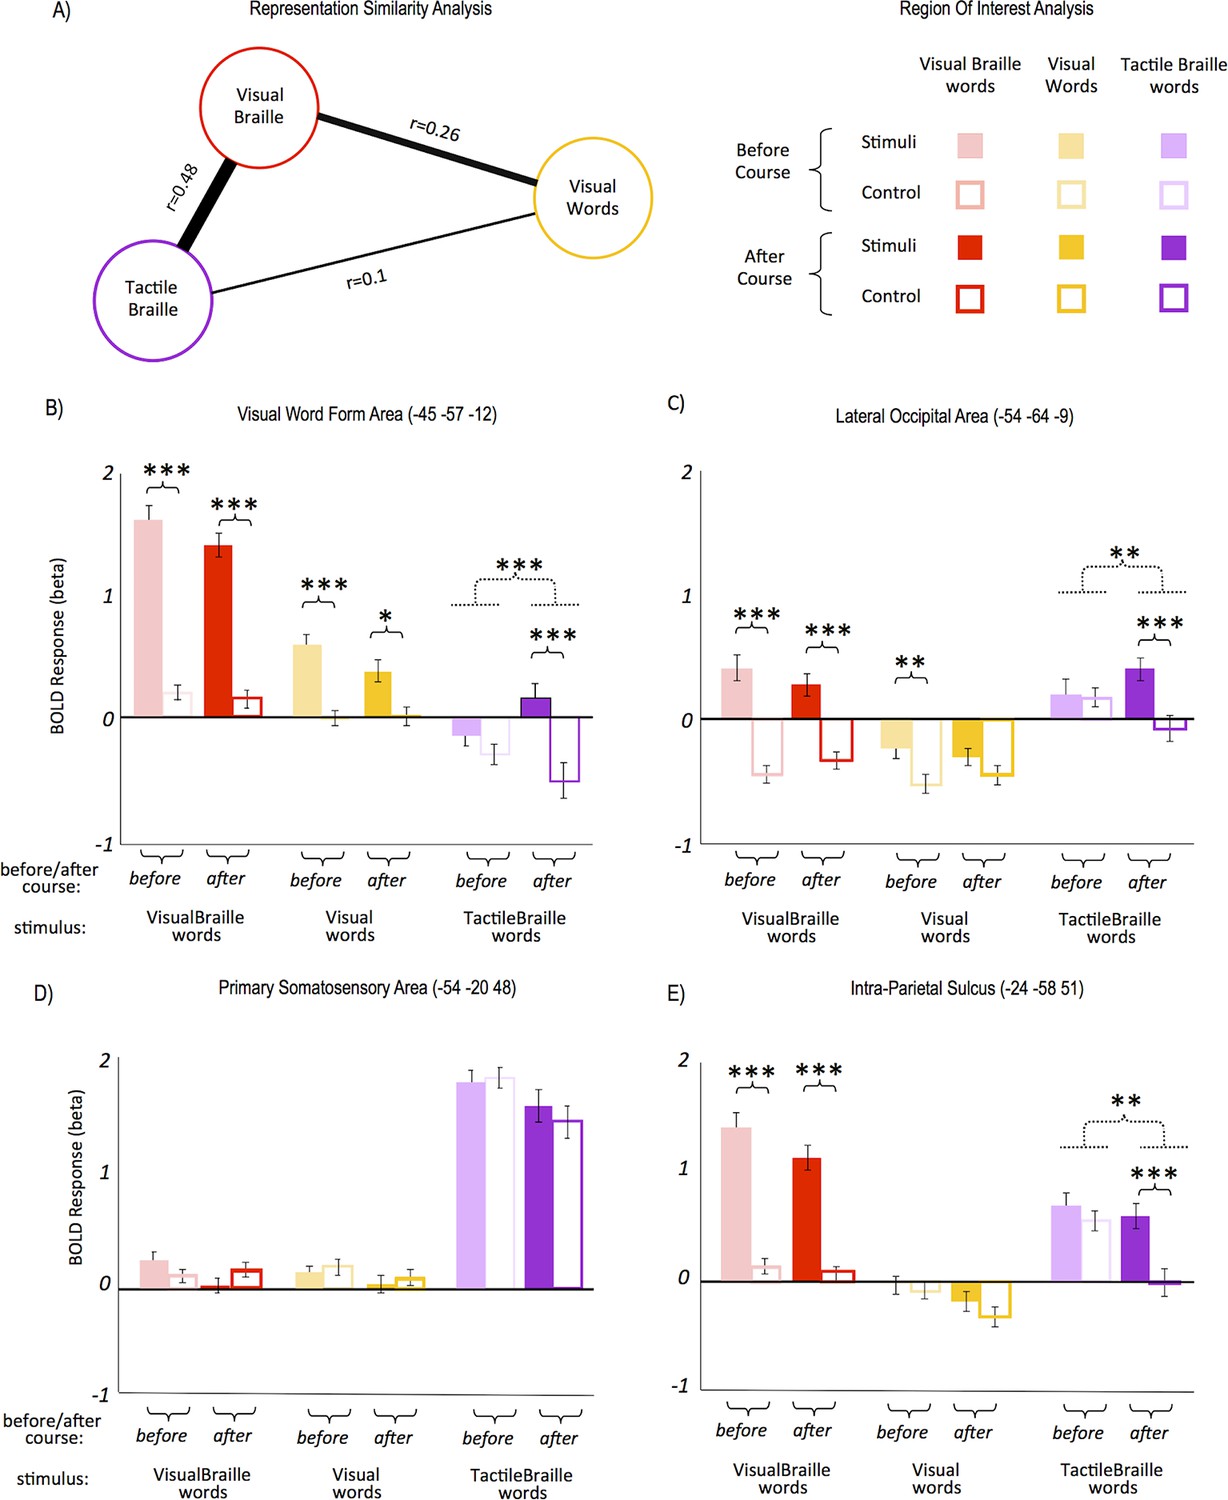
Response similarity and region-of-interest (ROI) analyses.
Response similarity analysis showed that (A) the activity patterns for both Braille alphabets were the most similar, whereas the patterns for tactile Braille and visual words differed the most. In the VWFA (B), the response to tactile Braille words changed from a de-activation to a positive activation. The VWFA also showed strong responses to visual Braille words; these, however, did not change significantly following the Braille course. The lateral occipital area (C) also saw the emergence of responses to tactile Braille words similar to the VWFA. In contrast, there was no effect of the Braille course in the somatosensory cortex (D). A drop in activation for the control condition was salient in the intraparietal sulcus (F), in which the activation to tactile Braille words remained unchanged, whereas the activation to the tactile control dropped to zero. Arrow thickness and the distance between scripts in (A) are proportional to correlation strength. (***) p<0.001; (**) p<0.01; (*) p<0.05. Dashed lines denote interactions. All ROIs are in the left hemisphere.
Figure 3
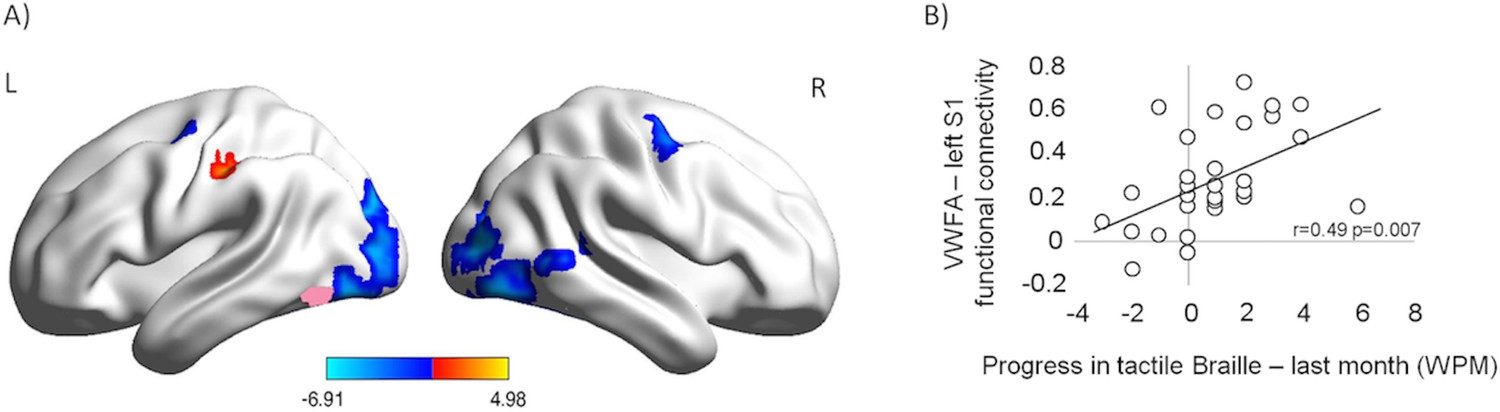
Following the tactile Braille course, the VWFA increased its resting-state connectivity with the somatosensory cortex while decreasing its coupling with other visual areas and the motor cortex.
The connectivity between the VWFA and the somatosensory cortex was behaviorally relevant for tactile Braille reading. (A) Functional connectivity of the VWFA after the tactile Braille course relative to the before-course scan. Red represents increased correlation, and blue represents decreased correlation. The VWFA seed is marked in pink. Thresholds: p = 0.001 voxel-wise, p = 0.05 cluster-wise. (B) Correlation between after-course VWFA – left S1 functional connectivity and progress in tactile Braille reading speed in the last month of the course.
Figure 4

TMS applied to the Visual Word Form Area selectively decreased the accuracy of Braille word reading.
(A) Illustration of the experimental design. Subjects read tactile Braille words or pseudowords and performed a lexical decision task based on them. In half of the trials, repetitive TMS was applied. The VWFA and two control sites (lateral occipital area and vertex) were tested in separate runs. (B) Mean accuracy of reading Braille words and pseudowords is shown for the VWFA and for both control sites, for the TMS and no TMS conditions separately. (*) p=0.016.
Author response image 1
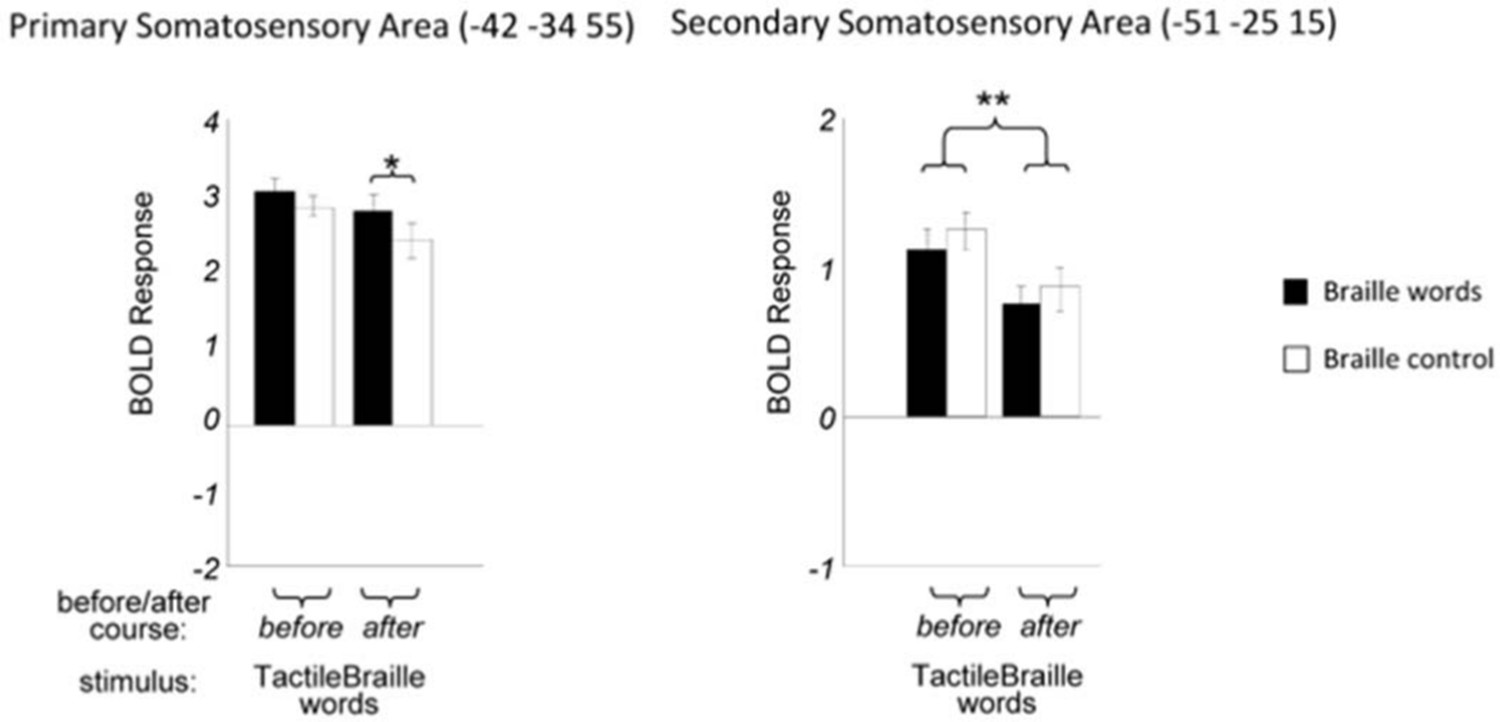
SI and SII activity for tactile stimuli before and after the course.
https://doi.org/10.7554/eLife.10762.014
Author response image 2
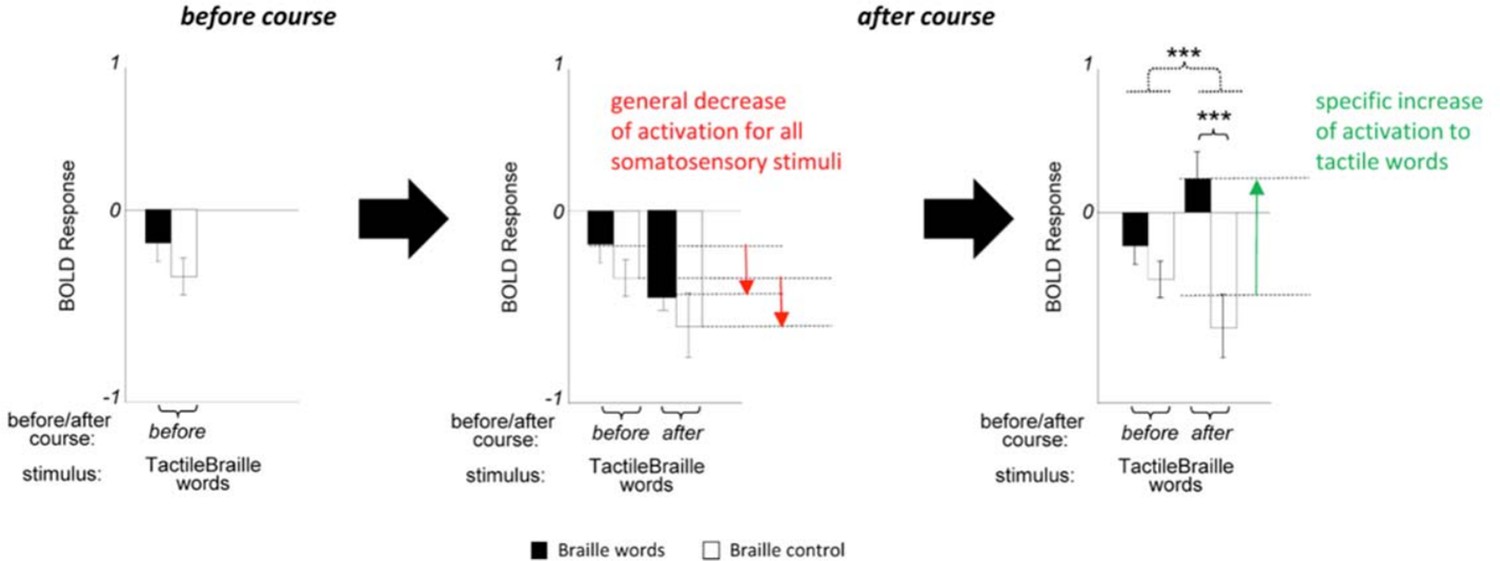
Possible contributions to the decrease of activity for tactile stimuli.
Two contributions to interaction for tactile stimuli (example for Visual Word Form Area, based on Figure 2).
Author response image 3
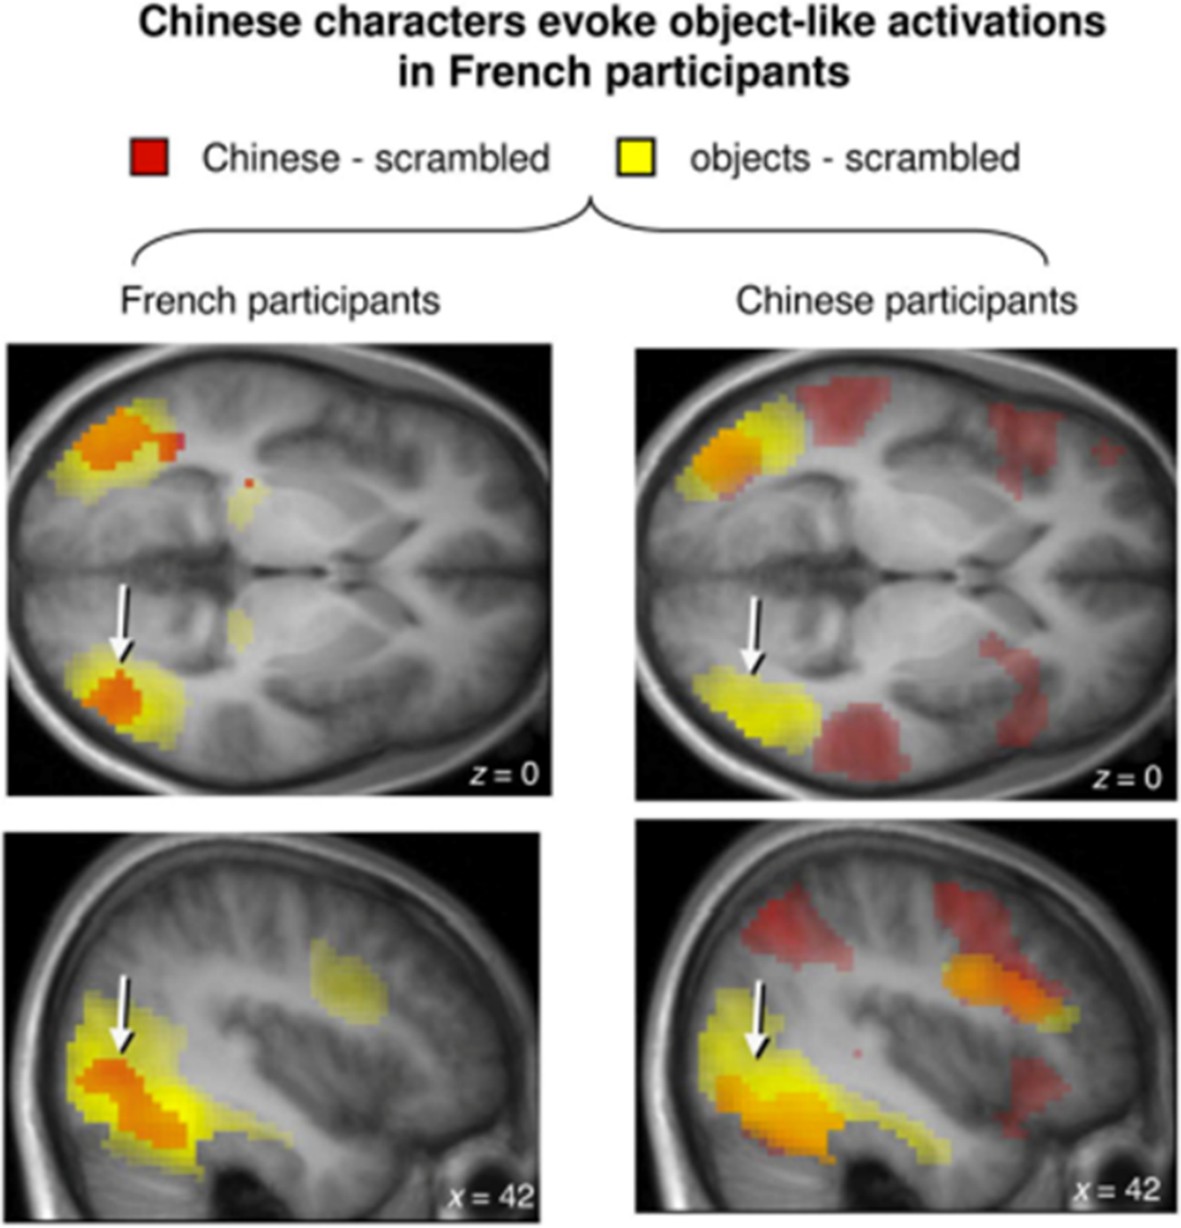
LOA activates when French, Chinese-naive native speakers see Chinese characters.
Source Szwed et al., 2014.
Author response image 4
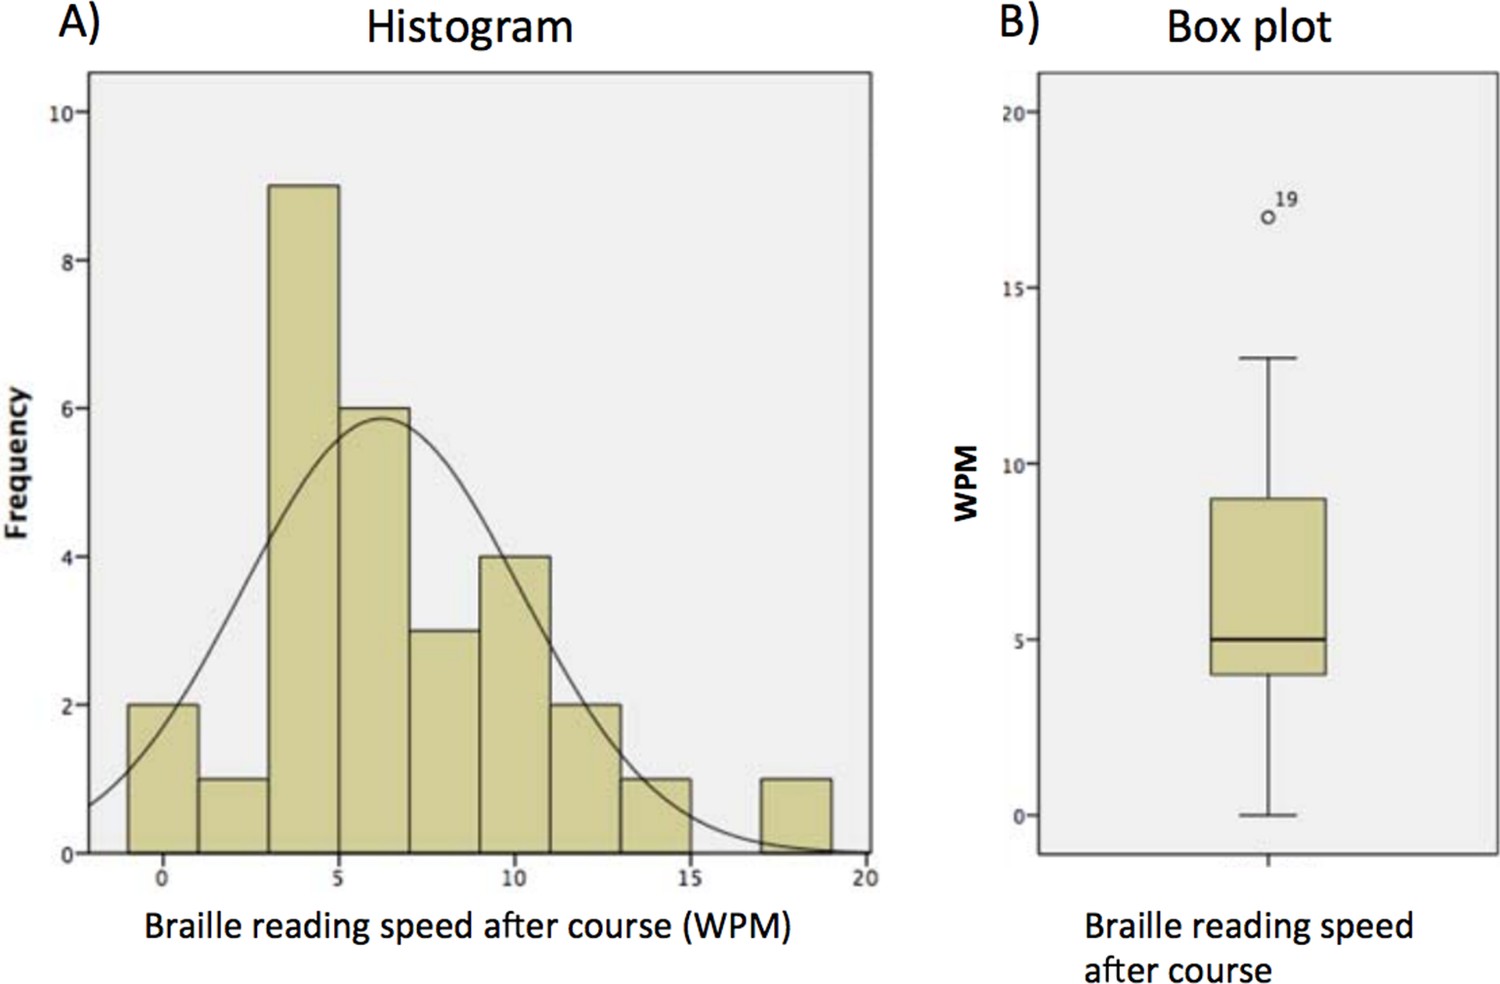
The distribution of final Braille reading speed (words per minute, WPM).
https://doi.org/10.7554/eLife.10762.017
Author response image 5
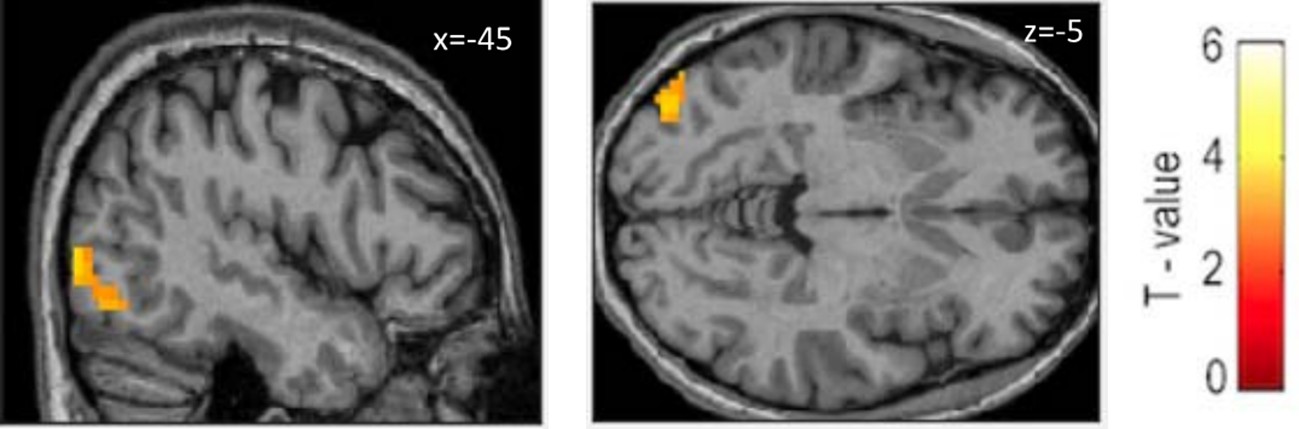
Tactile Braille modulated by reading speed after course (outlier excluded).
Voxel-wise p=0.005, k=50.
Tables
Table 1
Summary of main activations for tactile Braille reading contrasted with control conditions and visual reading across the tactile Braille course
| Contrast | Voxel-wise p threshold | Region | BA | Hemisphere | Z score | Cluster size | MNI coordinates | ||
|---|---|---|---|---|---|---|---|---|---|
| Tactile Braille vs. Control after training | p = 0.001 | Fusiform Gyrus (VWFA) | 37 | Left | 5.18 | 75 | -45 | -58 | -12 |
| Inferior Frontal Gyrus | 9 | Left | 5.15 | 467 | -42 | 2 | 27 | ||
| 46 | Left | 3.43 | 97 | -42 | 32 | 11 | |||
| 47 | Right | 4.48 | 111 | 33 | 26 | 3 | |||
| 45 | Right | 3.82 | 66 | 60 | 11 | 23 | |||
| Medial Frontal Gyrus | 6 | Left | 4.84 | 467 | -6 | 2 | 63 | ||
| Superior Occipital Gyrus | 39 | Right | 5.08 | 208 | 33 | -73 | 27 | ||
| Precuneus | 7 | Right | 4.63 | 208 | 21 | -70 | 47 | ||
| 7 | Left | 5.01 | 401 | -21 | -73 | 43 | |||
| Inferior Parietal Lobule | 40 | Left | 4.55 | 401 | -30 | -43 | 43 | ||
| 40 | Right | 4.24 | 93 | 45 | -34 | 47 | |||
| Middle Frontal Gyrus | 46 | Right | 3.55 | 111 | 42 | 29 | 19 | ||
| Cerebellum | * | Right | 4.36 | 274 | 27 | -64 | -24 | ||
| Insula | 13 | Left | 4.34 | 97 | -33 | 23 | 3 | ||
| Tactile Braille vs. Control x after > before training | p = 0.005 | Superior Temporal Gyrus | 22 | Right | 5.49 | 225 | 48 | -25 | -1 |
| Fusiform Gyrus (VWFA) | 37 | Left | 4.54 | 606 | -45 | -61 | -12 | ||
| Middle Frontal Gyrus | 6 | Left | 4.48 | 1031 | -45 | -1 | 43 | ||
| Inferior Frontal Gyrus | 45 | Left | 4.22 | 1031 | -33 | 26 | 7 | ||
| 47 | Right | 4.28 | 339 | 39 | 26 | -1 | |||
| Insula | 13 | Right | 3.95 | 33 | 23 | 7 | |||
| Middle Temporal Gyrus | 22 | Left | 4.13 | 183 | -51 | -43 | 7 | ||
| 37 | Left | 3.92 | 606 | -45 | -64 | -9 | |||
| Superior Temporal Gyrus | 22 | Left | 3.62 | 183 | -63 | -40 | 11 | ||
| 22 | Left | 3.43 | -57 | -52 | 11 | ||||
| Precuneus | 7 | Left | 4.10 | 606 | -18 | -67 | 43 | ||
| 7 | Right | 3.78 | 713 | 24 | -73 | 31 | |||
| Cerebellum | * | Right | 4.01 | 713 | 27 | -64 | -28 | ||
| Middle Occipital Gyrus | 37 | Right | 3.85 | 713 | 39 | -70 | -5 | ||
| Tactile Braille vs.Control – Visual Reading vs.Control x after > before training | p = 0.005 | Inferior Frontal Gyrus | 9 | Left | 5.60 | 2469 | -45 | 5 | 23 |
| Superior Frontal Gyrus | 6 | Left | 5.48 | -3 | 5 | 63 | |||
| Precentral Gyrus | 6 | Left | 5.39 | -45 | -4 | 51 | |||
| Cerebellum | * | Right | 4.78 | 1154 | 6 | -79 | -36 | ||
| * | Left | 3.49 | -9 | -82 | -20 | ||||
| Fusiform Gyrus (VWFA) | 37 | Left | 4.05 | 1154 | -45 | -61 | -12 | ||
| Inferior Temporal Gyrus | 37 | Left | 3.81 | -48 | -70 | -5 | |||
| Inferior Parietal Lobule | 40 | Left | 4.21 | 532 | -33 | -49 | 51 | ||
| Precuneus | 19 | Left | 4.08 | -27 | -73 | 31 | |||
| 7 | Right | 4.31 | 738 | 27 | -70 | 31 | |||
| Cuneus | 30 | Right | 4.02 | 27 | -76 | 3 | |||
Table 2
Summary of main activations for visual reading and visual Braille reading contrasted with control conditions across the tactile Braille course.
| Contrast | Voxel-wise p treshold | Region | BA | Hemisphere | Z score | Cluster size | MNI coordinates | ||
|---|---|---|---|---|---|---|---|---|---|
| Visual words vs. Control before training | p = 0.005 | Inferior Temporal Gyrus | 37 | Left | 7.43 | 359 | -42 | -70 | -9 |
| Fusiform Gyrus (VWFA) | 37 | Left | 5.02 | -42 | -52 | -16 | |||
| Middle Occipital Gyrus | 18 | Left | 3.17 | -24 | -94 | 3 | |||
| Visual Braille vs Control before training | p = 0.005 | Precuneus | 19 | Right | 5.83 | 1767 | 30 | -64 | 39 |
| Middle Temporal Gyrus | 37 | Right | 5.58 | 45 | -64 | -9 | |||
| Middle Occipital Gyrus | 19 | Right | 5.19 | 48 | -76 | -1 | |||
| 19 | Left | 5.60 | 1640 | -45 | -85 | -1 | |||
| Inferior Frontal Gyrus | 9 | Left | 5.81 | 1374 | -42 | 2 | 27 | ||
| Middle Frontal Gyrus | 6 | Left | 5.20 | -30 | -4 | 55 | |||
| Precentral Gyrus | 6 | Left | 5.11 | -51 | -4 | 39 | |||
| Fusiform Gyrus (VWFA) | 37 | Left | 5.62 | 1640 | -45 | -58 | -12 | ||
| Inferior Occipital Gyrus | 19 | Left | 5.59 | -42 | -73 | -9 | |||
| Visual Braille vs. Control x after > before training | p = 0.005 | Precuneus | 7 | Right | 4.88 | 797 | 6 | -64 | 35 |
| 31 | Left | 4.29 | -9 | -61 | 27 | ||||
| Middle Temporal Gyrus | 39 | Right | 4.04 | 275 | 51 | -64 | 23 | ||
| 39 | Left | 4.00 | 297 | -45 | -67 | 27 | |||
| 39 | Left | 3.86 | -54 | -70 | 23 | ||||
| Superior Temporal Gyrus | 13 | Right | 3.83 | 275 | 45 | -49 | 23 | ||
| Inferior Parietal Lobule | 40 | Right | 2.78 | 60 | -52 | 43 | |||
| Superior Parietal Lobule | 7 | Left | 3.45 | 297 | -45 | -67 | 51 | ||
| Medial Frontal Gyrus | 10 | Left | 3.79 | 1184 | -3 | 62 | -1 | ||
| 10 | Left | 3.73 | -9 | 50 | -5 | ||||
| Superior Frontal Gyrus | 8 | Right | 3.64 | 9 | 47 | 43 | |||
Table 3
Summary of activations for behavioural measures modulating the activity in reading.
| Contrast | Voxel-wise p treshold | Region | BA | Hemisphere | Z score | Cluster size | MNI coordinates | ||
|---|---|---|---|---|---|---|---|---|---|
| Tactile reading speed x activations in Tactile Braille after training | p = 0.005 | Inferior Occipital Gyus | 19 | Left | 3.69 | 103 | -45 | -76 | -13 |
| Middle Occipital Gyrus | 19 | Left | 3.65 | 103 | -39 | -85 | -1 | ||
| Tactile letter recognition x activations in Tactile Braille after the training | p = 0.005 | Middle Occipital Gyrus | 19 | Left | 3.62 | 170 | -48 | -73 | -12 |
| 19 | Left | 3.21 | 170 | -39 | -85 | -1 | |||
| Lingual Gyrus | 18 | Left | 3.42 | 170 | -15 | -85 | -16 | ||
| Fusiform Gyrus (VWFA) | 19 | Left | 3.17 | 170 | -36 | -82 | -20 | ||
| 37 | Right | 3.17 | 63 | 36 | -49 | -20 | |||
| Inferior Occipital Gyrus | 18 | Left | 3.04 | 170 | -39 | -85 | -16 | ||
| Cerebellum | * | Right | 3.00 | 63 | 30 | -58 | -12 | ||
| Cuneus | 17 | Right | 3.01 | 44 | 18 | -85 | 7 | ||
| 18 | Right | 2.76 | 44 | 6 | -91 | 7 | |||
Table 4
Summary of main activations in the control experiment.
| Contrast | Voxel-wise p treshold | Region | BA | Hemisphere | Z score | Cluster size | MNI coordinates | ||
|---|---|---|---|---|---|---|---|---|---|
| Tactile Braille Imagine vs Rest after course | p = 0.001 | Cerebellum | * | Right | >8 | 519 | 27 | -67 | -24 |
| * | Left | 3.43 | 152 | -42 | -64 | -28 | |||
| Inferior Frontal Gyrus | 9 | Left | >8 | 8307 | -57 | 8 | 27 | ||
| Inferior Parietal Lobule | 40 | Left | >8 | -39 | -43 | 43 | |||
| Medial Frontal Gyrus | 6 | Left | >8 | -3 | -1 | 63 | |||
| Middle Frontal Gyrus | 46 | Left | >8 | -42 | 32 | 23 | |||
| Postcentral Gyrus | 3 | Left | >8 | -57 | -19 | 23 | |||
| Precentral Gyrus | 6 | Left | >8 | -39 | -7 | 59 | |||
| Superior Temporal Gyrus | 22 | Left | >8 | -54 | 8 | -1 | |||
| 40 | Right | >8 | 39 | -40 | 47 | ||||
| Middle Occipital Gyrus | 19 | Left | 6.60 | 152 | -54 | -61 | -12 | ||
| Fusiform Gyrus (VWFA) | 37 | Left | 5.95 | -45 | -61 | -12 | |||
| Inferior Temporal Gyrus | 20 | Left | 4.22 | -51 | -49 | -16 | |||
| Visual Braille Imagine vs Rest after course | p = 0.001 | Inferior Parietal Lobule | 40 | Left | >8 | 3062 | -39 | -43 | 43 |
| 40 | Right | >8 | 1233 | 39 | -40 | 47 | |||
| Middle Frontal Gyrus | 6 | Left | >8 | 3062 | -24 | -4 | 51 | ||
| 6 | Right | 7.56 | 1233 | 27 | -4 | 51 | |||
| Precentral Gyrus | 6 | Left | >8 | 3062 | -54 | 2 | 39 | ||
| Cerebellum | * | Right | 7.63 | 134 | 30 | -67 | -24 | ||
| Inferior Frontal Gyrus | 44 | Right | 7.41 | 1233 | 54 | 8 | 23 | ||
| Middle Occipital Gyrus | 19 | Left | 7.01 | 119 | -48 | -58 | -12 | ||
| Fusiform Gyrus (VWFA) | 37 | Left | 6.38 | -45 | -58 | -12 | |||
| Superior Temporal Gyrus | 42 | Right | 4.80 | 113 | 66 | -25 | 7 | ||
| Tactile Braille Imagine vs Visual braille imagine after course | p = 0.005 | Inferior Parietal Lobule | 40 | Left | 6.84 | 6602 | -57 | -22 | 23 |
| 40 | Right | 4.72 | 66 | -37 | 31 | ||||
| Cerebellum | * | Right | 6.75 | 962 | 24 | -52 | -24 | ||
| Superior Frontal Gyrus | 10 | Left | 6.41 | 672 | -30 | 50 | 19 | ||
| 10 | Right | 5.35 | 6602 | 27 | 44 | 19 | |||
| Precentral Gyrus | 4 | Left | 6.21 | -33 | -19 | 55 | |||
| Postcentral Gyrus | 3 | Right | 5.72 | 60 | -19 | 23 | |||
| 2 | Left | 4.88 | -57 | -25 | 47 | ||||
| Middle Frontal Gyrus | 10 | Right | 5.21 | 33 | 50 | 15 | |||
| 9 | Left | 4.86 | 672 | -42 | 26 | 35 | |||
| Objects Touch | p = 0.005 | Cerebellum | * | Right | >8 | 1211 | 24 | -52 | -24 |
| * | Left | >8 | -21 | -55 | -24 | ||||
| Postcentral Gyrus | 3 | Right | >8 | 5412 | 48 | -22 | 51 | ||
| Precentral Gyrus | 6 | Right | >8 | 36 | -13 | 59 | |||
| 4 | Left | >8 | -39 | -22 | 59 | ||||
| Middle Occipital Gyrus | 19 | Left | 5.18 | 85 | -51 | -64 | -9 | ||
| 37 | Right | 4.77 | 1211 | 51 | -64 | 12 | |||
Download links
A two-part list of links to download the article, or parts of the article, in various formats.
Downloads (link to download the article as PDF)
Open citations (links to open the citations from this article in various online reference manager services)
Cite this article (links to download the citations from this article in formats compatible with various reference manager tools)
Massive cortical reorganization in sighted Braille readers
eLife 5:e10762.
https://doi.org/10.7554/eLife.10762


