Binary architecture of the Nav1.2-β2 signaling complex
- University of British Columbia, Canada
- Johns Hopkins University School of Medicine, United States
Figures
Figure 1
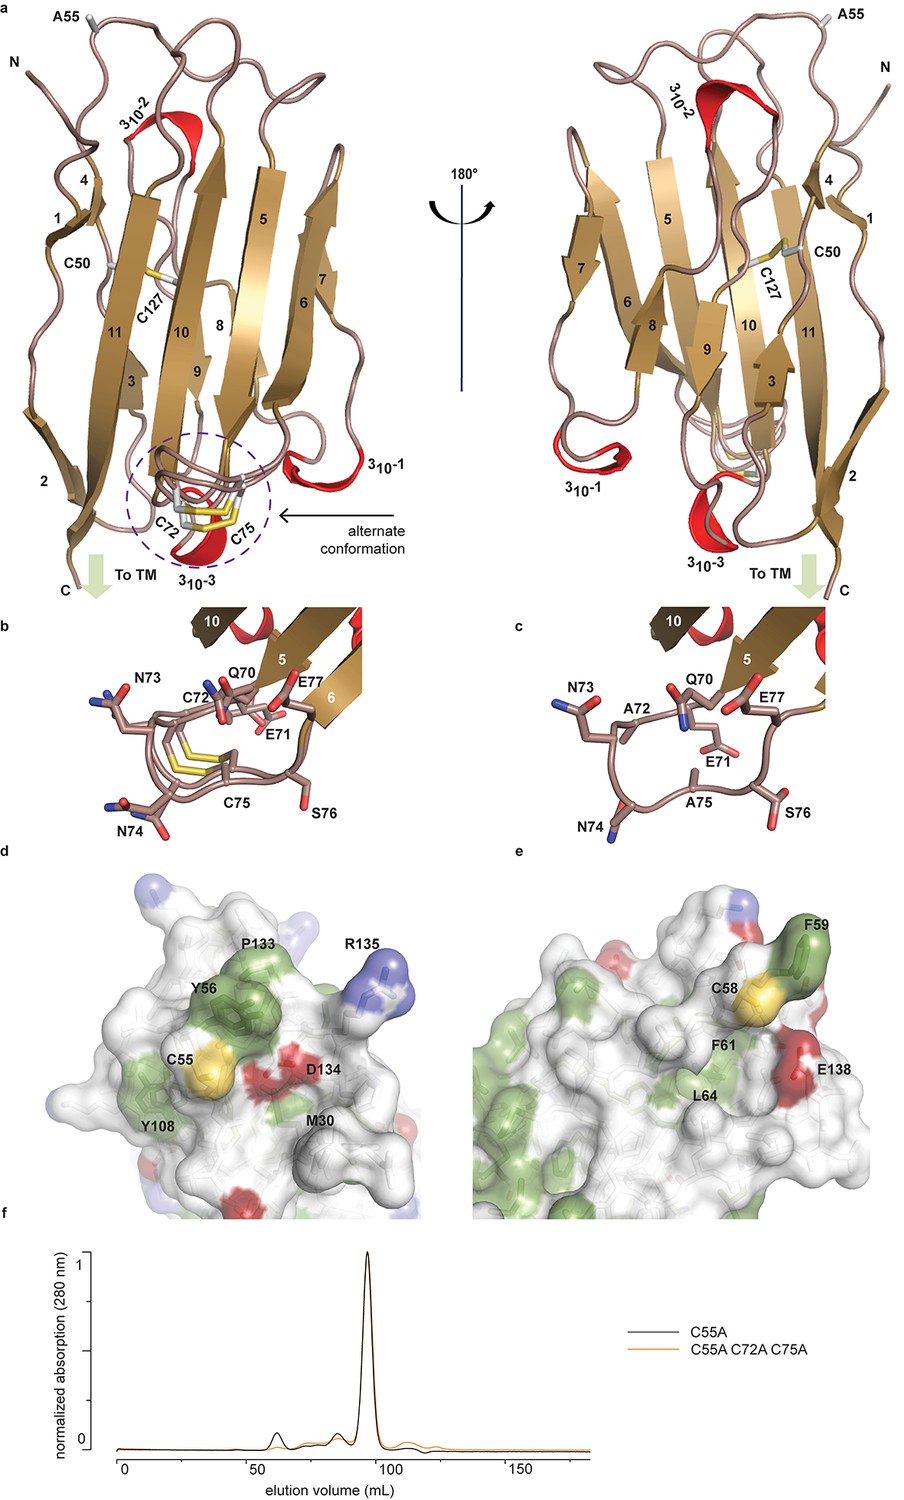
Crystal structure of hβ2.
(a) Cartoon representation of the hβ2 (C55A) extracellular domain crystal structure, showing β strands in gold and 310 helices in red. Cysteine side chains, as well as the 55Ala residue, are shown in stick representation. Positions of N-terminus (N) and C-terminus (C) are indicated. The loop containing the 72Cys- 75Cys disulfide bond is modeled in a dual conformation. (b) Detail of the dual conformation of the loop, showing all side chains in stick conformation. (c) Detail of the same loop in the C72A/C75A (C55A) mutant, shown from the same viewpoint as in panel (b). (d,e) Comparison of the surfaces of hβ2 (d) and hβ4 (e) surrounding the reactive cysteines (55Cys and 58Cys, respectively). Side chains of hydrophobic residues are shown in green, negatively charged carboxyl groups in red, and positively charged amino and guanidinium groups in blue. The position of the cysteine (which has been mutated to alanine to allow crystallization) is shown in yellow. (f) Size exclusion chromatograms (Preparative Superdex200) for hβ2 C55A and hβ2 C55/72/75A, which both elute as monomeric species.
-
Figure 1—source data 1
X-ray data collection and refinement statistics.
- https://doi.org/10.7554/eLife.10960.004
Figure 2 with 1 supplement
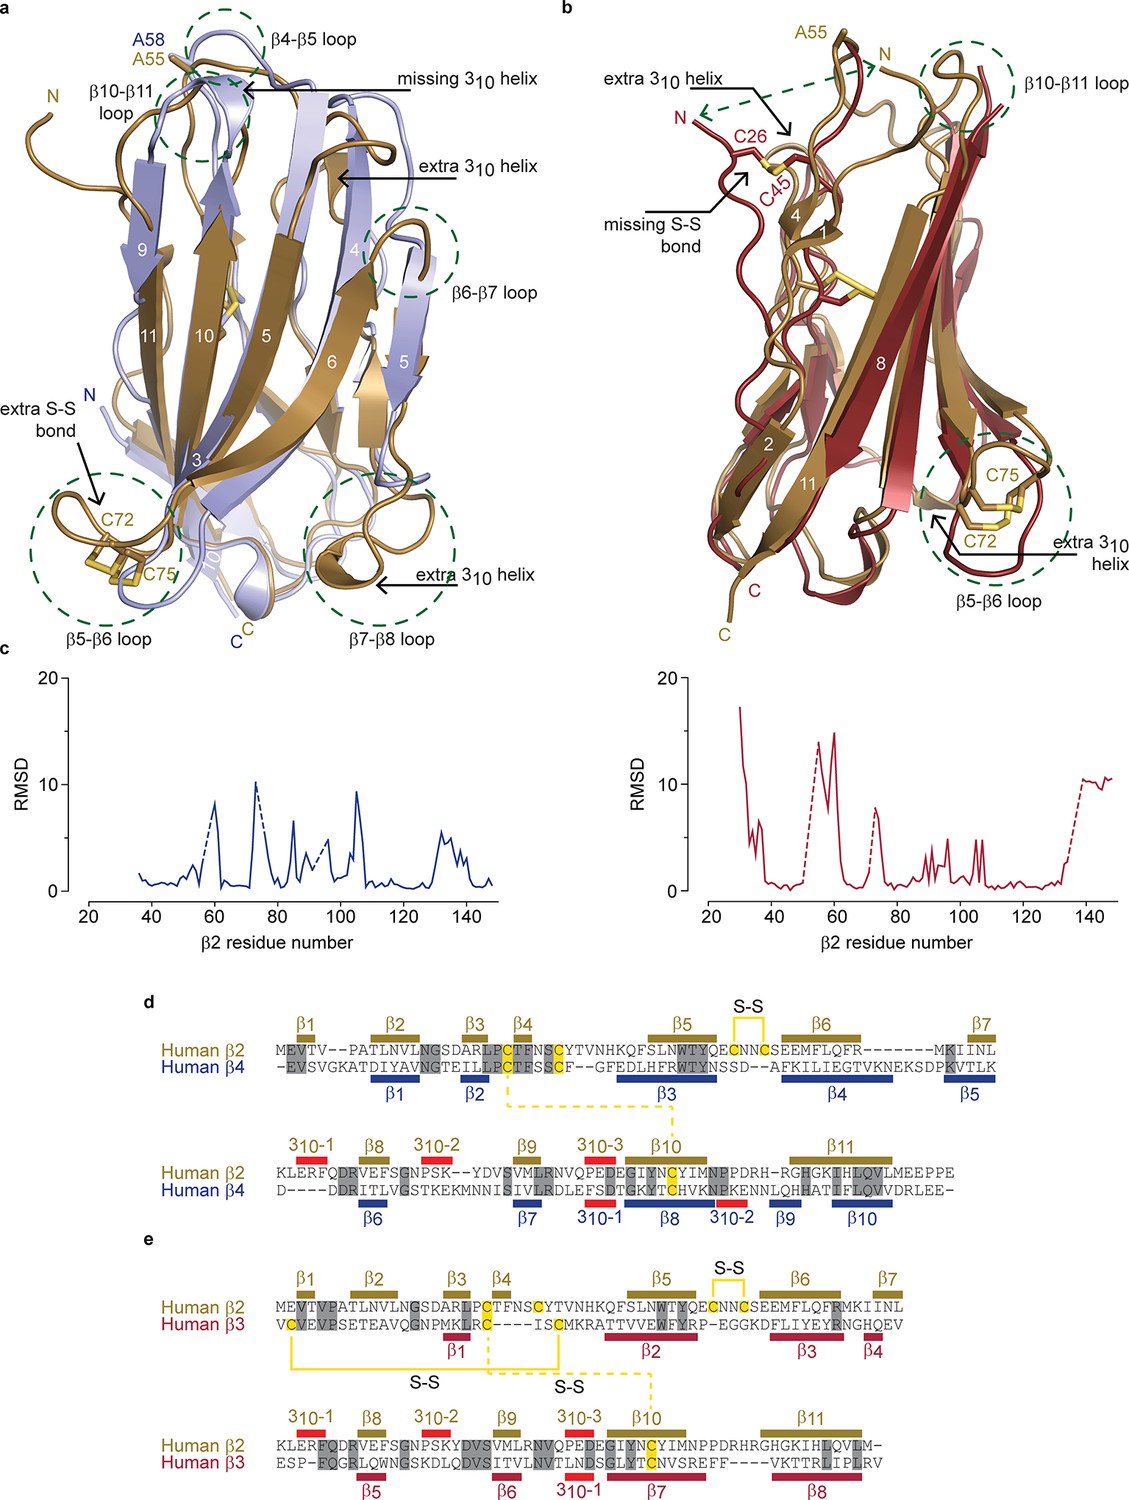
Structural comparison of hβ2 to hβ3 and hβ4.
(a) Superposition of the crystal structures of hβ2 C55A (gold) and hβ4 C58A (blue) in cartoon representation. Cysteines or their equivalent residues (A55 and A58, respectively) are shown in sticks. The major differences are highlighted in the figure. (b) Superposition of crystal structures of hβ2 C55A (gold) and hβ3 (red). (c) Root-mean-square-deviation (RMSD) plots showing the RMSD values per residue for hβ4 C58A (left, blue plot) and hβ3 (right, red plot) relative to hβ2 after a superposition. The residue numbers below correspond to the hβ2 numbers. Sections for which there are no corresponding residues at indicated with dotted lines. (d,e) Shown are sequence alignments of the extracellular domains of (d) hβ2 versus hβ4 and (e) hβ2 versus hβ3. Conserved residues are highlighted in grey, and cysteines in yellow. Observed disulfide bonds are also labeled (S-S). Secondary structure elements found in the corresponding crystal structures are also shown.
Figure 2—figure supplement 1
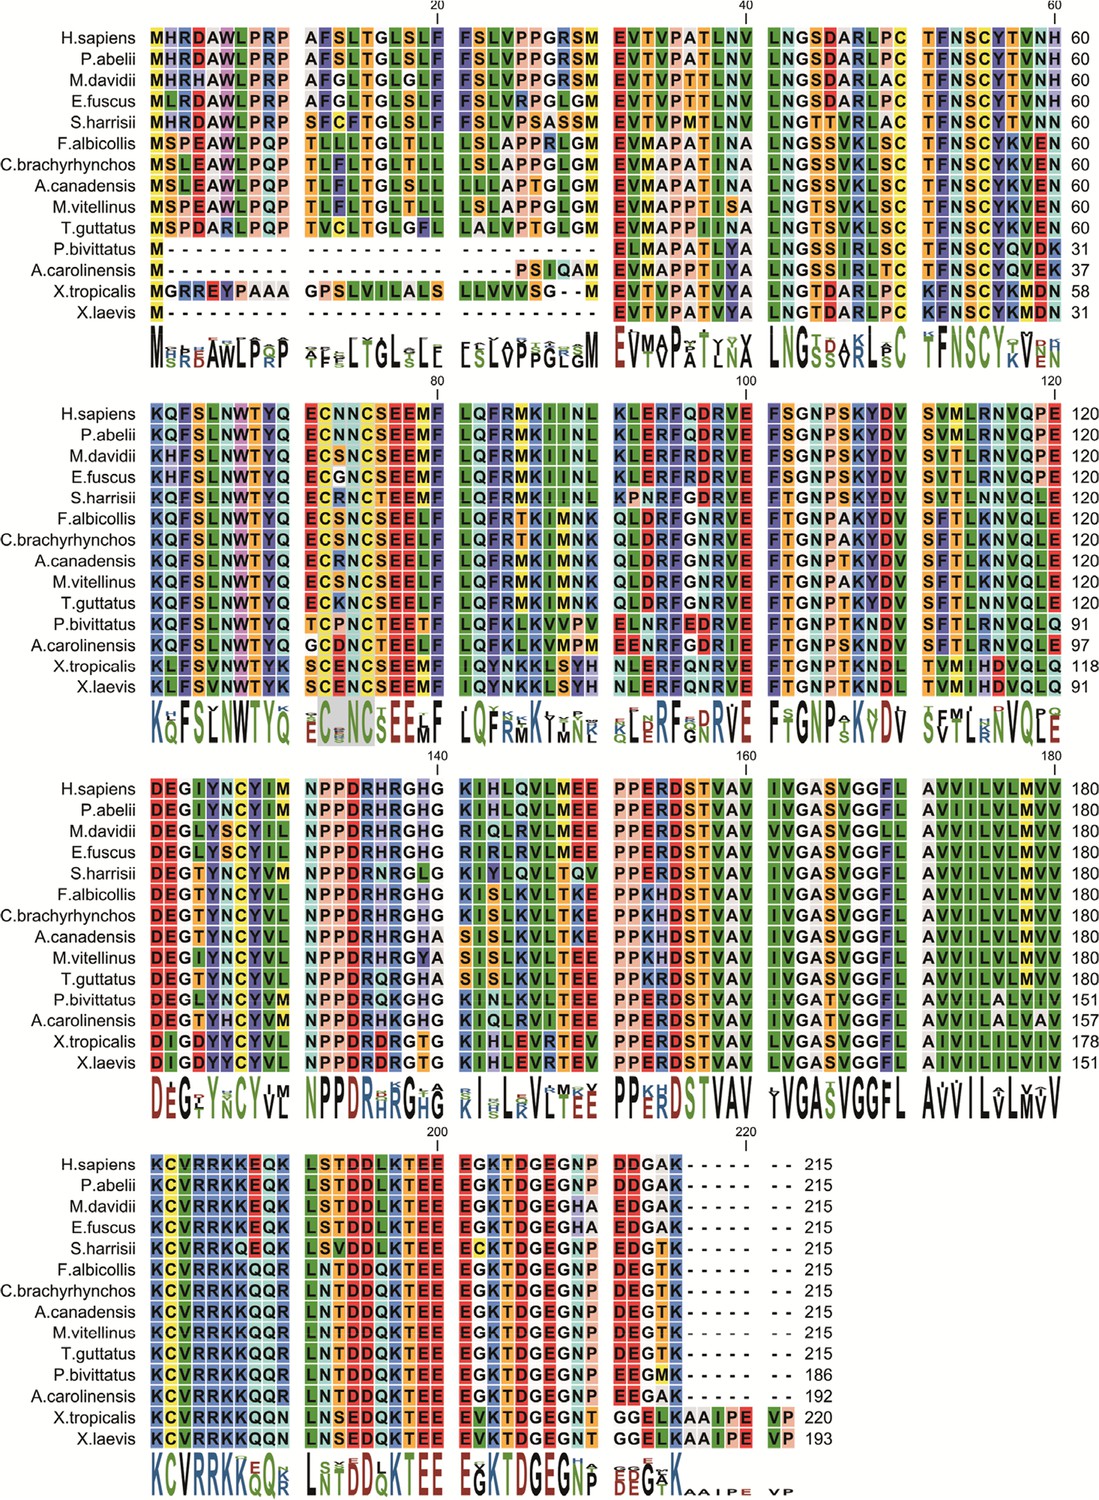
Amino acid sequence alignment of the β2 protein found in various organisms.
Conserved cysteines 72Cys and 75Cys in hβ2 are indicated with a grey background. Residue numbers in hβ2 above sequences are shown as a reference. Protein accession numbers for sequences used are: H. sapiens (NP_004579.1), P. abelii (XP_002822587.1), M. davidii (XP_006761624.1), E. fuscus (XP_008148335.1), S. harrisii (XP_003764204.1), T. guttatus (XP_010214560.1), C. brachyrhynchos (XP_008635161.1), F. albicollis (XP_005058672.1), A. canadensis (XP_011600162.1), M. vitellinus (XP_008927155.1), A. carolinensis (XP_003229016.2), P. bivittatus (XP_007424304.1), X. tropicalis (NP_001116903.2), X. laevis (NP_001088105.2).
Figure 3 with 2 supplements
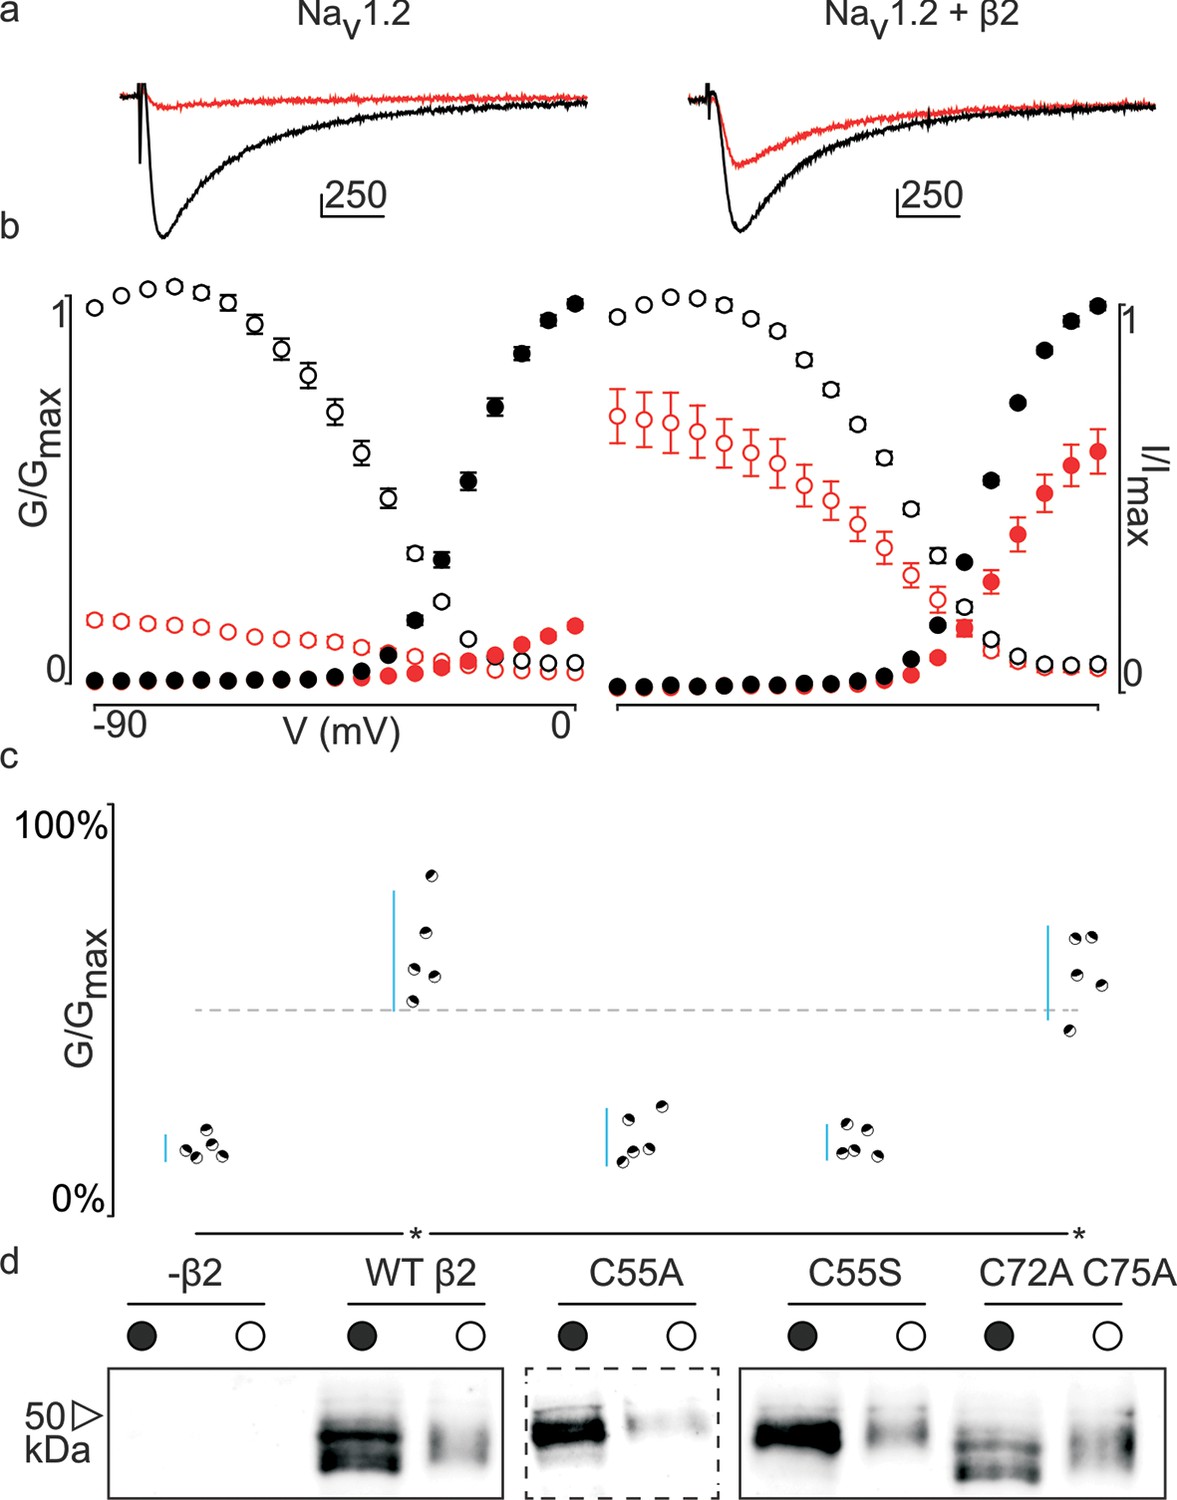
Effect of hβ2 on hNav1.2 toxin pharmacology.
(a) Co-expression of hNav1.2 with hβ2 decreases the degree of inhibition by 100 nM ProTx-II. Left trace shows ProTx-II strongly inhibiting WT hNav1.2 whereas right trace displays attenuated inhibition in the presence of hβ2. Black trace is control condition without toxin, red is in the presence of ProTx-II. Traces depict a 50 ms depolarization to -15 mV from -90 mV. Scale bar is 10 ms on horizontal axis and given nA vertically. (b) Normalized conductance-voltage (G-V, filled circles) and steady-state inactivation (I-V, open circles) relationships for hNav1.2 with and without hβ2. Pre-toxin values are shown in black and post-toxin in red. Fit values can be found in Figure 3—source data 1. (c) Dot plot comparing hβ2 mutations by ability to prevent ProTx-II inhibition of hNav1.2. Black circles represent individual oocytes; vertical axis shows percent of inhibition by ProTx-II at peak conductance. Blue lines represent a 95% confidence interval. hβ2 mutations are presented underneath the horizontal axis and label the lanes below in (d). Statistical significance (p<0.01) is indicated by an asterisk. (d) Western blot against the C-terminal myc-tag of hβ2. No signal is seen in the negative control but is observed for the WT hβ2 and all mutants, both in whole cell (filled circle) and surface (open circle) fractions.
-
Figure 3—source data 1
Table providing values for fits of the data presented in Figure 3 and Figure 3—figure supplement 2.
G-V and SSI relationship data were fitted by a Boltzmann curve. V1/2 provides the midpoint voltage of the calculated curve (in mV) and Vc the unit-less slope, with standard error of the mean (SEM). Right column shows peak conductance after toxin treatment as a fraction of untreated peak conductance with the upper and lower bounds of the 95% confidence interval in parentheses, reflecting the data displayed in the dot plots.
- https://doi.org/10.7554/eLife.10960.008
Figure 3—figure supplement 1
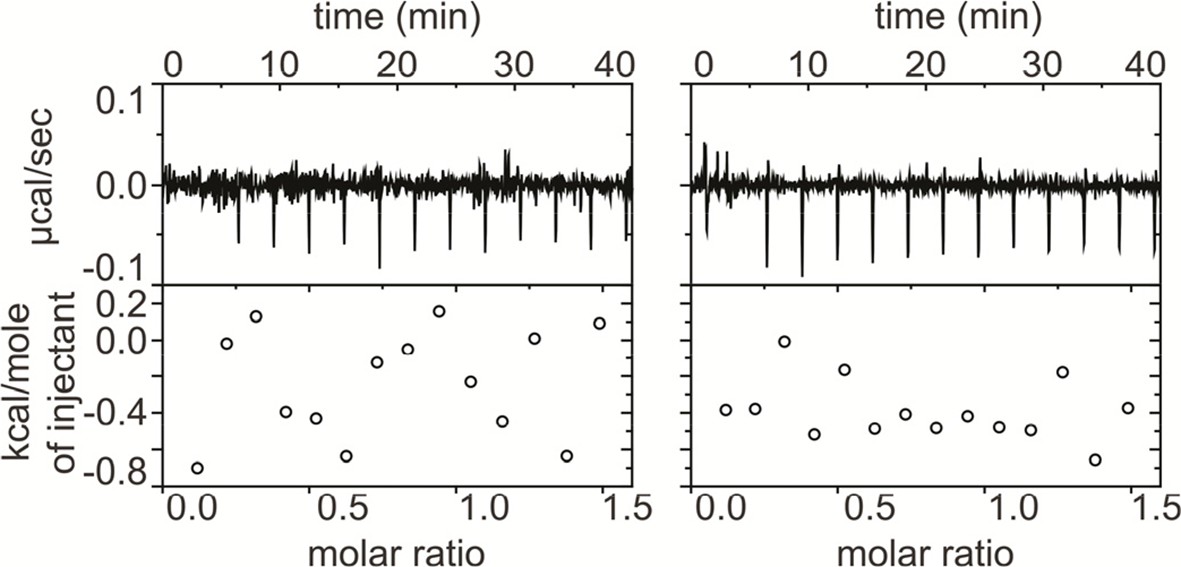
ProTx-II does not bind directly to β4.
Isothermal calorimetry (ITC) experiments showing titration of 400 μM WT hβ4 extracellular domain into 40 μM ProTx-II (left) and into buffer (right). No significant heat differences are detected.
Figure 3—figure supplement 2
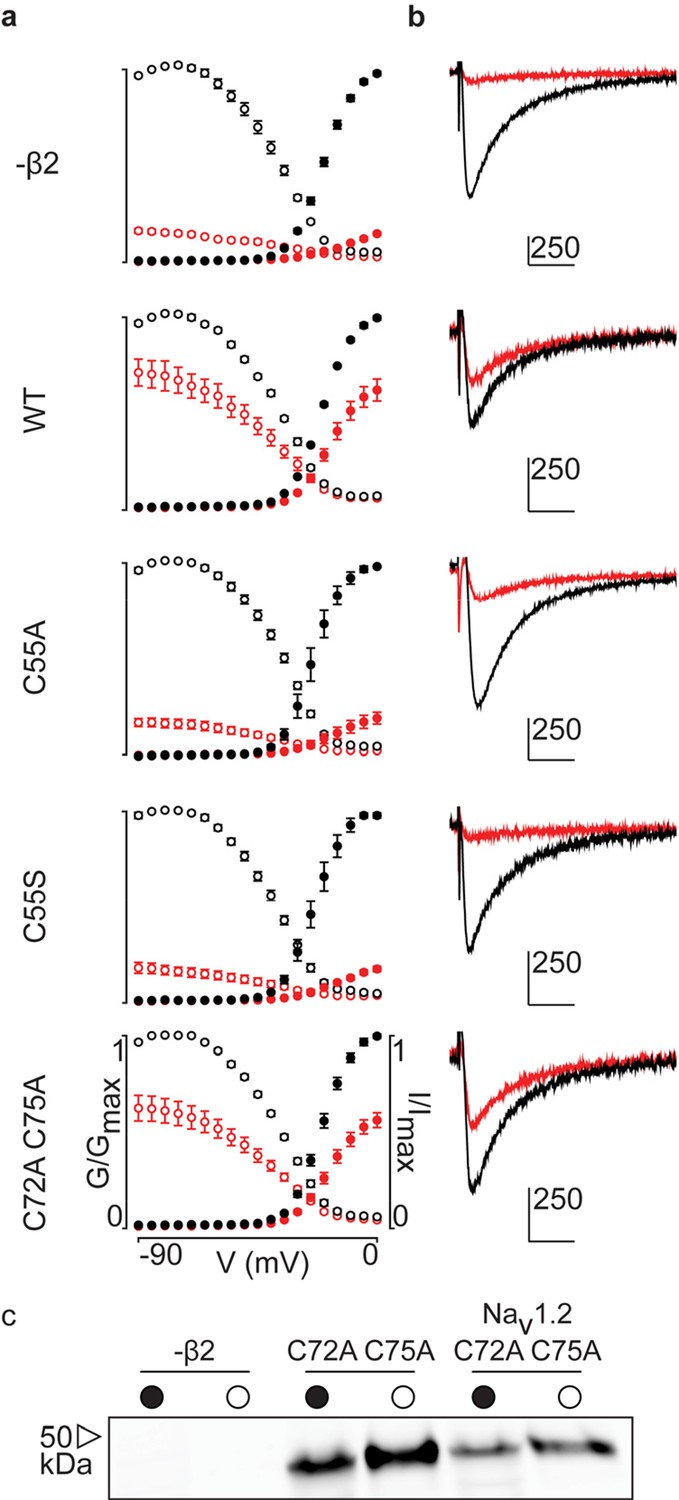
G-V and SSI relationships for hβ2 mutants.
(a) Conductance-voltage (G-V, filled circles) and steady-state inactivation (SSI, open circles) relationships before 10nM ProTx-II addition are indicated in black and red in the presence of toxin. (b) Representative traces at -15 mV (holding potential of -90 mV) for the corresponding graphs seen in (a). Scale bar is 10 ms along horizontal axis and displayed nA along the vertical axis. (c) Western blot showing that the C72A C75A hβ2 mutant is expressed in whole cell (filled circle) and surface (open circle) fractions either alone (middle column) or with hNav1.2 (right column). The hβ2 subunit was detected using an antibody against a C-terminal myc-tag.
Figure 4 with 2 supplements

hβ2 forms a disulfide bond with 910Cys in hNav1.2.
(a) Dot plot showing degree of hNav1.2 mutant inhibition by 100 nM ProTx-II, with and without hβ2. Black circles represent single oocytes expressing the indicated constructs and currents were measured at peak conductance. Blue bars indicate 95% confidence interval, and the red bars are 95% confidence intervals for both populations in the C912S mutant co-expressed with hβ2. Statistical significance with p.01 is shown by an asterisk. (b) Western blot against a myc-tag reveals the presence of hβ2 in whole cell fraction of oocytes co-injected with hβ2 mRNA. (c) Schematic depiction of the proposed disulfide arrangement in hNav1.2 mutants with hβ2. hNav1.2 cysteines are displayed on the top arc with α (pore-forming subunit), while 55Cys of hβ2 is on the bottom arc with β. Black lines represent putative disulfide bonds and dashed lines indicate alternate possibilities. Red X symbolizes a Cys to Ser mutation and an asterisk denotes mutants protected against 100 nM ProTx-II.
-
Figure 4—source data 1
Table providing values for fits of the data presented in Figure 4 and Figure 4—figure supplement 1.
G-V and SSI relationship data were fitted by a Boltzmann curve. V1/2 provides the midpoint voltage of the calculated curve (in mV) and Vc the unit-less slope, with standard error of the mean (SEM). Right column shows peak conductance after toxin treatment as a fraction of untreated peak conductance with the upper and lower bounds of the 95% confidence interval in parentheses, reflecting the data displayed in the dot plots.
- https://doi.org/10.7554/eLife.10960.012
-
Figure 4—source data 2
Table providing values for fits of the data presented in Figure 4—figure supplement 2.
G-V and SSI relationship data were fitted by a Boltzmann curve. 1/2 provides the midpoint voltage of the calculated curve (in mV) and Vc the unit-less slope, with standard error of the mean (SEM). Right column shows peak conductance after toxin treatment as a fraction of untreated peak conductance with the upper and lower bounds of the 95% confidence interval in parentheses, reflecting the data displayed in the dot plots.
- https://doi.org/10.7554/eLife.10960.013
Figure 4—figure supplement 1
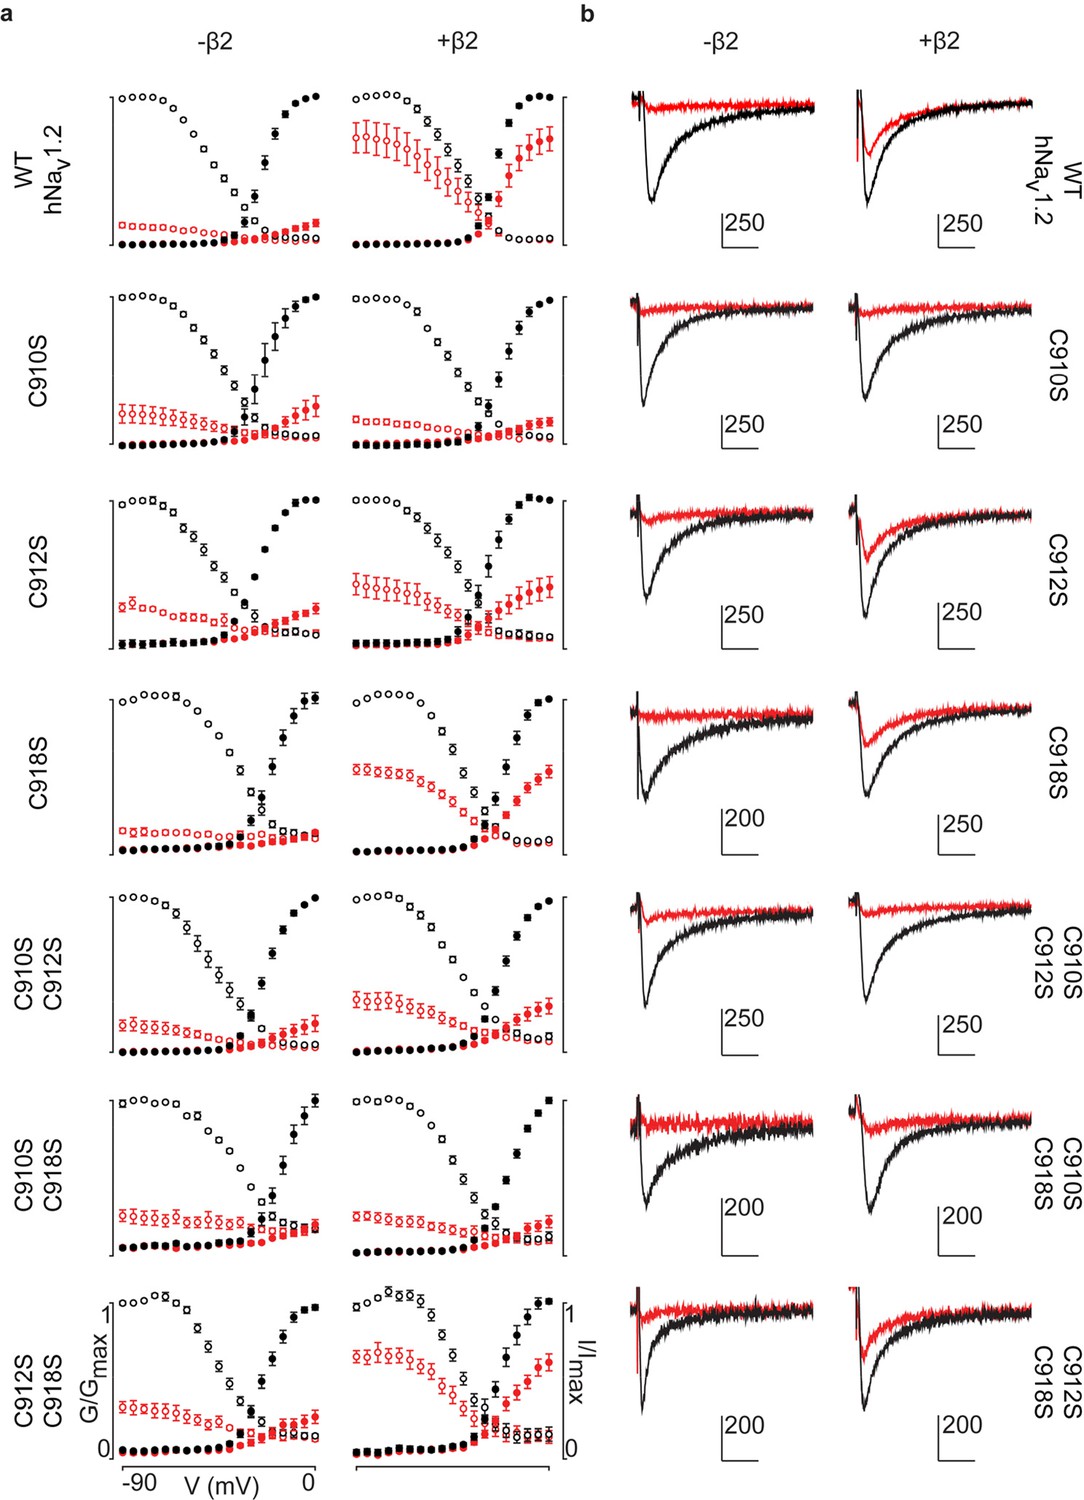
G-V and SSI relationships for hNav1.2 mutants.
a) G-V (filled circles) and SSI (open circles) curves are plotted for each of the hNav1.2 Cys to Ser mutants with and without hβ2. Black indicates values before the addition of 100 nM ProTx-II,red shows values after toxin treatment. In the presence of hβ2, the WT hNav1.2, the C918S mutant, and the C912S C918S all show a diminished susceptibility to ProTx-II whereas the C912S mutant shows a mixed phenotype. b) Sample traces illustrating the effect of 100 nM ProTx-II on hNav1.2 with and without hβ2 after depolarization to -15 mV from -90 mV. Degree of inhibition reflects the G-V and SSI data shown in a). Horizontal arm of scale bar is 10 ms and the vertical arm is in nA.
Figure 4—figure supplement 2
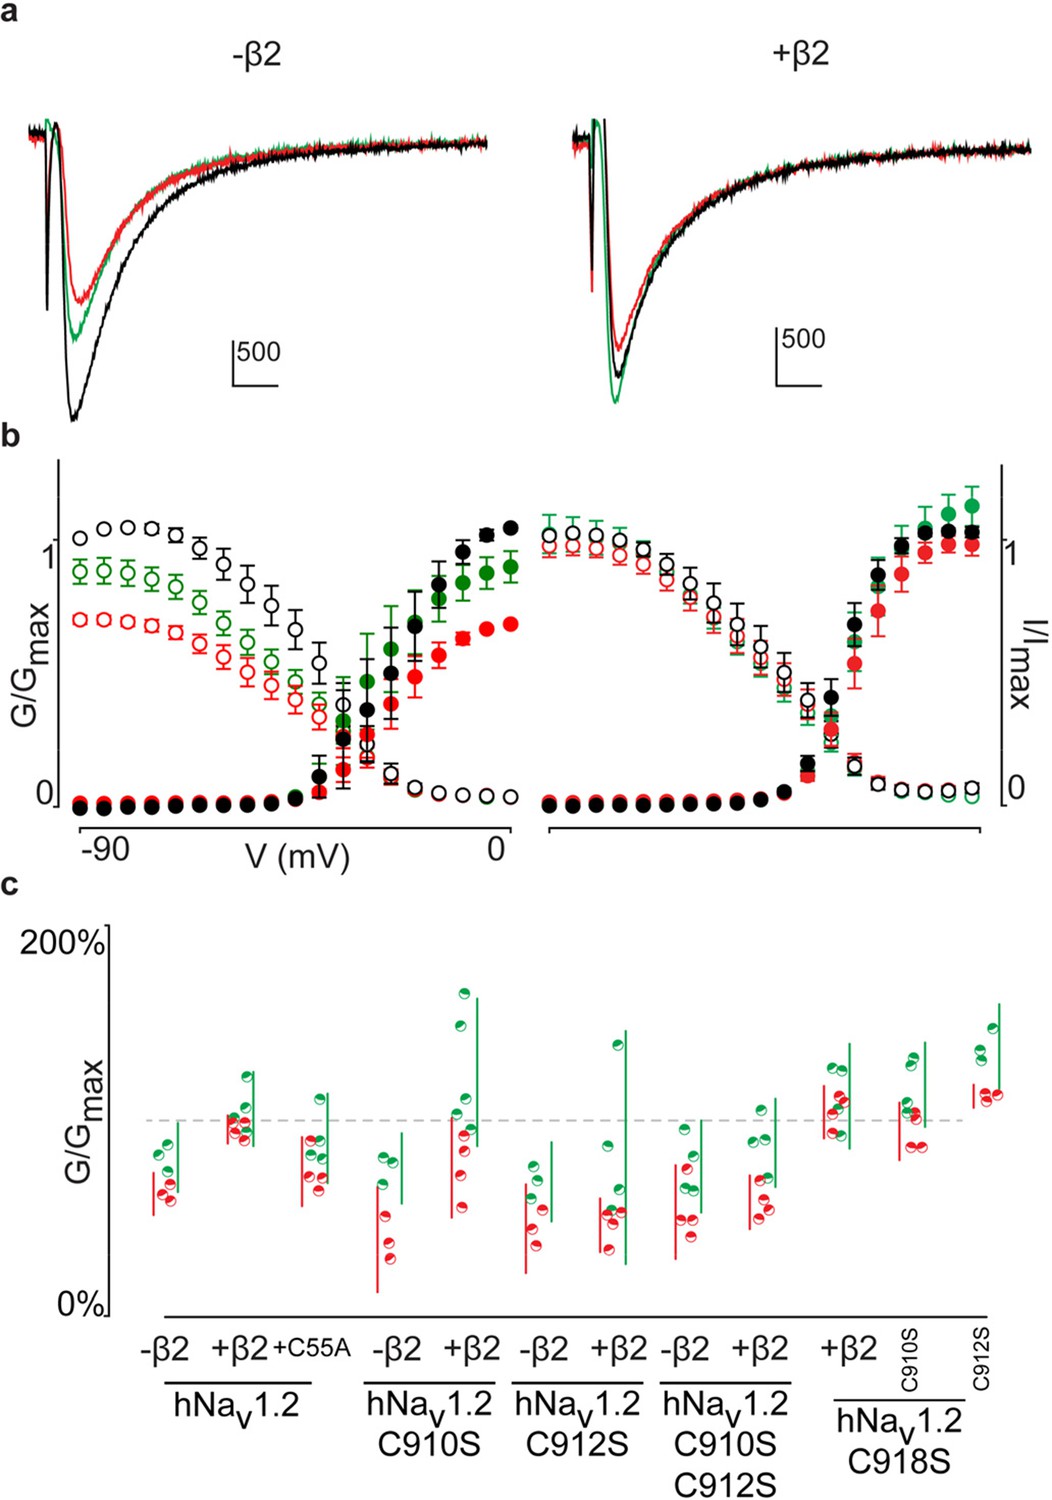
Activity of the μO§-conotoxin GVIIJ is affected by hβ2.
(a) Representative traces of 5 μM GVIIJ affecting hNav1.2-mediated currents with and without hβ2 in Xenopus oocytes. Control traces are shown in black, red after treatment with 5 μM GVIIJ, and green after a 5-min washout with recording solution. Horizontal bar is 10 ms and vertical bar measures current in nA. The data illustrate that 5 M GVIIJ can partially block hNav1.2 only when hβ2 is not present. (b) G-V (filled circles) and SSI (open circles) relationships detailing the effect of 5 M GVIIJ on hNav1.2 with and without hβ2 across a wide voltage range. Color coding is the same as in (a). (c) Dot plot showing the effect of GVIIJ on hNav1.2 Cys to Ser mutants. Red circles indicate fraction of peak control conductance after addition of 5 μM GVIIJ while green circles represent the same after a 5-min washout. Vertical bars show 95% confidence intervals for color-matched circles. The data clearly illustrate a reduced sensitivity to GVIIJ in the presence of hβ2; however, the results are variable as discussed in the text and led us to pursue ensuing experiments with ProTx-II.
Figure 5 with 1 supplement
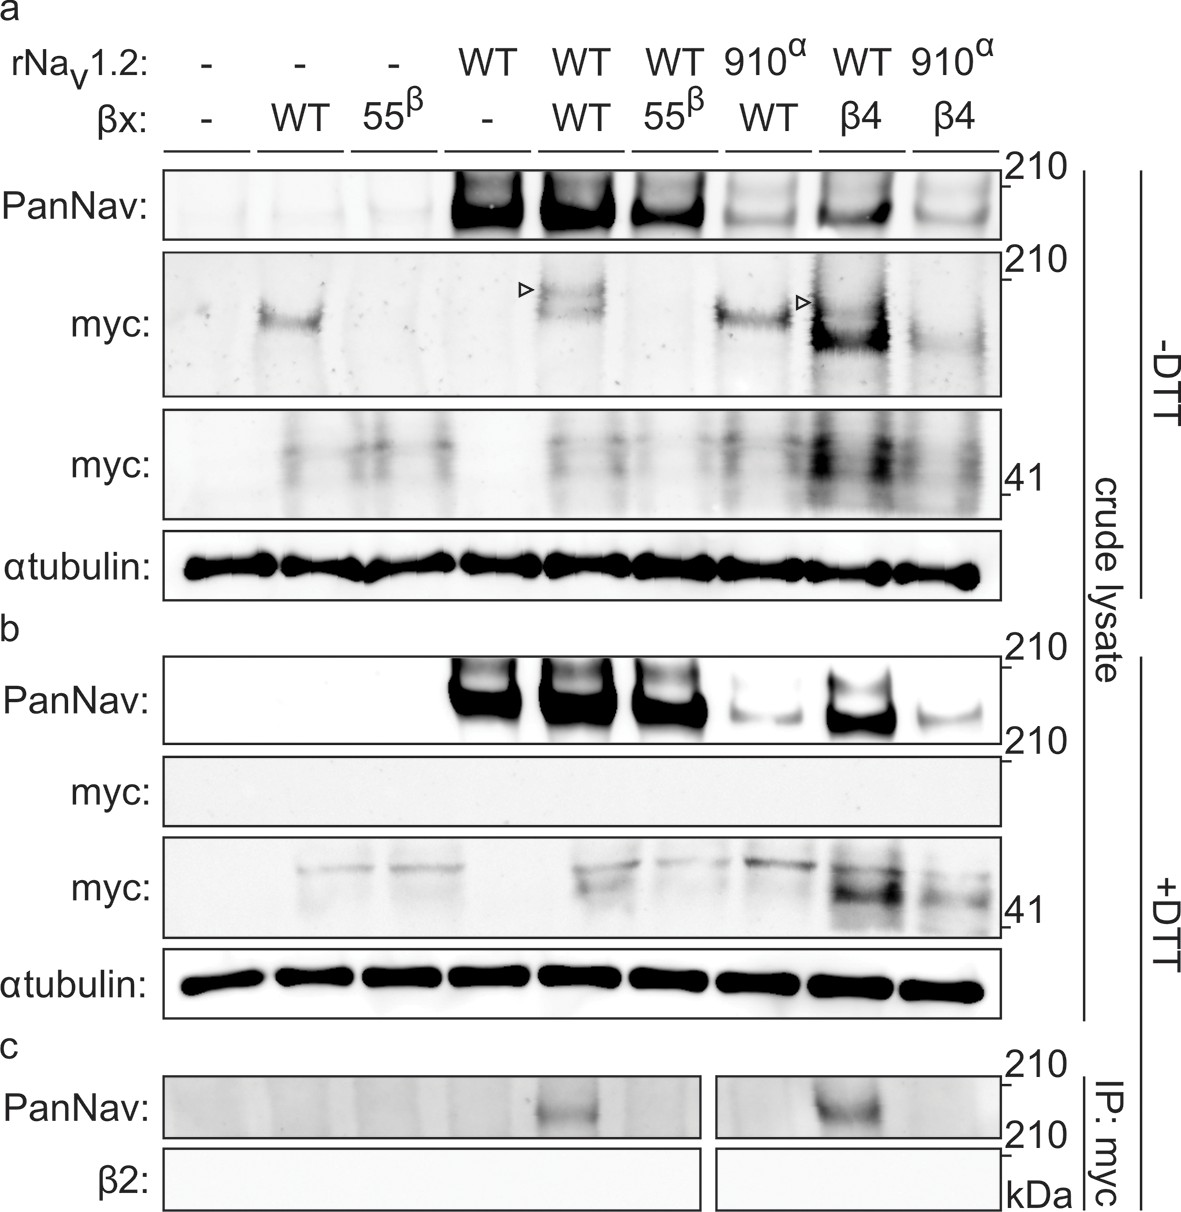
Biochemical verification of the β2 and β4 disulfide bond with 910Cys in Nav1.2.
Top rows indicate particular Nav channel and β-subunit constructs with which oocytes were injected. WT proteins are indicated as such whereas mutants are noted with a residue number; a superscript letter symbolizes in which partner of the complex pair the mutation is found. rβ2 was loaded in each case except in the two rightmost lanes, where rβ4 was used. Labels on left column indicate which antibody was used to immunoblot the associated slice. (a) Western blot run under non-reducing conditions reveals a fraction of rβ2 migrating with WT rNav1.2a but not after selective cysteine substitution. Crude lysate from injected oocytes was run on a protein gel and probed for both the channel and the myc-tag of the β-subunit. The top PanNav slice and bottom myc slice show the expression of the respective proteins in lysates from oocytes injected with the indicated constructs. Even though equal quantities of protein was loaded in each lane (10 μg), the C910S channel mutant expresses less bountifully than the WT channel and as a result shows a weaker signal. The WT β-subunit can form redox-sensitive multimers that migrate at an apparent mass similar to that of the Nav channel. Mutation of 55Cys prevents multimer formation and disappearance of the high molecular weight band. Open arrows identify bands representing Nav channel-bound β-subunit and aid in distinguishing them from the multimeric β-subunit. Substituting 910Cys within rNav1.2a with Ser causes a loss of the channel-bound β-subunit band. rβ4 also binds to WT rNav1.2a, as evidenced by a second band, and no longer interacts with the C910S mutant. (b) Addition of DTT prevents both binding of rβ2 to the channel and formation of β-subunit multimers. The absence of myc signal at the same apparent weight as rNav1.2a indicates that binding to the channel is sensitive to reduction. In all cases, α-tubulin was used as a loading control. (c) WT rNav1.2a co-immunoprecipitates with rβ2 and rβ4. The β-subunit was pulled down with an antibody directed against a C-terminal myc-tag and treated with DTT before loading onto the gel. The channel is present only when the WT channel is co-expressed with the WT β-subunit.
Figure 5—figure supplement 1
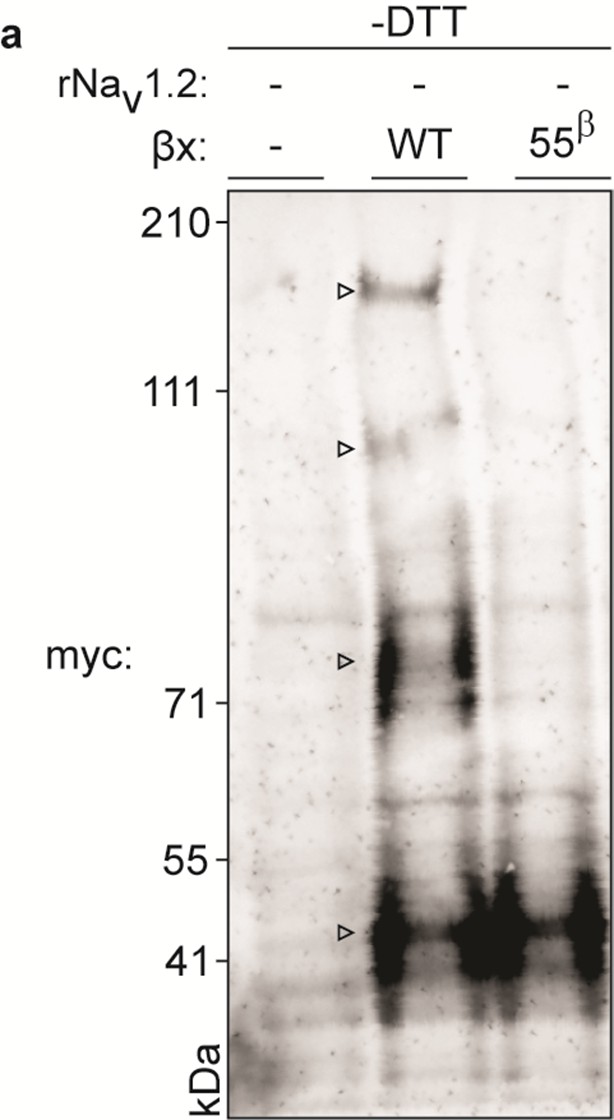
Biochemical assessment of rβ2 oligomer formation.
Figure represents extended data found in Figure 5. WT myc-tagged rβ2 can form higher-order oligomers under non-reducing conditions (indicated with an open arrow in the middle lane). These oligomers disappear upon removal of 55Cys (right lane), further highlighting the reactivity of this residue. Left lane represents lysate from an uninjected oocyte.
Figure 6
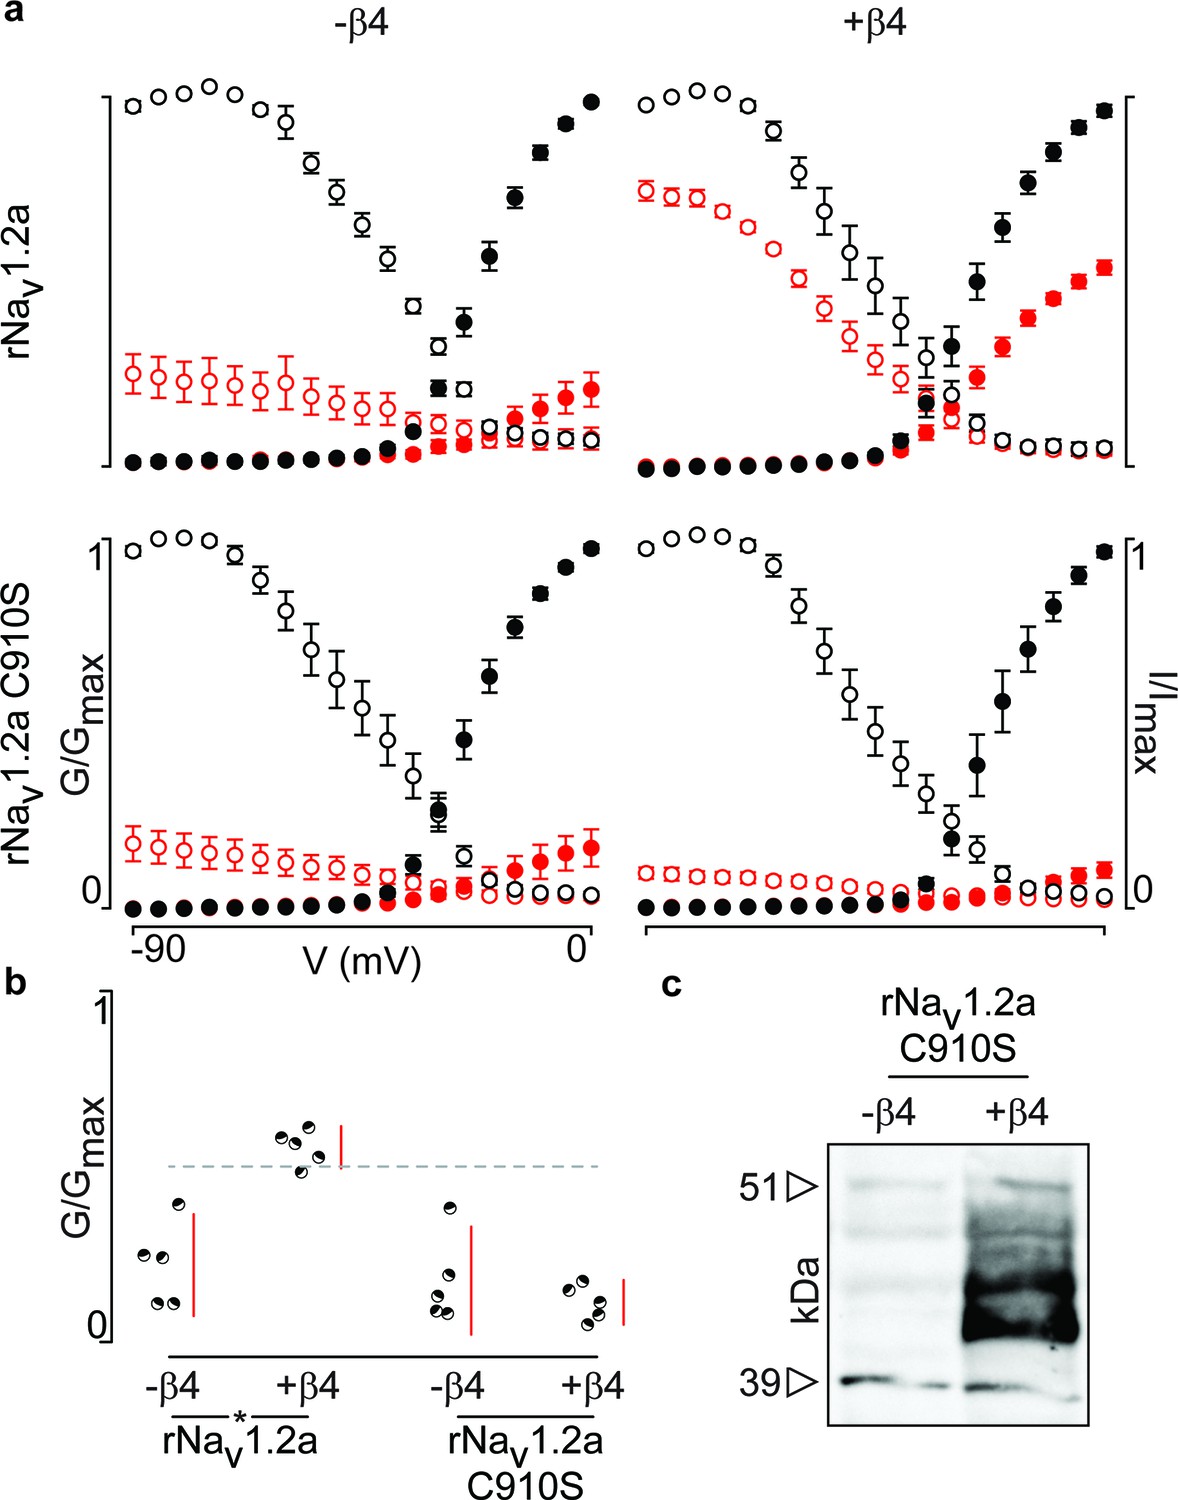
Mutation of 910Cys in rNav1.2a disrupts rβ4 influence on ProTx-II effect.
(a) Replacement of 910Cys with Ser in rNav1.2a impairs the ability of rβ4 to protect against 100 nM ProTx-II inhibition in a manner similar to that of hβ2. Co-expression of the rNav1.2a isoform with rβ4 minimizes ProTx-II inhibition compared to the channel expressed alone. Graphs compare G-V and SSI relationships, in filled and open circles, respectively. Black color is used for values before the addition of 100 nM ProTx-II and red after. (b) Dot plot comparing the degree of inhibition by 100 nM ProTx-II as a fraction of the pre-toxin peak current. rβ4 confers a high level of a protection against ProTx-II inhibition which is absent in the C910S mutant. (c) Western blot directed against the C-terminal myc-tag of rβ4 demonstrating its presence in the oocytes measured.
-
Figure 6—source data 1
Table providing values for fits of the data presented in Figure 6.
G-V and SSI relationship data were fitted by a Boltzmann curve. V1/2 provides the midpoint voltage of the calculated curve (in mV) and Vc the unit-less slope, with standard error of the mean (SEM). Right column shows peak conductance after toxin treatment as a fraction of untreated peak conductance with the upper and lower bounds of the 95% confidence interval in parentheses, reflecting the data displayed in the dot plots.
- https://doi.org/10.7554/eLife.10960.019
Figure 7

ProTx-II inhibits hNav1.5 in the presence of hβ2.
(a) Sequence alignment comparing TTX-sensitive hNav channels in the beginning of the S5-S6 (SS1) loop. Green bar indicates the C-terminal portion of the DII transmembrane segment 5 (TM5), and gray background highlights the conserved cysteine triad. The hNav1.2 amino acid sequence is shown in red and hNav1.5 in blue. Residue number of the N-terminal Val for each channel is superscripted. (b) Dot plot showing that hNav1.5 is not protected against inhibition by 100 nM ProTx-II upon co-expressing hβ2. Black circles are individual oocytes of which sodium currents were measured at peak conductance and blue bars show 95% confidence interval. (c) Western blot probing for the C-terminal myc-tag of hβ2 reveals its presence in whole cell oocyte fractions. hNav1.5 sees no change in 100 nM ProTx-II effect in the presence of hβ2. (d, e) G-V (filled circles) and SSI (open circles) relationships for hNav1.5 with and without hβ2. Black is used for values before ProTx-II addition and red after toxin application. Also shown are representative traces illustrating the lack of effect of hβ2 on hNav1.5 susceptibility to 100 ProTx-II. Horizontal bar indicates 10 ms; vertical bar represents current in nA, with the provided magnitude.
-
Figure 7—source data 1
Table providing values for fits of the data presented in Figure 7.
G-V and SSI relationship data were fitted by a Boltzmann curve. V1/2 provides the midpoint voltage of the calculated curve (in mV) and Vc the unit-less slope, with standard error of the mean (SEM). Right column shows peak conductance after toxin treatment as a fraction of untreated peak conductance with the upper and lower bounds of the 95% confidence interval in parentheses, reflecting the data displayed in the dot plots.
- https://doi.org/10.7554/eLife.10960.021
Figure 8 with 1 supplement
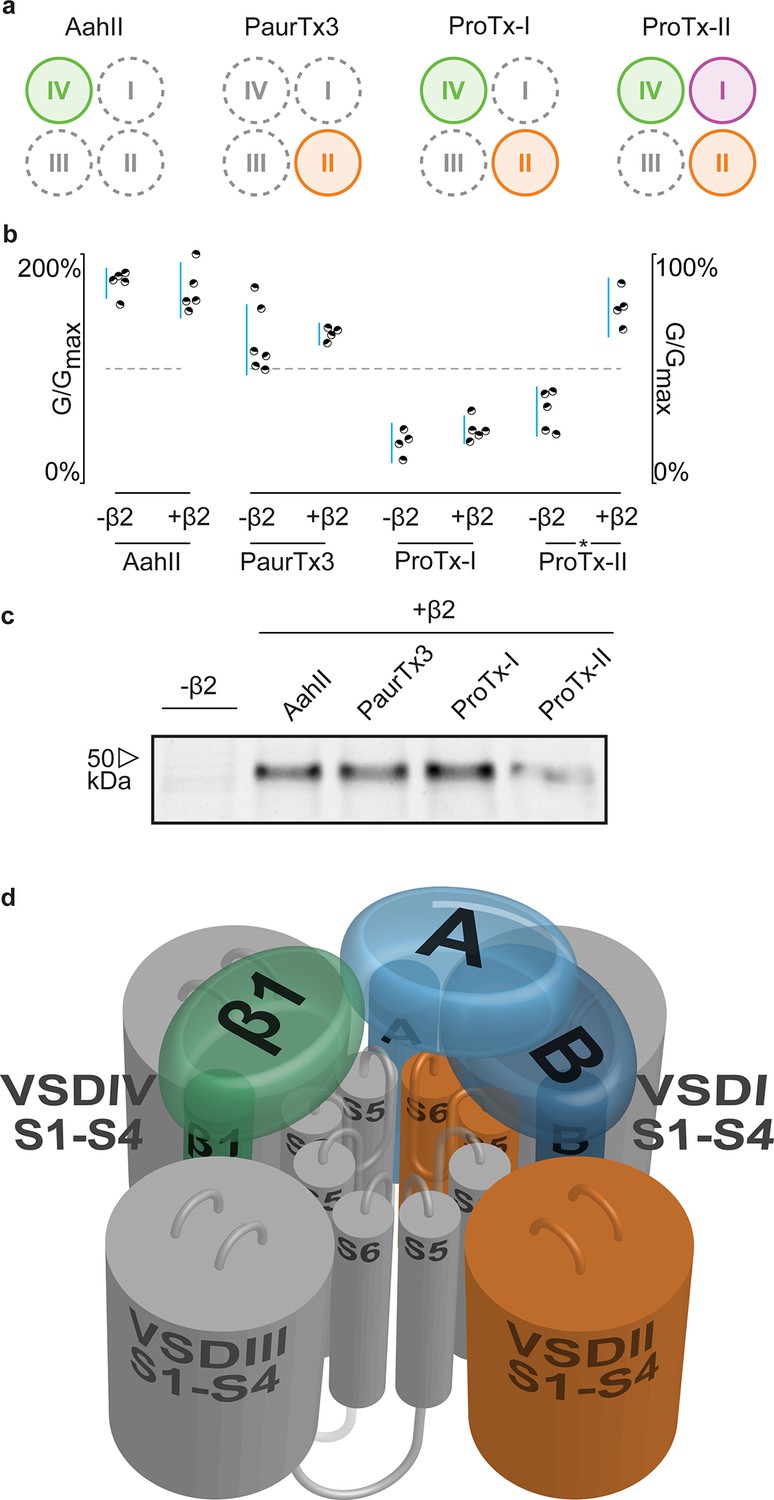
hβ2 influences hNav1.2 VSDI toxin pharmacology.
(a) Cartoon illustrating the binding site of AaHII, PaurTx3, ProTx-I, and ProTx-II within the VSDs of Nav1.2. Binding to a particular VSD is indicated by coloration. (b) Dot plot showing percent of change in peak conductance for hNav1.2 after treatment by each toxin without or in the presence of hβ2. Blue bars represent 95% confidence interval and statistical significance (p<0.01) is noted by an asterisk. c) Western blot probing for the C-terminal myc-tag of hβ2, showing its presence in each experimental condition except the negative control. (d) Shown is a Nav channel illustration consisting of the four VSDs I-IV (S1-S4) and the corresponding pore-forming regions (S5-S6) in grey (DI, III, and IV) or orange (DII) in a clockwise orientation which fits with the data reported here. Such an orientation places a S1-S4 voltage sensor of one domain adjacent to the S5-S6 region of the next. A/B (shades of blue) depicts a putative location of hβ2 in the complex where the subunit can interact with the S5-S6 pore region of DII as well as occlude the ProTx-II binding site on VSDI. In contrast, hβ1 (green) may position itself between VSDIV and VSDIII where it can interact with the S5-S6 region of DI and influence VSDIV movement to alter channel fast inactivation.
-
Figure 8—source data 1
Table providing values for fits of the data presented in Figure 8 and Figure 8—figure supplement 1.
G-V and SSI relationship data were fitted by a Boltzmann curve. V1/2 provides the midpoint voltage of the calculated curve (in mV) and Vc the unit-less slope, with standard error of the mean (SEM). Right column shows peak conductance after toxin treatment as a fraction of untreated peak conductance with the upper and lower bounds of the 95% confidence interval in parentheses, reflecting the data displayed in the dot plots.
- https://doi.org/10.7554/eLife.10960.023
Figure 8—figure supplement 1
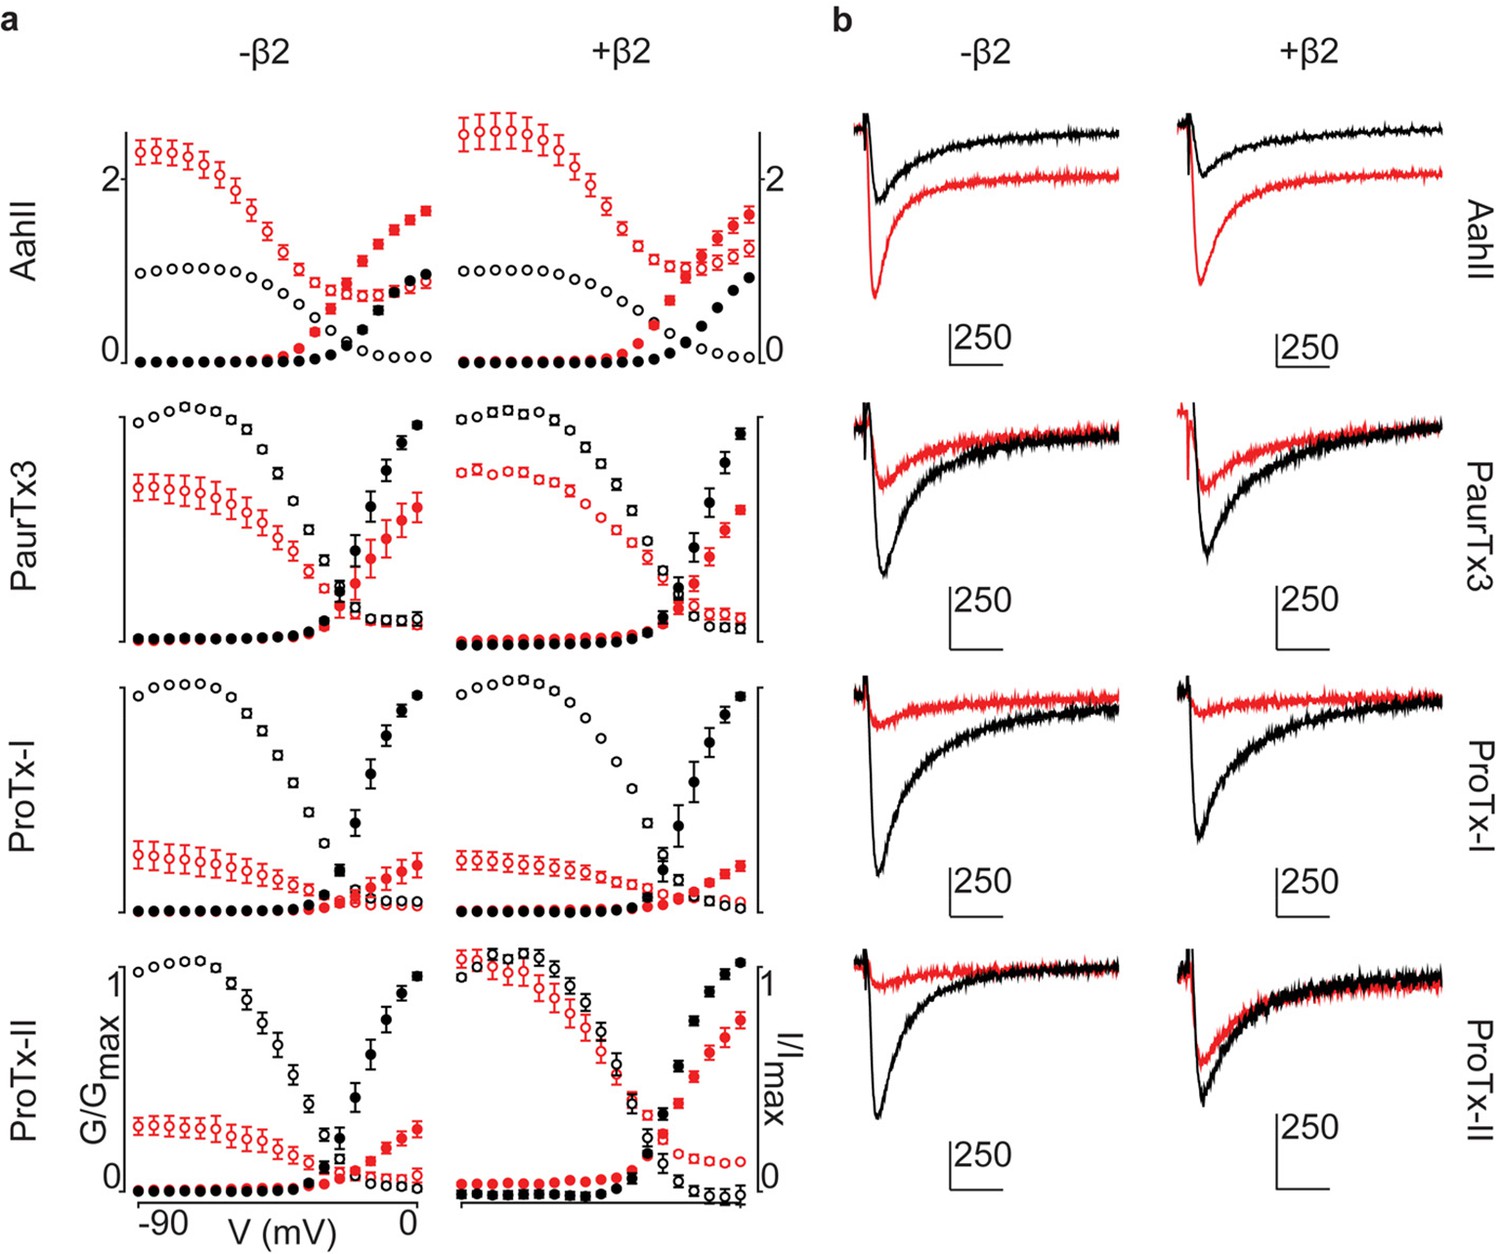
Activity of spider and scorpion toxins on hNav1.2.
G-V and SSI relationships for hNav1.2, with or without hβ2, treated with toxins (100 nM) with known binding sites. (a) G-V and SSI curves are provided for each of the four toxins tested. Black indicates control values and red illustrates toxin effect. Filled circles are used for G-V curves and open circles for SSI. (b) Representative traces after depolarization to -15 mV from -90 mV for each toxin tested on hNav1.2 with black indicating pre-toxin currents and red showing currents after toxin application. Horizontal scale bar indicates 10 ms whereas vertical bar shows current magnitude in nA, with scale given by the attached number.
Download links
A two-part list of links to download the article, or parts of the article, in various formats.
Downloads (link to download the article as PDF)
Open citations (links to open the citations from this article in various online reference manager services)
Cite this article (links to download the citations from this article in formats compatible with various reference manager tools)
Binary architecture of the Nav1.2-β2 signaling complex
eLife 5:e10960.
https://doi.org/10.7554/eLife.10960


