Odor-identity dependent motor programs underlie behavioral responses to odors
- Duke University, United States
Figures
Figure 1 with 3 supplements
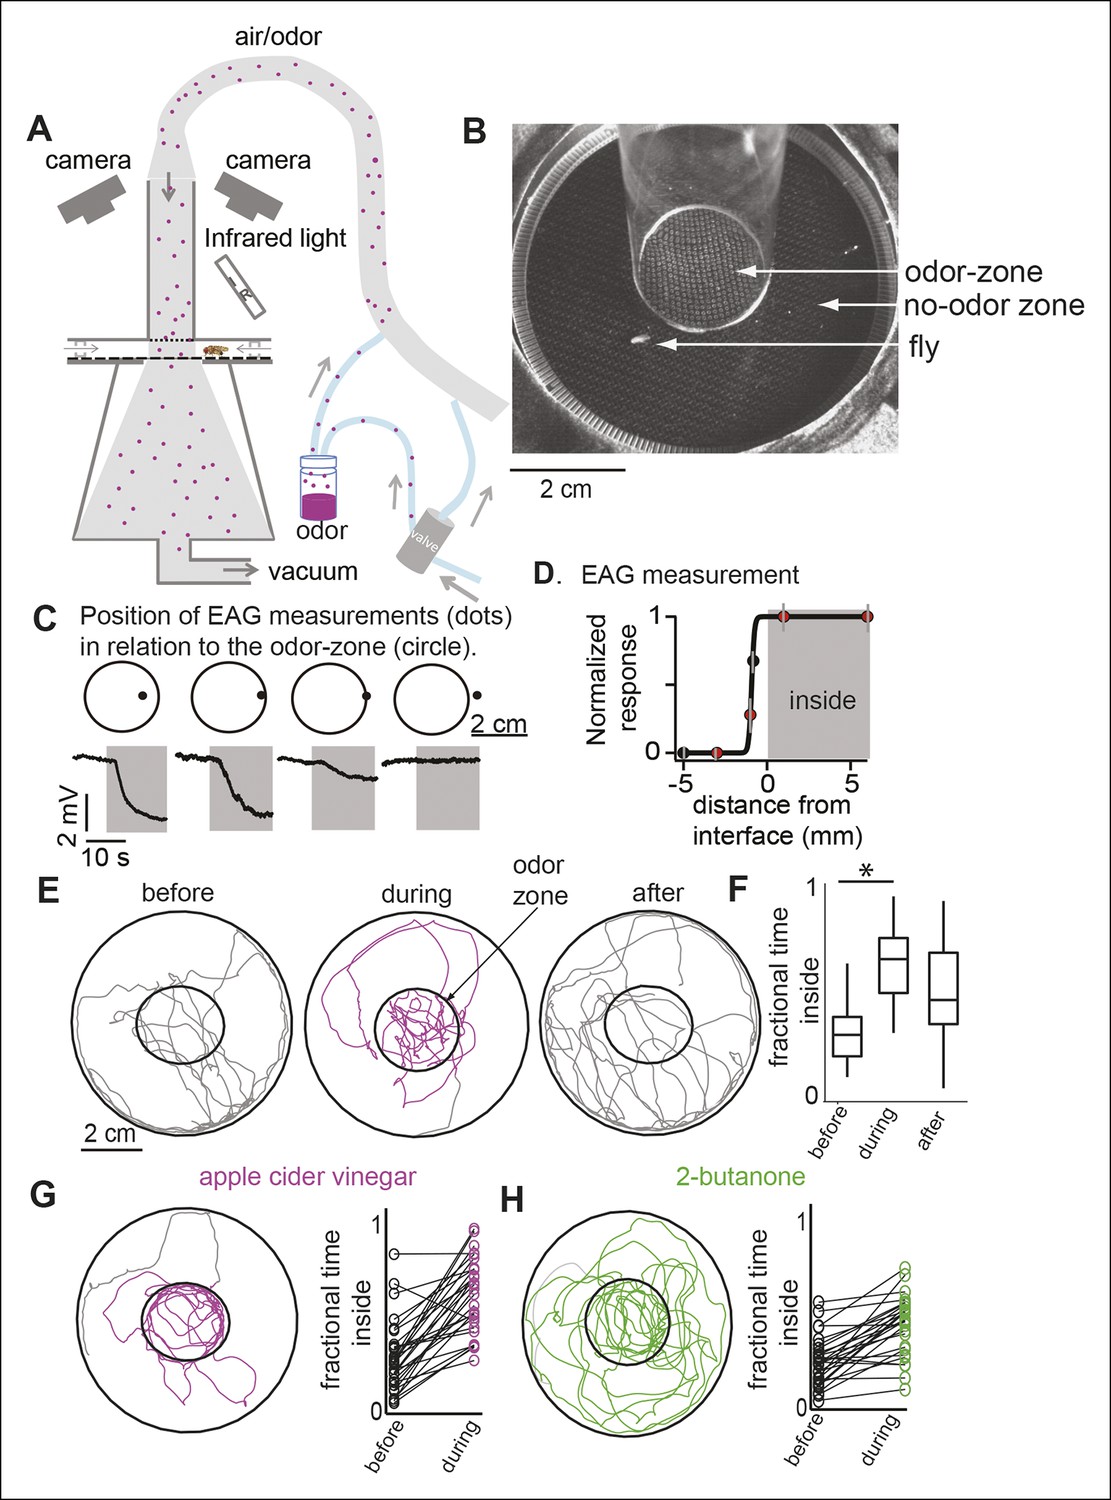
A novel behavioral paradigm for measuring odor-evoked change in fly’s locomotion.
(A) Schematic of the behavioral arena. (B) Top view of the chamber. (C) Electroantennogram (EAG) recording at different locations (indicated by a dot) shows a large EAG response when the measurement point lies within the odor-zone (denoted by circle). Response decreases when just the head of the fly is outside the odor-zone and is completely abolished 3 mm away from the odor-zone. (D) EAG response plotted as a function of distance from the nominal interface (n = 5). Red dots correspond to the data points shown in C. (E) Sample tracks of a fly in 3 min periods before, during and after presentation of ACV (left). (F) Boxplots (n = 29) showing that flies spend more time inside the odor-zone. (G) Track of another fly during ACV presentation. Connected dots represent the fractional time spent inside by a single fly before and during odor presentation (right). (H). Sample track of a fly during 2-butanone presentation shows that it is qualitatively different from the tracks in presence of ACV (left). Flies spend more time inside the odor-zone in the presence of 2-butanone (right, n = 31).
Figure 1—figure supplement 1
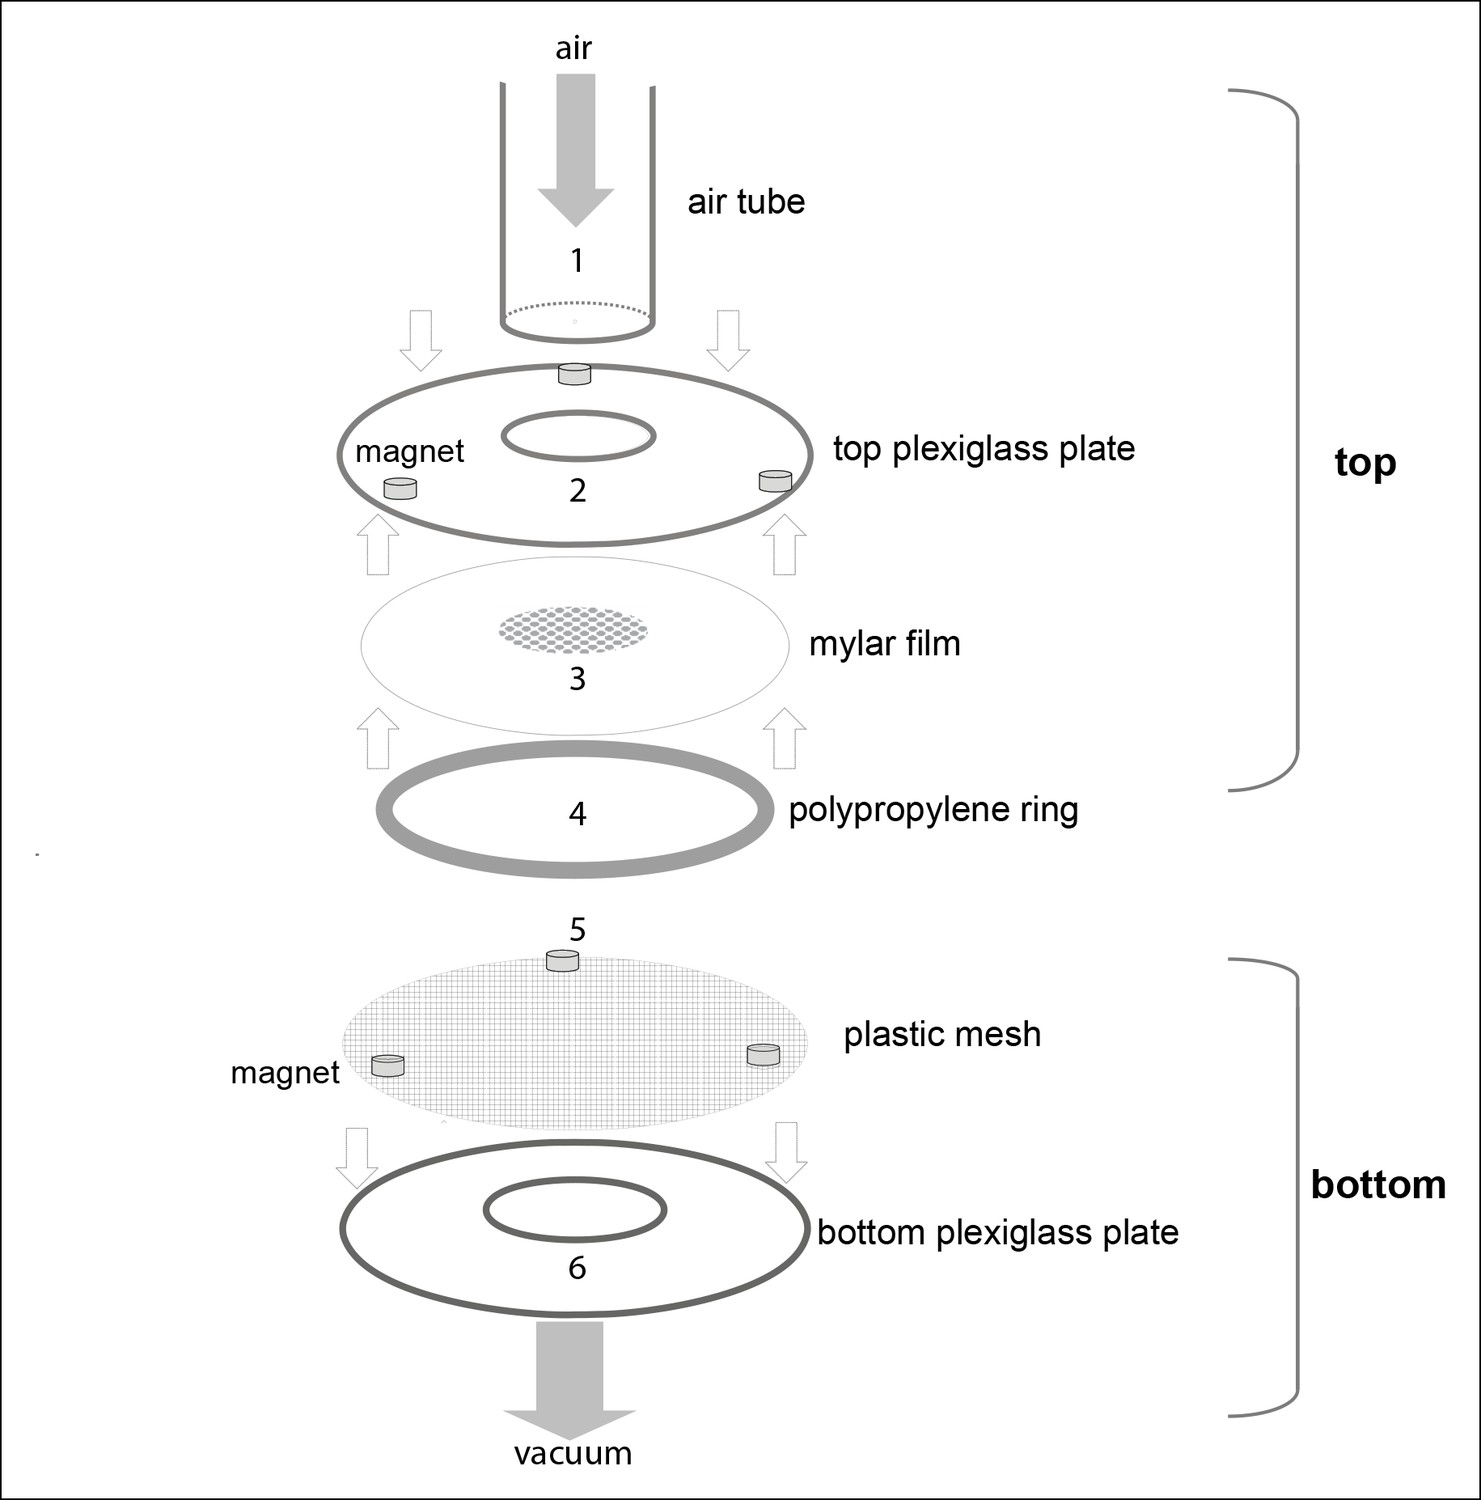
A detailed schematic showing the parts of the behavioral chamber.
The final chamber consisted of top and bottom assemblies. The bottom assembly was always fixed in place. The top assembly was replaced after a fly was introduced in the arena. During the experiment, the top and bottom assemblies were held together by magnets. Top assembly: Air tube (1) (ID 2.2 cm, OD 2.4 cm) was glued to a plexiglass plate. The top plexiglass plate (2) is glued to a Mylar film (3) which was machined such that the center was lined with holes 0.5 mm diameter with 1 mm spacing. The film served as a thin, almost featureless mesh through which odor/air could pass from the air tube to the arena but flies could not escape. The space between the two plexiglass plates is 3 mm. A polypropylene ring (4) (6.4 cm in diameter and 3 mm in height) was machined to have 1 mm holes separated by 1.5 mm to allow radial air flow. Bottom assembly: A plastic mesh (5) was attached to the bottom plate to create a surface on which a fly could walk. The polypropylene ring, plastic mesh and bottom plexiglass plate (6) were glued together.
Figure 1—figure supplement 2
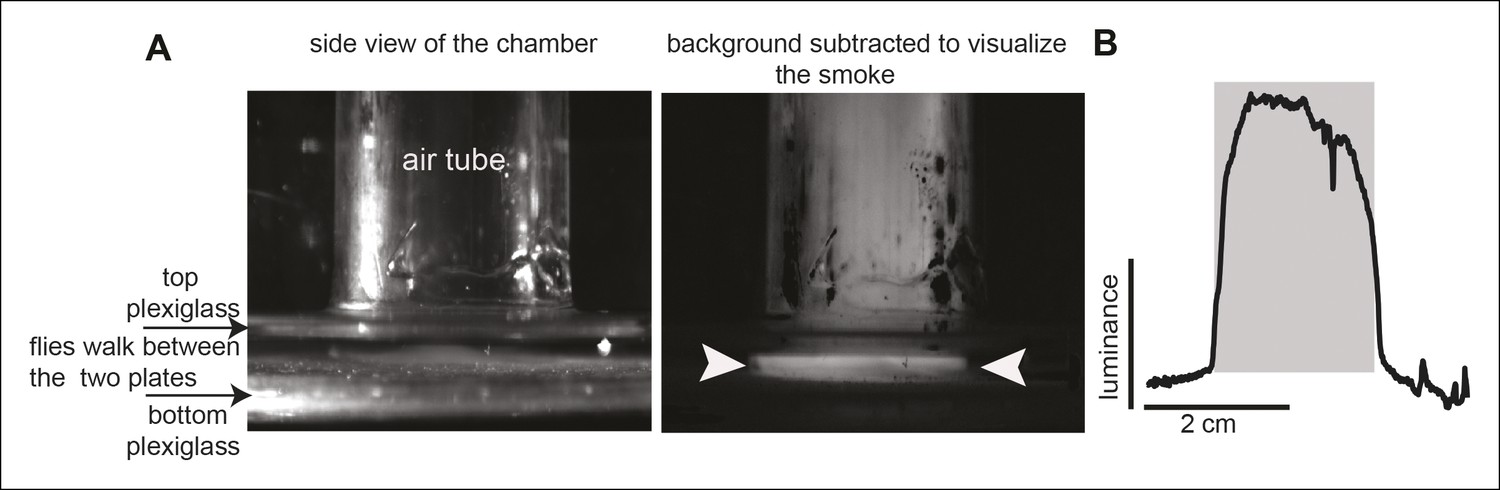
Flow visualization shows a precise interface between odor zone and no odor zone.
(A) The left image shows a side view of the behavioral arena. The field of view is enlarged to visualize the region where the inlet air tube attached to the arena. On the right, a background subtracted image of the chamber taken while smoke was introduced through the air tube. The photo shows that smoke is limited to a disc about the same size as the diameter of the inlet tube, implying that flow through the inlet tube is spatially limited. The sharp interface between the odor zone and no-odor zone is marked with arrowheads. (B). A plot of luminance (due to the smoke) along the line connecting the two arrowheads shows that the boundary between smoke-filled region and no odor zone is sharp. The nominal odor zone is shaded grey.
Figure 1—figure supplement 3
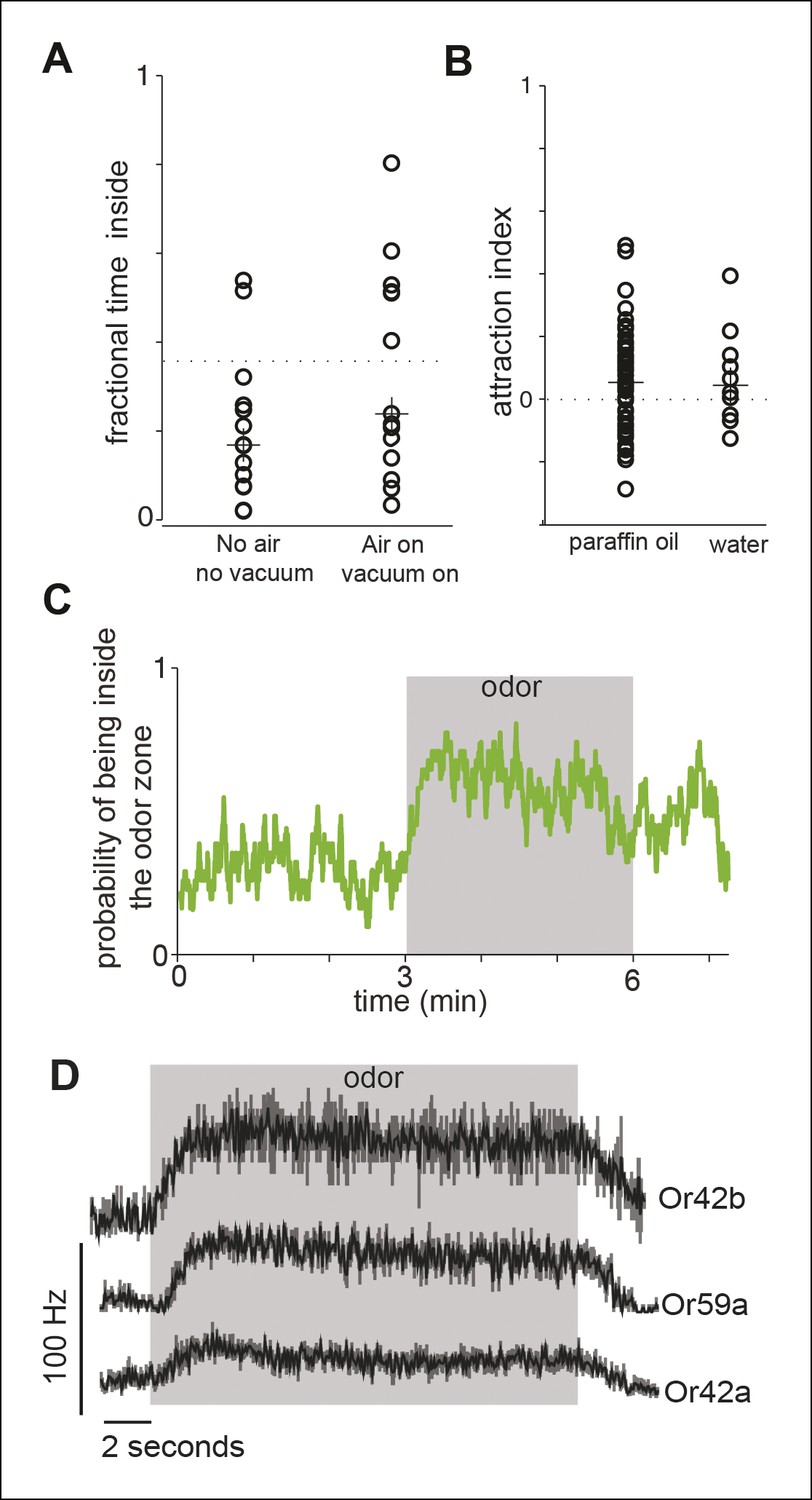
Control experiments.
(A) We assessed the effect of air and vacuum on the distribution of the flies in our arena. Each data point represents the fractional time spent inside the odor-zone by a single fly in a 3 min period when the air and vacuum is off (No air, no vacuum), and when it is on (air on, vacuum on). The dotted line represents the fractional time a fly would spend inside the odor zone if they were randomly distributed. There is no statistical difference in the fractional time a fly spends inside the odor-zone before and after air and vacuum were turned on. These data represent the effect of air right after it is turned on when the effect of air should be the largest. Because the air/vacuum are on throughout the course of the experiment, any effects of air during actual experiment should be even less. (B) Both our solvent controls - water and paraffin oil cause little change in the distribution of the fly as measured by the attraction index (see Materials and methods). The dotten line represents no change from the before period. The median attraction index (marked with crosses) is not significantly different from 0. (C) The probability that a fly is inside the odor zone (n = 29) remains high throughout the 3 minutes when ACV0 is on. Thus, the flies are not desensitized in the 3 min that the odor is on. D. PSTH’s showing spike responses of three ORNs to ACV shows that there is little desensitization of the ORN response during the time frame of the behavioral experiment.
Figure 2
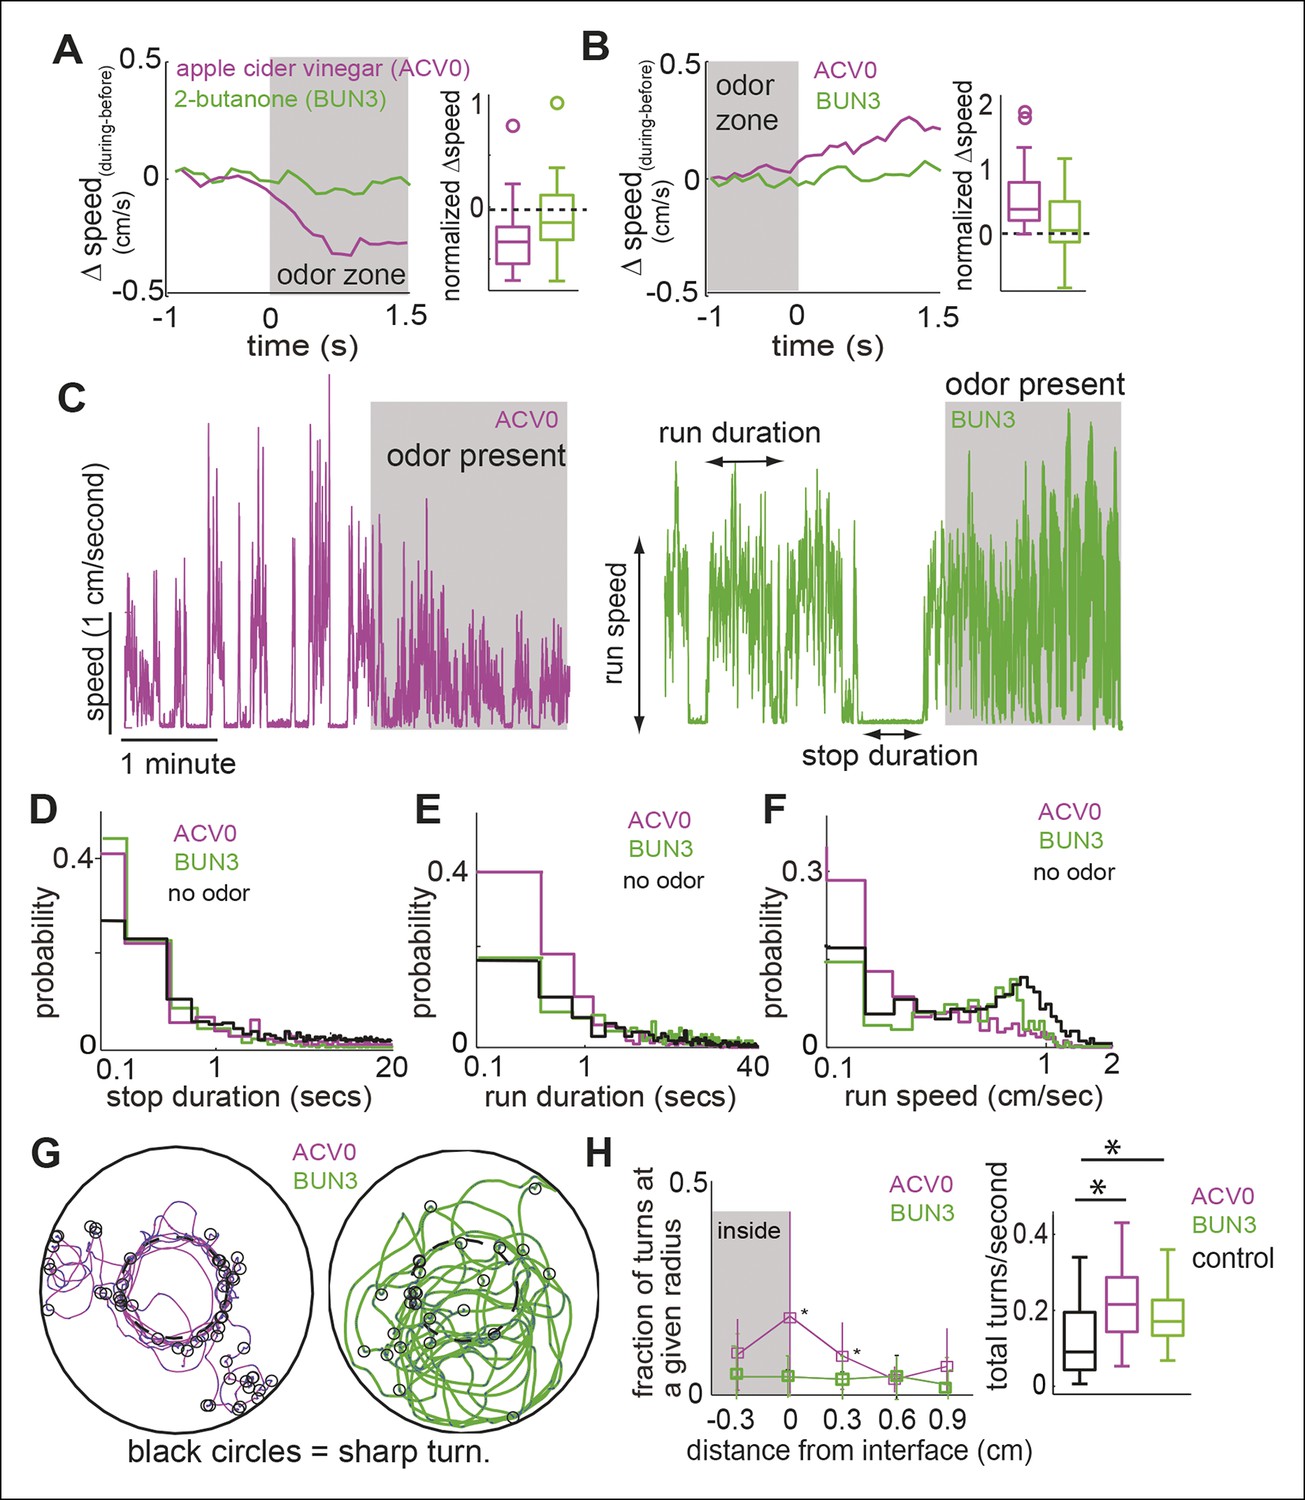
Different attractive odors modulate different motor parameters.
(A) Flies decrease their speed when they enter the odor-zone in the presence of ACV0 but not BUN3. Left: Mean changes in speed between before and during periods. (n = 29 for apple cider vinegar (ACV0), n = 31 for 2-butanone [BUN3]). Right: Box plots showing the distribution of speed differences upon entering the odor zone. Normalization process in Table 1. (B) Same as in A except that change in speed as the fly leaves the odor-zone is plotted. (C) Sample trace showing speed as a function of time for a fly in response to ACV0 and another fly in response to BUN3. Stop duration decreases for both ACV0 and BUN3 but run duration and run speed only decreases for ACV0. Shaded regions represent the time during which odor is present . (D,E,F) Group statistics for stops and runs. (Black: before period (726 runs and 725 stops from 60 flies), magenta: ACV0 (n = 649), Green: BUN3 [n = 296]). Distribution of stop durations is significantly different for both ACV0 and BUN3 (p <10-9 for both ACV and 2-butanone, KS test). Run duration and run speed is only different for ACV0 (p <10-9 for ACV, p=0.08 for BUN3). (G) A fly preferentially executes sharp turns (marked by open black circles, see Materials and methods) at the interface between the odor-zone and no odor zone in the presence of ACV0 but not in the presence of BUN3. Traces are tracks of a single fly. (H) Left: Group data showing that flies preferentially execute turns right at the odor interface in ACV0 but not BUN3 (p <0.001 for both significantly different points). Right: Total turn frequency increases in response to both odors. Black: before period (n = 60), magenta: ACV (n = 29), Green: 2-butanone (n = 31).
Figure 3
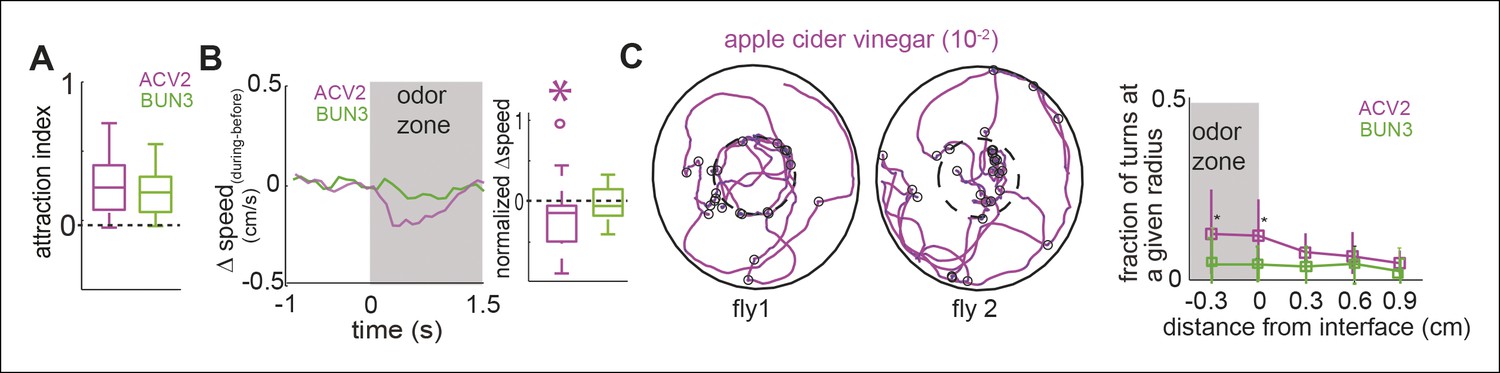
Two similarly attractive odors modulate different sets of motor parameters.
(A) Attraction index showing that the fly is similarly attracted to two odors—apple cider vinegar (10-2, ACV2, n = 34) and BUN3 (n = 31). Dotted line marks expected value when there is no odor modulation. (B) Decrease in speed upon entering the odor-zone is observed with ACV2 but not with BUN3 (left). Box plots showing the distribution of speed differences upon entering the odor zone (right). Normalization described in Table 1. (C) Left: 2 examples of walking trajectory in ACV2 trials during the presence of ACV2 with open black circles marking sharp turns. Right: Increased rate of sharp turns at the odor border is still observed with ACV2. 2-butanone data is replicated from Figure 2 for comparison.
Figure 4 with 1 supplement
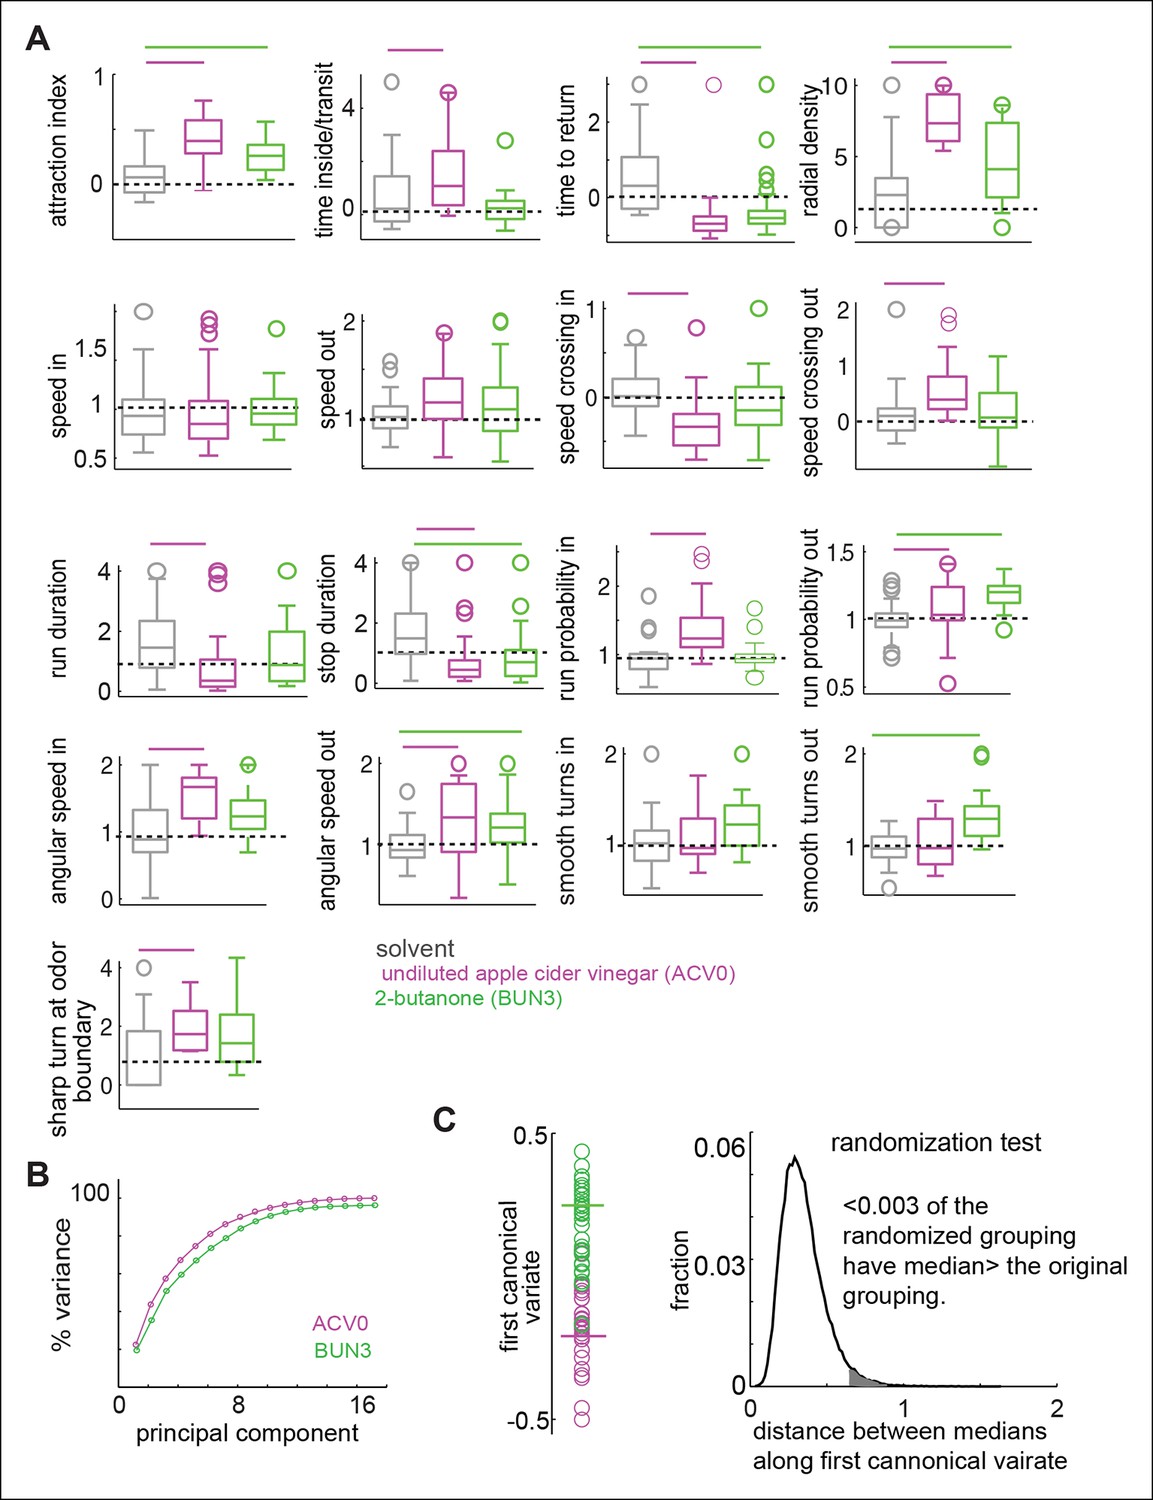
Odors independently modulate multiple behavioral parameters in an odor dependent manner.
(A) 17 parameters which are all significantly modulated by ACV0 at p <0.05 (each parameter is described in detail in Materials and methods). Bars on top indicate the variables that are significantly different from the solvent control in a rank sum test after Bonferroni correction for multiple comparisons (p <0.003). Dashed line marks the expected value when there is no odor modulation. (B) Principal component analysis on the 17-dimensional odor space shows that ACV0 and BUN3 both activate multiple independent motor programs. (C) Left: The first canonical variates for the response of individual flies to ACV0 (magenta) and BUN3 (green). The responses due to BUN3 and ACV0 are clearly segregated along the first canonical variate. Each circle is a single fly. Right: The distribution of distances between medians in 50,000 trials in which odor labels were randomized. Less than 0.003 (0.3%) of the trials had medians greater than the original distribution (gray shaded area).
Figure 4—figure supplement 1
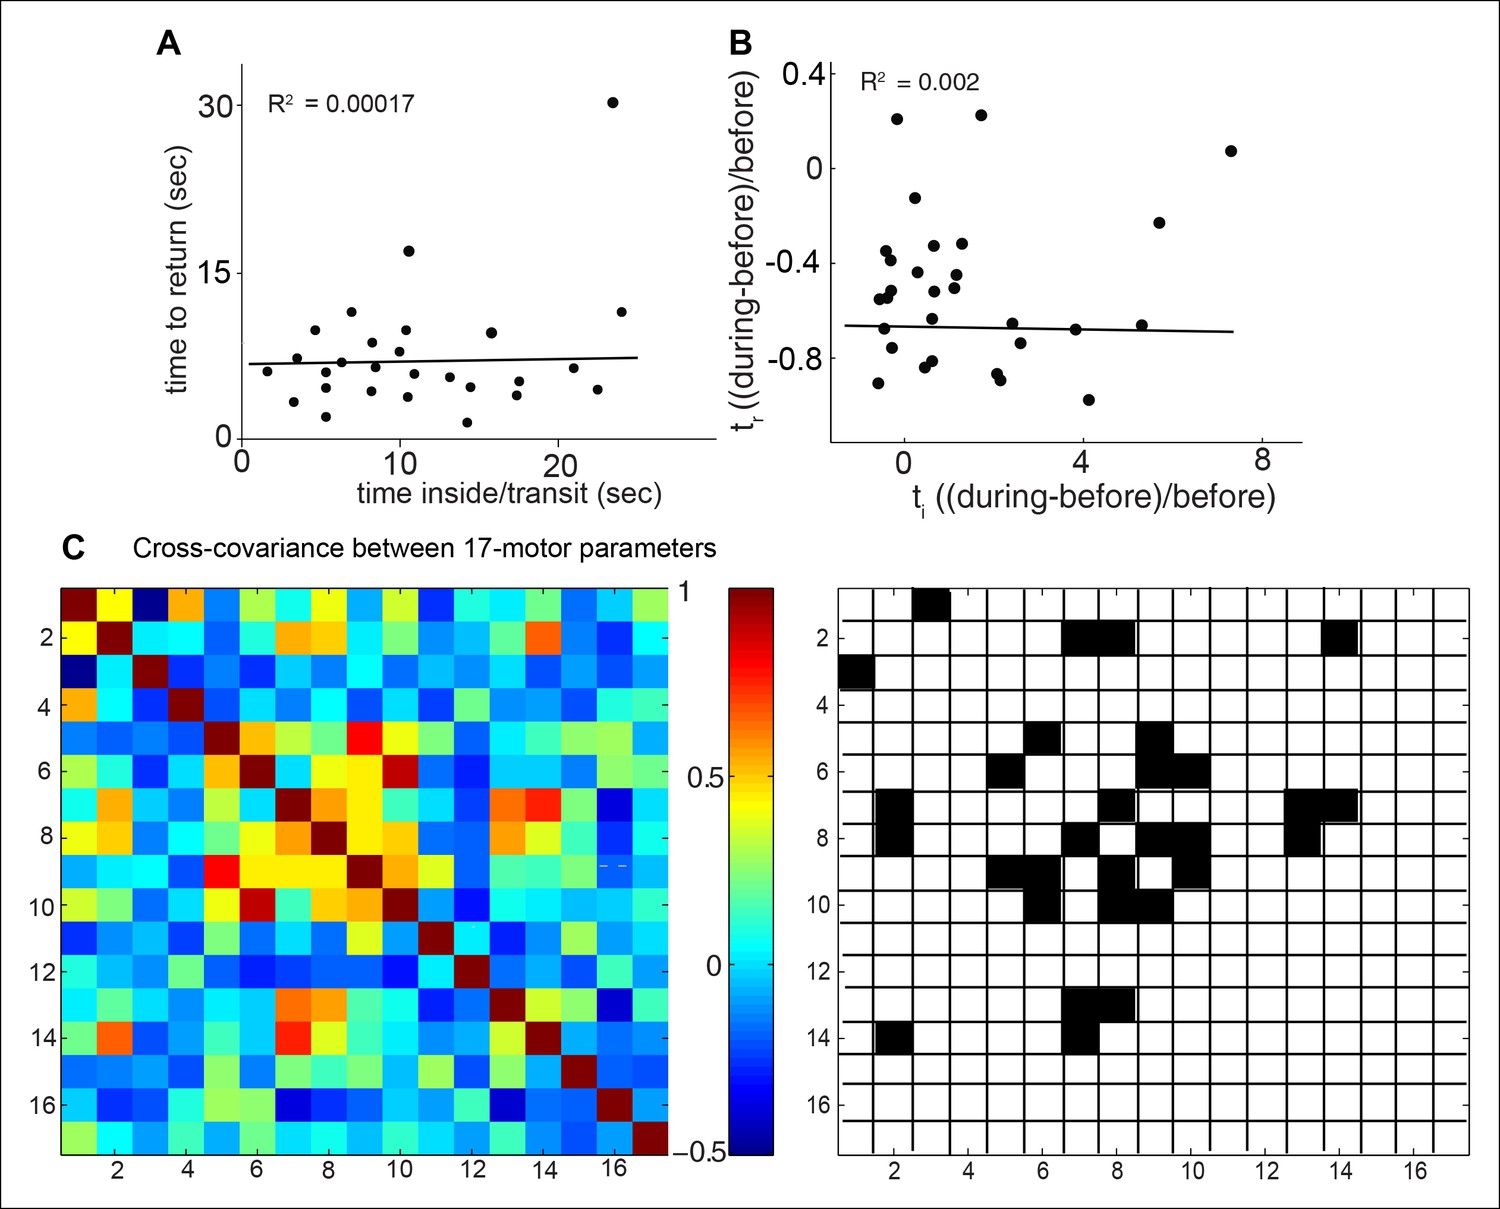
Evidence for independence of different motor parameters.
If attraction is a singular motor program, then we would expect other motor programs to scale with the level of attraction. We examine the linear correlations between these parameters for a fly’s response to ACV0. (A) On a fly-by-fly basis, time to return is uncorrelated with time spent inside implying that these two programs are independent. Line represent the best linear fit to data. (B) Same data as in A but normalized to show fractional change in the two parameter. Line represent the best linear fit to data. (C) Cross-covariance between the parameters in our 17-parameter description of behavior show that most parameters are not significantly correlated (left). Only 15 out 136 pairwise comparisons are significantly correlated (right). 1. attraction index, 2. time inside/transit, 3. time to return, 4. radial density, 5. speed in, 6. speed out, 7. speed crossing in, 8. speed crossing out, 9. run duration, 10. stop duration, 11. run probability in, 12. run probability out, 13. angular speed in, 14. angular speed out, 15. smooth turns in, 16. smooth turns out, 17. sharp turn at odor bounary.
Figure 5 with 2 supplements

Two similarly attractive odors modulate different sets of motor parameters.
(A) 17 motor parameters show that the parameters modulated by two similarly attractive odor—ACV2 and BUN3 are different. Bars on top indicate the variables that are significantly different from the solvent control in a rank sum test after Bonferroni correction for multiple comparisons (p <0.003). Dashed line marks the expected value when there is no odor modulation. (B) Canonical variate analysis shows that the behavioral response to ACV2 and BUN3 are distinct along the first canonical variate. (C) Permutation tests show that less than 4% of trials in which the odor labels are randomized had median distances greater than that of the original grouping.
Figure 5—figure supplement 1
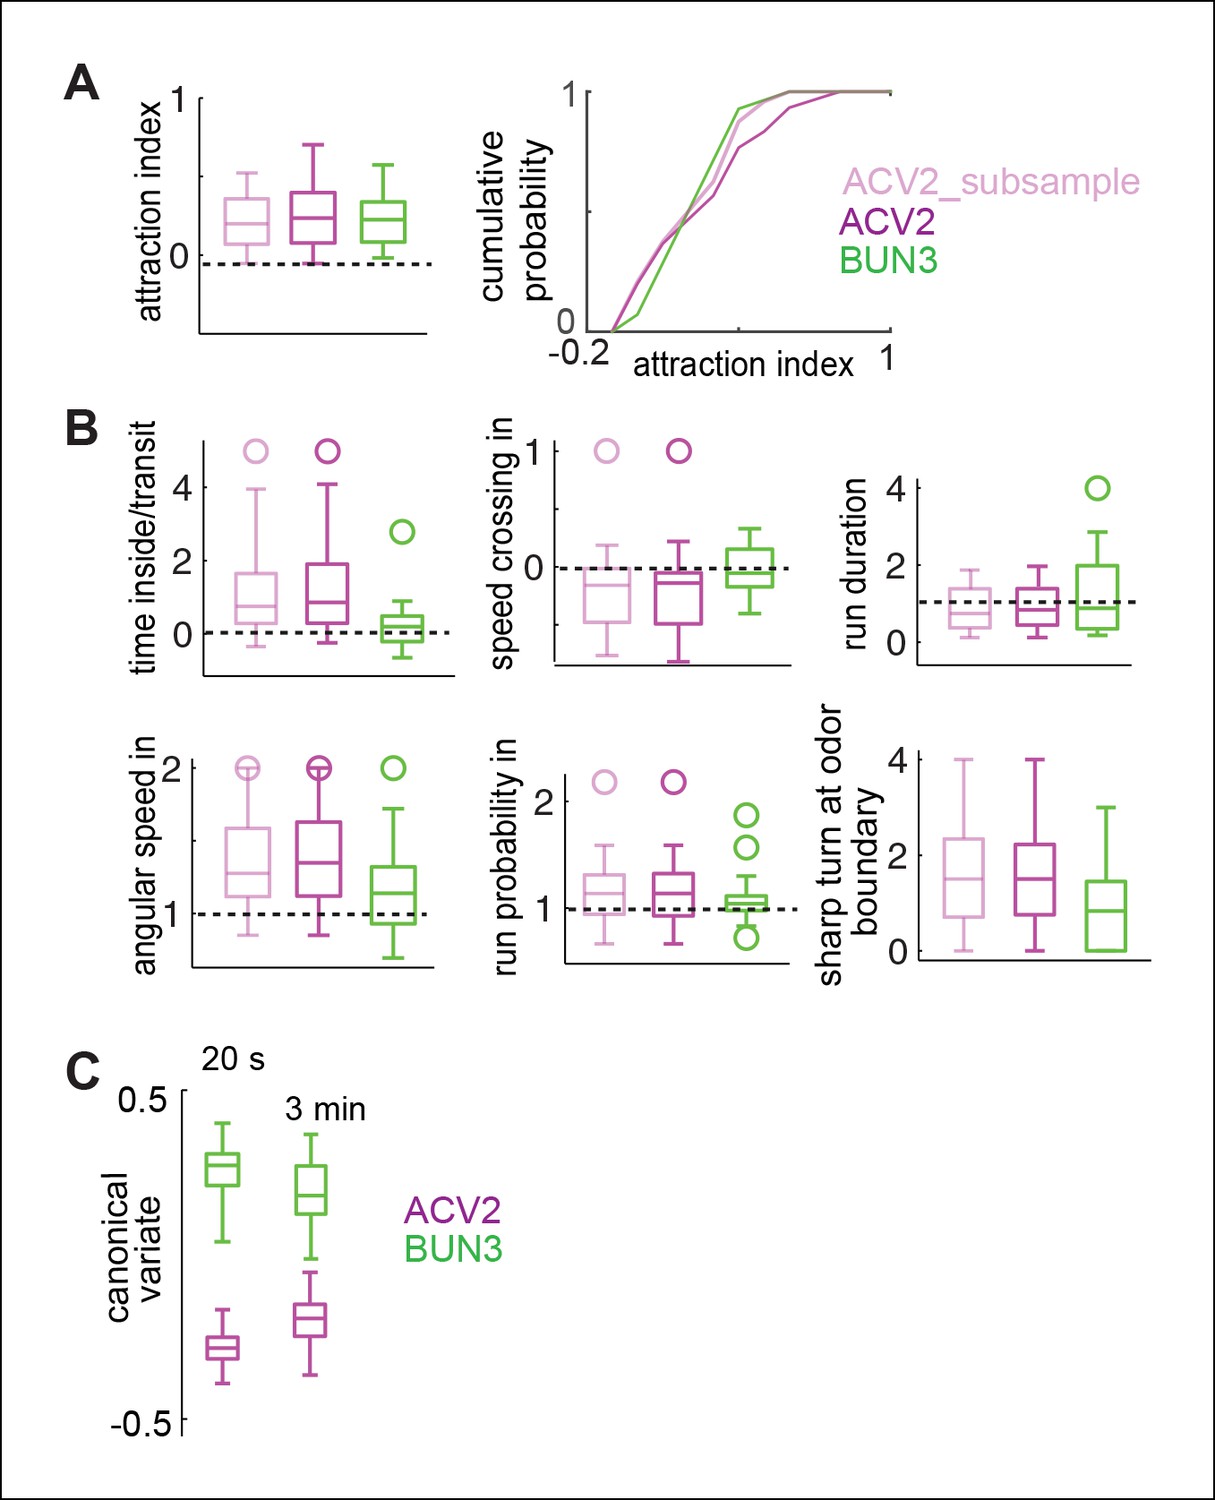
Differences in behavior due to BUN3 and ACV2 is not due to a few flies which are very attractive to ACV or due to different temporal evolution of behavior in the two odors.
(A,B). Subsampling of ACV2 flies does not affect behavioral differences. (A) Shows the subsampling. We removed the flies which contributed to the long tail in the distribution of attraction index. This can be observed in the boxplot but is more clear in the cumulative probability distribution. (B) There is some change in the distribution. Even with the subsampling, all 6 parameters which are modulated more strongly by ACV2 than by BUN3 were still modulated significantly strongly in the subsampled population. Apart from being an excellent control experiment, this experiment adds to other evidence which suggests that attraction is not predictive of other behavioral parameters measured here. (C) Behavior due to ACV2 and BUN3 are even more distinct in the first 20 s after odor exposure. We performed our 17-parameter analysis but with only the first 20 s after odor exposure rather than the entire 3 min period. Canonical variate analysis on this 17-parameter space shows that the median distance between behaviors is larger in the first 20 s compared to the entire 3 min odor period.
Figure 5—figure supplement 2
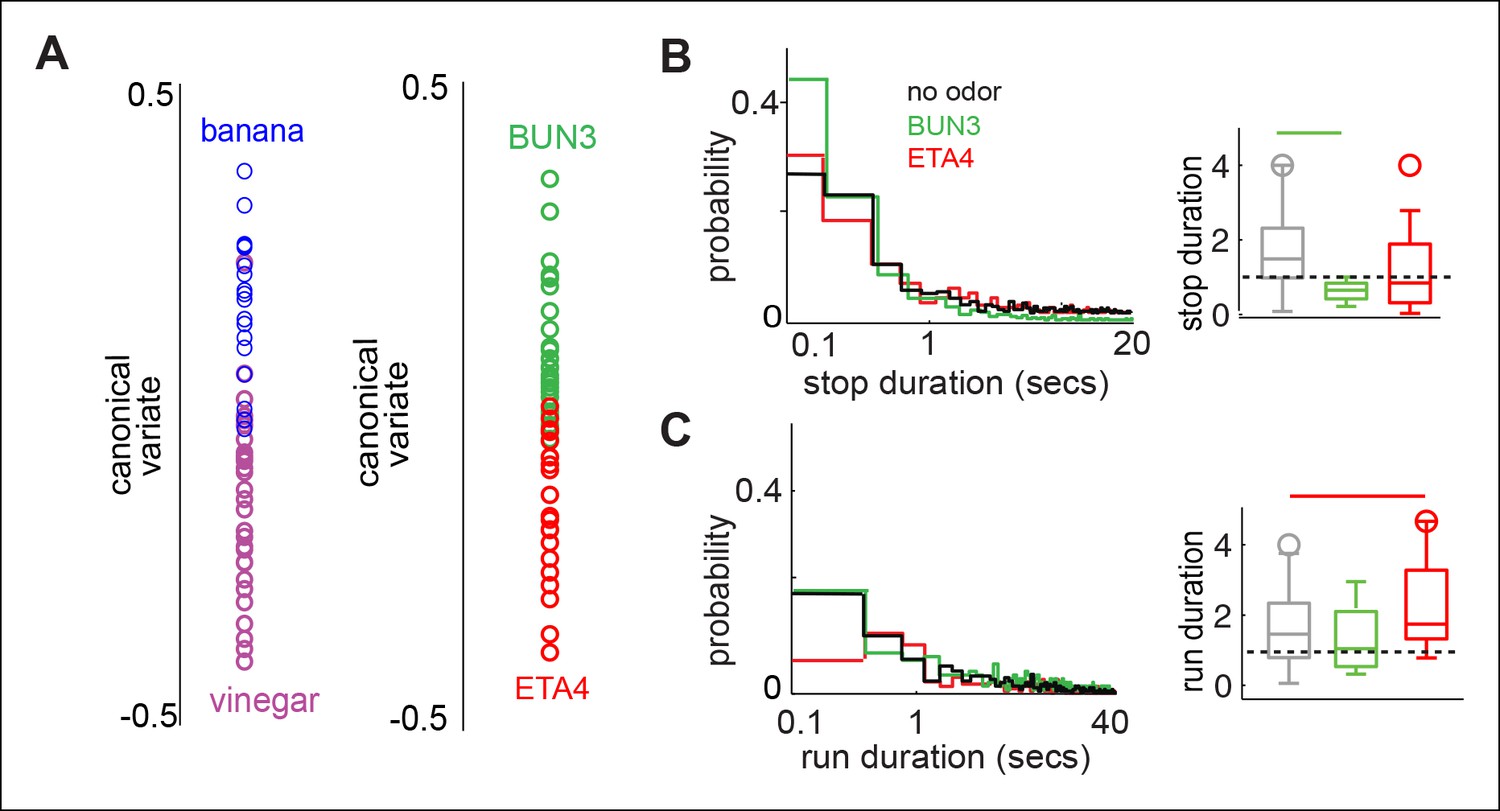
Differences in the motor parameters modulated are not simply due to differences between simple and complex odors.
(A) Behavioral responses due to two complex food odors - ACV and banana are distinct along the first canonical variate. Two monomolecular odors, 2-butanone (BUN3) and ethyl acetate (at a concentration of 10-4, ETA4) also exhibit different behaviors along the first canonical variate. (B) Left: Distribution of stop duration pooled from all the stops in multiple flies in no odor (black, n = 60), 2-butanone (green, n = 31) and ethyl acetate (red, n = 23). Right: Box plots showing the distribution of median stop durations across multiple flies. Stop duration decreased in 2-butanone but not in ETA4. (C) Left: Distribution of run duration pooled from all the runs in multiple flies. Right: Box plots showing the distribution of median run durations across multiple files. Run duration increases in the presence of ETA4 but not in BUN3. Thus, a given parameter such as run duration could increase, decrease or be constant in the presence of different attractive odors.
Figure 6 with 2 supplements

Activation of single ORN class leads to a change in a subset of motor parameters.
(A) Schematic representation of ORNs activated by ACV0. (B) Ethyl acetate at low concentrations activate only Or42b-ORNs. (C) Behavioral modulation by activation of Or42b-ORNs alone using low concentration (10–8) ethyl acetate (ETA8). ACV0 data is shown for comparison. Flies show increased angular speed inside the odor-zone and have a shorter run duration in response to ETA8 compared to the solvent control. Significantly modulated parameters (in a ranksum test after Bonferroni correction) are enclosed in a shaded box. (D) 2-butanone at 10–5 (BUN5) activates only Or42a-ORNs. Activating Or42a-ORNs results in modulation of three parameters. No other parameters were modulated. Only the significantly modulated parameters of the 17 are shown.
Figure 6—figure supplement 1
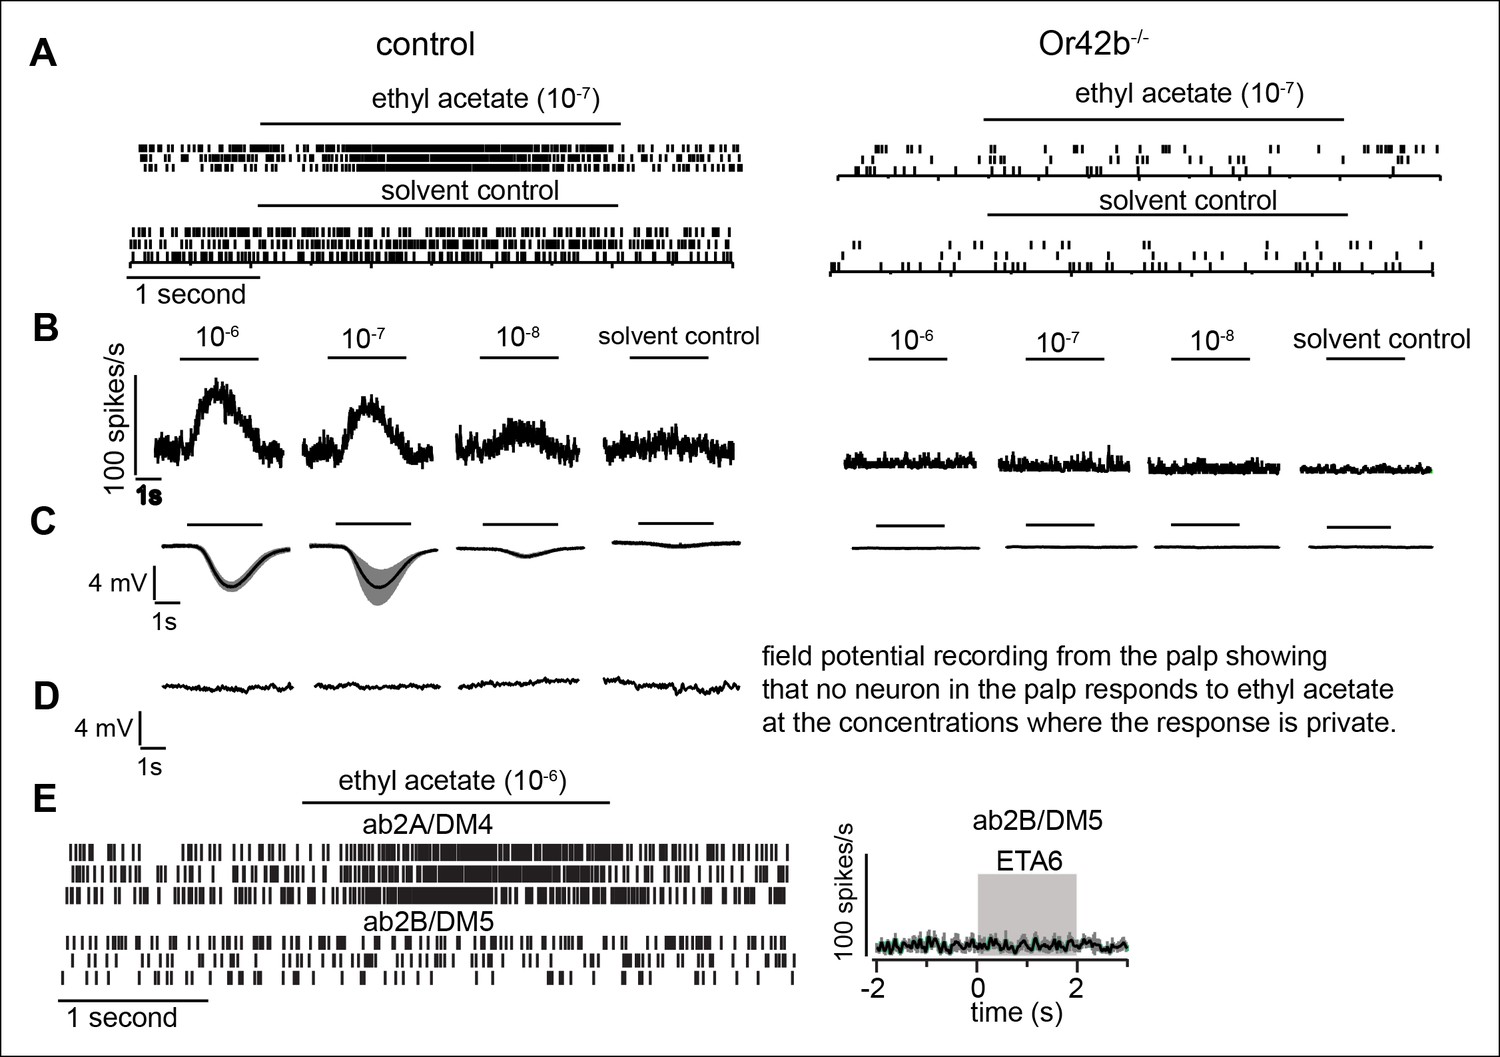
Ethyl acetate at low concentrations nearly saturates Or42b-ORNs without activating any other receptor.
To establish that low concentration of ethyl acetate activates Or42b-ORNs and no other ORNs, we first show that Or42b-ORNs are activated by low ethyl acetate concentration. Next we show that there is a large change in the field potential recordings from the antennae in the Or42b-mutants implying that Or42b . (A) Raster plot showing spikes of Or42b- and Or92b-ORNs, both of which are present on the ab1 sensilla. It was unnecessary to sort between these spikes. Ethyl acetate at 10-7 (ETA7) results in a large increase in the firing rate which was completely abolished in the Or42b mutant implying that Or42b-ORNs are activated by ETA7. Spontaneous activity is dramatically reduced in Or42b mutant because the Or42b-ORNs are not spontaneously active. (B) Average response of Or42b-ORN at low concentration of ethyl acetate. (C) Field potential recordings from the antennae that is a measure of responses from all the neurons in the antennae shows a robust response to low concentrations of ethyl acetate which is abolished in the mutant. (D) Field potential recording from the palp shows that no neuron in the palp responds to concentrations of ethyl acetate below 10-–6 dilution. (E) Recordings from ab2B sensilla which expresses Or85a receptor shows that ethyl acetate at 10–6 does not activate ab2B ORNs projecting to DM5 glomerulus. Raster plot on the left and PSTH on the right. This is significant because it rules out the possibility that the lack of attraction observed in response to ETA at low concentration is due to the activation of DM5 glomerulus resulting in repulsion and canceling attraction to activation of Or42b-ORNs.
Figure 6—figure supplement 2
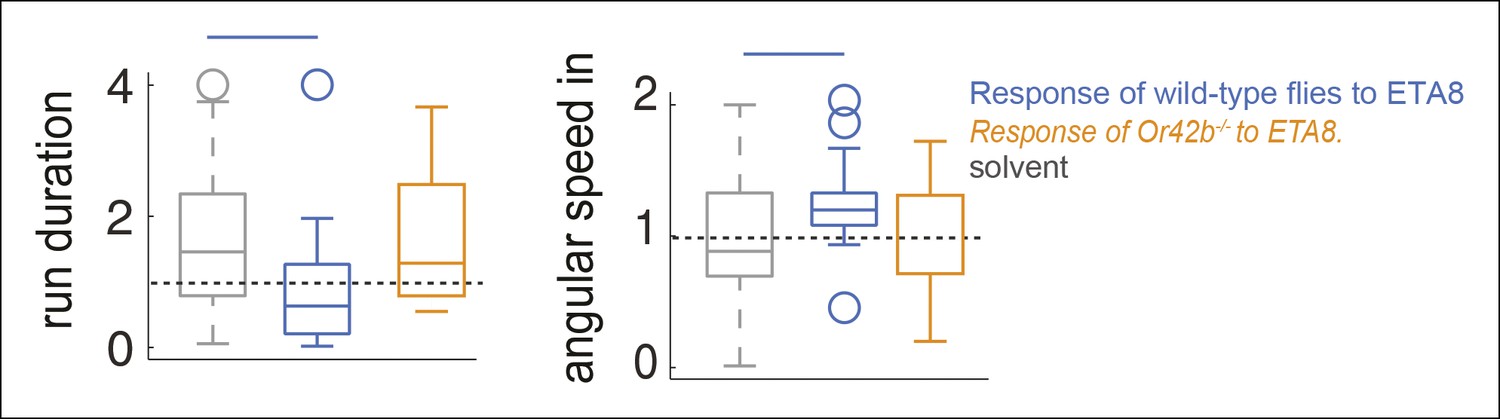
Behavioral response to ETA8 is abolished in Or42b mutants.
In figure 6, we show that activating Or42b-ORNs alone using ETA8 results in a change in run duration and angular speed inside. If Or42b-ORNs are indeed responsible for the behavioral effects of ETA8, then the modulation of these parameters should be abolished in the Or42b mutant. In this supplement, we show that the behavioral response to ETA8 is abolished in the Or42b mutant. These data further support the idea that activation of Or42b-ORNs affect run duration and angular speed inside.
Figure 7

Higher concentration of ACV activates more ORNs and recruits more motor parameters.
(A) PSTHs showing the response of the Or42b-ORN to ACV and ethyl acetate (mean ± SEM, n = 5-7). (B) At all spike rates, ACV is more attractive than ETA implying that attraction due to ACV is not due to activation of Or42b-ORNs alone. (C–E) Motor parameters modulated by increasing concentration of ACV. Only parameters that are modulated are shown.
Figure 8 with 1 supplement
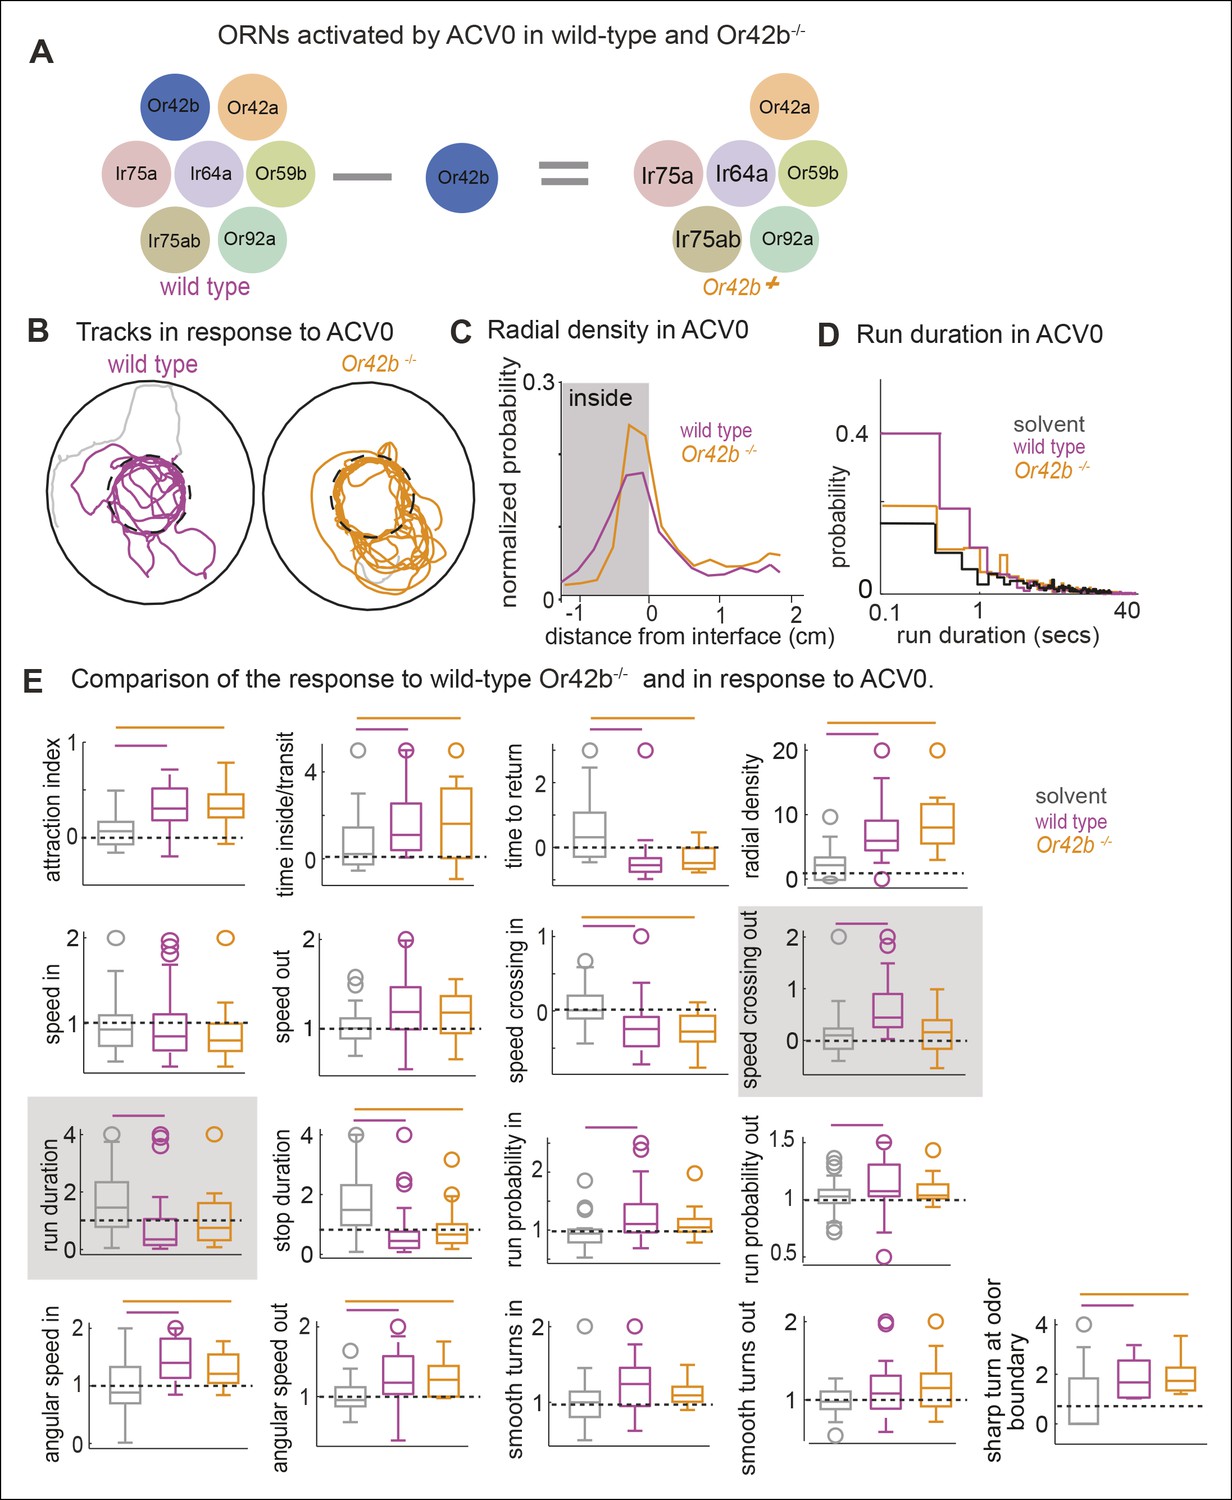
Mutating a single ORN class does not affect attraction to ACV0 but changes certain motor parameters.
(A) In the Or42b mutant, a single ORN class is non-functional. (B) Sample tracks showing that both wild type and Or42b-/- flies are attracted to ACV. Tracks also show that the mutant fly is closer to the odor interface than the wild-type flies. (C) Mean radial density. Although both wild type and Or42b-/- flies are attracted to ACV, mutant flies show a sharper distribution at the interface (KS test p <0.001). (n = 29 for control, n = 25 for Or42b mutant) (D) Run duration is not modulated in the Or42b mutants. (E) 17 motor parameters of wild type and Or42b-/- flies in response to ACV. Run duration and speed while crossing out are modulated more strongly in the wild-type compared to the mutant. Shaded box show parameters which are significantly modulated in the wild type but not Or42b mutant.
Figure 8—figure supplement 1
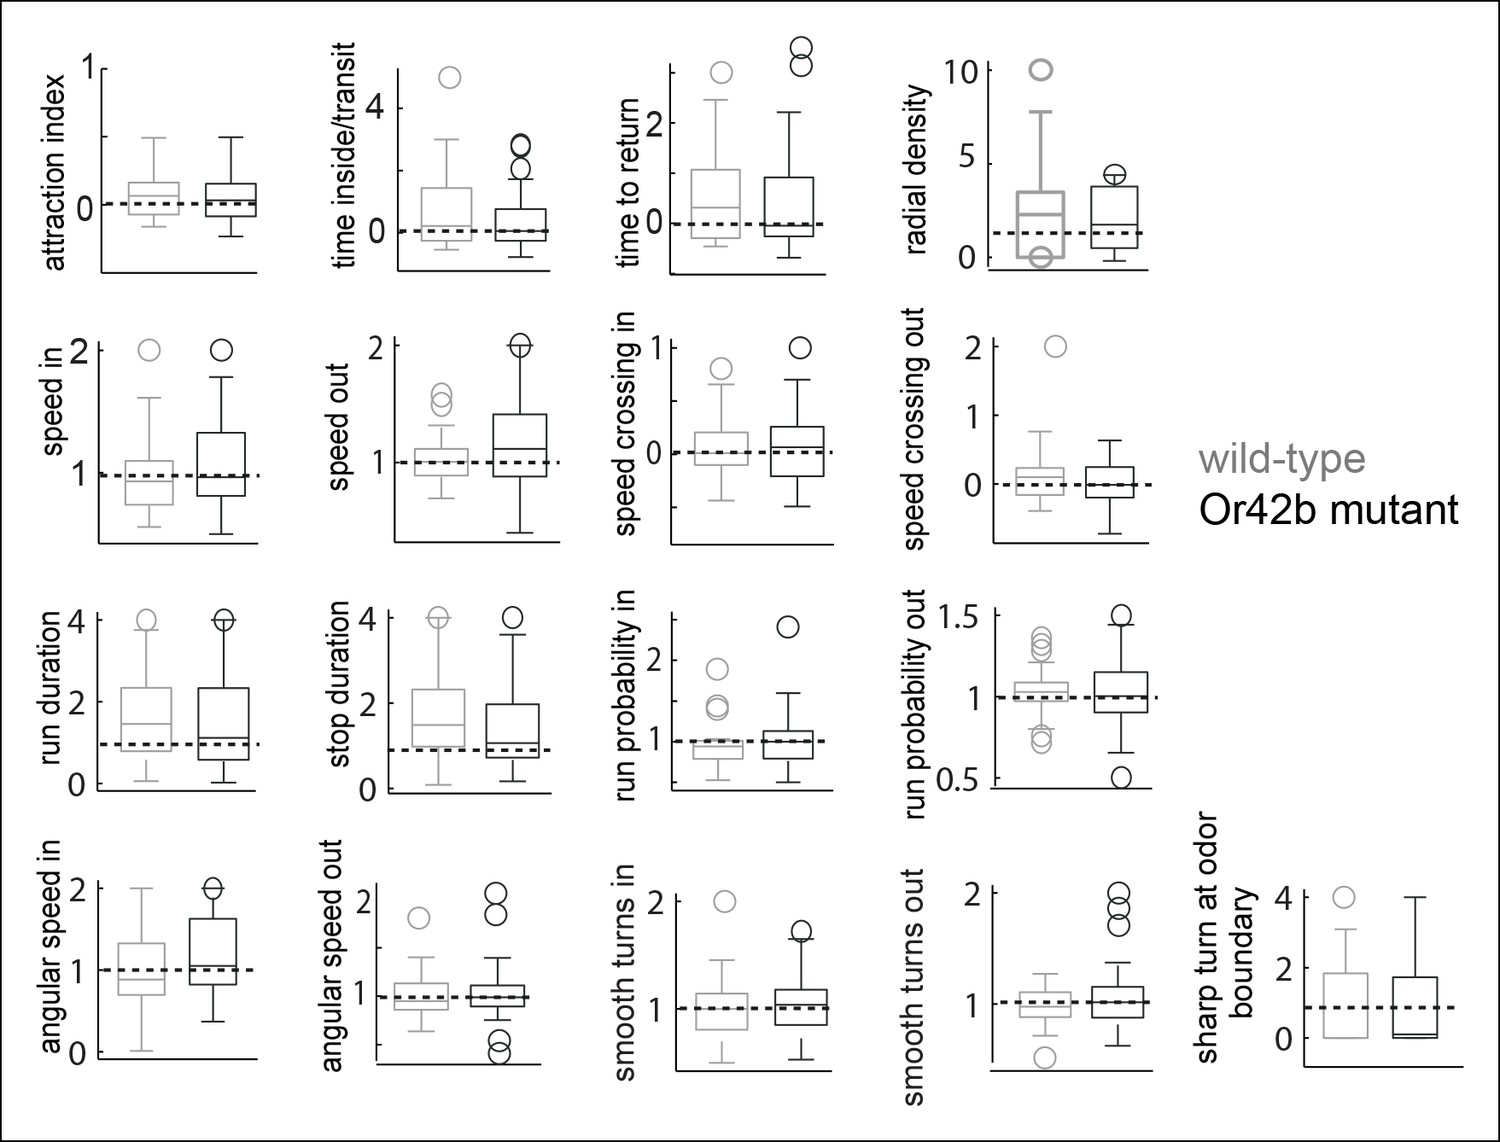
Responses of wild-type and Or42b mutant flies to the solvent control are not significantly different for any parameter even if not corrected for multiple comparisons.
https://doi.org/10.7554/eLife.11092.022
Figure 9 with 1 supplement

Modulation of motor programs by ACV inside the odor-zone is strongly affected in the Ir8a-mutant.
(A) Three ORN classes activated by ACV are non-functional in Ir8a mutant. (B) The reduction in speed when the wild type flies enter the odor-zone in the presence of ACV is abolished in the Ir8a mutant. (n = 29 for wild type and n = 33 for Ir8a mutant). (C) Increase in speed when the flies exit the odor-zone is also abolished. (D) 17-motor parameters in the wild type and the mutant. Many aspects of a fly’s locomotion are affected in the Ir8a mutant. Bars on top reflect whether the parameters are significantly different in the two genotypes compared to the solvent control. Shaded parameters are the ones affected in the Ir8a mutant.
Figure 9—figure supplement 1
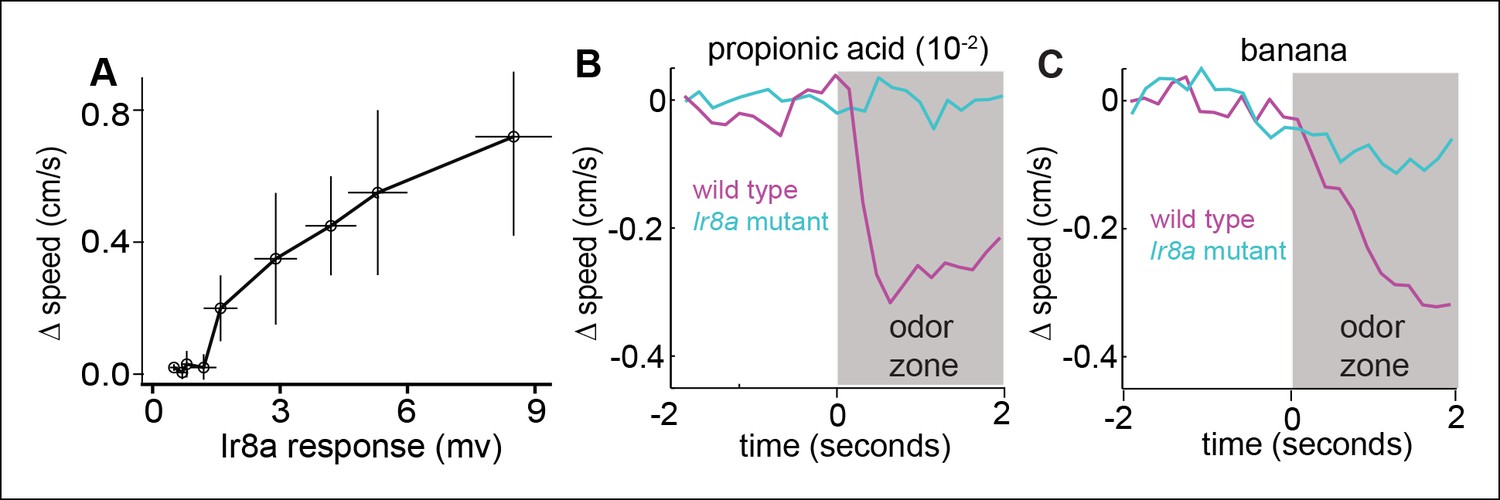
Ir8a-ORNs directly modulate speed.
(A) Change in speed as a function of field potential response at the ORN layer in flies in which Ir8a-ORNs are the only ones active. Each data point represents a different odor. Δspeedis the difference in average speed in the 2 s after entering the odor-zone when an odor is present vs. control period. Ir8a response = Peak field potential response. Odors (in order of the response they elicit from Ir8a) = ethyl acetate (10-–5),ethyl acetate (10–4), 2-butanone (10–3), ethyl butyrate (10–3), ACV(10–2), banana, ACV0, acetic acid (10–2), acetic acid (10–2) + propionic acid (10–2). (B) Decrease in speed elicited by propionic acid is abolished in the Ir8a mutant. C. Decrease in speed elicited by banana is strongly attenuated in the Ir8a mutant.
Figure 10

Ir8a mutants approach ACV at the same rate as wild-type but spend less time in proximity to it.
(A) Ir8a mutant find the odor as well as the wild-type flies but because they spend less time inside the odor-zone on each visit their attraction to odor decreases with time at a faster rate than wild-type flies. (B). The time a fly spends inside the odor-zone on a single visit decreases at a much slower rate for wild-type than for the Ir8a mutant. In contrast, the time a fly takes to return to the odor-zone is the same for both genotypes. (C) A photo of the arena with the outer edge marked with a white line. Fly can be seen as a tiny white object (marked with an arrowhead). The hole in the center is used to deliver odors. (D) Tracks of a control fly shows that it is strongly attracted to apple cider vinegar. (E) Radial density averaged over multiple flies show that Ir8a mutants find the odor as quickly as the wild-type but leave the odor much faster. (F) Speed (between 0-–2 min after odor on) near the odor source decreases in wild type but not in the Ir8a mutants.
Figure 11
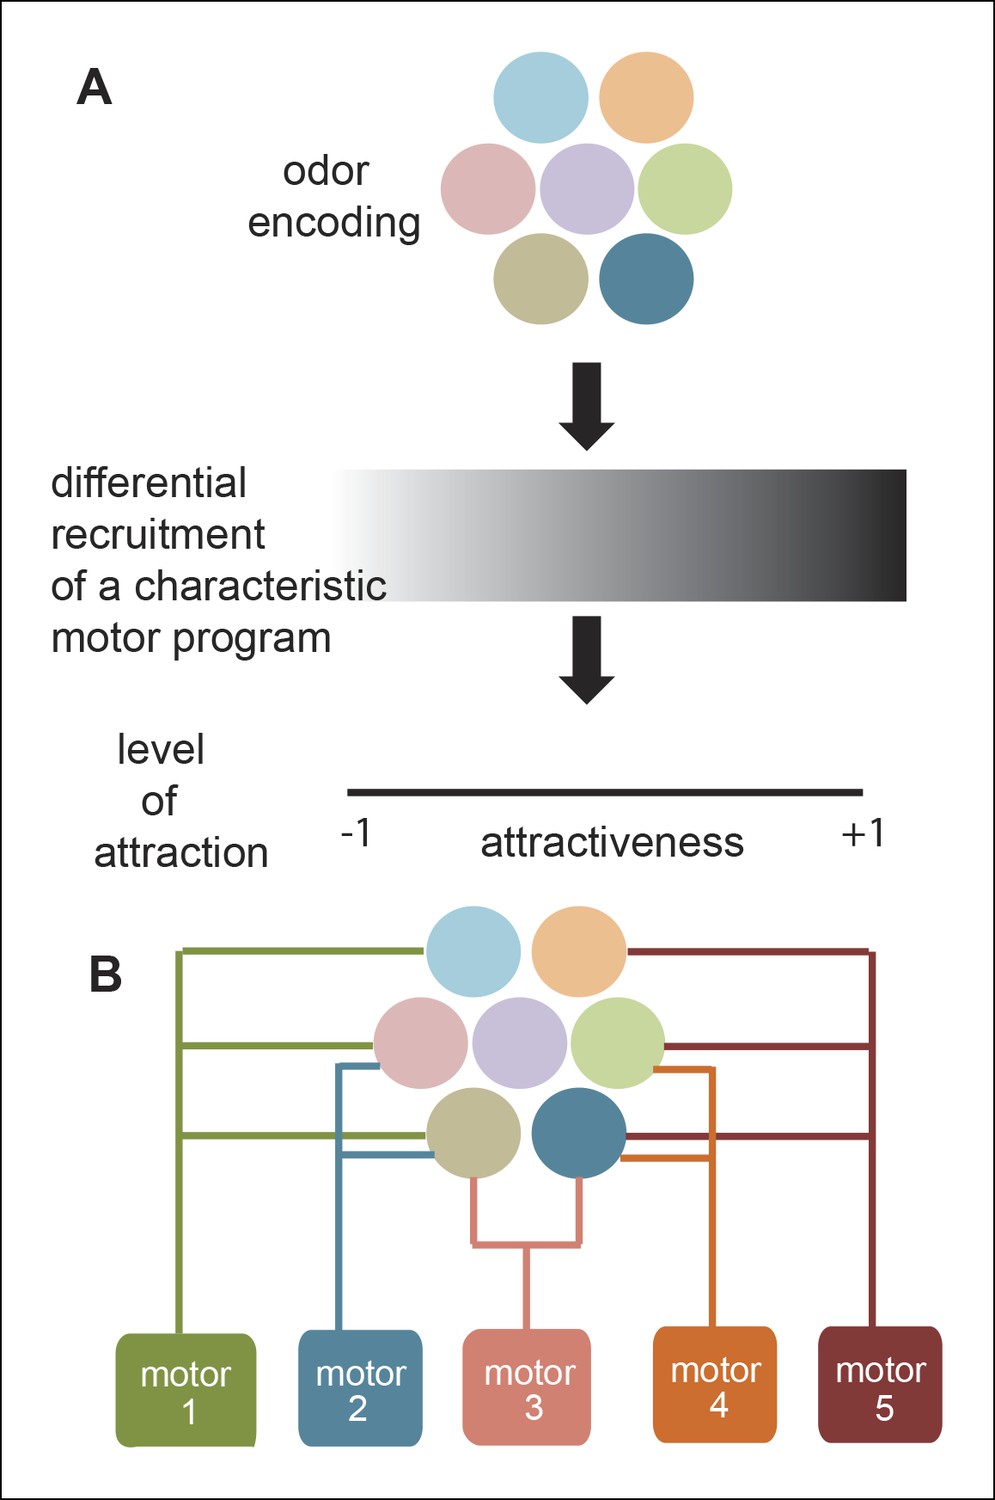
A new framework for olfactory behaviors.
(A) Current framework. Based on the pattern of ORNs activated by a given odor, a stereotypical motor program is activated with different efficacies leading to different levels of attractiveness. (B) Novel Framework. Different motor parameters are modulated by overlapping sets of ORNs leading to an odor dependent redistribution of the fly.
Figure 12
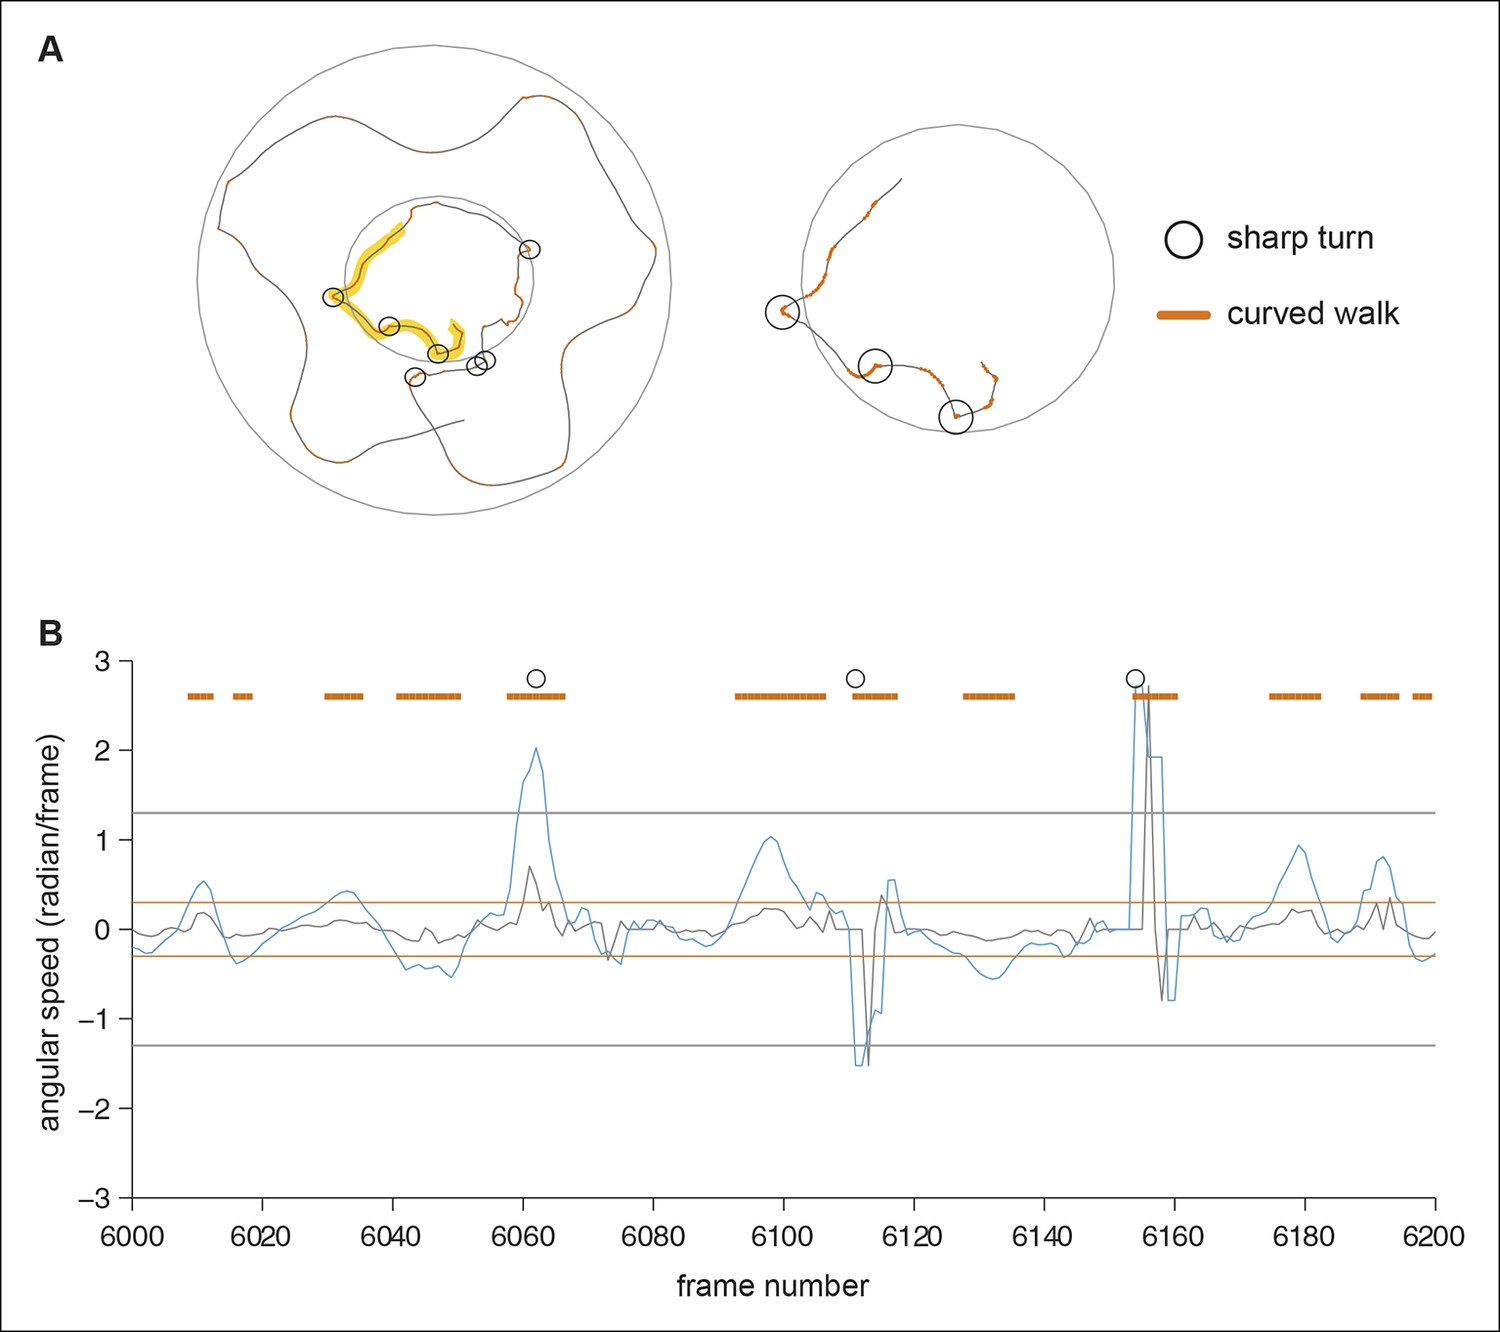
Determination of curved walk and sharp turns.
(A) A part of a fly’s walking trajectory. The curved walk is indicated with orange line and sharp turns are marked with black circles. The right panel shows the magnified walking trajectory from the left (marked by yellow highlight). B) The angular speed (grey line) and sum of 5 frame-long angular speed (blue line) for the frames corresponding to the highlighted track above. The orange lines mark the threshold for the curved walk and the grey lines mark the threshold for sharp turns. Frames detected as curved walks (orange) and sharp turns (black circle) are marked.
Videos
Video 1
This video shows the behavior of the fly to apple cider vinegar (Video 1).
The tracks over the preceding 2 s are marked with dotted white line. The centroid is marked with green. The video also marks stops, sharp turns (S-turns) and curved walk. It shows that the fly slows down when it encounters apple cider vinegar (Video 1). Then, it explores the edge. This particular fly stays just outside the border for some time before entering. Other flies explore the border from the inside. Overall, the fly stays inside the odor-zone and explores the odor-zone with short frequent stops and increased turning.
Video 2
This video shows the behavior of the fly to 2-butanone.
The tracks over the preceding 2 s are marked with dotted white line. The centroid is marked with green. The video also marks stops, sharp turns (S-turns) and curved walk. Unlike in apple cider vinegar, although the fly keeps returning to the odor-zone, it often walks straight through it.
Tables
Table 1
17 behavioral parameter.
Parameters are defined in more details in the methods.
| Motor parameter | What it represents | How it is calculated (see Materials and methods for details) |
|---|---|---|
| Attraction index | Overall time spent inside the odor zone | |
| Time spent/transit | Median time spent inside the odor zone per visit | |
| Time to return | Median time spent outside the odor zone between successive entries into the odor-zone | |
| Radial density | Mean distance from the center of the arena | Fly’s location as the distance from the center of the arena. Data were binned to 12 bins and normalized by area of each bin. |
| Speed inside | Mean speed inside the odor zone over the entire period | |
| Speed outside | Mean speed outside the odor zone over the entire period | |
| Speed crossing inside | Acute change in speed in the first 3 s after entering the odor-zone | |
| Speed crossing outside | Acute change in speed in the first 3 s after leaving the odor-zone | |
| Run duration | Average duration of runs | |
| Stop duration | Average duration of stops | |
| Run probability in | Fraction of time a fly spends running while inside the odor zone | |
| Run probability out | Fraction of time a fly spends running when outside the odor zone | |
| Angular speed inside | Angular speed change inside the odor zone | |
| Angular speed outside | Angular speed change outside the odor zone | |
| Smooth turns in | Fraction of time a fly is performing a smooth turn inside the odor zone | |
| Smooth turns out | Fraction of time a fly is performing smooth turns outside the odor zone | |
| Sharp turns at boundary | Fraction of sharp turns near the odor boundary | The fraction of sharp turns which took place at the odor border, i.e. in a ring 2 mm around the border |
Download links
A two-part list of links to download the article, or parts of the article, in various formats.
Downloads (link to download the article as PDF)
Open citations (links to open the citations from this article in various online reference manager services)
Cite this article (links to download the citations from this article in formats compatible with various reference manager tools)
Odor-identity dependent motor programs underlie behavioral responses to odors
eLife 4:e11092.
https://doi.org/10.7554/eLife.11092


