The ribosomal protein Asc1/RACK1 is required for efficient translation of short mRNAs
- Massachusetts Institute of Technology, United States
Figures
Figure 1 with 1 supplement

Loss of the Asc1 protein causes widespread changes in translation efficiency.
(A) Gene model of ASC1, showing the SNR24 snoRNA and location of protein null (M1X and E5X) and ribosome binding (DE and D109Y) mutations. (B) Asc1 protein levels quantified by Western blot. Pgk1 blot on the same membrane is shown as a loading control. Dilutions of the WT sample are shown on the left. Data is representative of three biological replicates. (C) ASC1 mRNA and SNR24 snoRNA levels quantified by qRT-PCR. Levels were normalized to ACT1 mRNA levels. Error bars represent s.d. from three technical replicates. Data is representative of three biological replicates. (D) Polysome profiles of the ASC1 mutants at 30˚C. The polysome/monosome (P/M) ratio and 60S/40S (60/40) ratio are shown with s.d. from two biological replicates. (E) Calculation of translation efficiency as the ratio of ribosome-protected mRNA fragments to total mRNA abundance. (F) Distribution of changes in TE comparing two biological replicates from WT cells (i.e. replicate error) or asc1-M1X or asc1∆ to its corresponding WT comparison. #1 and #2 denote biological replicate experiments. (G) Scatterplot of TE changes between the two ASC1 null mutants. The Pearson correlation coefficient is shown.
Figure 1—figure supplement 1
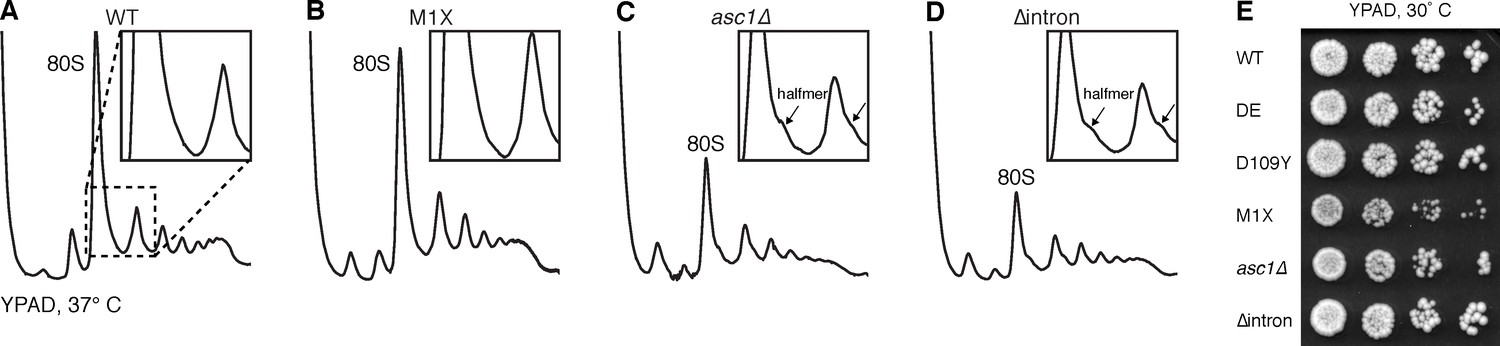
The M1X mutation rescues the temperature-sensitive ribosome biogenesis defect of asc1∆.
(A–D) Polysomes of ASC1 mutants grown at 37˚C, showing halfmer formation in mutants lacking SNR24 (inset), but rescued in asc1-M1X. Halfmers result from loading of a 40S ribosomal subunit onto an mRNA without subsequent 60S joining. Because the mRNA is loaded with other ribosomes, it migrates near mRNAs loaded with a whole number of ribosomes, but shifted slightly deeper into the gradient due to the extra 40S subunit. (E) Growth of the ASC1 mutants on YPAD plates at 30˚C. Growth of five-fold dilutions of the culture is shown.
Figure 2
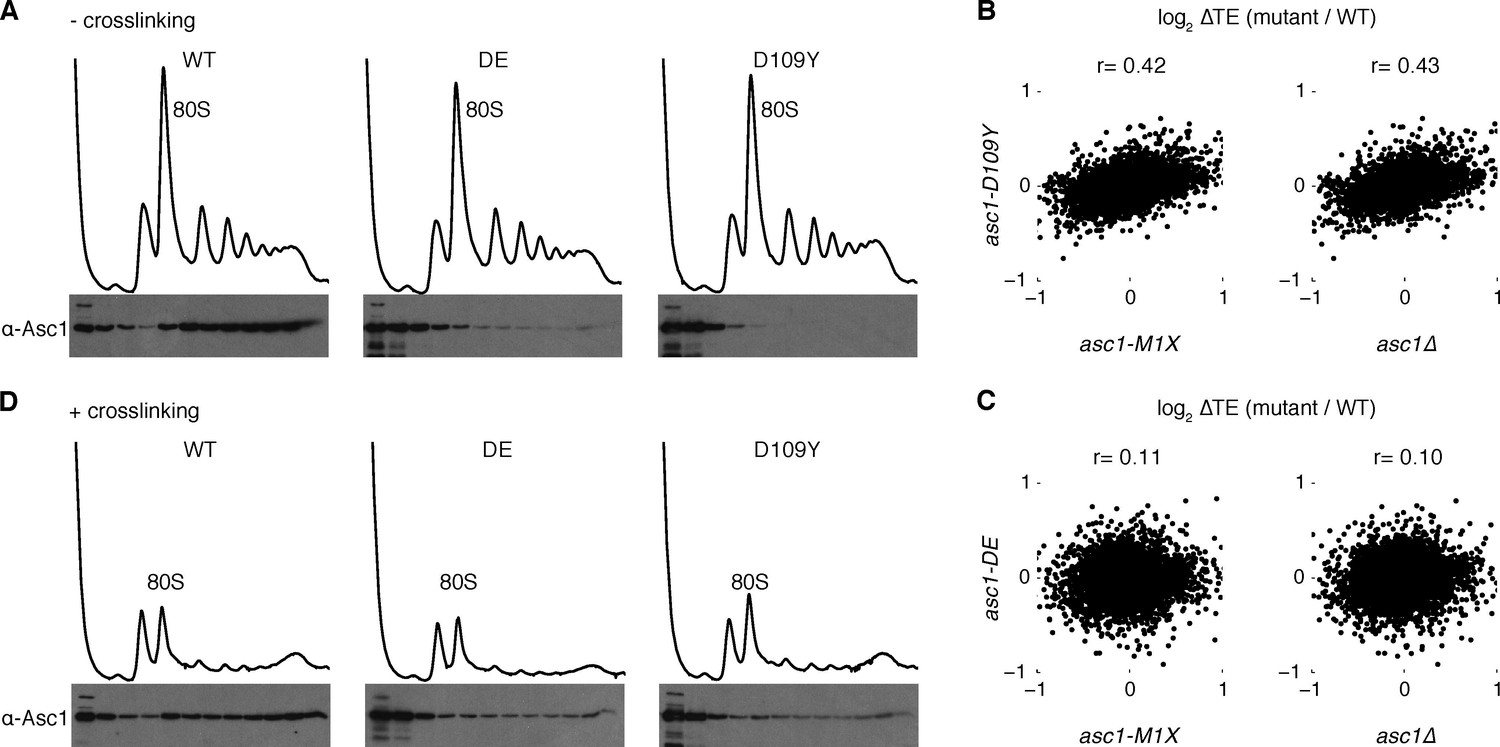
Asc1 ‘ribosome-binding’ mutants retain ribosomal association in vivo.
(A) Association of Asc1 mutant proteins with the ribosome assayed by Western blot of fractions isolated after velocity gradient sedimentation. (B, C) Scatterplot of TE changes between the two ASC1 null mutants and the asc1-D109Y and asc1-DE ribosome-binding mutants. The Pearson correlation coefficients are shown. (D) The same as (A) but proteins were crosslinked with formaldehyde in vivo before sample processing.
Figure 3 with 4 supplements
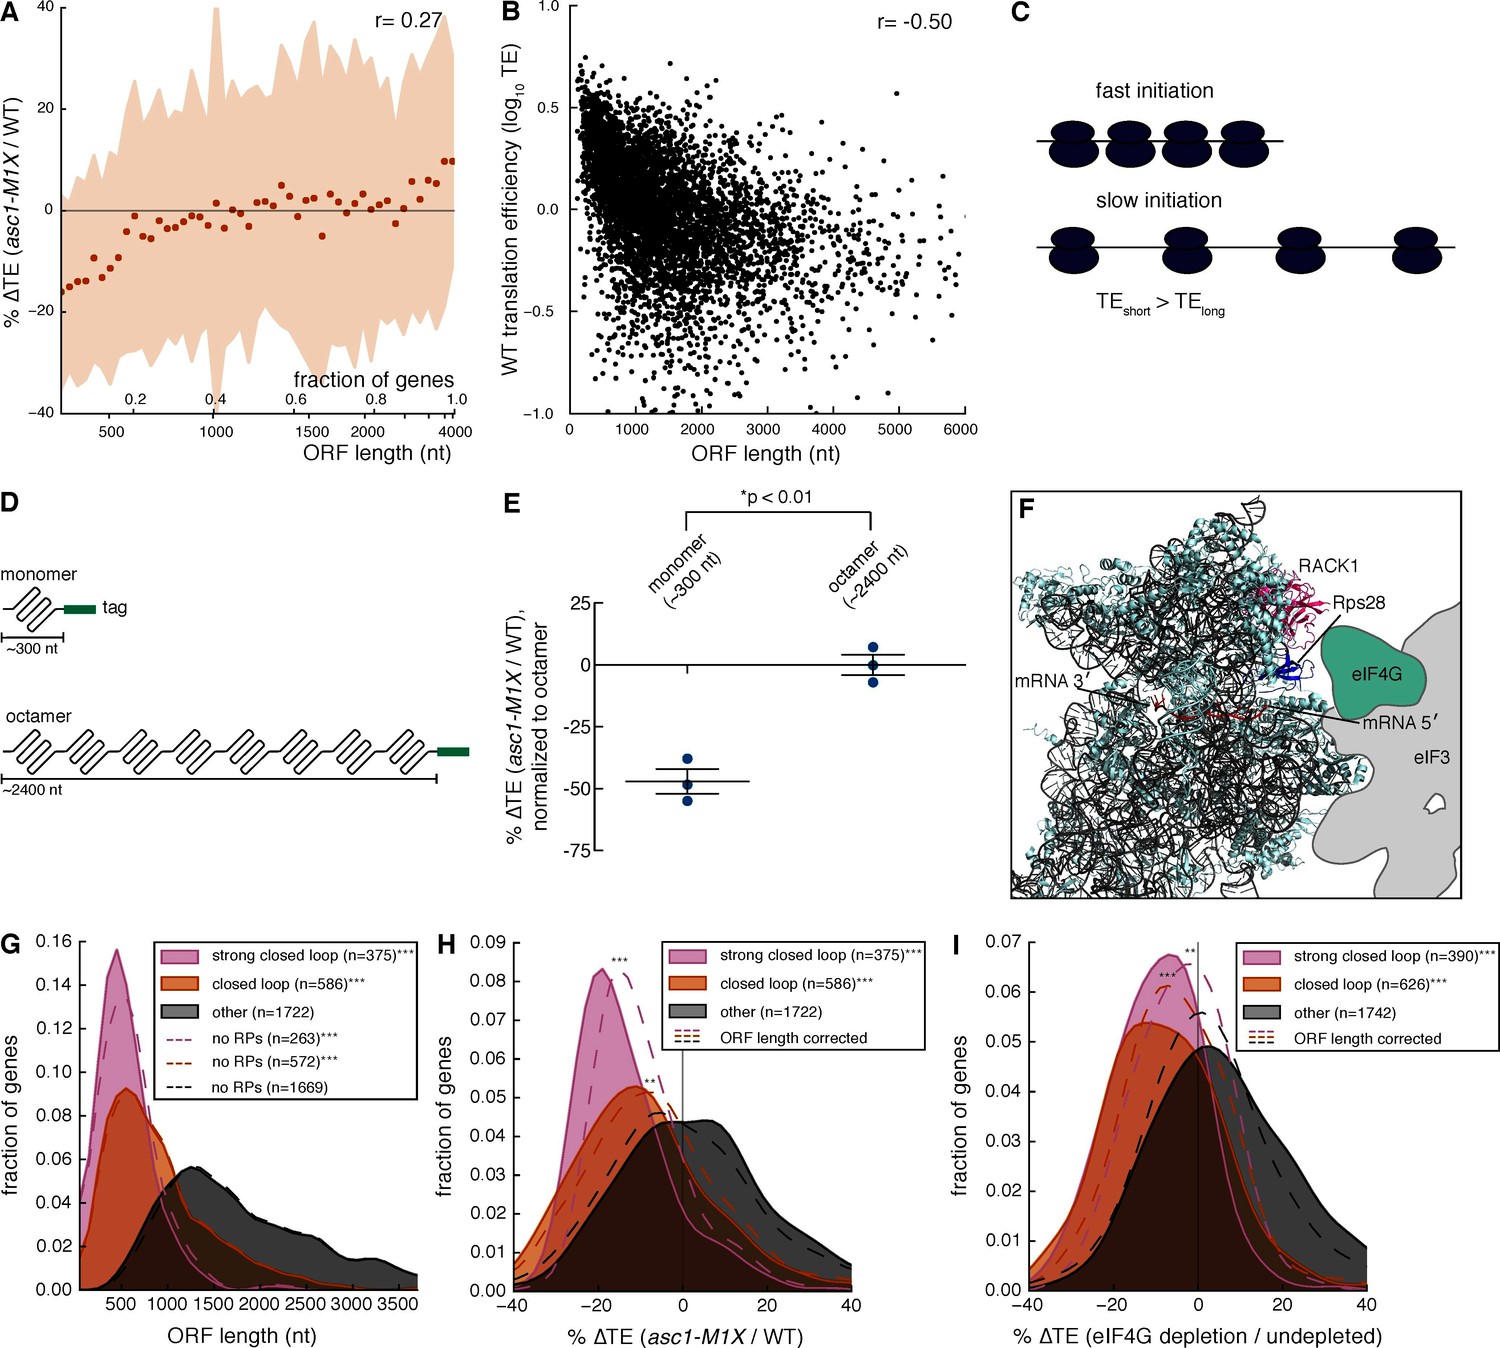
Asc1 is required for efficient translation of short ORFs that form closed loop complexes.
(A) Relationship between ORF length and TE changes in asc1-M1X. The values shown represent the average percent change in TE for bins of 100 genes arranged by length. The ORF lengths shown correspond to the point at which the average ORF length of the bin exceeds the indicated value. Shaded areas represent +/- 1 s.d. from the average change. The ASC1 gene is excluded from the plot. (B) Relationship between ORF length and translational efficiency in WT yeast cells (data from this study). The Spearman correlation coefficient is shown. (C) Model showing the expected effect of a higher initiation rate on short mRNAs compared to long mRNAs on translation efficiency measurements. (D) Diagram of ORF length reporter constructs. The I27 monomer was repeated to make the octamer and each ORF was fused to a C-terminal V5 epitope tag. (E) Result of ORF length reporter experiment. TE is calculated as the normalized protein (V5 tag/Pgk1) to mRNA ratio (V5 mRNA/18S) and the ∆TE (ratio between mutant and WT) is shown. Relative protein concentration was obtained from quantitative Western blotting and mRNA concentration from qRT-PCR. *p=0.002, two-tailed Student’s t-test (monomer vs. octamer). Error bars are SEM from 3 biological replicates derived from independent genetic isolates of asc1-M1X. (F) The structure of the mammalian 48S pre-initiation complex is shown (Lomakin and Steitz, 2013) with the mRNA, RACK1, and Rps28, which crosslinks to the -7 and -10 positions of the mRNA relative to the AUG (Pisarev et al., 2008), indicated. The outline of eIF3 from Hashem et al. (2013) is shown. eIF4G is placed on the left arm of eIF3 based on electron microscopy data from Siridechadilok et al. (2005). (G, H, I) The relationship between closed loop complex association and ORF length (p=10–172and 10–135 for strong closed loop and closed loop groups vs. other mRNAs, respectively) (G), ∆TE in asc1-M1X (p=10–71and 10–42 for strong closed loop and closed loop vs. other mRNAs, respectively) (H), and ∆TE after eIF4G depletion (p=10–70and 10–73 for strong closed loop and closed loop vs. other mRNAs, respectively. Data from Park et al., 2011) (I). In (H) and (I), the dotted lines show the results after accounting for the relationship between ORF length and ∆TE using linear regression. For asc1-M1X, ORF length corrected p-values are 10–30 and 10–14 for strong closed loop and closed loop groups, respectively. For eIF4G depletion, ORF length corrected p-values are 10–17 and 10–28 for strong closed loop and closed loop groups, respectively. p-values are from the one-sided Mann-Whitney U test. Closed loop association groups are from Costello et al. (2015). For G-I, ***p<10–18, **p<10–9, *p<10–3
Figure 3—figure supplement 1

Identification of properties of Asc1-sensitive mRNAs.
Motif analysis of 5′ UTRs of mRNAs with decreased TE in asc1-M1X, defined as having a z-score ≤ -1. (motif present in 37/325 genes, E-value= 8.3e-11).
Figure 3—figure supplement 2

Partial correlation analysis showing the relationship between wild type ORF length, transcript length, and TE.
(A) TE vs. ORF length (B) TE vs. transcript length (C) transcript length vs. ORF length (D) TE vs. ORF length, partial correlation controlling for transcript length (E) TE vs. transcript length, partial correlation controlling for ORF length. Spearman correlation coefficients are shown between the indicated values or the residuals after linear regression.
Figure 3—figure supplement 3
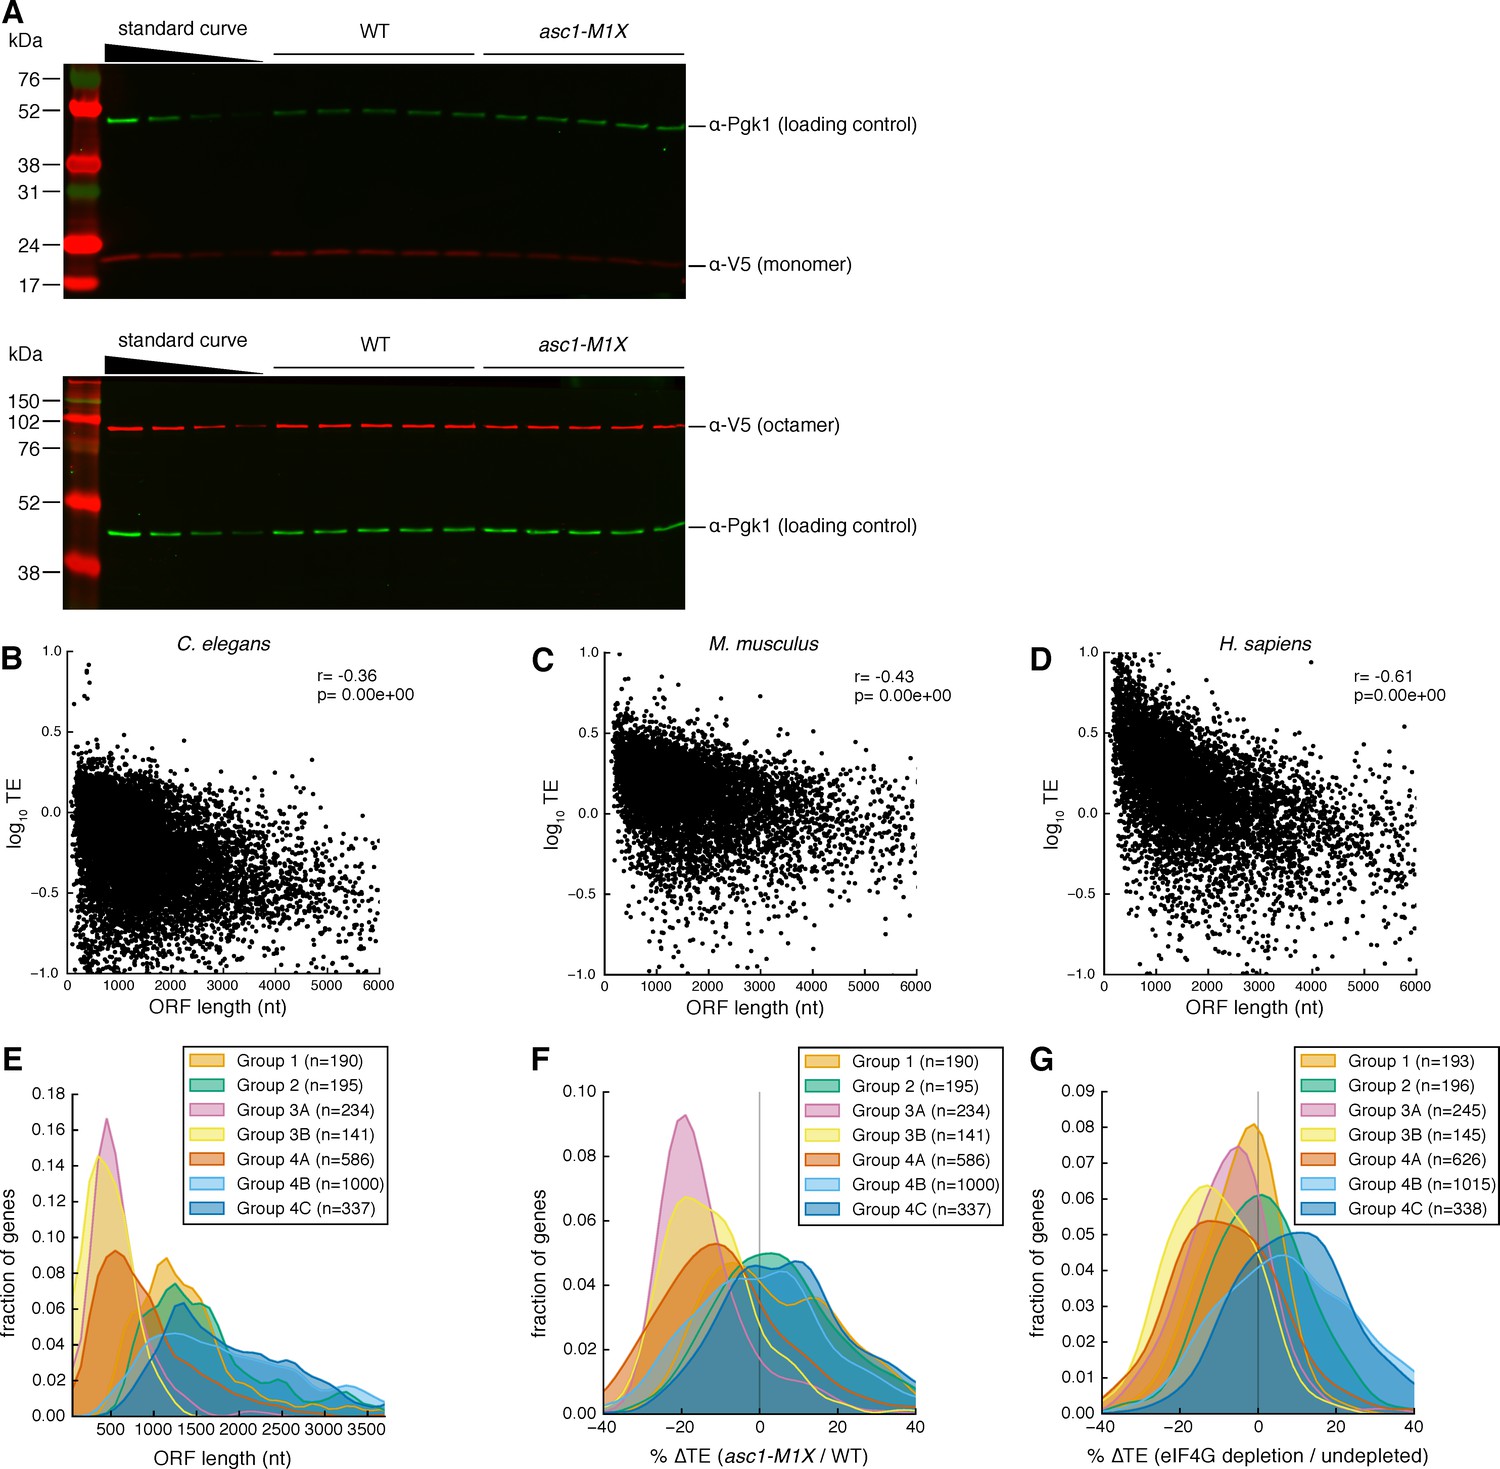
Evidence for ORF-length-dependent translational regulation.
(A) Representative Western blots showing V5-tagged I27 monomer (top) or octamer (bottom) in WT and asc1-M1X cells. The standard curve is a two-fold dilution series of WT extract. Protein bands display variable brightness due to transfer efficiency and membrane binding differences between proteins of different molecular weights (Bolt and Mahoney, 1997). Therefore, we quantify the relative difference between mutant and WT at each protein size and cannot draw conclusions about absolute protein concentrations across the molecular weight range from Western blotting analysis. (B–D) Scatterplots showing the relationships between TE and ORF length in diverse eukaryotes: C. elegans, dauer stage (Stadler and Fire, 2013) (B), M. musculus, neutrophils (Guo et al., 2010) (C), and H. sapiens, HeLa cells (Guo et al., 2010) (D). (E–G) The effect of closed loop complex association on ORF length as in Figure 3 (G–I) but with all groups from Costello et al. (2015), in which mRNAs were subdivided by hierarchical clustering into groups with similar translation factor enrichment profiles. For Figure 3 (G–I), Group 3A and 3B were combined and labeled ‘strong closed loop’. Group 4A was labeled ‘closed loop’ and all other groups were combined and labeled ‘other’ based on their association with closed-loop factors eIF4E, eIF4G, and Pab1, and de-enrichment with 4E-binding protein (4E-BP) repressors whose association with an mRNA should be mutually exclusive with the closed loop complex. Group 3A and 3B consist of mRNAs enriched for the closed loop factors and de-enriched for the 4E-BPs. Group 4A is similarly enriched for the closed loop factors but not de-enriched for the 4E-BPs. Groups in the ‘other’ category either show enrichment for the 4E-BPs or de-enrichment for the closed loop factors.
Figure 3—figure supplement 4
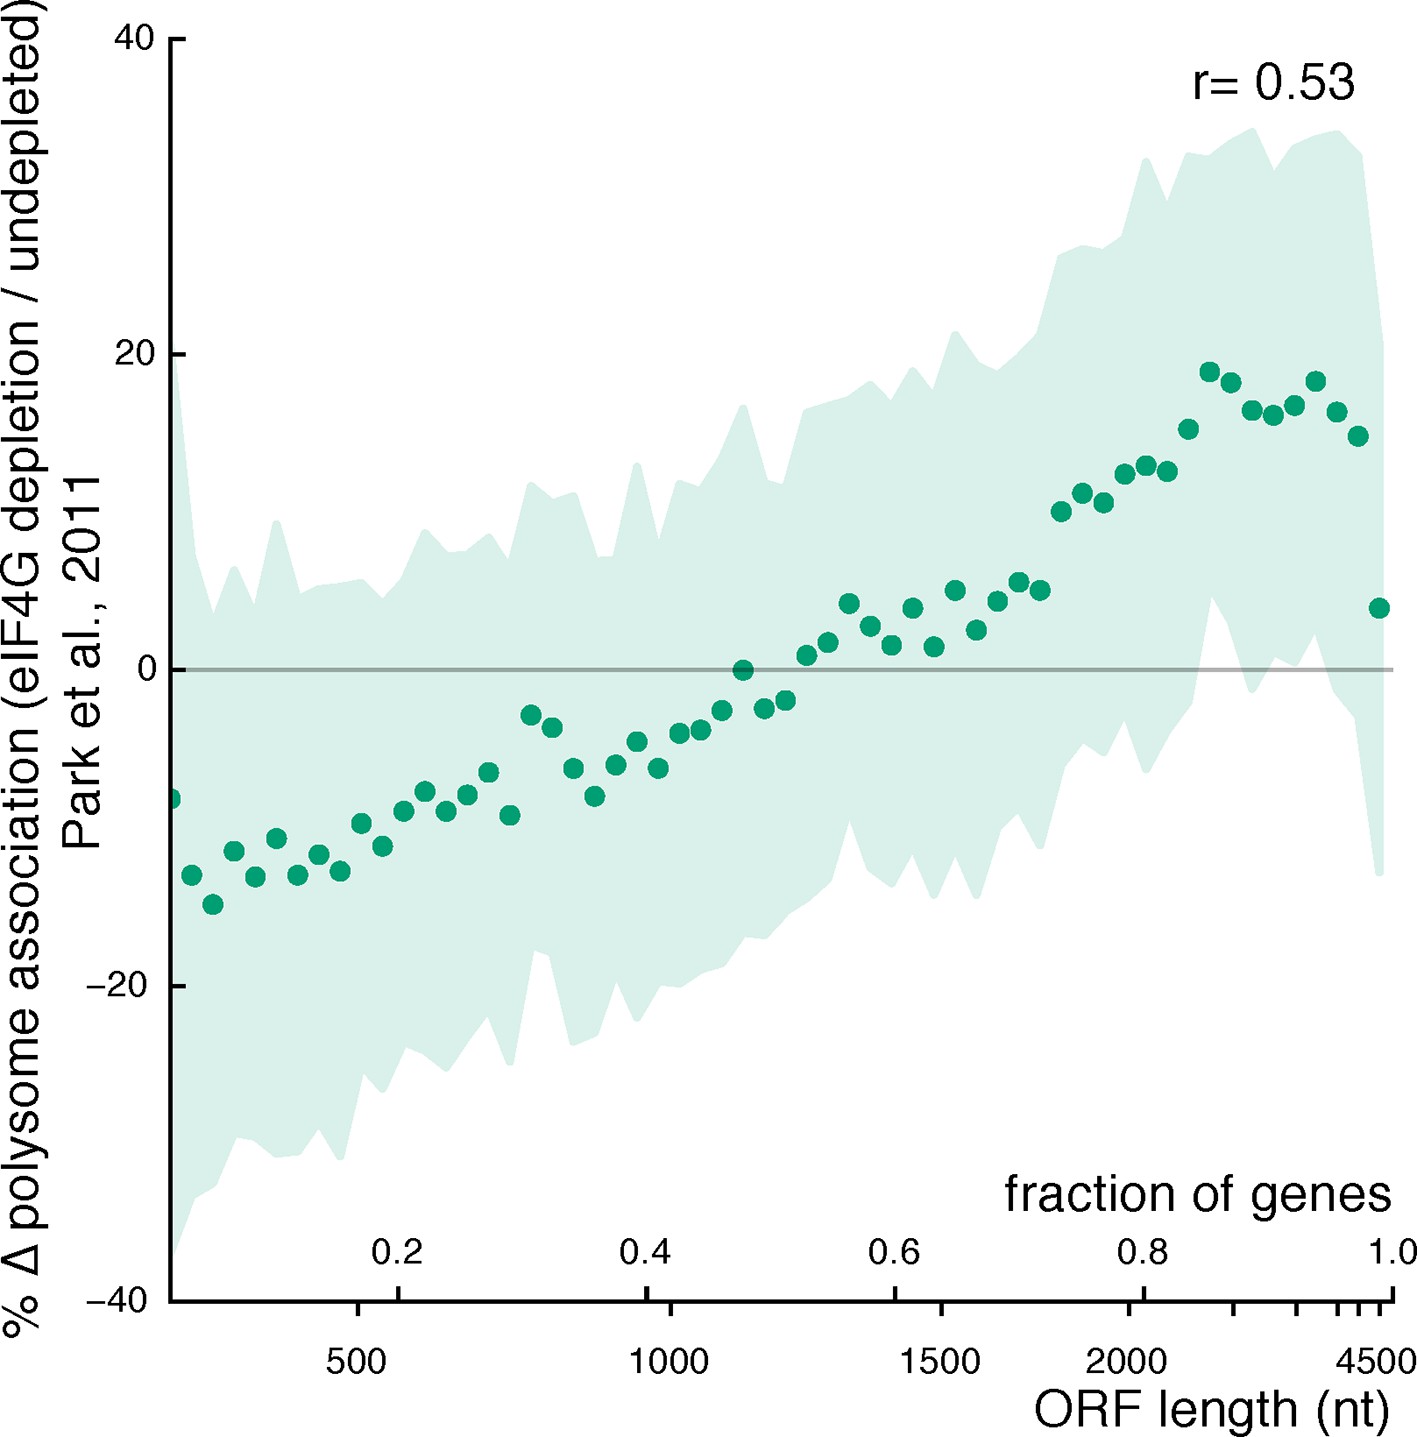
Relationship between ORF length and changes in mRNA polysome association after eIF4G depletion (data from Park et al., 2011).
Plot parameters are as described for Figure 3A. The genes encoding the two eIF4G isoforms are excluded from the plot.
Figure 4 with 2 supplements
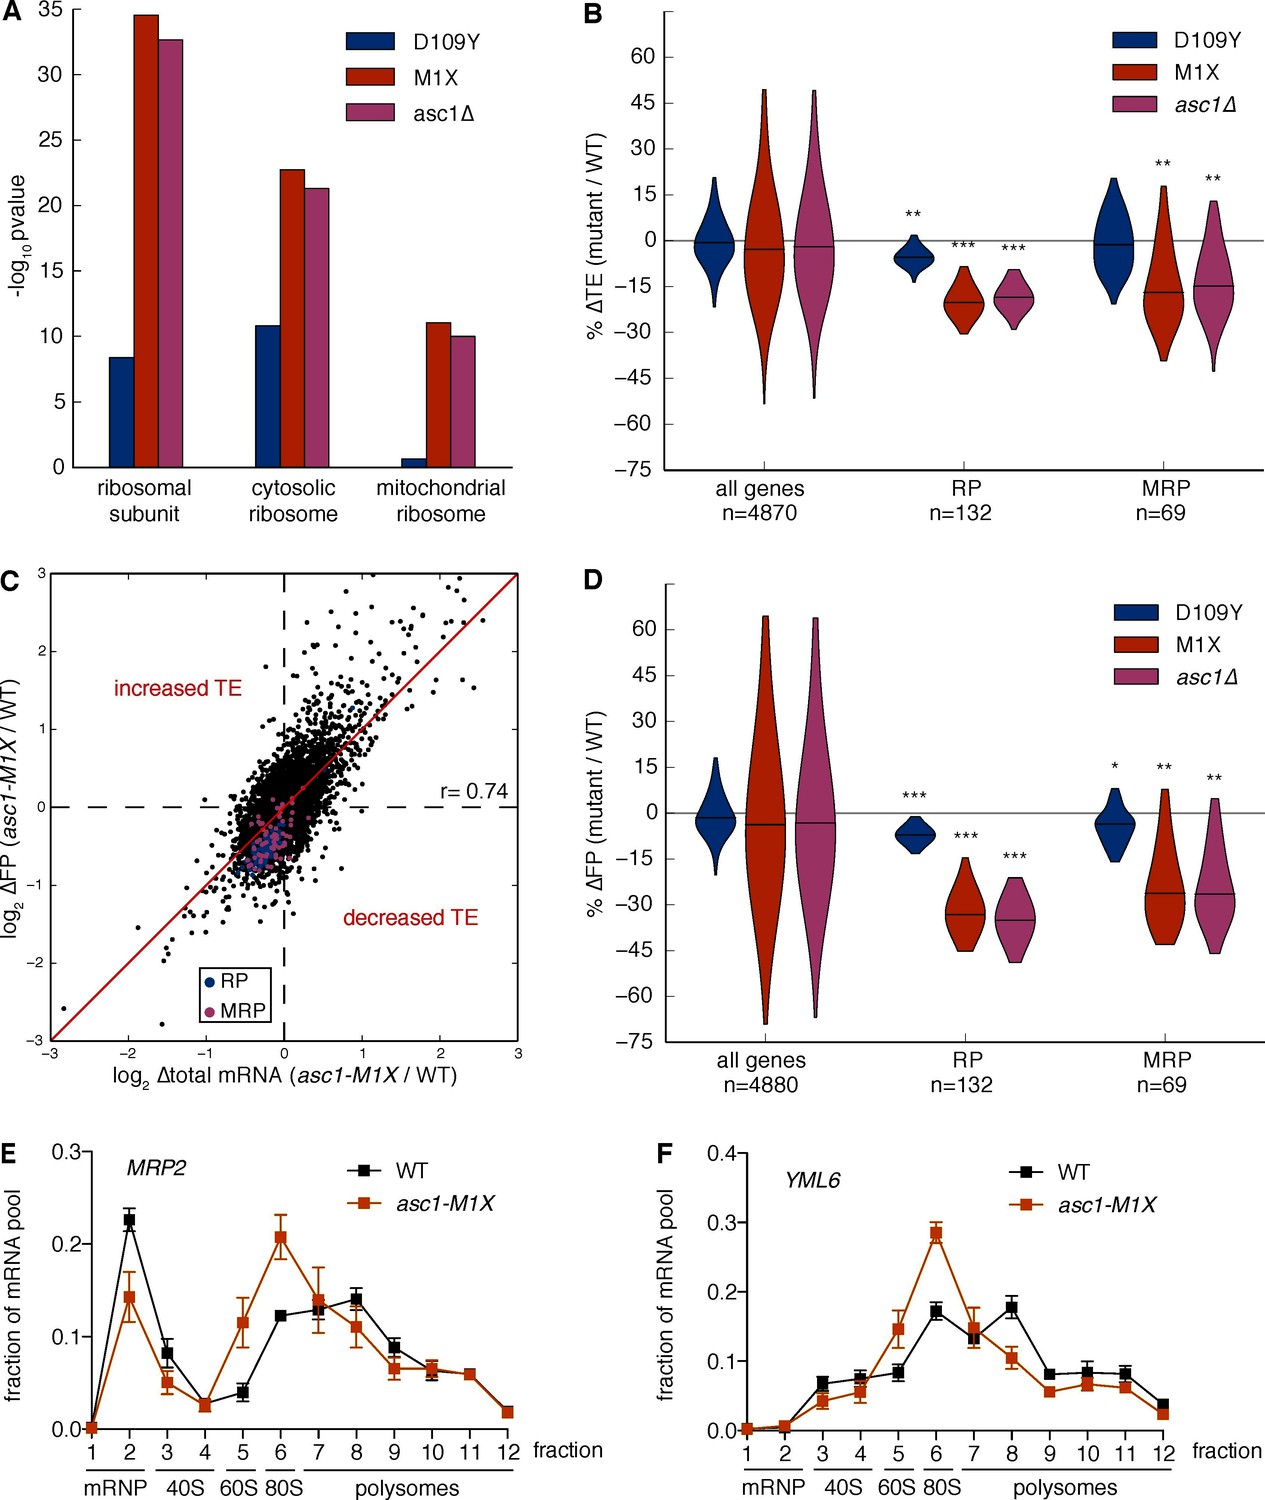
Loss of Asc1 causes decreased translational efficiency of cytoplasmic and mitochondrial ribosomal protein mRNAs.
(A) GO Component category enrichments for mRNAs with decreased TE in the ASC1 mutants. GO categories related to the top category ‘ribosomal subunit’ for the asc1-M1X mutant are displayed. (B) Violin plot showing the decreases in TE for the cytosolic ribosomal protein (RP) and mitochondrial ribosomal protein (MRP) gene sets in the ASC1 mutants. The violin shape represents a kernel density estimation and the top and bottom of the plot extend to the most extreme data point within 1.5x of the inner quartile range. Midlines represent the medians. ***p<10–18, **p<10–9, *p<10–3. (C) Scatterplot showing the decrease in both the footprint (FP) and total RNA pool for RP and MRP mRNAs. The Pearson correlation coefficient in shown. (D) As in (B), but with the change in ribosome association (FP) shown. (E, F) Polysome qRT-PCR showing decreased association of MRP genes with heavy polysomes. Values are normalized to an RNA spike-in control in each fraction and then set so that the sum of all fractions=1.
-
Figure 4—source data 1
GO category enrichments for mRNAs with changes in FP, total, or TE in ASC1 mutants.
- https://doi.org/10.7554/eLife.11154.013
Figure 4—figure supplement 1

Exploring potential effects of mRNA functional categories, decay rates, and poly(A) tail length on translation efficiency measurements.
(A) Relationship between ORF length and TE change in asc1-M1X showing that excluding mRNAs encoding RPs and MRPs from the analysis (no RPs) does not change the results. Plot made as in Figure 3A. (B) The percentage change in TE for all GO component categories containing >20 genes and arranged with equal spacing by median ORF length. The x-axis denotes the point at which the median ORF length of the group exceeds the indicated value. (C, D) TE values from our data correlated with steady-state mRNA half-life measurements obtained using 4-thiouracil labeling from (Miller et al. (2011) (C) or (Neymotin et al., 2014) (D). The Spearman correlation coefficients are shown. (E) Violin plot showing TE changes of the RP and MRP groups in asc1-M1X using either poly(A) selection or rRNA subtraction (Ribo-Zero) during preparation of the total RNA libraries. ***p<10–18, **p<10–9, *p<10–2. (F) Scatterplot showing well-correlated global changes in ∆TE whether using rRNA subtraction or poly(A) selection.
Figure 4—figure supplement 2
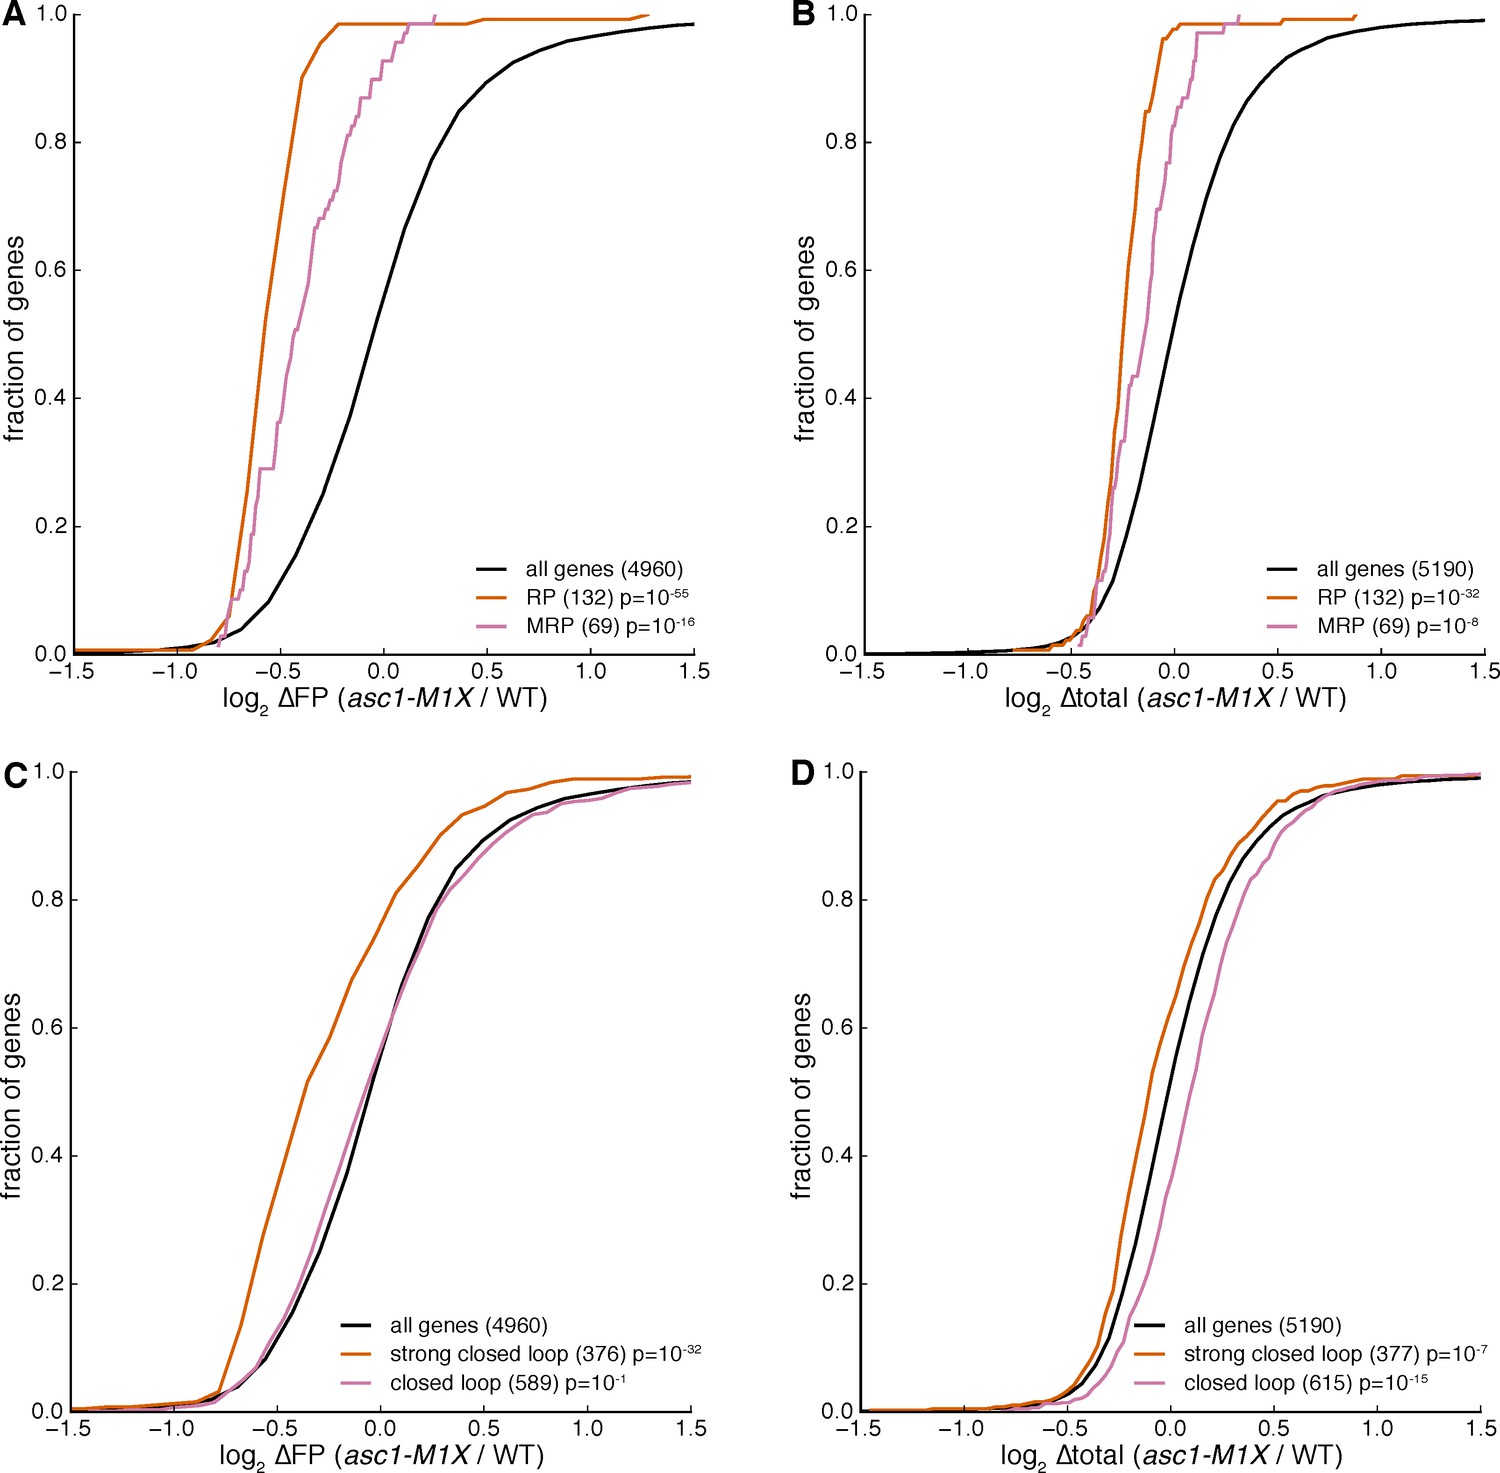
Changes in mRNA levels are unlikely to explain observed translation efficiency effects in the asc1-M1X mutant.
Changes in ribosome footprint levels (∆FP) and total mRNA levels (∆total mRNA) for mRNAs encoding cytosolic ribosomal proteins (RPs) and mitochondrial ribosomal proteins (MRPs) (A and B) or the ‘strong closed loop’ and ‘closed loop’ mRNAs (C and D) in the asc1-M1X mutant.
Figure 5 with 2 supplements
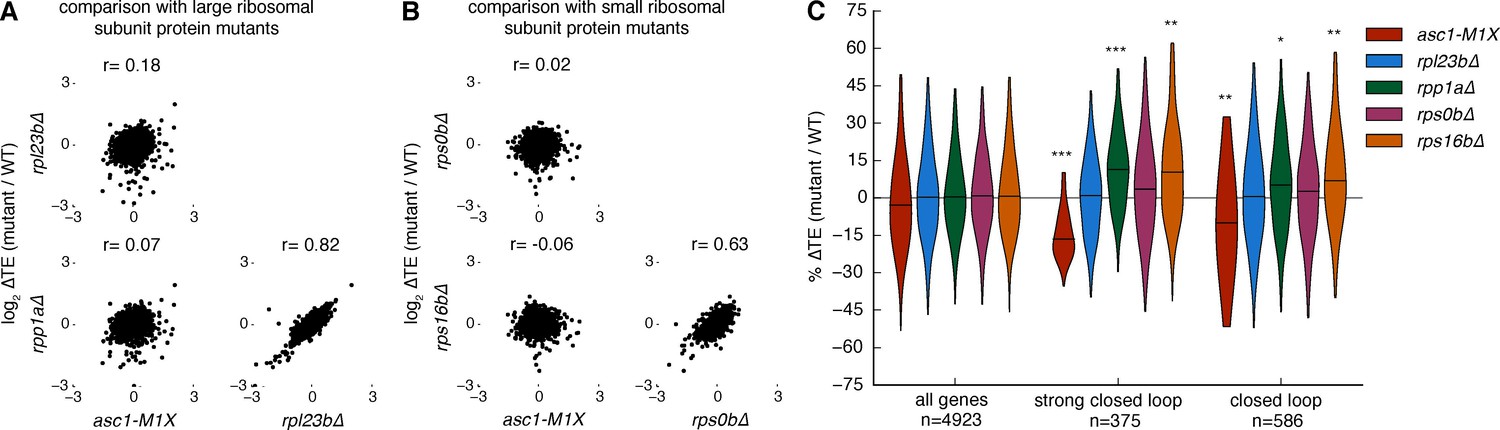
Other ribosomal protein mutants do not share translational phenotypes with the ASC1 mutants.
(A) Correlations between ∆TE among asc1-M1X and mutants with reduced expression of large ribosomal subunit proteins, rpl23b∆ and rpp1a∆. The Pearson correlation coefficient is shown. (B) Correlations between ∆TE among asc1-M1X and mutants with reduced expression of small ribosomal proteins in the vicinity of Asc1, rps0b∆ and rps16b∆. The Pearson correlation coefficient is shown. (C) Violin plots showing the change in TE for the ‘strong closed loop’ and ‘closed loop’ mRNAs in asc1-M1X and the other ribosomal protein mutants. Violin plot parameters are described in Figure 4B.
Figure 5—figure supplement 1

Phenotypes of selected large ribosomal protein mutants.
(A) Growth curve comparing growth of asc1-M1X with other RP mutants rpl23b∆ and rpp1a∆ at 30˚C in glucose. (B) Polysome profiles of the rpl23a∆ and rpp1a∆ mutants at 30˚C. The polysome/monosome (P/M) and 60S/40S (60/40) ratios are shown with s.d. from two biological replicates.
Figure 5—figure supplement 2
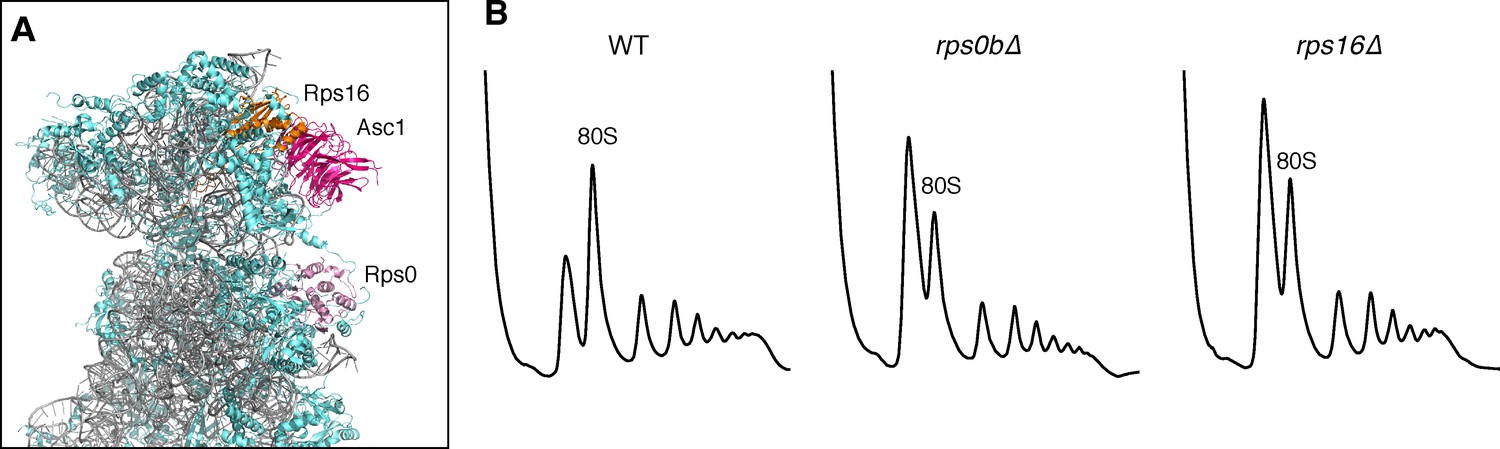
Ribosomal location and phenotypes of selected small ribosomal protein mutants.
(A) Structure of the yeast 40S ribosome with the positions of Rps0 and Rps16 shown relative to Asc1. Structure taken from Ben-Shem et al. (2011). (B) Polysome profiles from WT, rps0b∆, and rps16b∆.
Figure 6 with 1 supplement
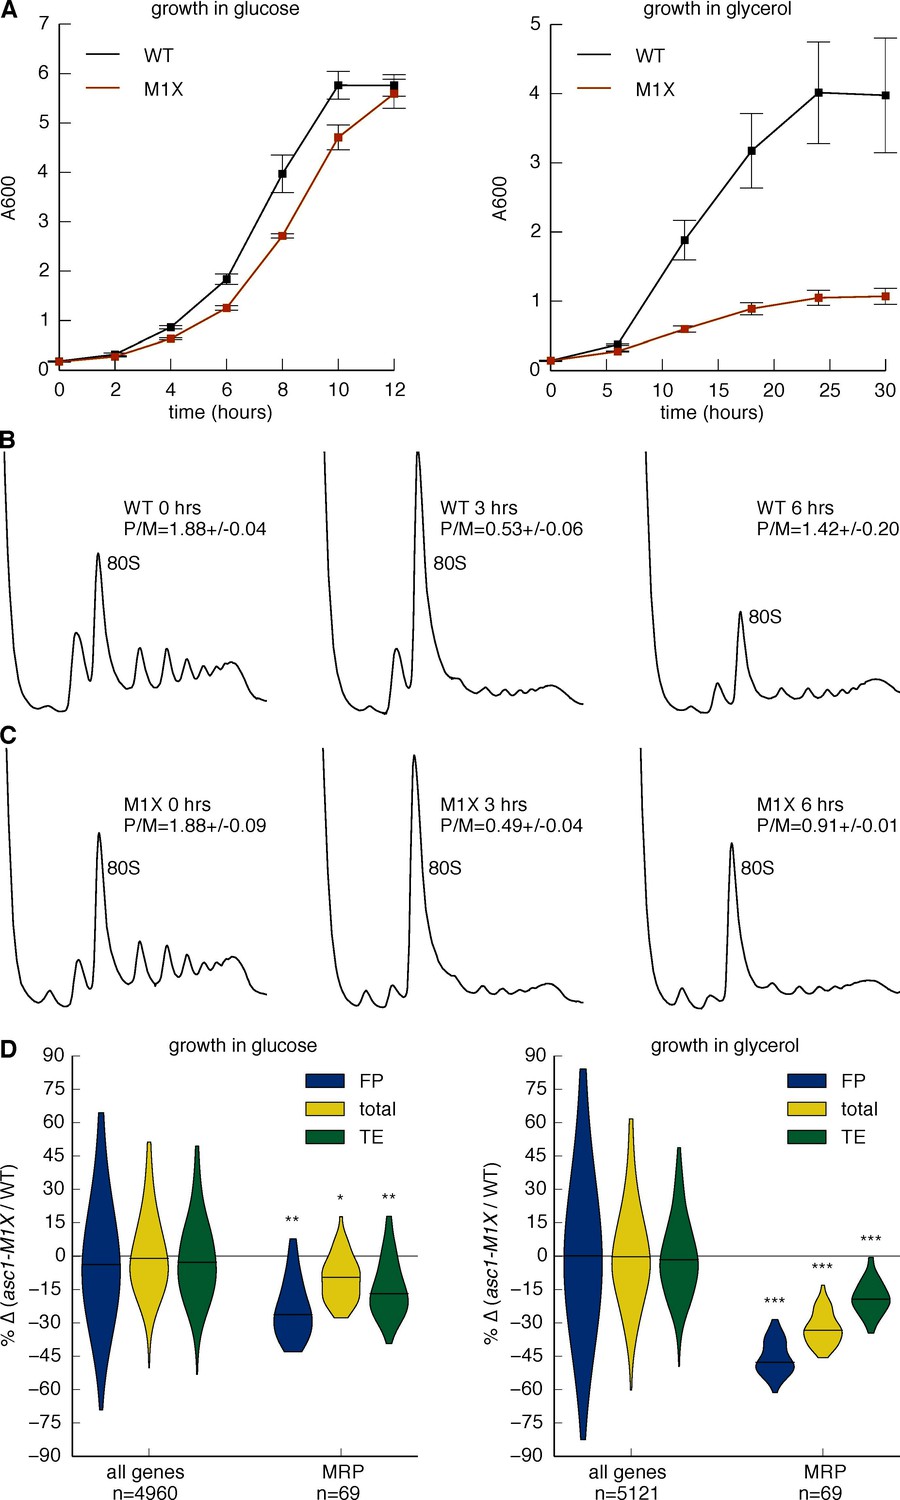
Asc1 is required for adaptation to a non-fermentable carbon source.
(A) Growth curves of WT and asc1-M1X cells after a shift from YPAD to fresh media containing either glucose (left) or glycerol (right). Curves are averages of two biological replicates, error bars are s.d. (B,C) Polysome profiles of WT (B) and asc1-M1X (C) yeast after a shift from glucose- to glycerol-containing media. Yeast were shifted at OD600=0.5. The polysome/monosome (P/M) and 60S/40S (60/40) ratios are shown with s.d. from two biological replicates. (D) Violin plot of the FP, total mRNA, and TE changes in asc1-M1X for MRP transcripts during growth in glucose (left, FP and TE data is also represented in Figure 4B,D) or after 6 hr of growth in glycerol (right). Violin plot parameters are as described for Figure 4B.
Figure 6—figure supplement 1
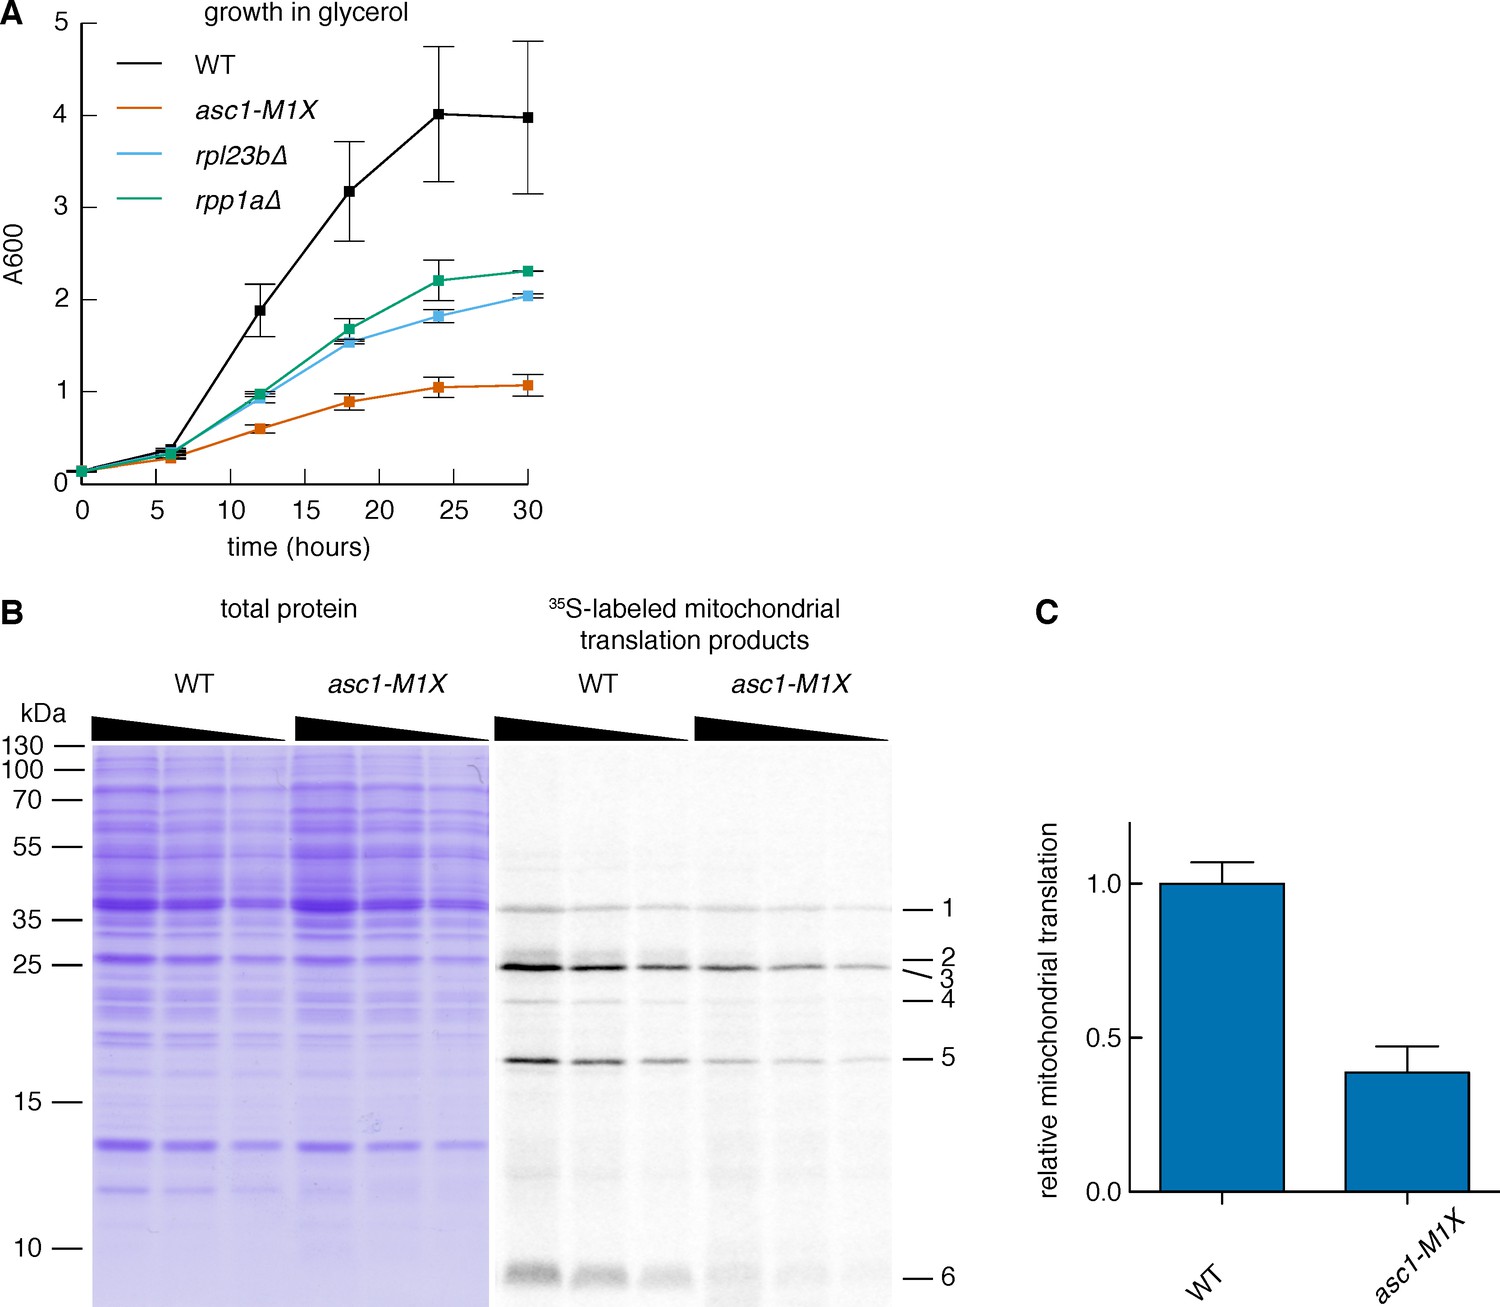
Loss of Asc1 compromises mitochondrial function.
(A) Growth curves of rpl23b∆ and rpp1a∆ after a shift from glucose- to glycerol-containing media, as described in Figure 6A. Data shown are averages and s.d. from two biological replicates. WT and asc1-M1X curves (also shown in Figure 6) are shown for comparison. (B) Measurement of mitochondrial translation in WT and asc1-M1X. Left: Coomassie stain, used for total protein quantification; Right: 35S-labeled mitochondrial proteins. A two-fold dilution series of each sample was loaded to ensure accurate quantification. The six mitochondrial proteins used for quantification are indicated. (C) Quantification of mitochondrial translation in WT and asc1-M1X. The average change for each of six bands was averaged. Error bars are s.d. from two biological replicates.
Author response image 1

Tables
Table 1
Properties of Asc1-sensitive mRNAs. Gene or mRNA attributes were correlated with ∆TE in the asc1-M1X mutant. The spearman correlation coefficients and p-values are shown.
| attribute | Spearman r (∆TE asc1-M1X vs. attribute) | p-value |
|---|---|---|
| wild type protein level | 0.103 | 1.49e-2 |
| wild type translation efficiency | -0.091 | 1.55e-10 |
| tRNA adaptation index (tAI) | 0.023 | 1.17e-1 |
| 5′ UTR length | -0.004 | 7.73e-1 |
| 3′ UTR length | 0.079 | 9.62e-8 |
| ORF length | 0.272 | 3.05e-84 |
| 5′ folding energy (MFE) | 0.030 | 3.97e-2 |
| 3′ folding energy (MFE) | -0.077 | 1.83e-7 |
| poly(A) tail length | 0.029 | 7.38e-2 |
Download links
A two-part list of links to download the article, or parts of the article, in various formats.
Downloads (link to download the article as PDF)
Open citations (links to open the citations from this article in various online reference manager services)
Cite this article (links to download the citations from this article in formats compatible with various reference manager tools)
The ribosomal protein Asc1/RACK1 is required for efficient translation of short mRNAs
eLife 5:e11154.
https://doi.org/10.7554/eLife.11154


