Burst muscle performance predicts the speed, acceleration, and turning performance of Anna’s hummingbirds
- University of British Columbia, Canada
- University of California, Riverside, United States
- California Institute of Technology, United States
- Institute of Molecular Pathology, Austria
Figures
Figure 1 with 1 supplement

A multi-camera, automated tracking system extracted hummingbird body position (blue circle) and orientation (red line) from solo and competitive flights.
The trajectory shown for one bird (a) is also shown in Video 1 (see Figure 1—figure supplement 1 for time series of position, velocity, and acceleration values). Stereotyped maneuvers were classified in each trajectory (b) and between one and five performance metrics were calculated from each maneuver. Maneuvers within a trajectory may be overlapping (e.g. #4,5,6). The trajectory presented in b is a top down (x-y projection) view of the trajectory shown in a. Body position and orientation were smoothed with an extended Kalman filter (c,d). The effects of four different sets of smoothing parameters are presented for an arcing turn (maneuver #9 in b) and an upward acceleration (maneuver #1 in b). Shown here are the unsmoothed position and orientation (black trace and text), the chosen levels of smoothing (blue), a lower level of smoothing (green; 0.1 x Rpos; 0.1 x Rori), and a higher level of smoothing (red; 10 x Rpos; 10 x Rori). The chosen smoothing parameters for body position were determined by tracking multiple dropped objects and calibrating the Z-axis acceleration to gravity. The chosen smoothing parameters for body orientation were determined by re-projecting the body axis vector onto the video. The higher and lower levels of smoothing for body position presented in this figure were both deemed too extreme, when re-projected onto the video. However, the level of smoothing for body orientation had minimal effect on the average yaw velocity.
Figure 1—figure supplement 1
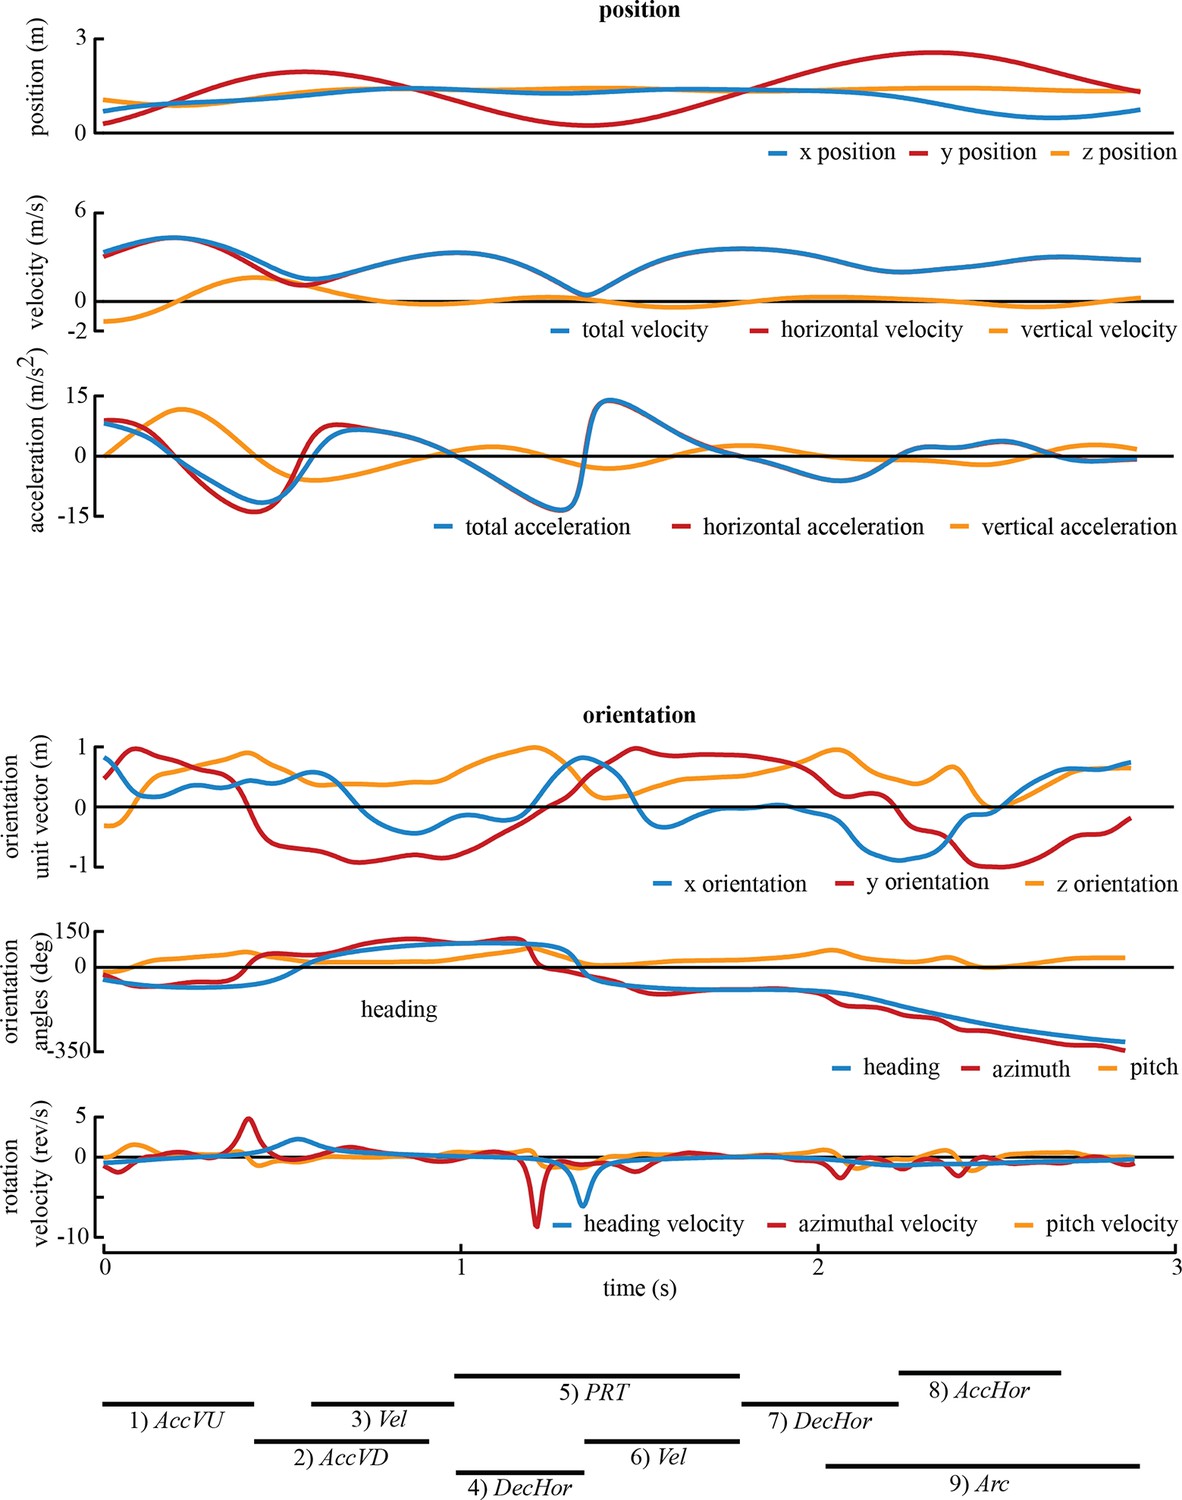
The representative trajectory from Figure 1 and Video 1 displayed through time.
The upper three panels provide the position, velocity, and acceleration values. The lower three panels provide the orientation vector, orientation angle and rotation velocity values. The maneuvers extracted for this sequence are given by thick black lines below the traces.
Figure 2 with 1 supplement
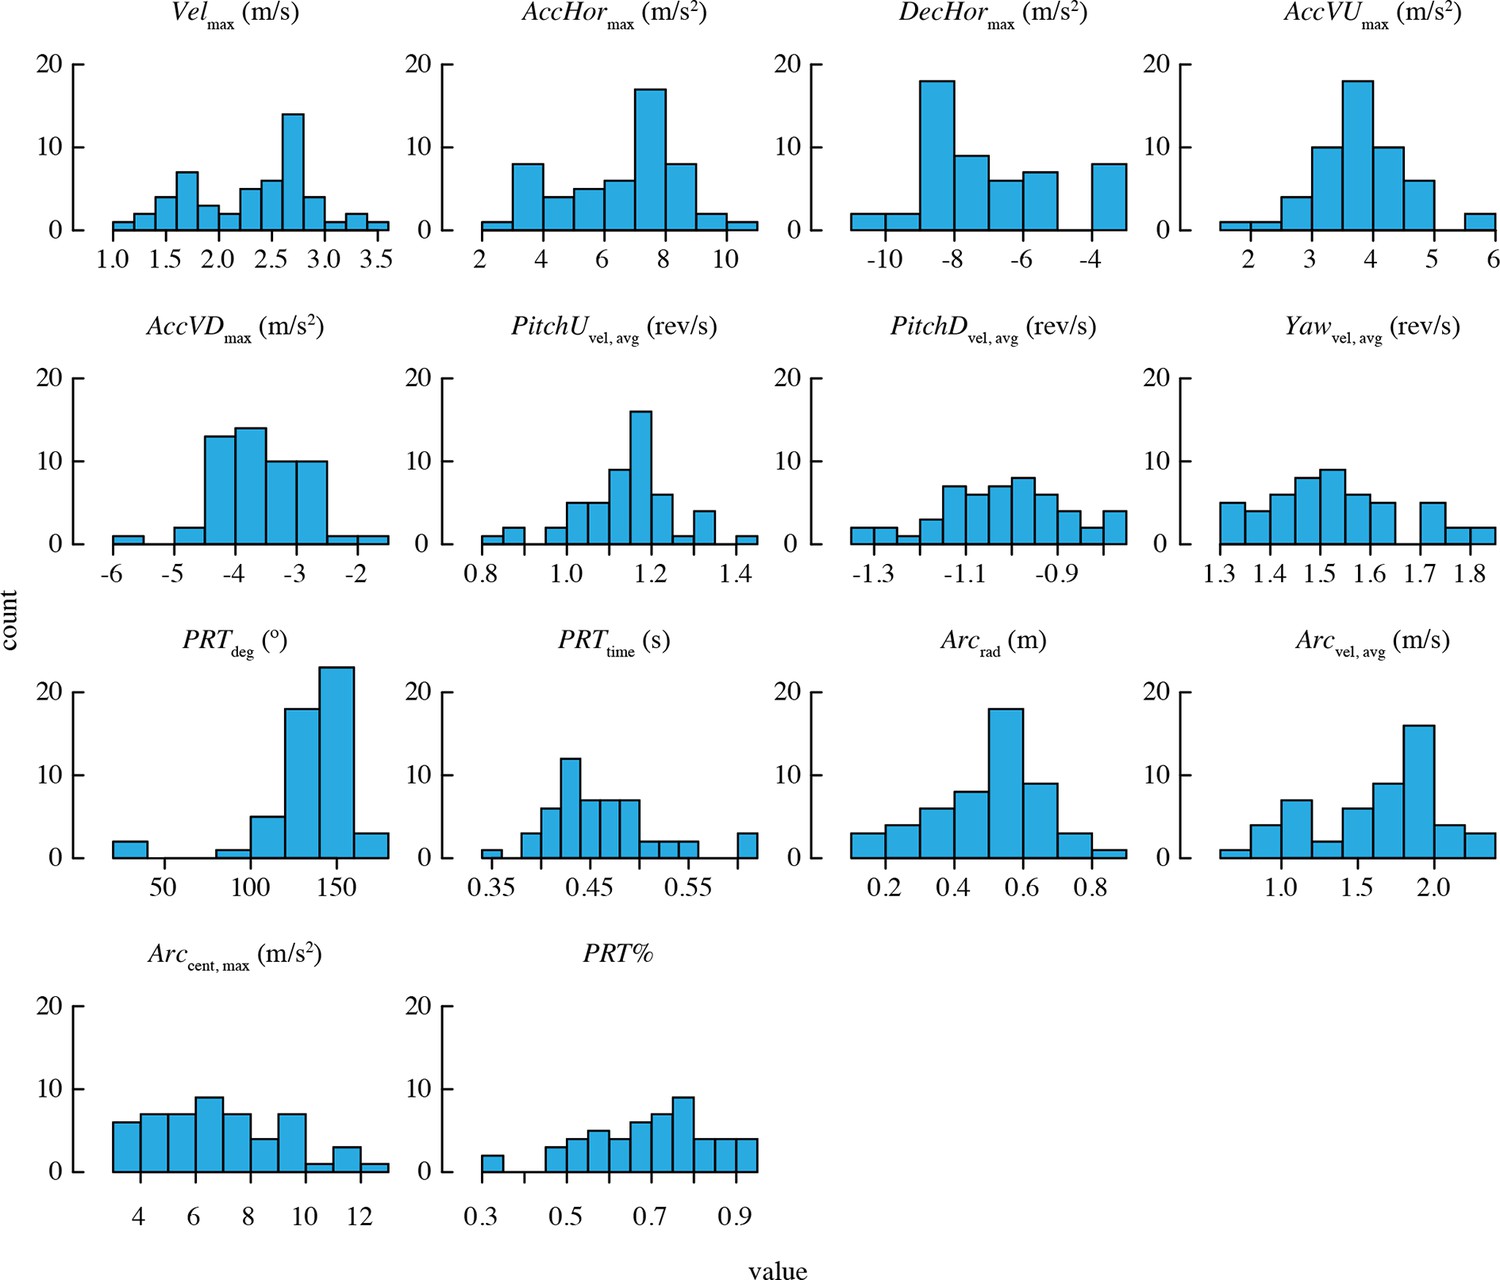
Distributions of mean performance metric values for n = 52 bird-trial combinations.
Only PRTdeg has statistically significant outliers. See Figure 2—figure supplement 1 for distributions of residuals from the best-fit model in each case. Note that two statistical outliers were omitted from the analysis of PRTdeg.
Figure 2—figure supplement 1
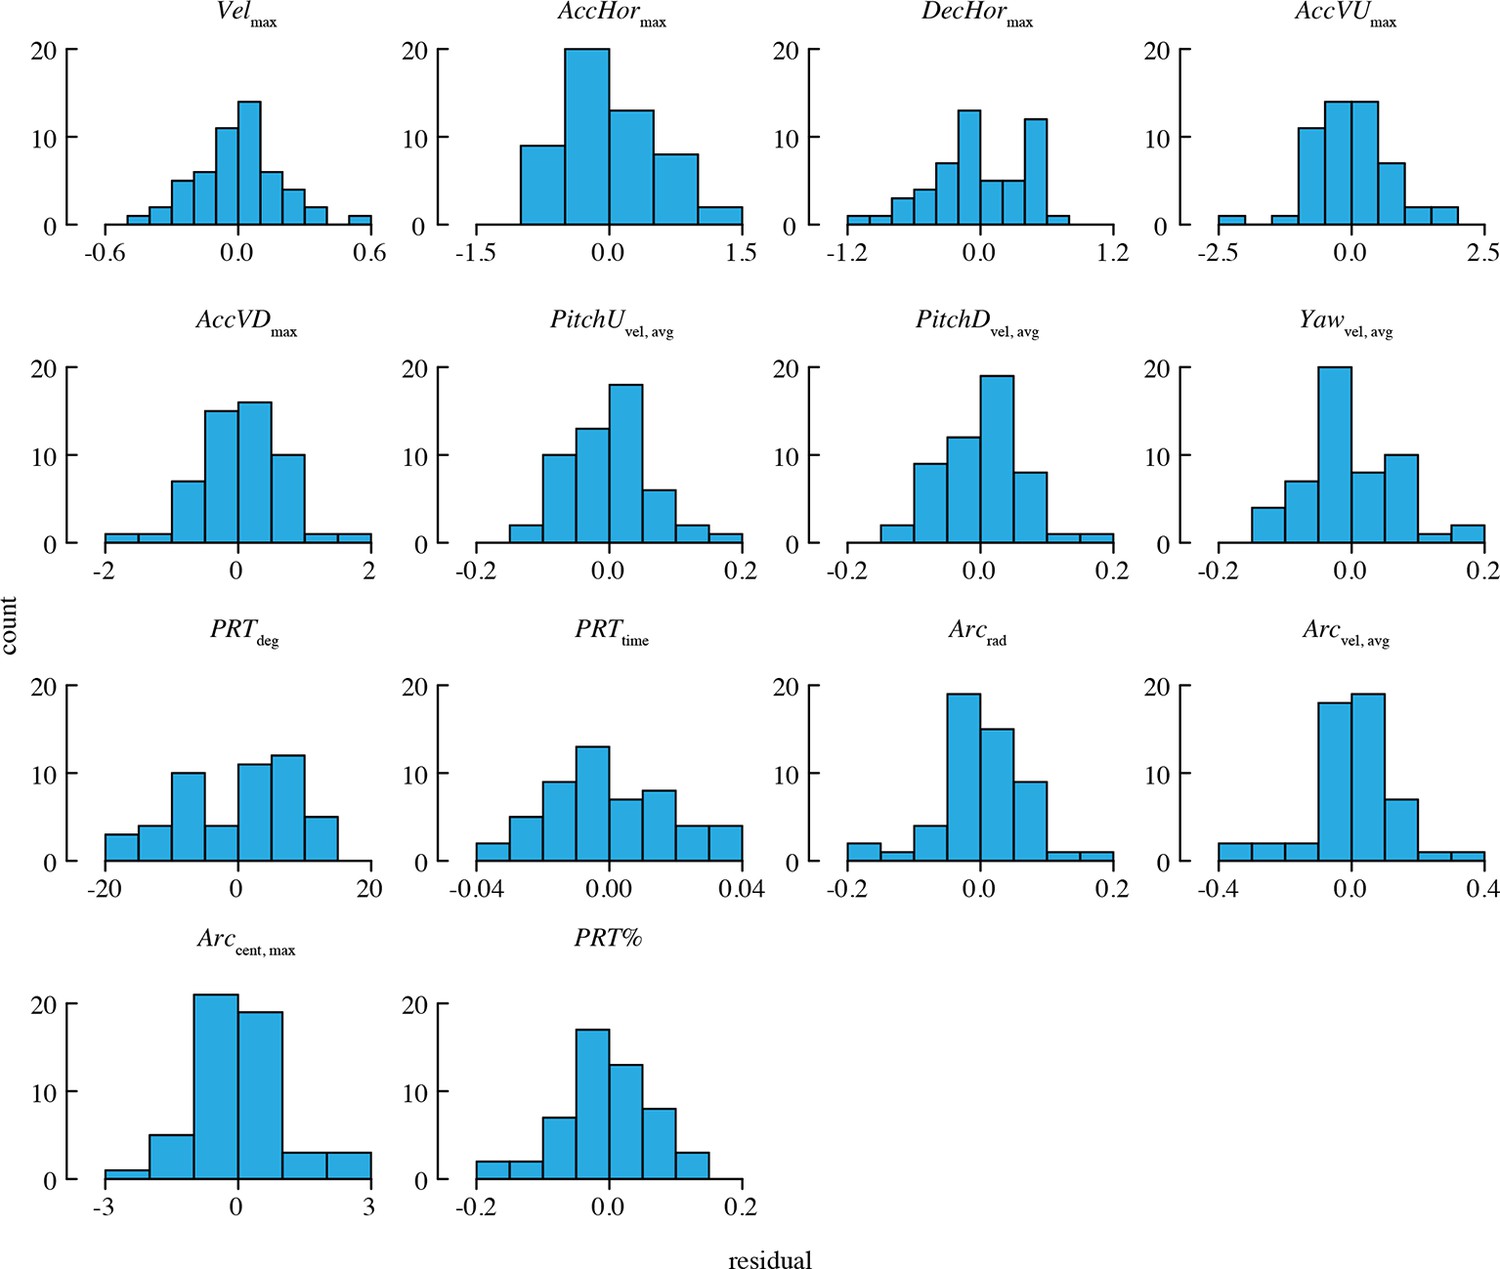
Distributions of residuals from the best-fit model for each performance metric.
Note that two statistical outliers were omitted from the analysis of PRTdeg.
Figure 3
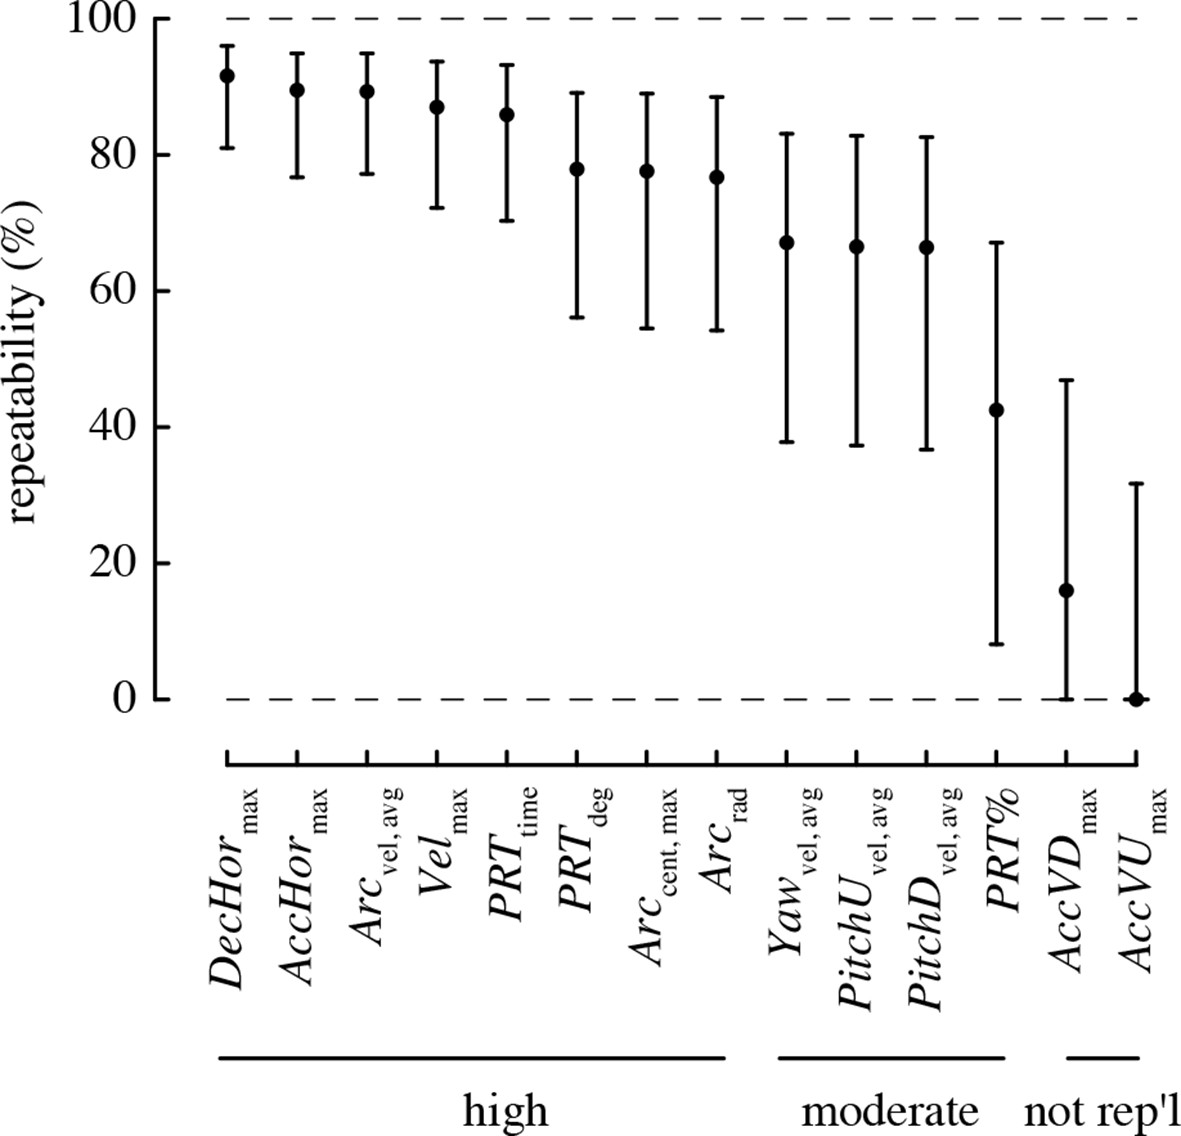
Most maneuvering performance metrics are highly repeatable.
Values > 70% are considered to have high repeatability, 40–70% moderate repeatability, and < 40% low repeatability. A metric is considered not repeatable if its 95% confidence intervals overlap zero.
Figure 4
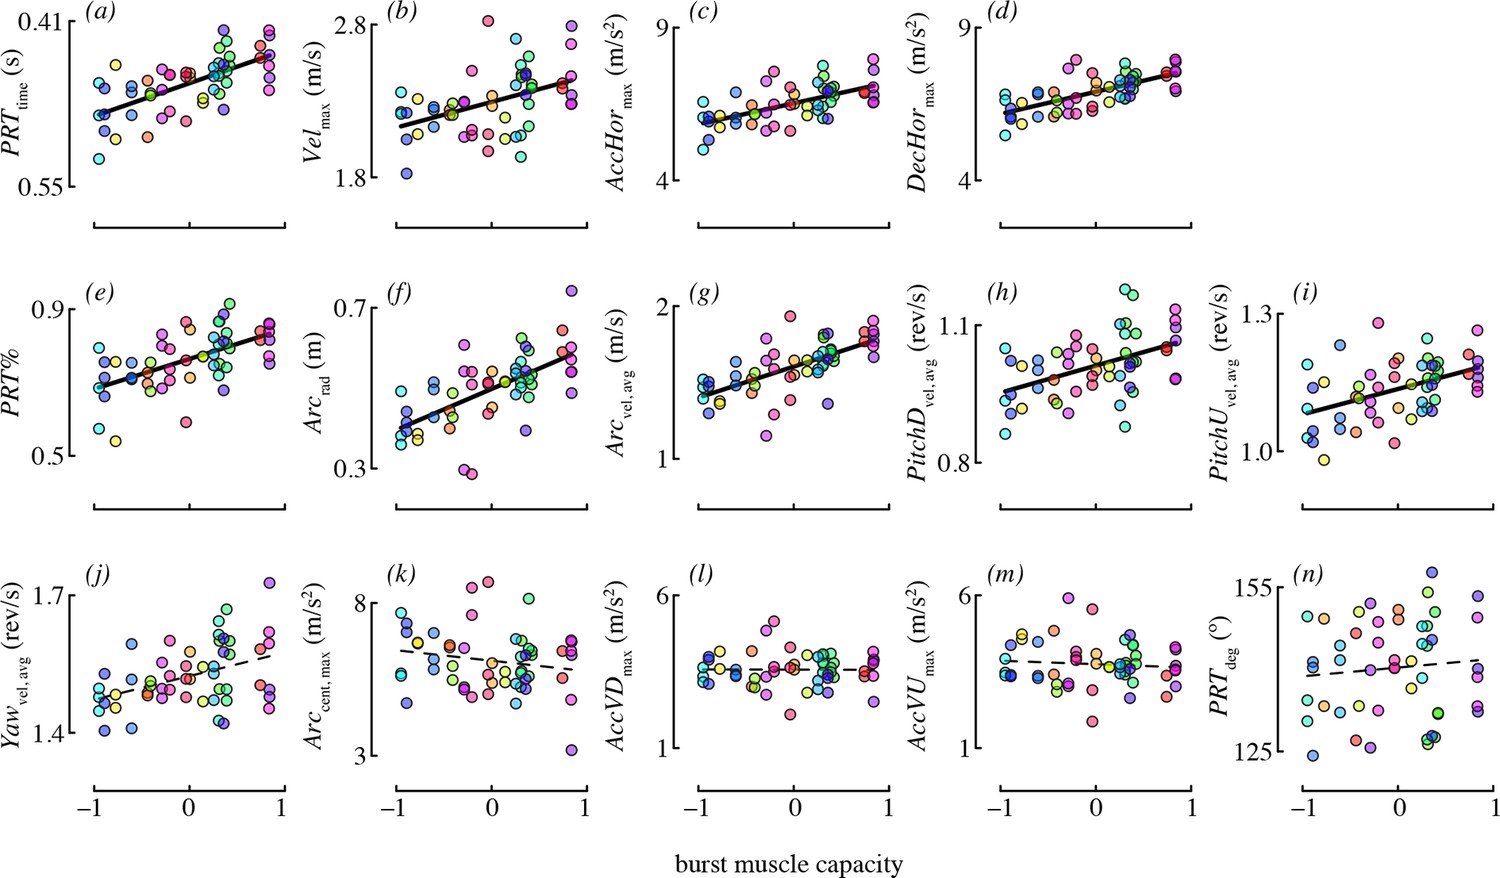
Burst muscle capacity was associated with most maneuvering performance metrics.
Each panel shows partial residuals for a performance metric (y-axis) in relation to burst muscle capacity (x-axis) for the most supported candidate model with burst capacity as a predictor. Partial residual values (y-axis) account for the other fixed effects in that model. Lines show model predictions assuming the median value of continuous predictors, and averaging across experiments and levels of competitor presence. Prediction lines are dashed for metrics where burst performance was not present in any of the supported models. Color is used to denote data points from the same bird (online version only).
Figure 5
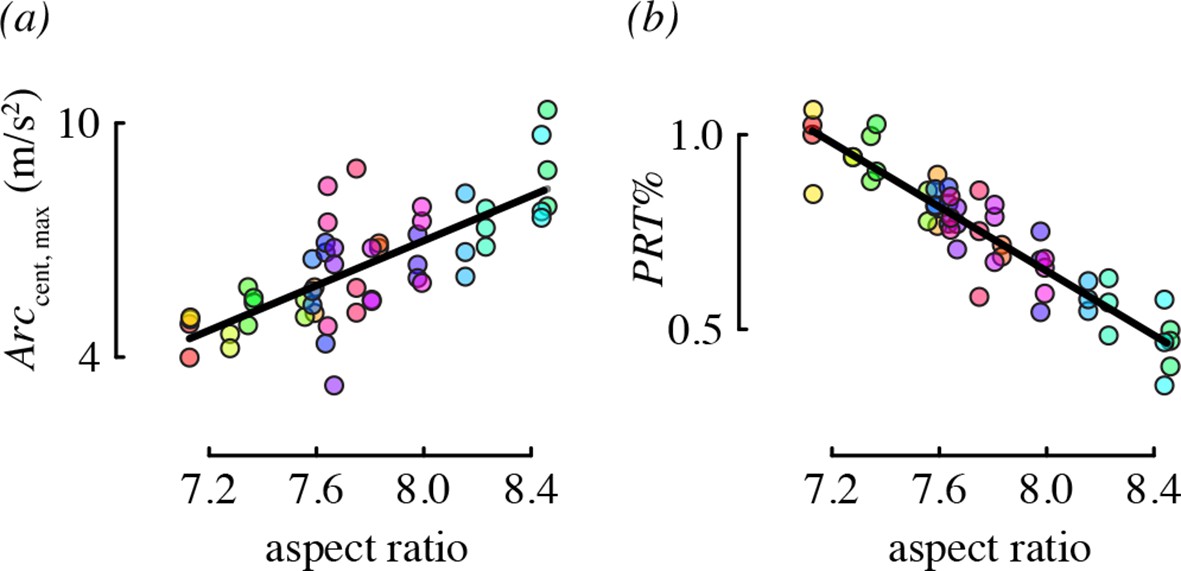
Aspect ratio was associated with two maneuvering performance metrics.
Each panel shows partial residual performance (y-axis) in relation to wing aspect ratio (x-axis) from a best-fit model that identified aspect ratio as an important predictor. Note that the partial residuals for PRT% in (b) go above 1 because PRT% was modeled as a normally-distributed (Gaussian) variable. All other features as in Figure 4.
Figure 6
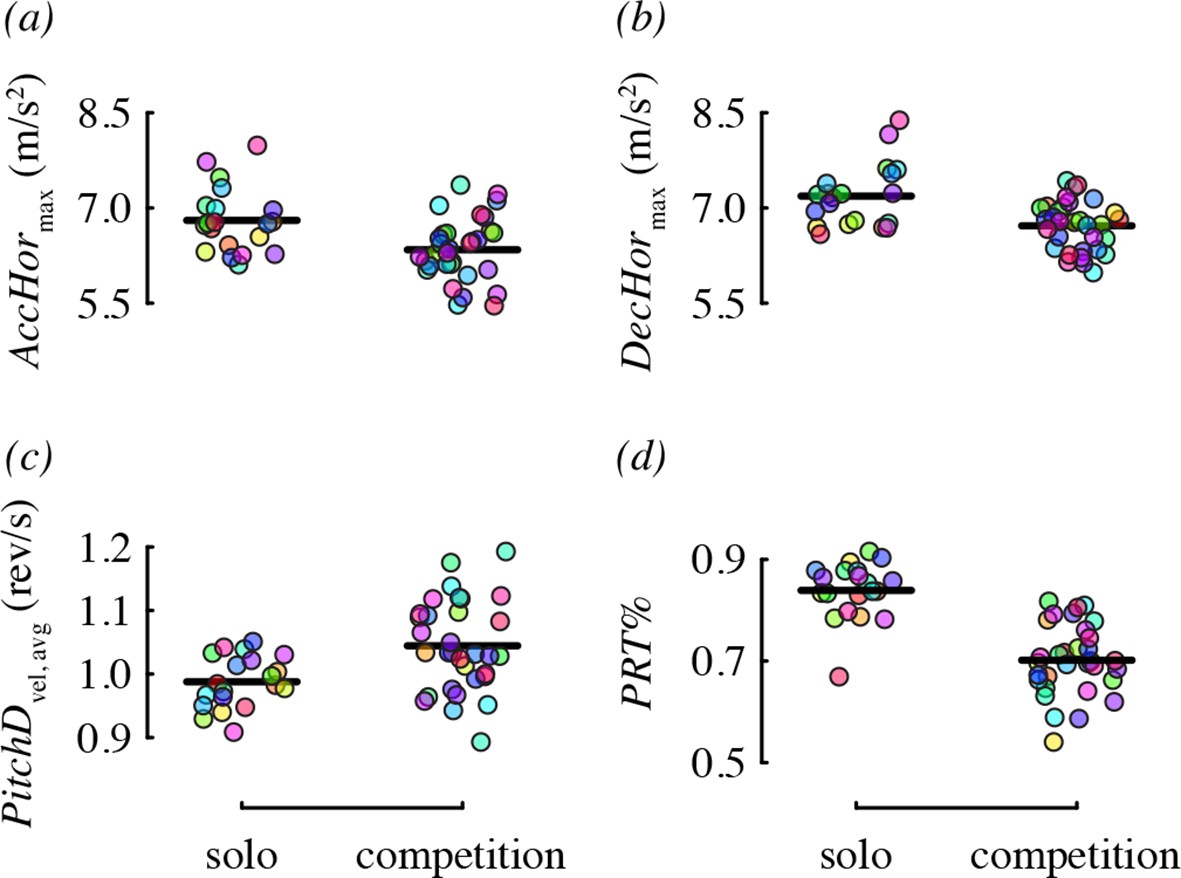
Competitor presence was associated with four maneuvering performance metrics.
Each panel shows residual performance (y-axis) in relation to competitor presence from a best-fit model where competitor presence had a detected effect. All other features as in Figure 4.
Figure 7

Arcing and pitch-roll turns are two classes of complex maneuver that differ in turn magnitude and duration.
Representative examples of arcing (a) and pitch-roll (b) turns are depicted from the above perspective. Arcing turns (Arc; orange) and pitch-roll turns (PRT; green) differed in the degrees turned (c) and elapsed time (d). Circles represent bird-trial means (n = 52) with grand means indicated with black lines. Histograms for the pooled dataset of all maneuvers are given on the right. The outliers for degrees turned in pitch-roll turns were included when calculating the grand means but not in the model analyses (Table 4).
Videos
Video 1
The multi-camera, automated tracking system filming two hummingbirds in the flight arena at 200 frames per second.
Continuously tracked sequences are assigned an object number (from 0 to 4 over this sequence). Body position and orientation are calculated and reprojected onto the video of four cameras. The videos are saved using a compression algorithm that only records the sections of the image that are moving (Straw et al. 2011). Thus, birds disappear from the video when they land and stop moving. The trajectory shown in Figure 1 is taken from the bird labeled #2 and begins at 5.1 seconds and ends at 8.05 seconds.
Tables
Table 1
Search parameters for the ten maneuvers analyzed in the study. The definitions, units, and symbols for the 14 related performance metrics are also provided.
| Maneuver | Search parameters | Performance metric | Units | Symbol |
|---|---|---|---|---|
| 3D acceleration | Start: velocity xyz minimum End: velocity xyz maximum Distance xyz > 25 cm | Maximum velocity | m/s | Velmax |
| Horizontal acceleration | Start: velocity xy minimum End: velocity xy maximum Distance xy > 25 cm Distance z < 10 cm | Maximum acceleration xy | m/s2 | AccHormax |
| Horizontal deceleration | Start: velocity xy maximum End: velocity xy minimum Distance xy > 25 cm Distance z < 10 cm | Maximum deceleration xy | m/s2 | AccDecmax |
| Vertical upwards acceleration | Start: velocity z minimum End: velocity z maximum Distance z > 25 cm | Maximum acceleration z | m/s2 | AccVUmax |
| Vertical downwards acceleration | Start: velocity z maximum End: velocity z minimum Distance z > 25 cm | Maximum acceleration z | m/s2 | AccVDmax |
| Pitch-up rotation | Start: pitch minimum End: pitch maximum Degrees rotated > 45 deg Distance xyz < 10 cm | Average pitch velocity | rev/s | PitchUvel,avg |
| Pitch-down rotation | Start: pitch maximum End: pitch minimum Degrees rotated > 45 deg Distance xyz < 10 cm | Average pitch velocity | rev/s | PitchDvel,avg |
| Yaw turn | Start: velocity yaw = 0 deg/s End: velocity yaw = 0 deg/s Degrees rotated > 90 deg Pitch maximum < 75 deg Distance xyz < 10 cm | Average yaw velocity | rev/s | Yawvel,avg |
| Arcing turn | Start: Δ heading velocity > 0.25 rev/s End Δ heading velocity < 0.25 rev/s Velocity xy min > 50 cm/s Distance xy > 25 cm Distance z < 10 cm | Average xy velocity* radius* Centripetal acceleration* | m/s m m/s2 | Arcvel, avg Arcrad Arccent, max |
| Pitch roll turn | Start: velocity maximum End: velocity maximum Pitch maximum > 75 deg Distance xy before velocityMin > 12.5 cm Distance xy after velocity Min < 12.5 cm Distance z < 10 cm | time† degrees turned† | s deg | PRTtime PRTdeg |
-
*for a 25 cm segment centered at the sharpest point of the turn
-
†for a 25 cm segment centered at the minimum velocity xyz
Table 2
Wing morphology and load lifting performance of male Anna’s hummingbirds (n = 20 individuals).
| Trait | Mean | Range |
|---|---|---|
| Wing length | 50.97 mm | [45.76, 55.45] |
| Wing area | 1355 mm2 | [1051, 1653] |
| Wing aspect ratio | 7.73 | [7.13, 8.46] |
| Body mass | 4.64 g | [4.09, 5.61] |
| Mass of weights lifted | 5.93 g | [4.00, 7.24] |
Table 3
Descriptive statistics and sample sizes for maneuvering performance. Grand mean values were calculated by first taking the mean of each bird’s trial averages (i.e., the bird means), and then taking the mean of the bird means (n = 20 birds in 20 solo trials and 16 paired competition trials).
| Maneuverability | Performance metric | # Trajectories | Grand mean | [Range of means] |
|---|---|---|---|---|
| Linear accelerations | Velmax | 71,007 | 2.22 m/s | [1.20, 2.94] |
| AccHormax | 47,287 | 6.30 m/s2 | [2.96, 8.83] | |
| DecHormax | 51,245 | 6.67 m/s2 | [9.03, 3.45] | |
| AccVUmax | 6,935 | 3.78 m/s2 | [2.98, 4.67] | |
| AccVDmax | 9,284 | 3.58 m/s2 | [4.69, 2.68] | |
| Rotational velocities | PitchUvel, avg | 6,085 | 1.13 rev/s | [0.91, 1.34] |
| PitchDvel, avg | 14,807 | 1.00 rev/s | [1.19, 0.78] | |
| Yawvel, avg | 12,660 | 1.52 rev/s | [1.32, 1.75] | |
| Complex turns | ||||
| Pitch-roll | PRTdeg | 17,133 | 133.3 º | [34.9, 162.7] |
| PRTtime | 17,133 | 0.47 s | [0.38, 0.60] | |
| Arcing | Arcrad | 6.945 | 0.48 m | [0.14, 0.70] |
| Arcvel, avg | 6,945 | 1.57 m/s | [0.80, 2.26] | |
| Arccent, max | 6,945 | 6.59 m/s2 | [3.42, 10.80] | |
| Use of turns | PRT% | 24,078 | 0.69 | [0.39, 0.87] |
Table 4
Maneuvering performance in relation to burst performance, wing morphology, and competitor presence (n = 20 birds in 20 solo trials and 16 paired competition trials). Standardized beta coefficients and R2GLMM(m) values are reported for either the best-fit model, or, if there was support for more than one model, the average of supported models. The standardized beta coefficient is a measure of effect size that can be compared among predictors in the same model. Relative importance is a measure of the weight of evidence in favor of a predictor on a scale from 0–1, and is reported for burst capacity and wing morphology variables as these alone were subject to model selection. Marginal R2GLMM(m) provides a measure of the combined explanatory power of fixed effects of interest (competitor presence, burst muscle capacity, and wing morphology effects combined). Details of all candidate models are provided in Supplementary file 1.
| Model | Support for | Fixed effects | Std beta coef [95% CI] | Relative importance | R2GLMM(m) Burst + morphology + competitor |
|---|---|---|---|---|---|
| Velmax | burst | competitor presence mass burst wing length wing aspect ratio experiment (CA1) experiment (CA2) days post-capture | –0.04 [–0.18, 0.10] 0.10 [–0.01, 0.22] 0.09 [0.00, 0.18] –0.08 [–0.22, 0.06] 0.10 [–0.07, 0.28] 1.01 [0.59, 1.42] 1.06 [0.68, 1.43] –0.07 [–0.24, 0.11] | -- -- 1.00 0.25 0.26 -- -- -- | 0.28 |
| AccHormax | burst + competition | competitor presence mass burst experiment(CA1) experiment(CA2) days post-capture | –0.46 [–0.82, –0.11] 0.20 [–0.28, 0.69] 0.39 [0.00, 0.77] 4.01 [2.46, 5.56] 3.68 [2.72, 4.64] –0.39 [–1.09, 0.32] | -- -- 1.00 -- -- -- | 0.18 |
| DecHormax | burst + competition | competitor presence mass burst experiment(CA1) experiment(CA2) days post-capture | –0.47 [–0.78, –0.16] 0.31 [–0.13, 0.74] 0.41 [0.06, 0.76] 3.86 [2.47, 5.25] 3.64 [2.76, 4.51] –0.24 [–0.88, 0.39] | -- -- 1.00 -- -- -- | 0.19 |
| AccVUmax | intercept-only | NA | NA | NA | 0 (NA) |
| AccVDmax | intercept-only | NA | NA | NA | 0 (NA) |
| PitchUvel, avg | burst | competitor presence mass burst experiment(CA1) experiment(CA2) | 0.02 [–0.02, 0.06] 0.00 [–0.04, 0.04] 0.03 [–0.01, 0.07] 0.14 [0.06, 0.23] 0.13 [0.03, 0.23] | -- -- 1.00 -- -- | 0.10 |
| PitchDvel, avg | competition + burst | competitor presence mass burst wing length wing aspect ratio experiment(CA1) experiment(CA2) | 0.06 [0.01, 0.10] 0.01 [–0.04, 0.05] 0.03 [–0.01, 0.08] 0.04 [–0.03, 0.12] –0.04 [–0.13, 0.05] 0.19 [0.03, 0.34] 0.22 [0.03, 0.41] | -- -- 0.66 0.37 0.28 -- -- | 0.18 |
| Yawvel, avg | intercept-only | NA | NA | NA | 0 (NA) |
| PRTdeg | intercept-only | NA | NA | NA | 0 (NA) |
| PRTtime | burst | competitor presence mass burst wing length wing aspect ratio experiment(CA1) experiment(CA2) | 0.00 [–0.01, 0.01] –0.01 [–0.03, 0.00] –0.02 [–0.03, 0.00] –0.01 [–0.03, 0.01] 0.01 [–0.01, 0.04] –0.08 [–0.12, –0.03] –0.11 [–0.16, –0.05] | – -- 1.00 0.21 0.23 – -- | 0.29 |
| Arcrad | burst | competitor presence mass burst wing aspect ratio experiment(CA1) experiment(CA2) | –0.02 [–0.07, 0.03] 0.01 [–0.03, 0.06] 0.06 [0.01, 0.10] –0.06 [–0.15, 0.03] 0.25 [0.12, 0.37] 0.29 [0.06, 0.52] | -- -- 1.00 0.44 – -- | 0.22 |
| Arcvel, avg | burst | competitor presence mass burst experiment(CA1) experiment(CA2) days post-capture | –0.01 [–0.09, 0.08] 0.03 [–0.06, 0.12] 0.11 [0.04, 0.19] 0.89 [0.59, 1.19] 0.74 [0.56, 0.92] –0.06 [–0.20, 0.08] | – – 1.00 – -- -- | 0.18 |
| Acccent, max | wing shape | competitor presence mass wing aspect ratio experiment(CA1) experiment(CA2) days post-capture | 0.29 [–0.37, 0.94] –0.20 [–0.74, 0.34] 1.09 [0.19, 1.99] 5.93 [4.02, 7.84] 0.85 [–1.59, 3.28] –1.76 [–2.62, –0.90] | -- -- 1.00 -- -- -- | 0.36 |
| PRT% | wing shape + competition + burst + wing size | competitor presence mass burst wing length wing aspect ratio experiment(CA1) experiment(CA2) | –0.14 [–0.19, –0.09] 0.00 [–0.04, 0.05] 0.04 [0.00, 0.09] –0.06 [–0.13, 0.01] –0.16 [–0.24, –0.07] 0.17 [–0.03, 0.36] 0.44 [0.19, 0.69] | -- -- 1.00 0.61 1.00 -- -- | 0.27 |
Table 5
Candidate models of maneuvering performance. All models include an intercept as well as a random effect of bird identity to account for repeated measures of individuals.
| Model | Fixed effects | Description |
|---|---|---|
| 1. | Solo/comp + experiment + body mass + wing length | Wing size |
| 2. | Solo/comp + experiment + body mass + wing aspect ratio | Wing shape |
| 3. | Solo/comp + experiment + body mass + wing length + wing aspect ratio | Wing size & shape |
| 4. | Solo/comp + experiment + body mass + weight lifted | Burst power |
| 5. | Solo/comp + experiment + body mass + weight lifted + wing length | Burst power & wing size |
| 6. | Solo/comp + experiment + body mass + weight lifted + wing aspect ratio | Burst power & wing shape |
| 7. | Solo/comp + experiment + body mass + weight lifted + wing length + wing aspect ratio | Burst power, wing size & shape |
| 8. | Intercept-only |
-
*Candidate models 1-7 also include a fixed effect of days post-capture for the following metrics: Velmax, AccHormax, DecHormax, Arcvel, avg, and Arccent, max
Additional files
-
Supplementary file 1
Details and ranking of candidate models of hummingbird maneuvering 788 performance, and unstandardized regression coefficients.
- https://doi.org/10.7554/eLife.11159.018
Download links
A two-part list of links to download the article, or parts of the article, in various formats.
Downloads (link to download the article as PDF)
Open citations (links to open the citations from this article in various online reference manager services)
Cite this article (links to download the citations from this article in formats compatible with various reference manager tools)
Burst muscle performance predicts the speed, acceleration, and turning performance of Anna’s hummingbirds
eLife 4:e11159.
https://doi.org/10.7554/eLife.11159


