Bitter taste receptors confer diverse functions to neurons
- Yale University, United States
Figures
Figure 1
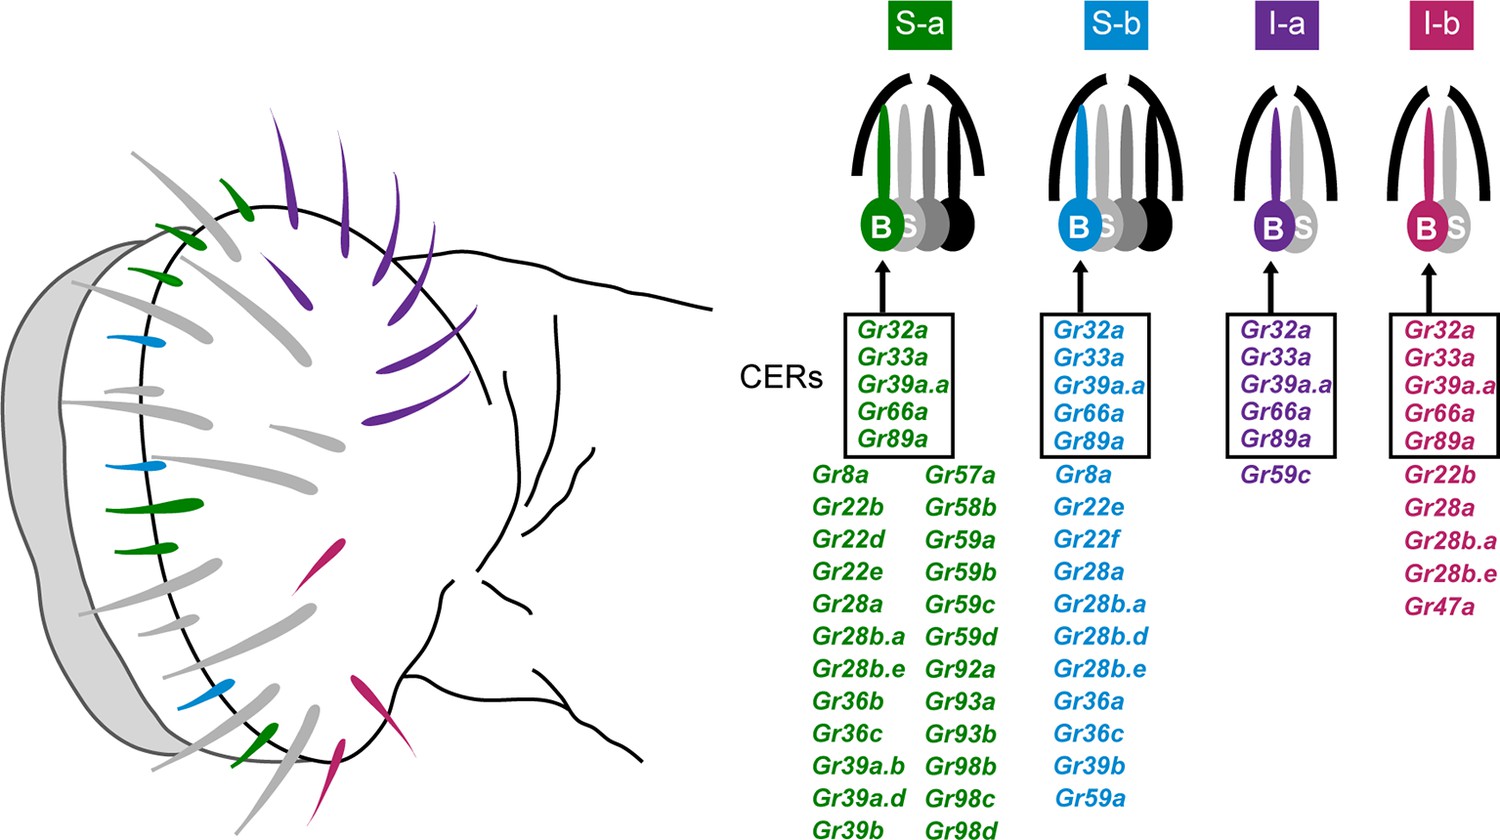
Sensillum types on the labellum.
Left: The four bitter-responsive types, S-a (green), S-b (blue), I-a (purple) and I-b (red), are differently distributed on the labellar surface. L sensilla (gray) show little if any response to bitter compounds. Right: S-a and S-b have four gustatory receptor neurons (GRNs), one of which is bitter-responsive, and I-a and I-b sensilla have two GRNs, one of which is bitter-responsive. The bitter-responsive neuron (B) of each sensillum type expresses a different combination of Grs. Five Grs, referred to as 'Commonly Expressed Receptors' (CERs; in rectangles), are expressed in every bitter neuron on the labellum. Many or all sensilla also contain a sugar-sensitive neuron (S). Mapping of Grs to neurons is based on GAL4 driver expression. Figure adapted from Weiss et al. (2011).
Figure 2
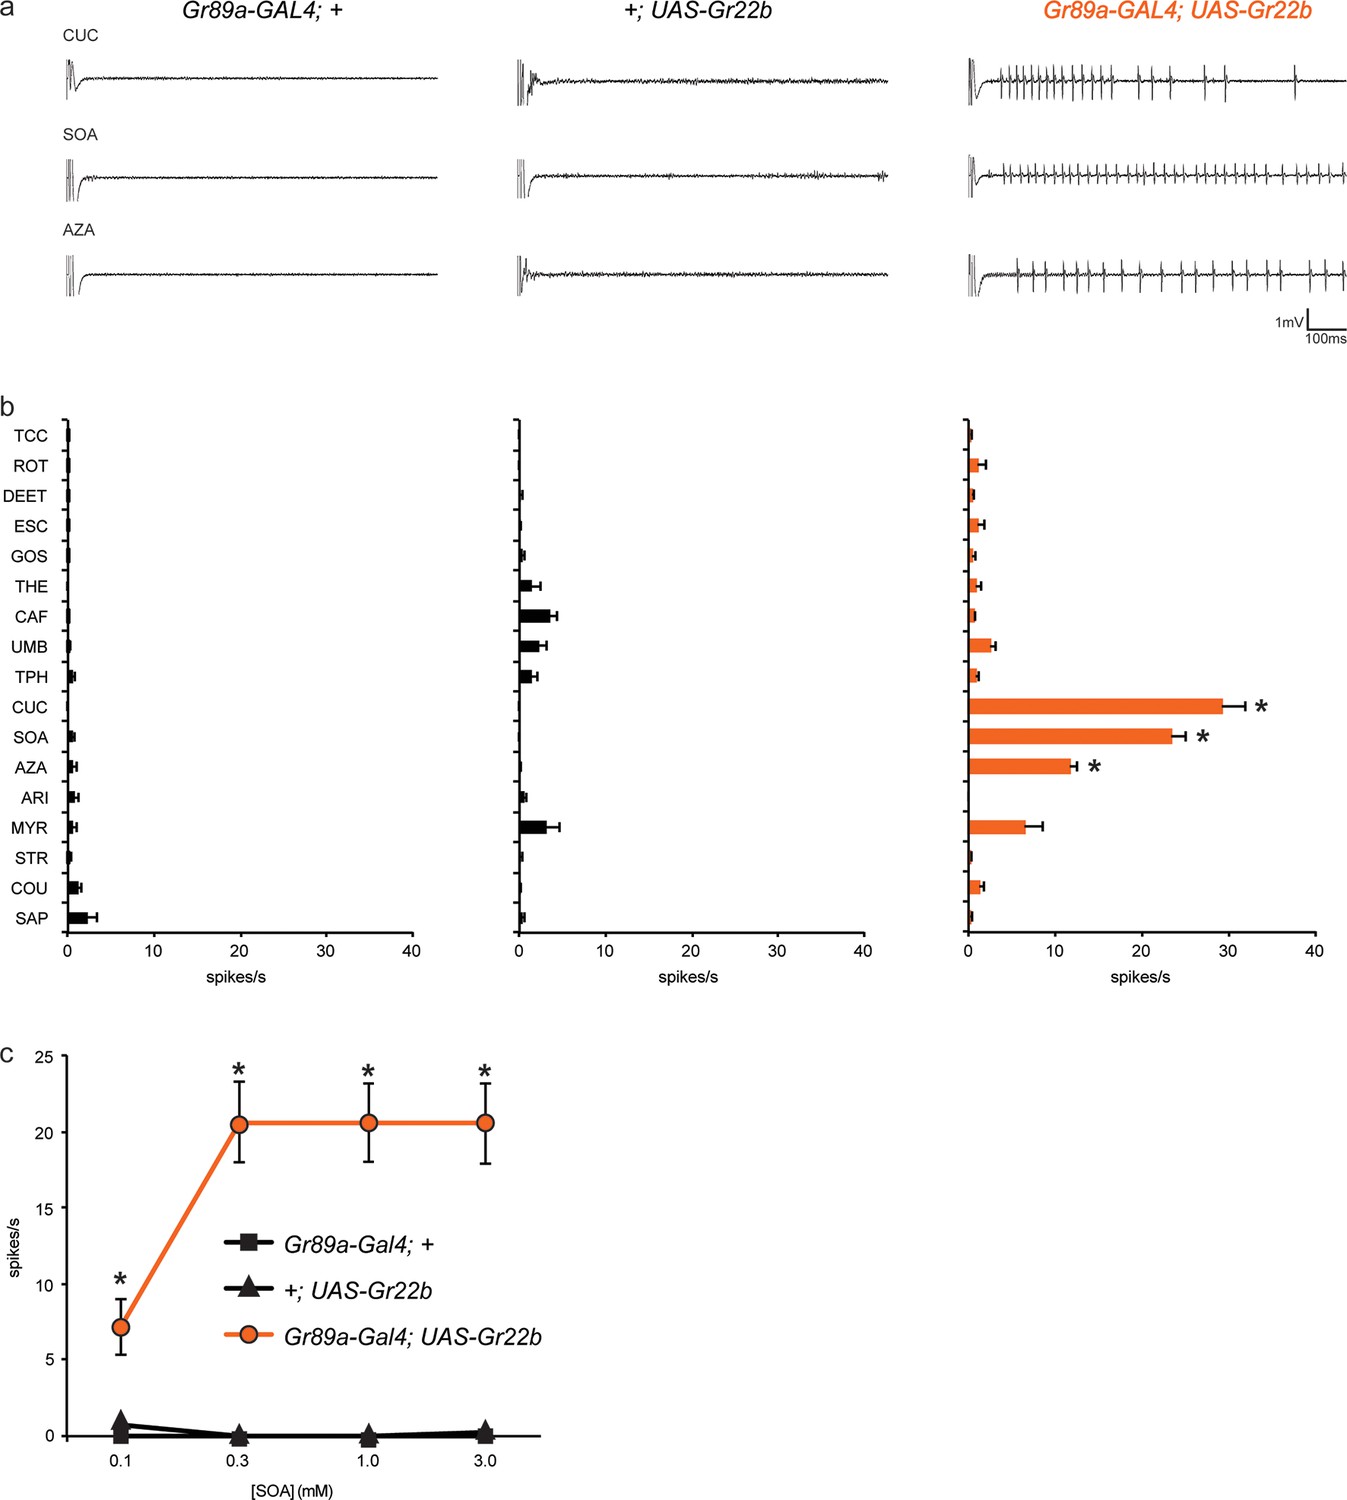
Ectopic expression of Gr22b in I-a bitter neurons leads to novel responses to three bitter compounds.
(a) Sample electrophysiological responses from I-a sensilla of parental controls and of flies ectopically expressing UAS-Gr22b. (b) Mean responses. Asterisks indicate responses that are different from both parental controls as measured by a two-way ANOVA, with Bonferroni multiple comparisons correction (p ≤ 0.0001, n ≥ 20). Only compounds that do not elicit responses greater than that from a TCC control solution in wild type I-a sensilla, as measured by a one-way ANOVA, are shown. (c) Responses of I-a sensilla to SOA in Gr22b-expressing flies, across a range of concentrations, relative to both parental controls (* indicates p ≤ 0.0001, n ≥ 17). Concentrations are graphed on a logarithmic scale.
Figure 3
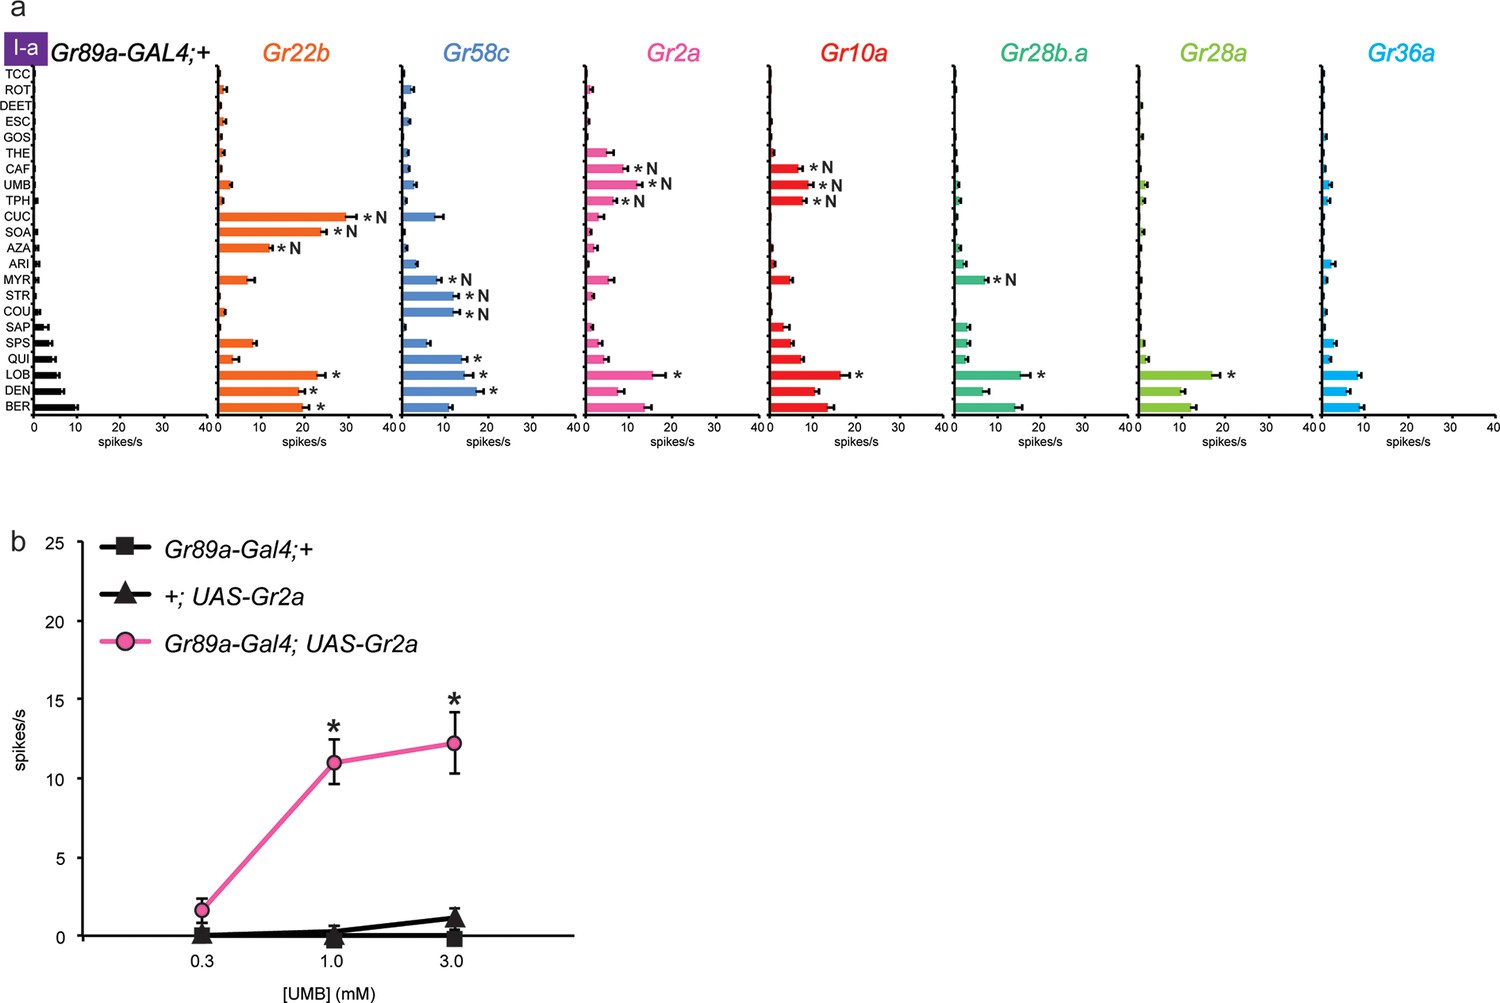
Electrophysiological responses of sensilla in which seven individual Grs are expressed in I-a bitter neurons.
(a) 'N' indicates a novel response, to which there was no significant response in the wild-type control. Each experimental genotype is Gr89a-GAL4; UAS-GrX. Asterisks indicate responses that are different from the Gr89a-GAL4;+ parental control (two-way ANOVA, with Bonferroni multiple comparisons correction. p ≤ 0.0001, except that p ≤ 0.001 for Gr58c/COU; p<0.01 for Gr2a/TPH and Gr10a/TPH; p ≤ 0.05 for Gr58c/MYR, Gr10a/CAF, and Gr28b.a/MYR. n ≥ 7). (b) Responses to UMB from Gr2a-expressing flies, across a range of concentrations, and relative to both parental controls (asterisks indicate p ≤ 0.0001, n ≥ 17). Concentrations are graphed on a logarithmic scale.
Figure 4
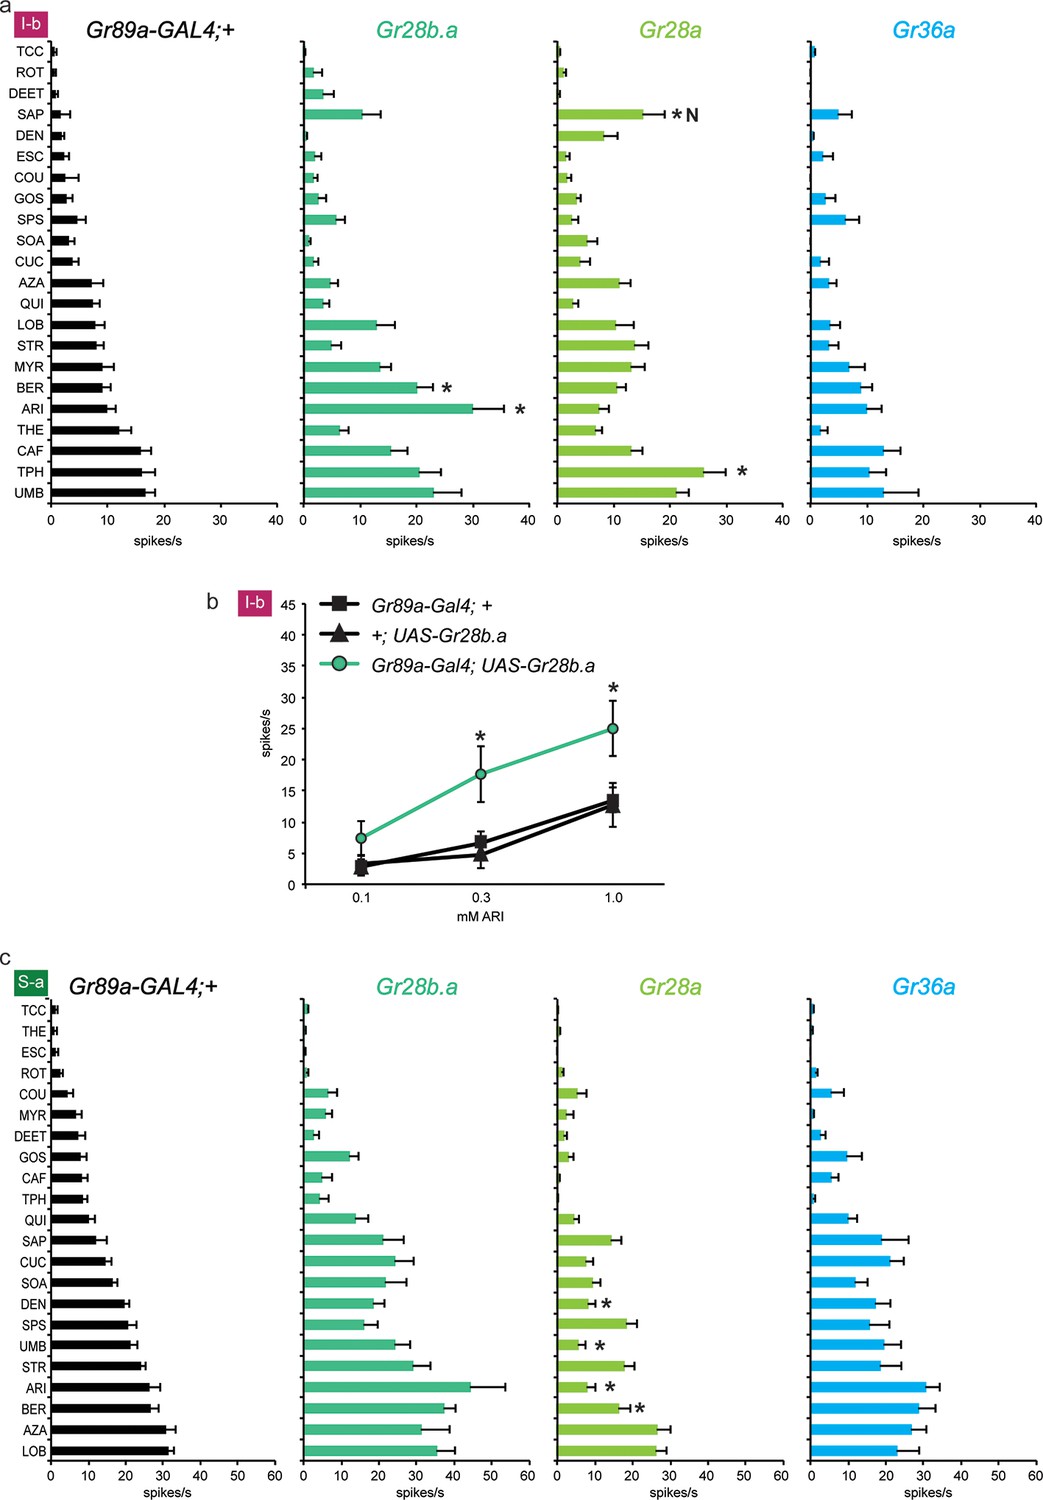
Electrophysiological responses of sensilla in which three individual Grs (Gr28b.a, Gr28a, Gr36a) are expressed in I-b (a) and S-a (c) bitter neurons.
Tastant order and x-axis scales differ between panels a and c for clarity of presentation. The experimental genotypes were Gr89a-GAL4; UAS-GrX. (a) In I-b sensilla, Gr28b.a conferred an increased response to ARI (p ≤ 0.0001, n ≥ 10) and BER (p ≤ 0.01, n ≥ 10) relative to the GAL4 parental control line. Gr28a conferred response to SAP (p ≤ 0.001, n ≥ 13) and TPH (p ≤ 0.05, n ≥ 13) relative to the GAL4 parental control line. Gr36a conferred no increased responses (n ≥ 6). (b) A dose-response analysis using both parental controls revealed increases in ARI response in I-b sensilla (* indicates p ≤ 0.05, n ≥ 22). Concentrations are graphed on a logarithmic scale. (c) In S-a sensilla, Gr28a conferred decreased responses (ARI: p ≤ 0.0001, UMB: p ≤ 0.001, DEN and BER: p ≤ 0.02. n ≥ 11), while Gr28b.a and Gr36a did not (n ≥ 6).
Figure 5
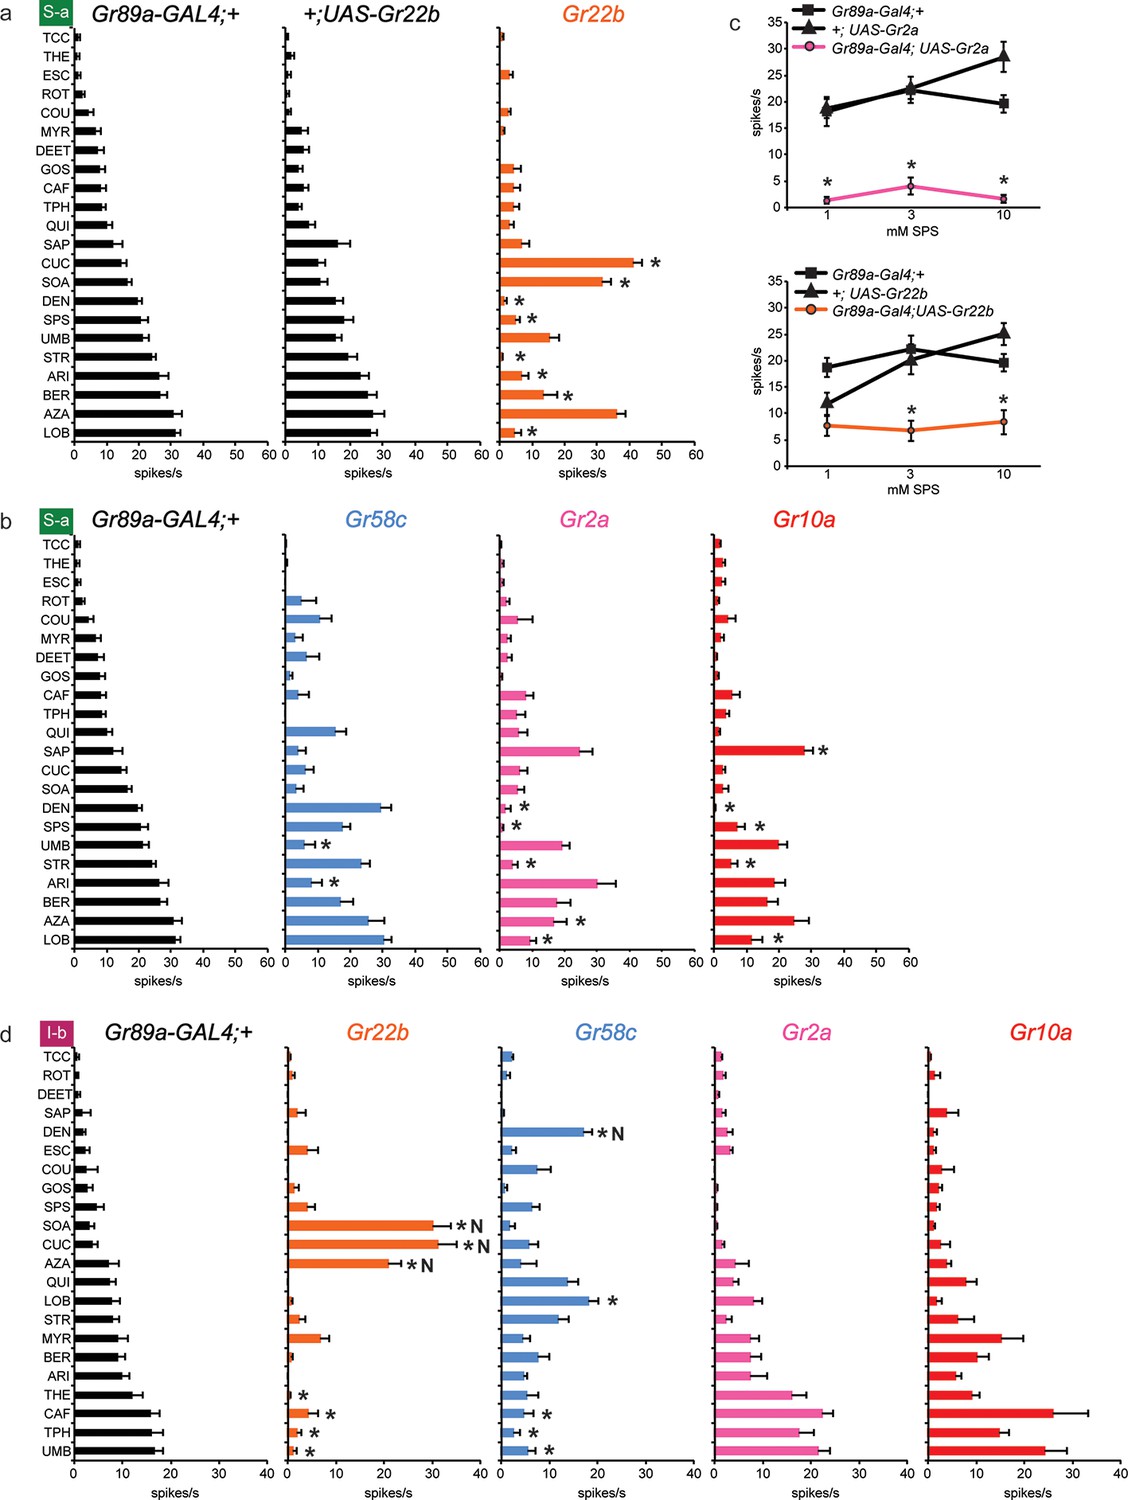
Electrophysiological responses of sensilla in which four individual Grs are expressed in S-a and I-b bitter neurons.
Each experimental genotype is Gr89a-GAL4; UAS-GrX. (a) Response profiles of both parental controls and flies expressing UAS-Gr22b in S-a bitter neurons. Asterisks indicate responses that are different from both parental controls (two-way ANOVA, with Bonferroni multiple comparisons correction; p ≤ 0.0001, except BER: p ≤ 0.0005. n ≥ 7). Response profiles generated by expression of Gr22b, Gr58c, Gr2a, Gr10a in S-a bitter neurons (b) and I-b bitter neurons (d). Asterisks indicate responses that are different from the parental control (two-way ANOVA, with Bonferroni multiple comparisons correction; p ≤ 0.0001, except that for S-a sensilla, p≤0.001 for Gr2a/SPS, Gr2a/LOB, Gr10a/DEN, Gr10a/LOB; p ≤ 0.01 for Gr2a/DEN, Gr2a/AZA, Gr58c/ARI; p≤0.03 for Gr10a/SAP, Gr10a/SPS, and Gr58c/UMB. For I-b sensilla, p ≤ 0.001 for Gr22b/TPH; p≤0.01 for Gr22b/THE, Gr22b/CAF, Gr58c/LOB, and Gr58c/TPH; p ≤ 0.05 for Gr58c/CAF and Gr58c/UMB. n ≥ 6). (c) Expression of Gr2a and Gr22b in S-a bitter neurons conferred suppression of the endogenous response to SPS. Asterisks indicate responses that are different from both parental controls (p ≤ 0.002, n ≥ 18). Concentrations are graphed on a logarithmic scale.
Figure 6
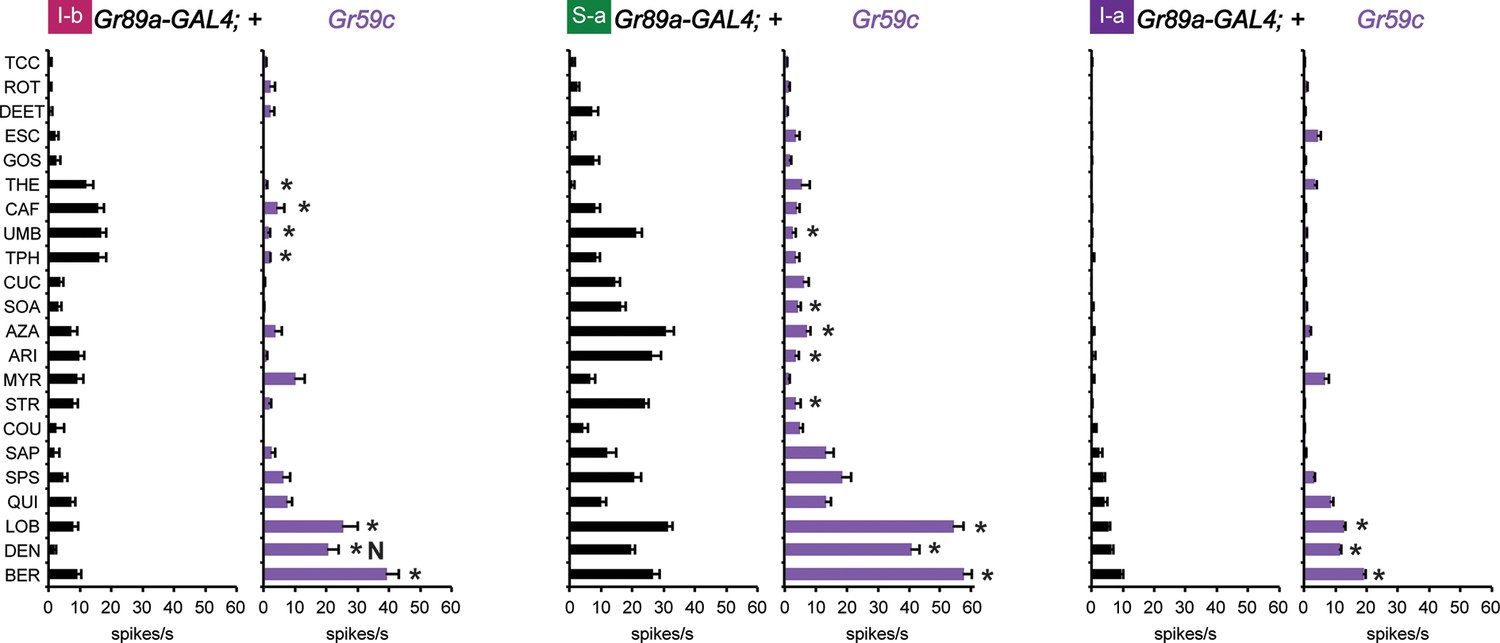
Electrophysiological response profiles generated by expression of Gr59c in I-b, S-a, and I-a, relative to the wild-type GAL4 parental control (p ≤ 0.001, except that p≤ 0.05 in the case of the response of I-b to THE and CAF. n ≥ 8).
The experimental genotype was Gr89a-GAL4; UAS-Gr59c.
Figure 7 with 2 supplements
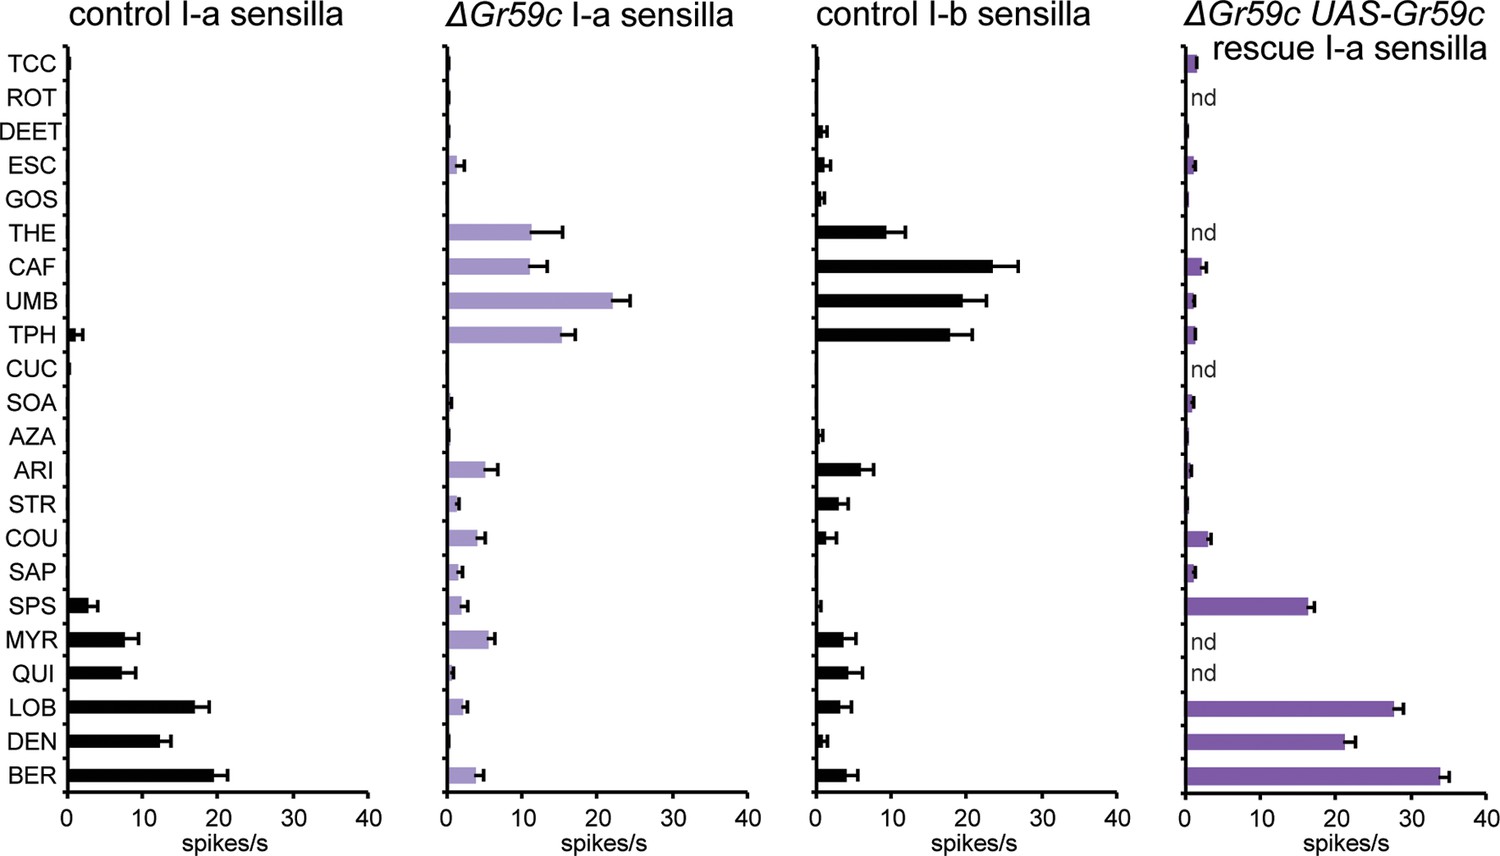
Electrophysiological response profiles of w− Canton-S (wCS) control I-a sensilla, ΔGr59c mutant I-a sensilla, wCS control I-b sensilla, and ΔGr59c I-a sensilla that had been rescued with a UAS-Gr59c construct driven by Gr66a-GAL4.
Rescued ΔGr59c flies were tested with a reduced panel of 16 compounds; the other genotypes were tested with the full panel of 21 compounds.
Figure 7—figure supplement 1

The ΔGr59c mutation was generated through FLP-FRT-mediated recombination between piggybac transposon lines f03881 and f04393 (Parks et al., 2004).
A ~17kb region of the genome was deleted; it encompassed Gr59c, as well as several other genes. This deletion was backcrossed to a wCS control background for 7 generations.
Figure 7—figure supplement 2

Electrophysiological response profiles of wCS control S-a sensilla and ΔGr59c S-a sensilla.
Response to DEN is reduced in ΔGr59c mutant S-a sensilla (p ≤ 0.0001, n ≥ 12).
Figure 8
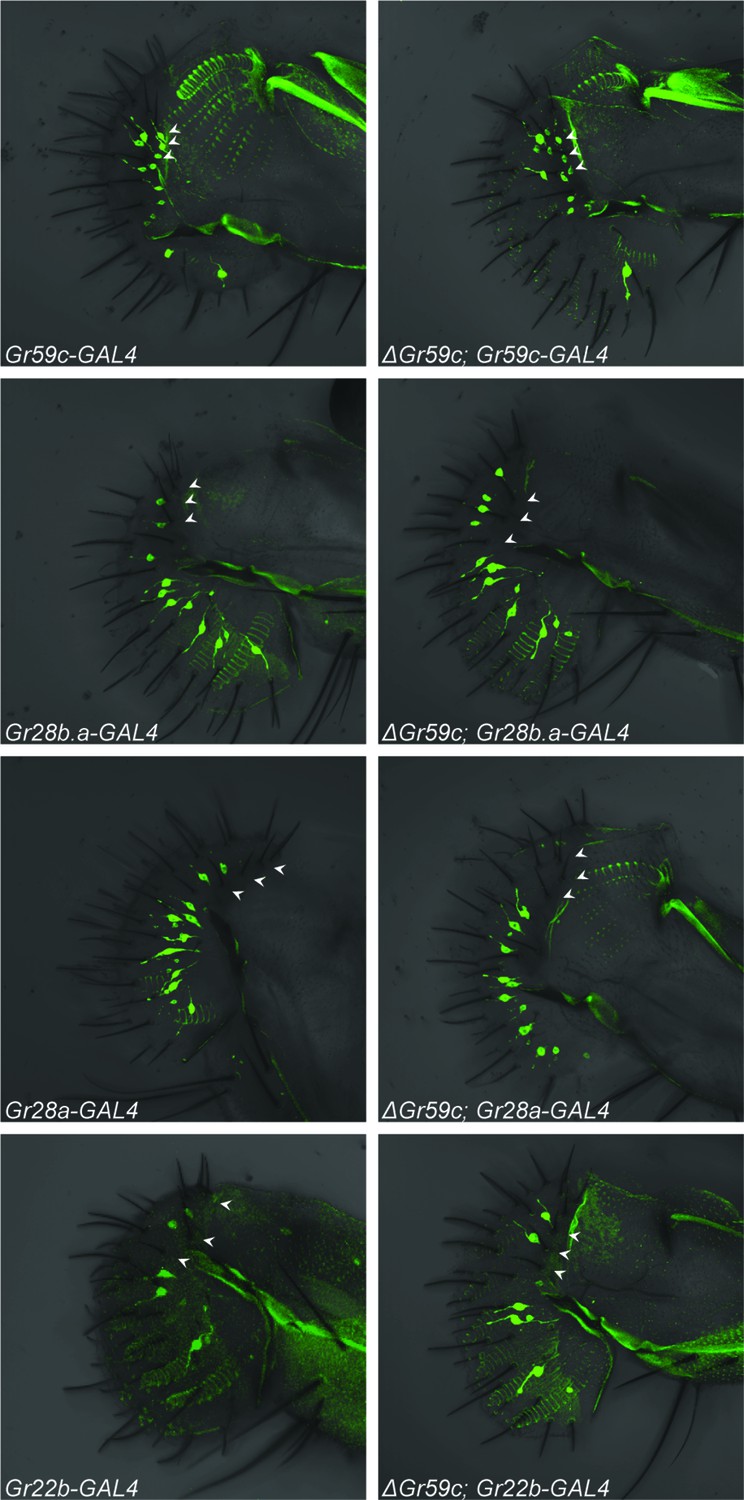
Fluorescent confocal microscopy of whole-mount labella reveals that the ΔGr59c mutation does not cause loss of Gr59c-GAL4 expression in I-a sensilla (top two panels).
The ΔGr59c mutation does not cause gain of Gr28b.a-, Gr28a-, or Gr22b-GAL4 expression in I-a sensilla (bottom six panels). (n ≥ 5 flies per genotype). White arrowheads indicate the positions of representative I-a neurons. Cell bodies of neurons that innervate I-a sensilla can be seen only in the top two panels, i.e. in Gr59c-GAL4 and ΔGr59c; Gr59c-GAL4, as indicated by white arrowheads. Full genotypes tested: Sp/CyO; Gr-GAL4/UAS-GFP and ΔGr59c; Gr-GAL4/UAS-GFP.
Figure 9
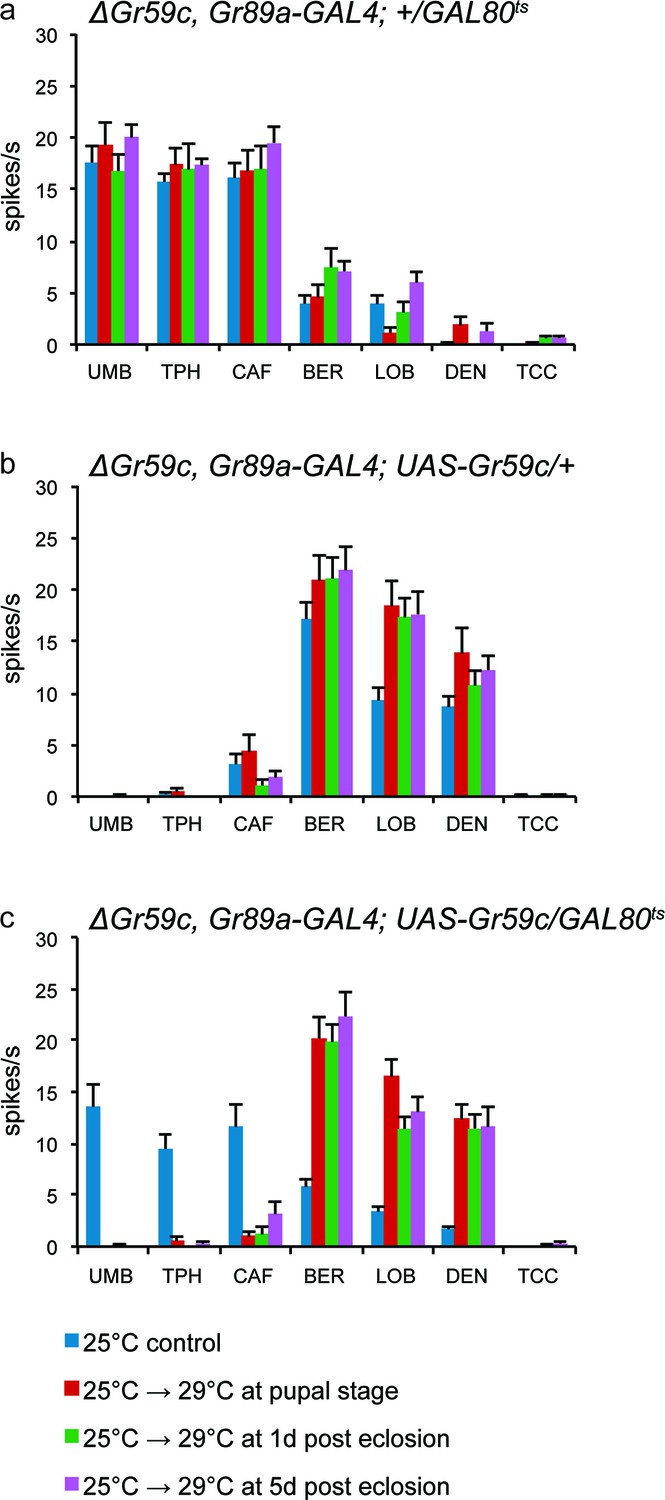
UAS-Gr59c expression in adult flies is sufficient to restore wild-type responses to ΔGr59c mutant I-a sensilla.
All genotypes have identical 2nd chromosomes: ΔGr59c, Gr89a-GAL4. Flies were subjected to the four indicated temperature regimes. (a) GAL80ts parental control flies without UAS-Gr59c display mutant, elevated responses to UMB, TPH, and CAF in all regimes. (b) UAS-Gr59c parental control flies without GAL80ts in all cases display wild-type responses to BER, LOB, and DEN. (c) Experimental flies (UAS-Gr59c/GAL80ts) display mutant responses when kept continuously at GAL80ts permissive temperature (25°C), indicating that GAL80ts is suppressing UAS-Gr59c expression. However, when GAL80ts is inactivated at any time by shifting flies to higher temperature (29°C), thus activating UAS-Gr59c, flies display wild-type responses.
Figure 10
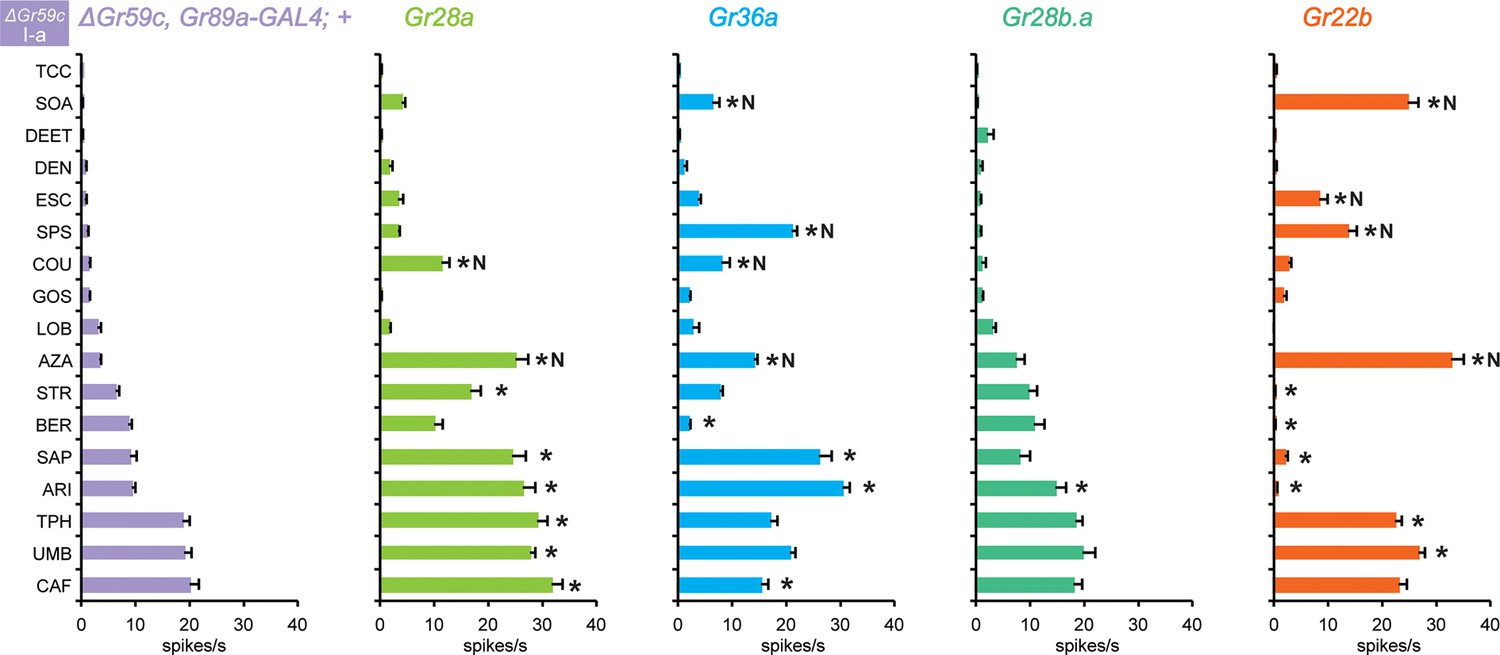
Electrophysiological responses in sensilla ectopically expressing four individual Grs, in ΔGr59c I-a bitter neurons.
Novel responses are indicated by 'N'. The experimental genotypes are: ΔGr59c, Gr89a-GAL4; UAS-GrX, except that in the case of Gr22b, the experimental genotype is ΔGr59c; UAS-Gr22b/Gr66a-GAL4. Asterisks indicate significant changes relative to the ΔGr59c, Gr89a-GAL4; + parental control. p ≤ 0.0001, except that p ≤ 0.0005 for Gr36a/SOA and Gr22b/STR; p ≤ 0.01 for Gr36a/CAF, Gr22b/TPH; p ≤ 0.05 for Gr28b.a/ARI. n ≥ 24).
Figure 11 with 1 supplement
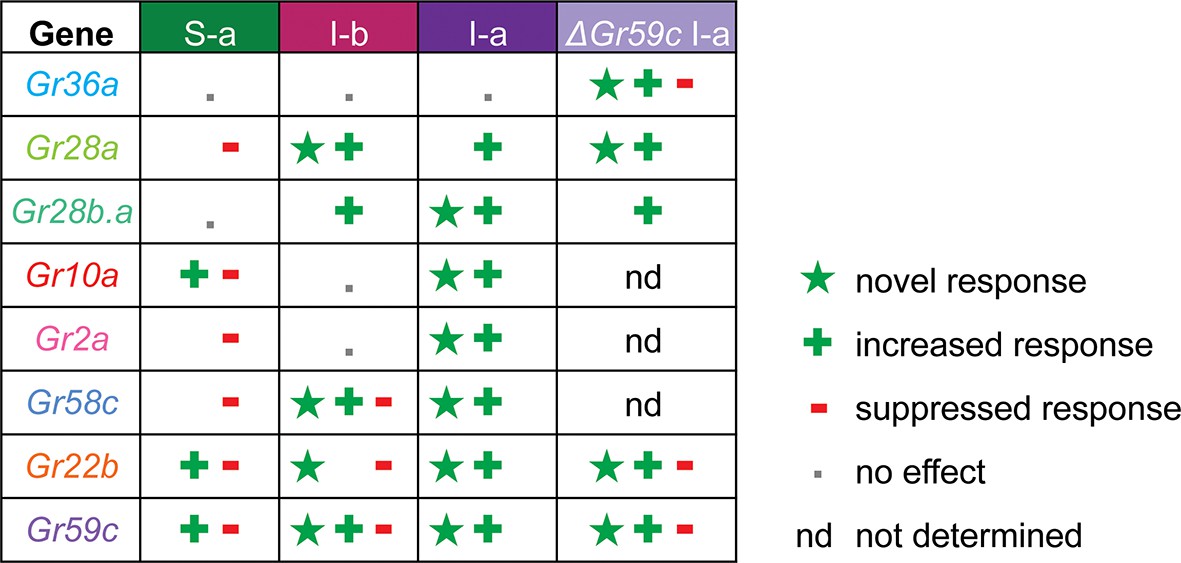
Gr ectopic expression produces receptor-specific and neuron-specific effects on the response profiles.
Effects are delineated for each tastant in Figure 11—figure supplement 1.
Figure 11—figure supplement 1
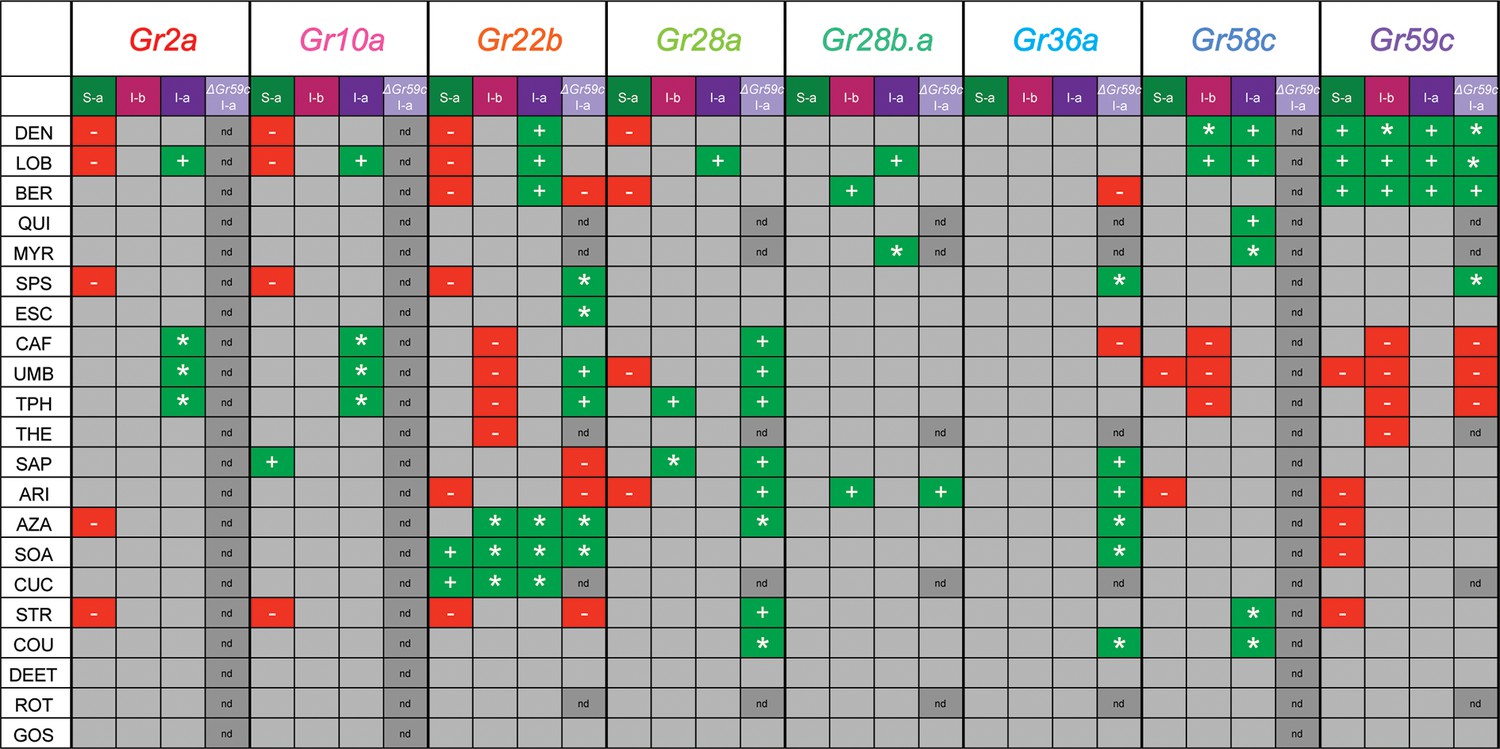
Summary of effects of UAS-Gr expression on responses to tastants in different sensillum types, based on comparison with tested control lines.
'+' indicates an increase in the level of an endogenous response. '*' indicates a novel response not observed in parental control lines examined. '-' indicates suppression of an endogenous response.
Figure 12
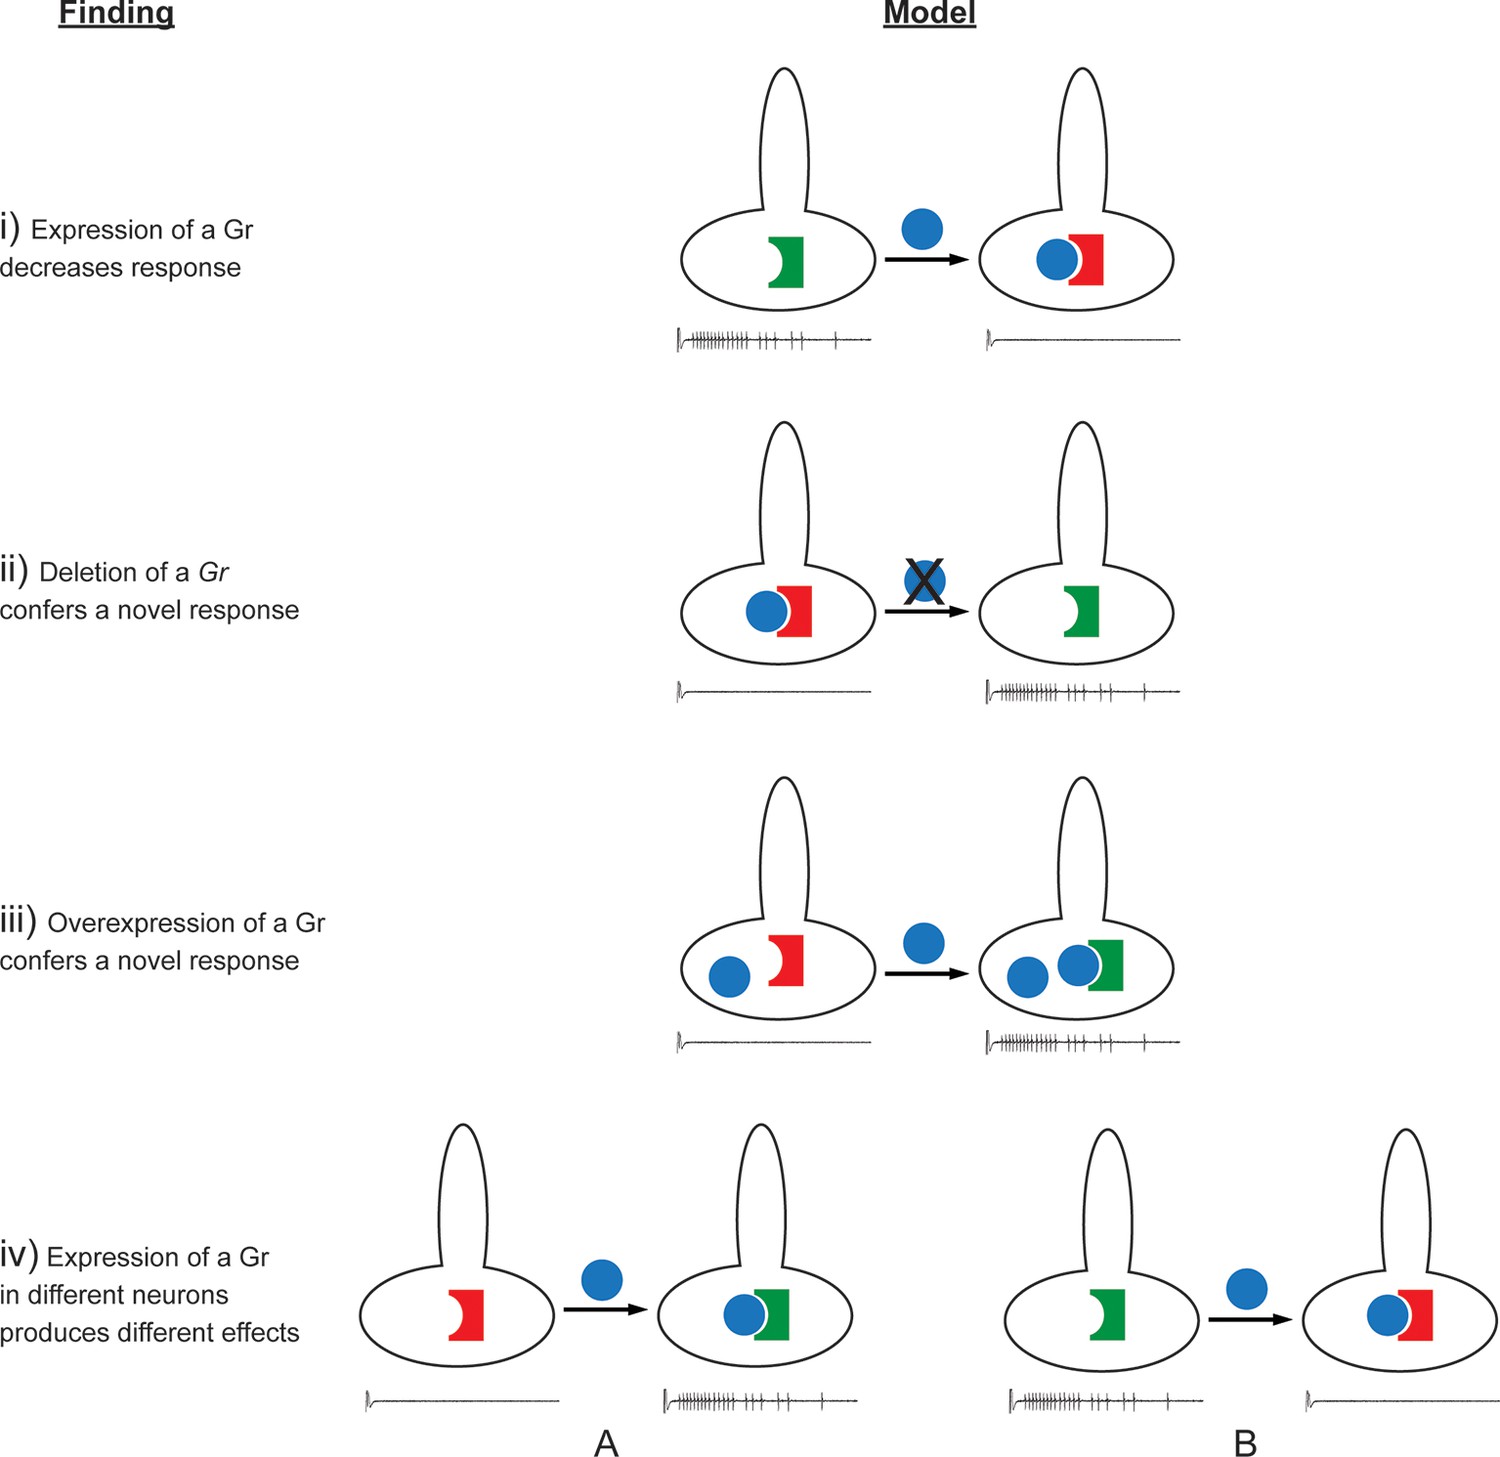
Findings and models.
Four findings of this study are indicated, along with one possible model to explain each. i) Expression of a Gr, indicated by the blue sphere, decreases the response to a tastant, represented by the traces below. One possible model is that the expressed Gr (blue sphere) interacts with another, active Gr (green) and inhibits it (represented by its conversion from a green, active Gr to a red, inactive Gr). ii) Deletion of Gr59c (blue sphere with X) leads to an increased response. One possible model is that in wild type, the Gr inhibits an endogenous Gr (red). Removal of the Gr allows the inactive Gr (red) to become active (green). iii) Overexpression of a Gr, in a neuron that contains the Gr endogenously, induces a response that is not observed in wild type. One model is that above a certain concentration threshold of the Gr, it is able to bind and convert another Gr from an inactive (red) to an active (green) form. iv) Expression of a Gr in two different neurons, 'A' and 'B,' produces different results. The neuron at left shows an increase in response to a tastant whereas the neuron at the right shows a decrease. One model is that in the A neuron, the expressed Gr (blue) binds to an inactive Gr (red) specific to neuron A, and activates it (green). By contrast, in the B neuron, the expressed Gr (blue) binds to a different Gr (green) specific to neuron B, and inactivates it (red).
Tables
Table 1
Panel of 21 bitter taste compounds tested in electrophysiological recordings. a '−' indicates that insecticidal activity has not been described.
| Tastant | Abbreviation | Concentration | Chemical class | Source | Insecticidal activitya |
|---|---|---|---|---|---|
| Aristolochic acid | ARI | 1 mM | phenanthrene | Aristolochia family of plants | − |
| Azadirachtin | AZA | 1 mM | terpenoid | Neem tree | + |
| Berberine chloride | BER | 1 mM | alkaloid | Golden seal, bayberry, Oregon grape and goldthread | − |
| Caffeine | CAF | 1 mM | alkaloid | Coffee, chocolate, tea, kola nut | − |
| Coumarin | COU | 10 mM | benzopyrone | Tonka bean, honey clover | + |
| Cucurbitacin I hydrate | CUC | 1 mM | glycoside | Pumpkins, gourds, cucumbers | + |
| N,N-Diethyl-m-toluamide | DEET | 10 mM | N,N-dialkylamide | synthetic | + |
| Denatonium benzoate | DEN | 10 mM | quaternary ammonium cation | synthetic | − |
| Escin | ESC | 1 mM | terpenoid | Horse chestnut tree | − |
| Gossypol | GOS | 1 mM | terpenoid | Cotton | + |
| (-)-lobeline HCl | LOB | 1 mM | alkaloid | Indian tobacco, Cardinal flower | + |
| Myricetin | MYR | 1 mM | flavonoid | Berries, wine | − |
| Quinine | QUI | 1mM | alkaloid | Cinchona tree bark | − |
| Rotenone | ROT | 1 mM | ketone | Jicama | + |
| Saponin | SAP | 1% | terpenoid | Soapbark tree | + |
| D-(+)-sucrose octaacetate | SOA | 1 mM | acetylated sucrose derivative | synthetic | + |
| Sparteine sulfate salt | SPS | 10 mM | alkaloid | Scotch broom | + |
| Strychnine nitrate salt | STR | 10 mM | alkaloid | Strychnos seeds | + |
| Theobromine | THE | 1 mM | alkaloid | Cacao, tea, kola nut, chocolate | − |
| Theophylline | TPH | 10 mM | alkaloid | Tea leaves | + |
| Umbelliferone | UMB | 1 mM | phenylpropanoid | Carrot, coriander | − |
Table 2
Endogenous expression patterns of Grs selected for analysis, as determined primarily by Gr-GAL4 analysis.
| Gene | Labellum | Legs | Pharynx | Larva | Antenna |
|---|---|---|---|---|---|
| Gr2a | − | − | + | + | − |
| Gr10a | − | − | − | + | + |
| Gr22b | + (I-b, S-a) | + | + | + | − |
| Gr28a | + (I-b, S-a, S-b) | + | + | + | − |
| Gr28b.a | + (I-b, S-a, S-b) | + | + | + | − |
| Gr36a | + (S-b) | + | − | − | − |
| Gr58c | − | + | − | − | − |
| Gr59c | + (I-a, S-a) | − | − | + | − |
Additional files
-
Supplementary file 1
(A) Responses of I-a sensilla recorded from flies of the indicated genotypes. (a) Mean spikes/s. (b) S.E.M. (c) n, where n represents the number of traces analyzed. (B) Responses of I-b sensilla recorded from flies of the indicated genotypes. (a) Mean spikes/s. (b) S.E.M. (c) n, where n represents the number of traces analyzed. (C) Responses of S-a sensilla recorded from flies of the indicated genotypes. (a) Mean spikes/s. (b) S.E.M. (c) n, where n represents the number of traces analyzed. (D) Responses of ΔGr59c I-a sensilla recorded from flies of the indicated genotypes. (a) Mean spikes/s. (b) S.E.M. (c) n, where n represents the number of traces analyzed.
- https://doi.org/10.7554/eLife.11181.020
Download links
A two-part list of links to download the article, or parts of the article, in various formats.
Downloads (link to download the article as PDF)
Open citations (links to open the citations from this article in various online reference manager services)
Cite this article (links to download the citations from this article in formats compatible with various reference manager tools)
Bitter taste receptors confer diverse functions to neurons
eLife 5:e11181.
https://doi.org/10.7554/eLife.11181


