Revealing an outward-facing open conformational state in a CLC Cl–/H+ exchange transporter
- Stanford University School of Medicine, United States
- University of Illinois at Urbana-Champaign, United States
- Stanford University, United States
- Vanderbilt University, United States
Figures
Figure 1 with 1 supplement

Structure of CLC transporters.
(A) Structure of ClC-ec1 (pdb: 1OTS). The bound Cl- (one in each identical subunit at site Scen) is coordinated by conserved Ser and Tyr residues (shown as spacefilled). The N-termini of helices F and N (shown in purple and yellow respectively) point towards this site and provide a positive electrostatic environment for the anion. The H+-permeation pathways are delineated by two key residues, Gluex and Gluin. Gluex also acts as a “gate” that blocks the Cl--permeation pathway (green arrows) from the extracellular solution. (B) CLC structure highlighting helices discussed: F (purple), N (yellow), O (pink), P (blue), Q (brown), and R (aquamarine). (C) Close-up of the Cl--binding region in WT (left) and E148Q (right) ClC-ec1, highlighting intracellular and extracellular gate residues S107, Y445, and E148 (Gluex). In the E148Q mutant (pdb: 1OTU), the Gln side chain, mimicking the protonated Gluex, swings away from the Cl--permeation pathway and is replaced at Sext with a Cl- ion. The structure of this mutant is otherwise indistinguishable from the WT structure. (D) Cartoon of the Cl--binding region, illustrating the hypothesis that the E148Q structure represents an “outward-facing occluded” rather than an “outward-facing open” conformation.
Figure 1—figure supplement 1
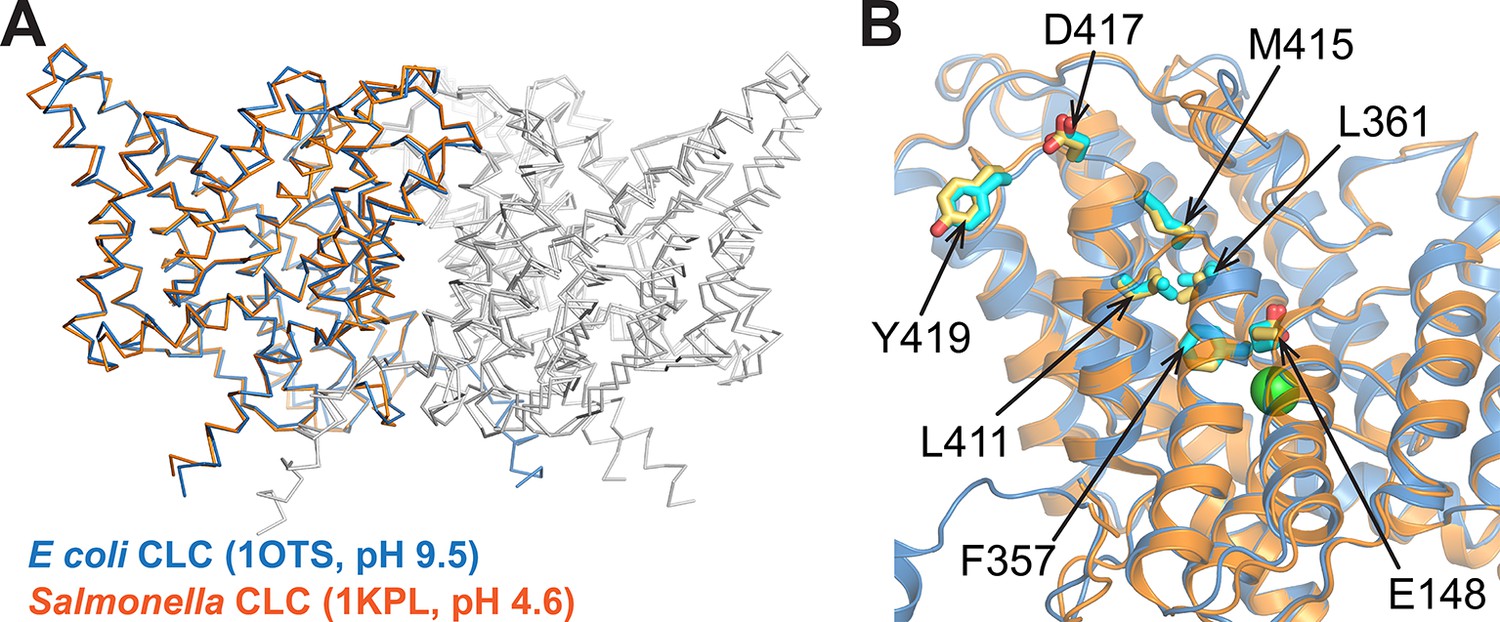
Comparison of CLC structures determined at high and low pH.
The two homologs shared 80% sequence identity. (A) The Salmonella CLC backbone (PDB 1KPL, orange) superposes with ClC-ec1 (PDB 1OTS, blue) (RMSD 1.5 Å; Cα RMSD 1.0 Å). (B) The side chains of key residues studied here (Gluex (E148), F357, L361, L411, M415, D417, and Y419) are similarly positioned in the two structures. These similarities motivate alternative approaches to crystallography (this work and others), which highlight the fact that a conformation crystallized does not necessarily reflect the ensemble of conformations outside the restraints of crystallization (Bell et al., 2006; Elvington and Maduke, 2008; Elvington et al., 2009; Basilio et al., 2014; Abraham et al., 2015).
Figure 2
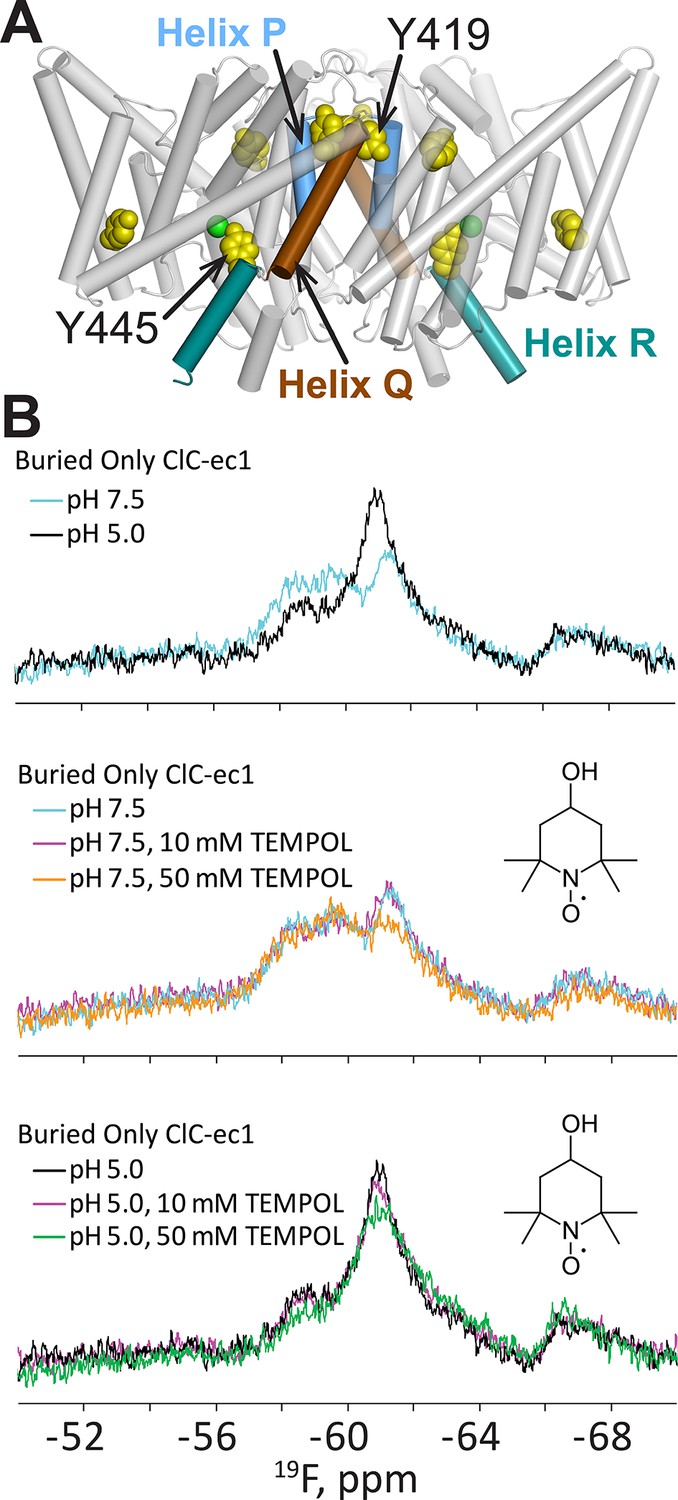
H+-dependent solvent accessibility of Tyr residues in ClC-ec1, detected by 19F NMR.
(A) “BuriedOnly” ClC-ec1, a mutant in which the five buried Tyr residues (spacefilled in yellow) have been labeled with 19F. The seven solvent-exposed Tyr residues have been mutated to Phe. Residues Y445 (on Helix R, shown in aquamarine) and Y419 (linker between Helices P and Q, blue and brown respectively) were previously identified as undergoing H+-dependent changes in chemical shift (Elvington et al., 2009). (B) 19F NMR spectra of BuriedOnly ClC-ec1. Top data panel: low pH was used to enrich the outward-facing conformational state. Changes in chemical shift reflect changes in chemical environment experienced by the 19F nuclei. Middle data panel: spectral changes in response to addition of TEMPOL (inset) at pH 7.5. Bottom data panel: spectral changes in response to addition of TEMPOL at pH 5.0.
Figure 3 with 3 supplements
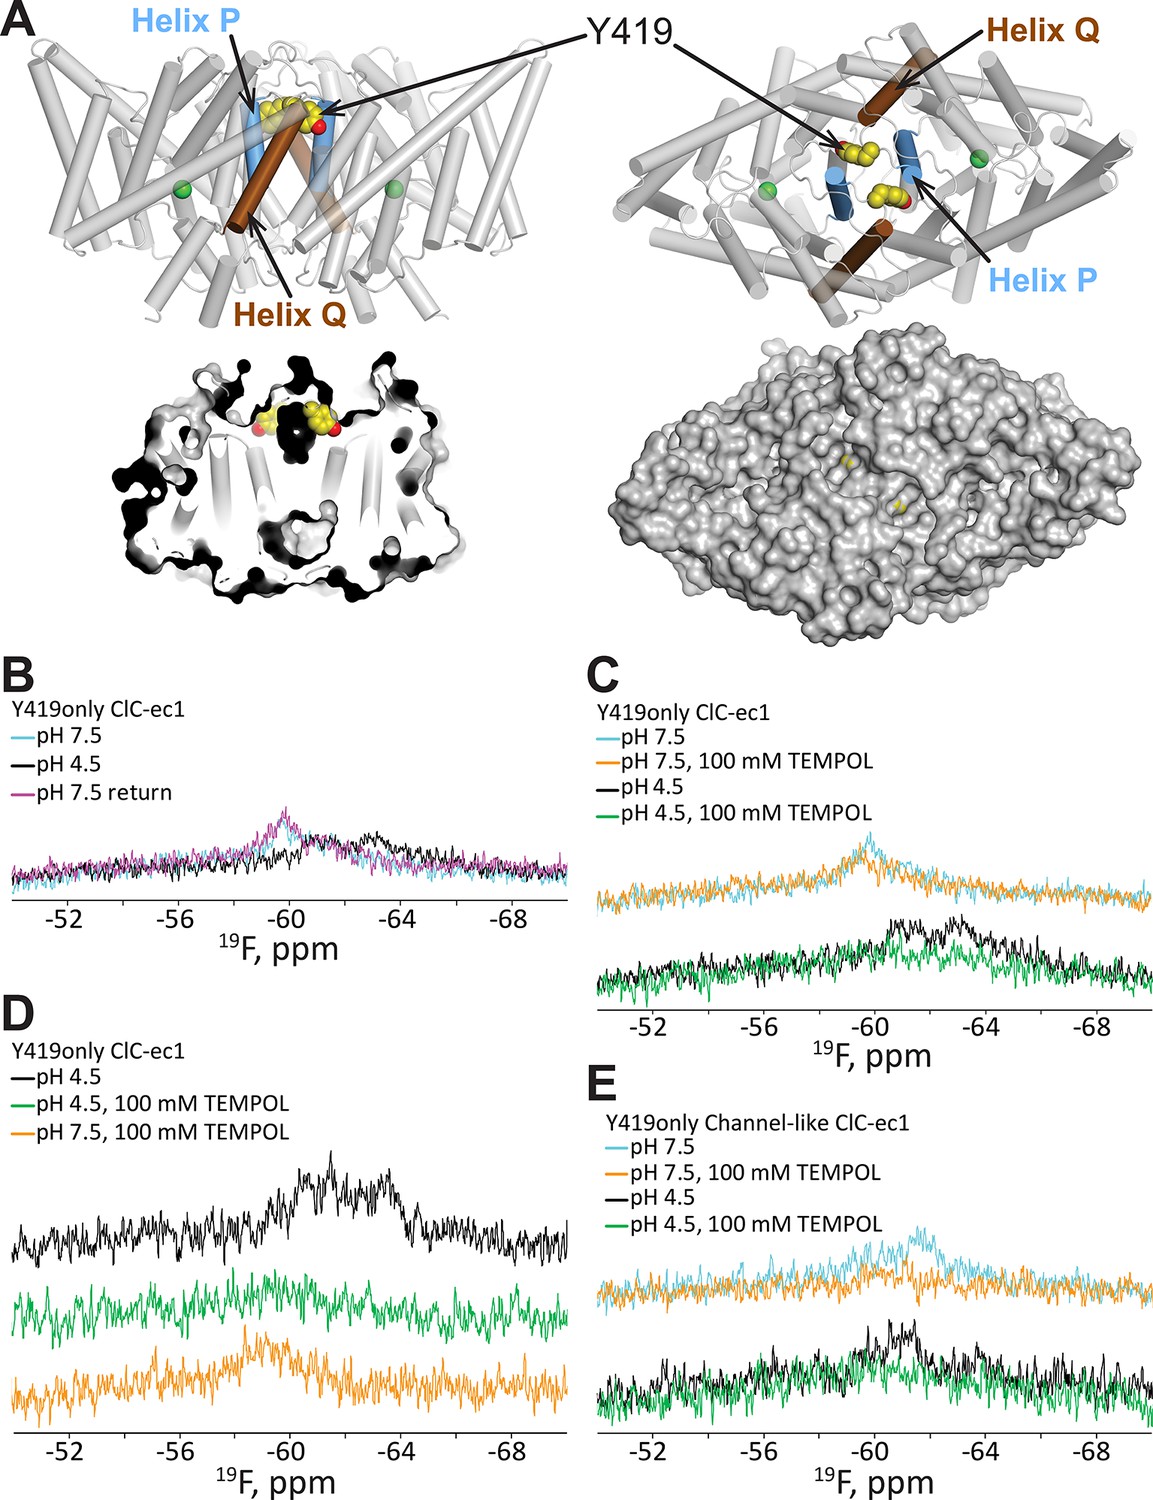
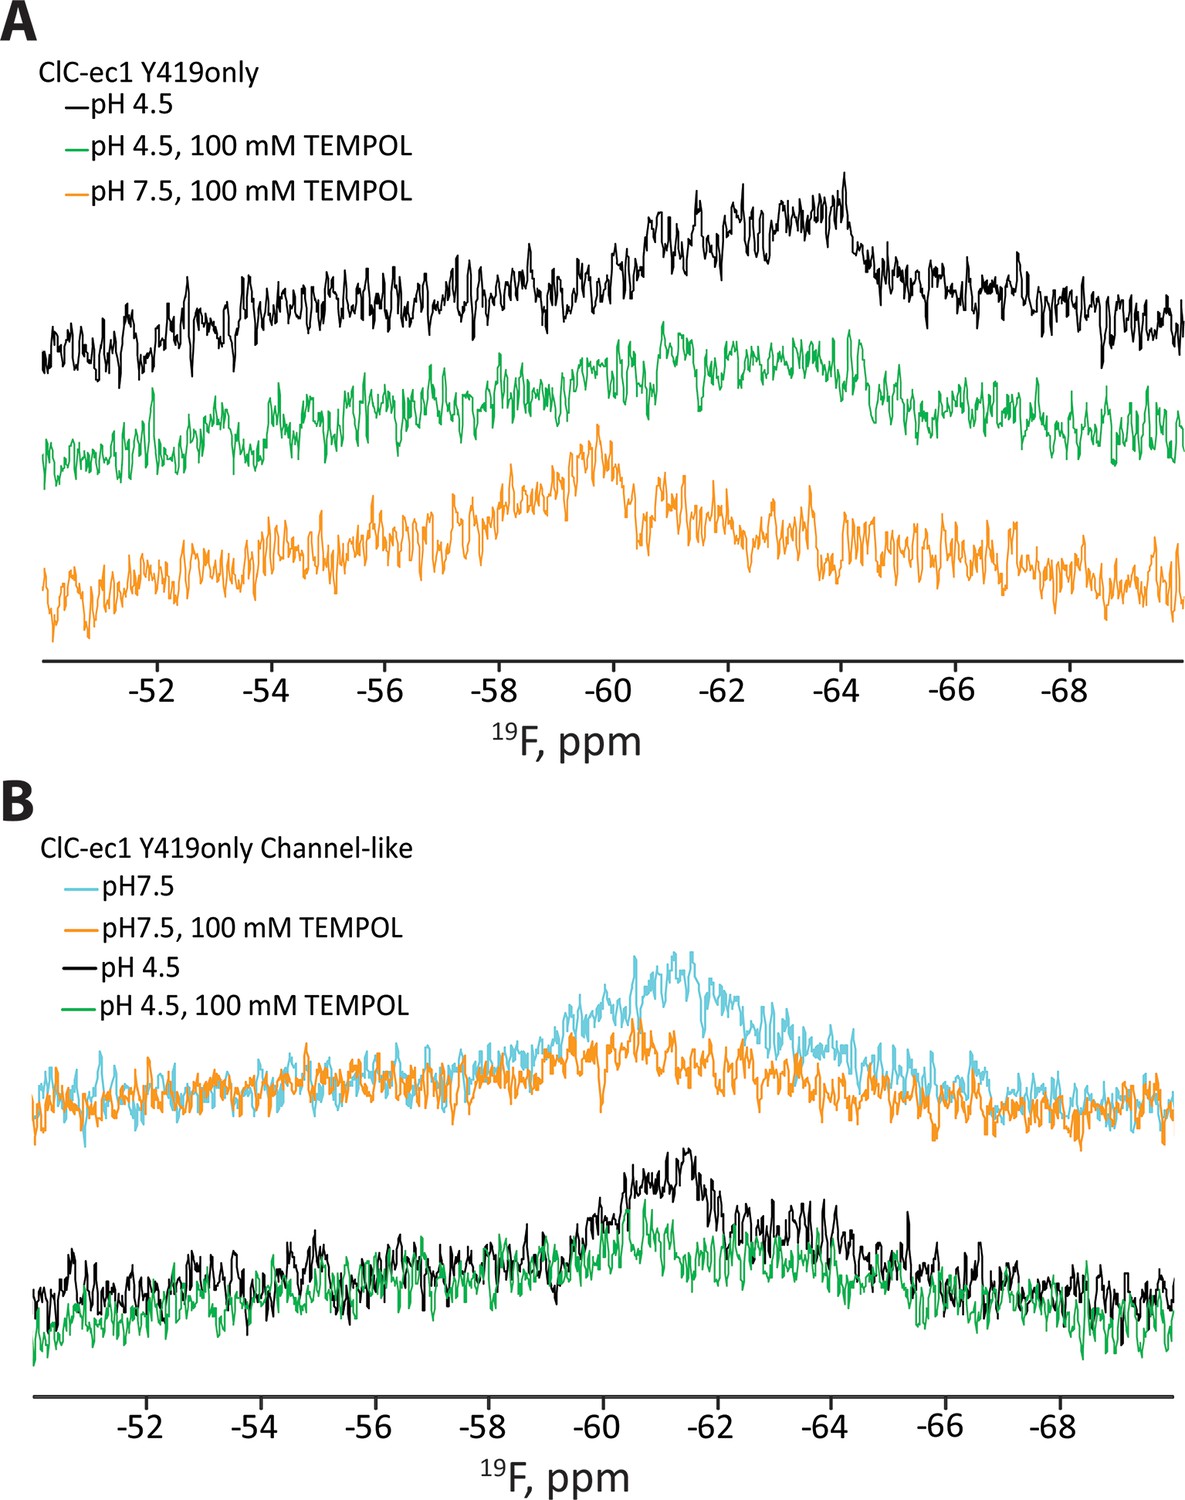
19F NMR detects H+-dependent solvent accessibility at Y419.
(A) Y419only ClC-ec1. In this variant, all native Tyr residues except for Y419 have been mutated to Phe, so that only Y419 will carry a 19F label. Y419 is highlighted in the ClC-ec1 structure shown from the point of view of the membrane (left) and from the extracellular side (right). The lower panels illustrate that Y419 lies in a buried position (left: thin slice through the protein at Y419; right, surface representation viewed from the extracellular side. (B) 19F NMR spectra of Y419only. The prominent peak centered at -60 ppm shifts upfield (-61 and -63 ppm) when the pH is shifted from 7.5 to 4.5 to enrich the OF state. (C) Y419 becomes substantially more exposed to solvent at increased [H+], as indicated by susceptibility to line-broadening by the water-soluble TEMPOL at pH 4.5 (bottom spectra, green vs black trace) compared to pH 7.5 (top spectra, orange vs cyan trace). (D) The change in the Y419 exposure to solvent is reversible, as revealed by return of the signal (to the expected chemical shift) when the pH is raised to 7.5 (bottom trace, orange). (E) Y419 in the channel-like ClC-ec1 background is accessible to TEMPOL at both pH 7.5 and 4.5.
Figure 3—figure supplement 1
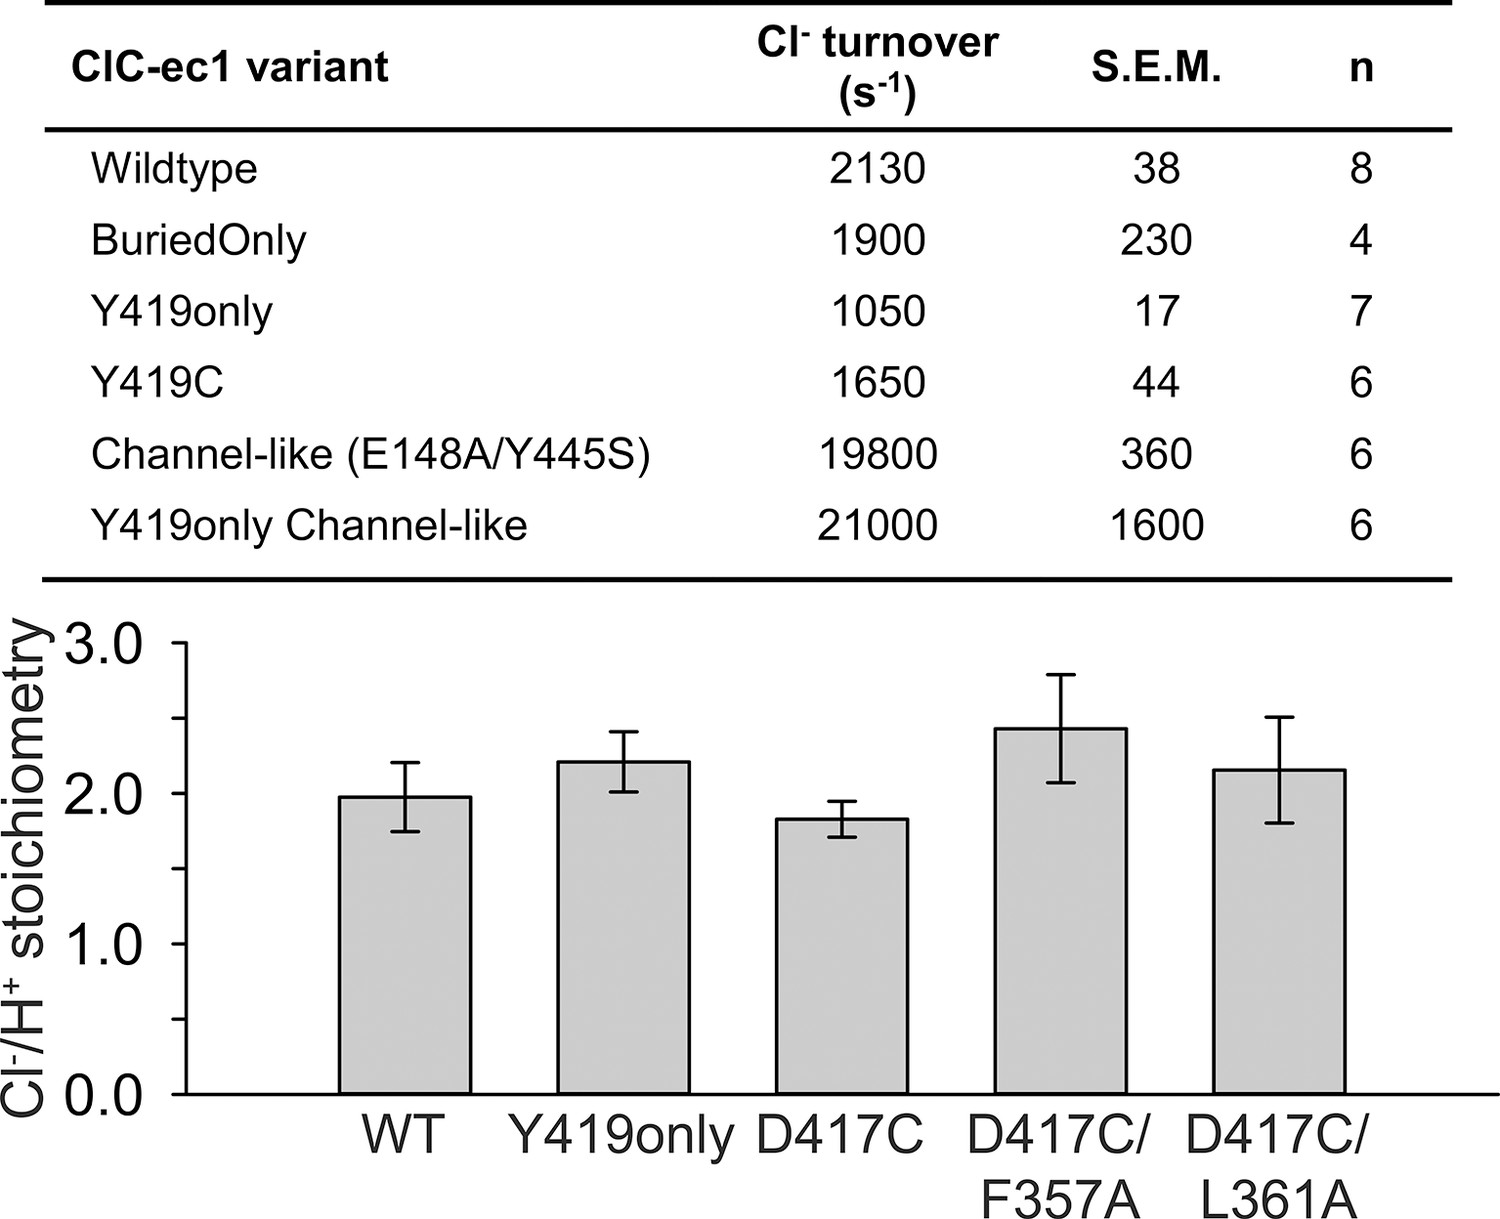
Functional characterization of ClC-ec1 variants.
Top: Cl- turnover rates for ClC-ec1 variants examined in this study, with the exception of D417C mutants which are summarized in Table 1. Bottom: Stoichiometry of transport for WT ClC-ec1, Y419only (used in NMR studies), D417C (used in cross-linking studies), and Helix-N mutants F357A and L361A (hypothesized to transmit conformational change from D417C to the Cl--transport pathway). Data represent average ± SEM (n=3–7).
Figure 3—figure supplement 2
Reproducibility of TEMPOL-NMR experiments.
(A) Repeat of the experiment demonstrating (1) TEMPOL causes line-broadening at pH 4.5 and (2) that this line-broadening is reversible by a change to pH 7.5 (cf Figure 3D). The signal is enhanced and returns to the expected chemical shift when the pH is raised to 7.5 (bottom trace, orange). (B) Repeat of the experiment demonstrating that Y419 in the channel-like ClC-ec1 background is accessible to TEMPOL at both pH 7.5 and 4.5 (cf Figure 3E).
Figure 3—figure supplement 3
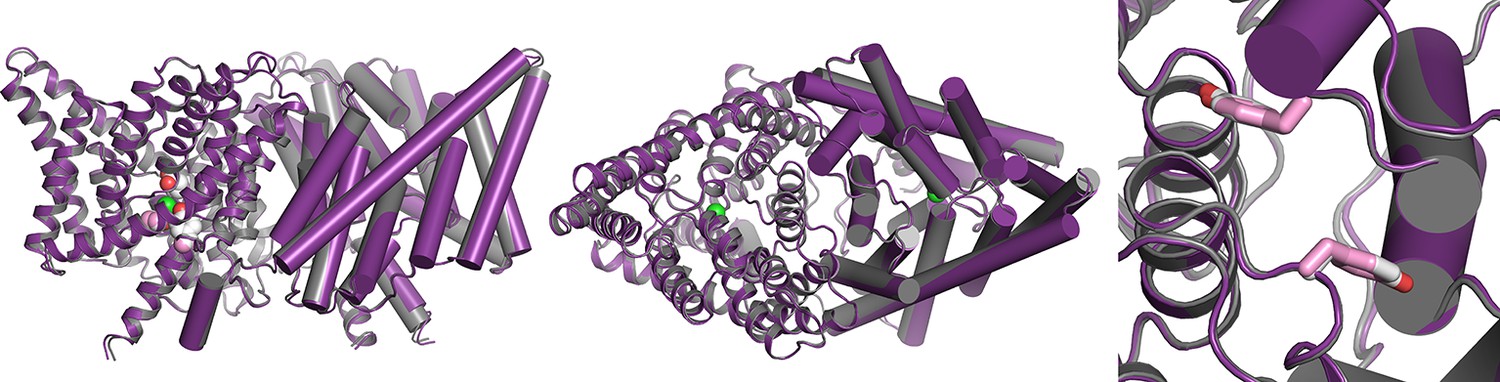
Overlay of WT and channel-like ClC-ec1 structures.
Overlay of WT ClC-ec1 (grey, 1OTS) and channel-like variant E148A/Y445A (purple, 3DET), RMSD 0.52 Å. The left panel shows a view from within the membrane; the middle and right panels shows views from the extracellular side, with the Y419 side chain depicted in pink (channel-like) and grey (WT). The side chain is in an identical (overlapping) position in the two structures.
Figure 4 with 5 supplements
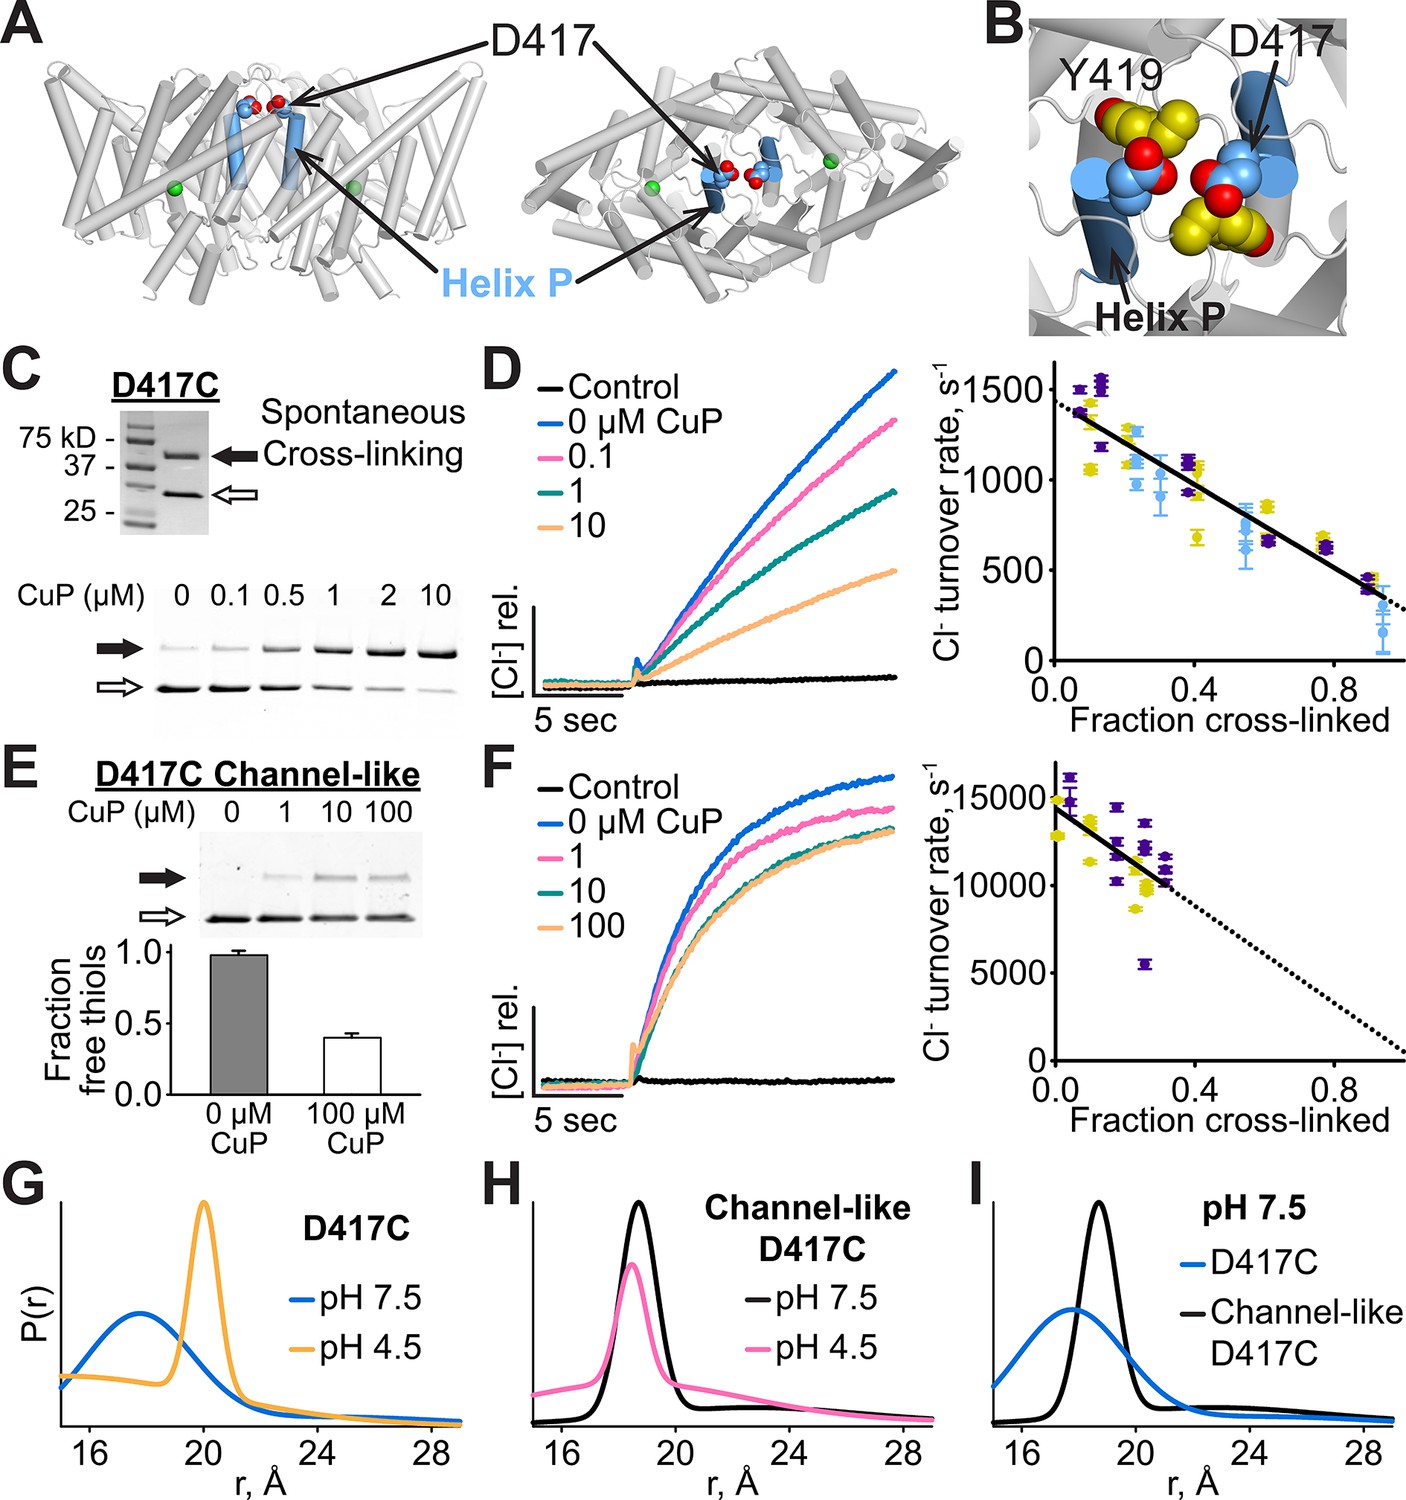
Cross-linking and H+-dependent conformational change at D417C.
(A) ClC-ec1 with D417 side chain shown spacefilled, viewed from the membrane (left) and from the extracellular side (right). (B) Close-up view showing D417 and Y419 side chains. (C) Detection of inter-subunit disulfide cross-links by non-reducing SDS-PAGE. When the D417C transporters were purified under standard (non-reducing) conditions, inter-subunit cross-links formed spontaneously, with ~50% of the protein migrating as a dimer (top gel, solid arrow) and ~50% as a monomer (open arrow). By purifying the transporters under reducing conditions, the amount of cross-linking could be reduced to <10%, and then titrated (up to ~95%) with addition of increasing amounts of CuP (bottom panel). (D) Effect of cross-linking on D417C activity. Left: Representative data traces showing Cl--transport activity of D417C. Right: Summary data showing Cl--transport activity as a function of disulfide cross-linking, which was determined by quantifying the relative intensities in the monomer and dimer bands detected by SDS-PAGE (as shown in panel C). Each data point represents one flux-assay measurement. Error bars (most are smaller than the symbols) indicate the uncertainty in curve-fitting to the primary data (transporter flux and background leak measured in control liposomes). Data are from three separate D417C ClC-ec1 preparations, as depicted by three colors (purple, yellow, and blue). (E) D417C/channel-like is resistant to CuP-induced cross-linking. The bottom panel shows results from thiol quantification assays before and after treatment with 100 µM CuP. (F) Effect of cross-linking on activity of D417C/channel-like ClC-ec1. Left: Representative data traces. Right: Summary data, as in panel D. Yellow and purple indicate data from two separate D417C/channel-like ClC-ec1 preparations. (G) DEER distance distributions reveal a pH-dependent increase in inter-subunit distance at D417C. (H) D417C/channel-like does not exhibit the pH-dependent change observed with D417C/WT. (I) Comparison of WT and channel-like D417C at pH 7.5.
Figure 4—figure supplement 1
Cross-linking of Y419C ClC-ec1.
(A) Y419C analyzed on non-reducing SDS-PAGE. Solid and open arrows indicate positions of dimeric (cross-linked) and monomeric ClC-ec1 respectively. Y419C purified under non-reducing conditions (gel at left) forms spontaneous crosslinks. Y419C purified under reducing conditions (gel at right) is largely uncross-linked but becomes cross-linked upon addition of 10 µM CuP. (B) Representative raw traces showing Cl- flux through Y419C-reconstituted proteoliposomes. (C) Summary data show that the Y419C crosslink has no significant effect on activity (error bars show SEM for n=4–6).
Figure 4—figure supplement 2
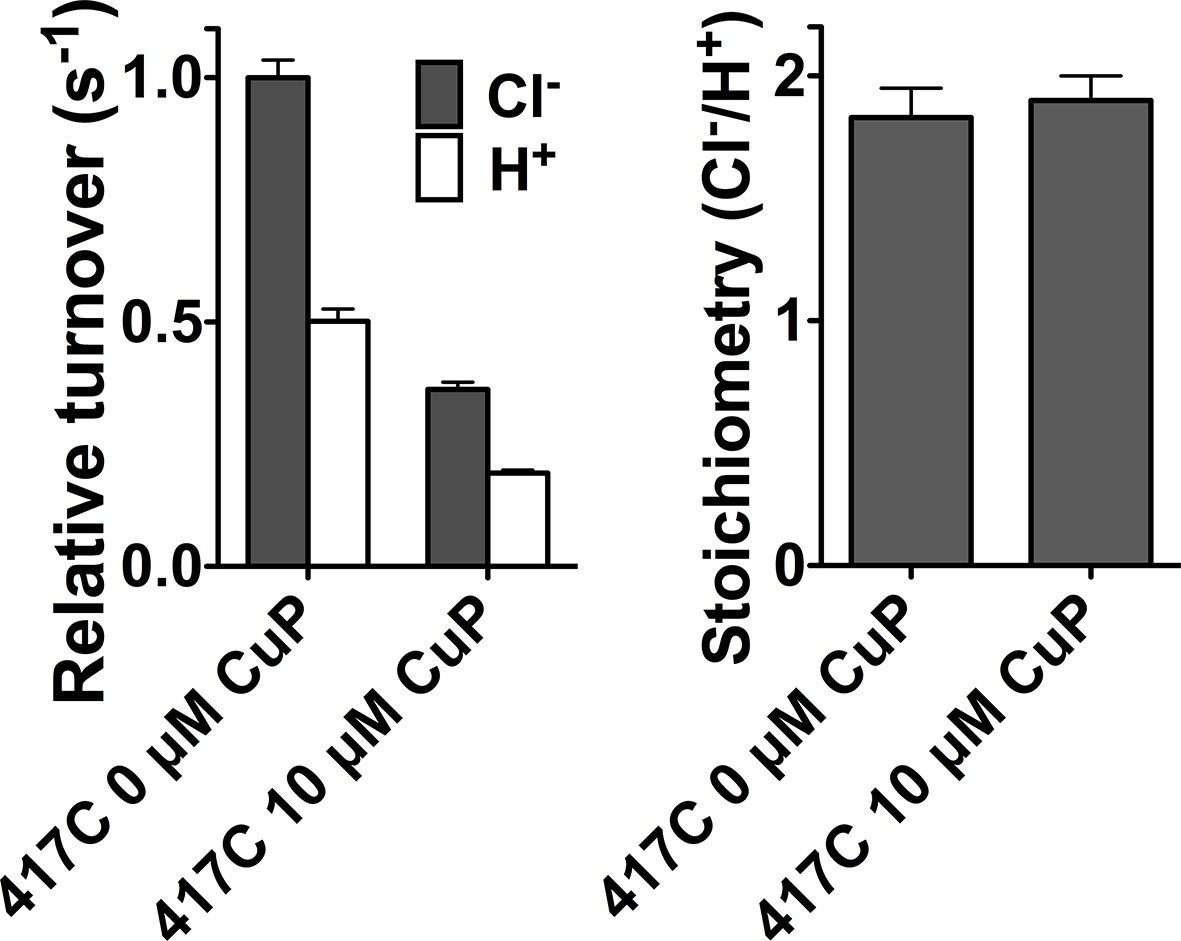
Cross-linking at D417C inhibits Cl- and H+ transport in parallel.
Data represent average ± SEM (n=4).
Figure 4—figure supplement 3
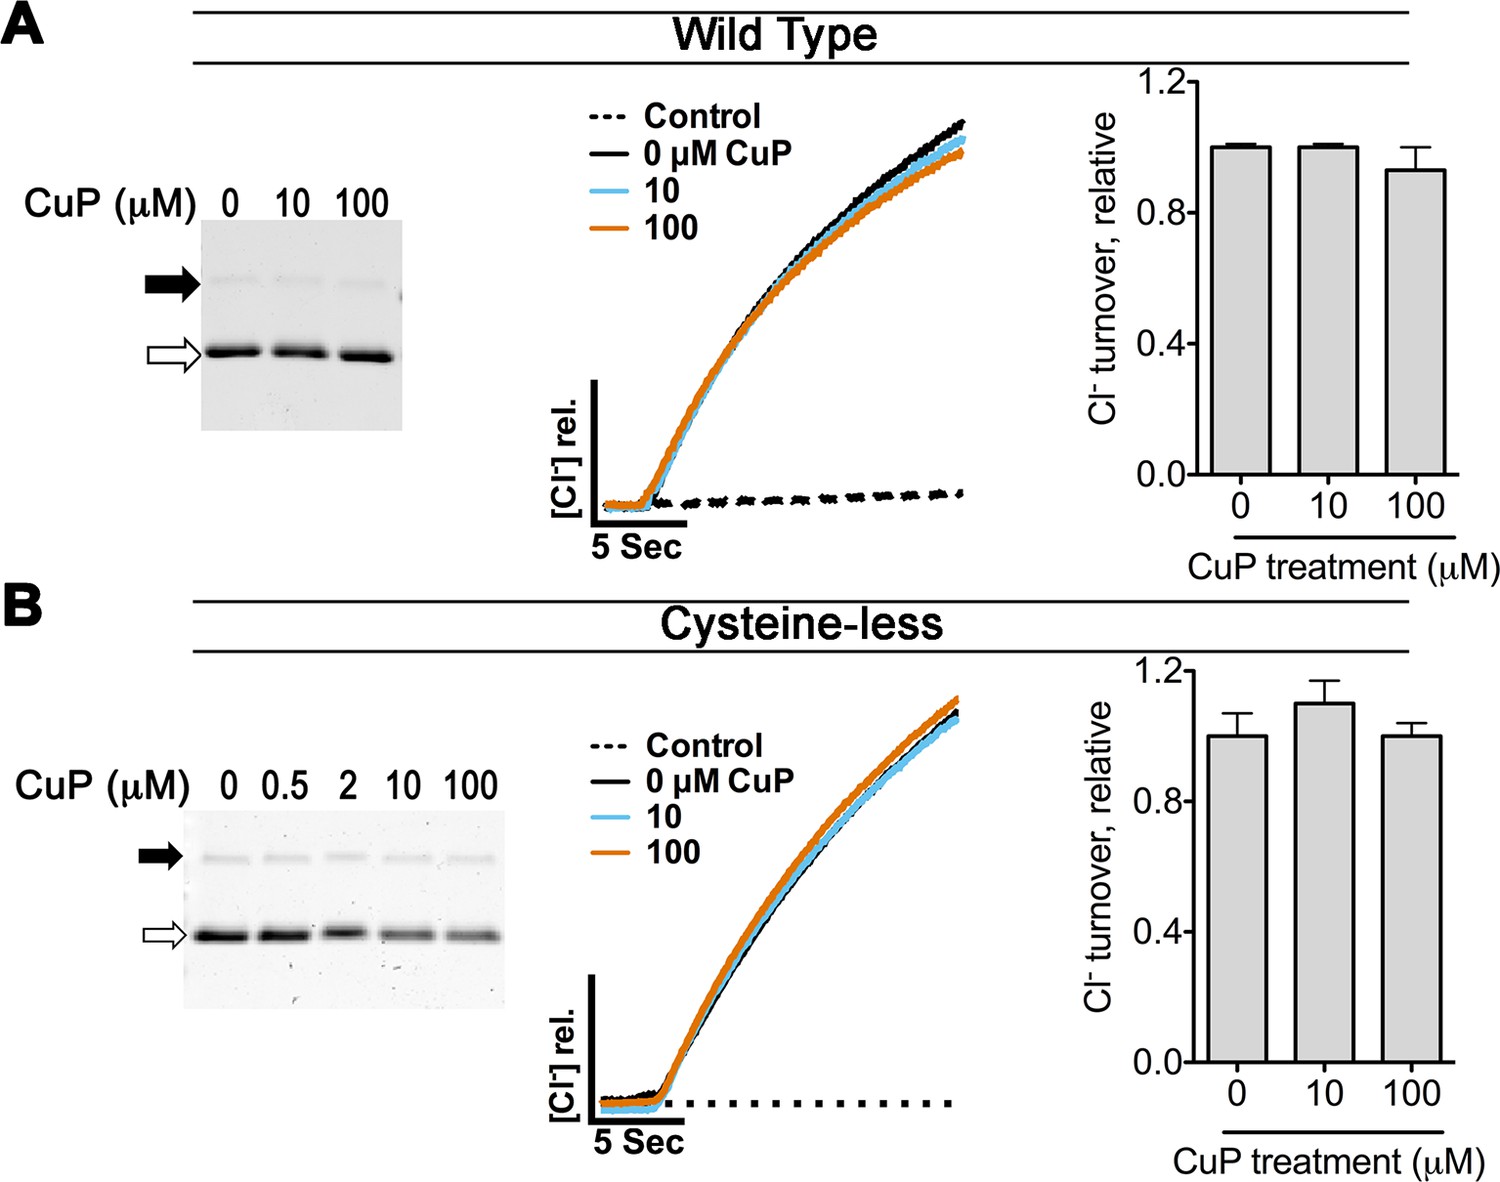
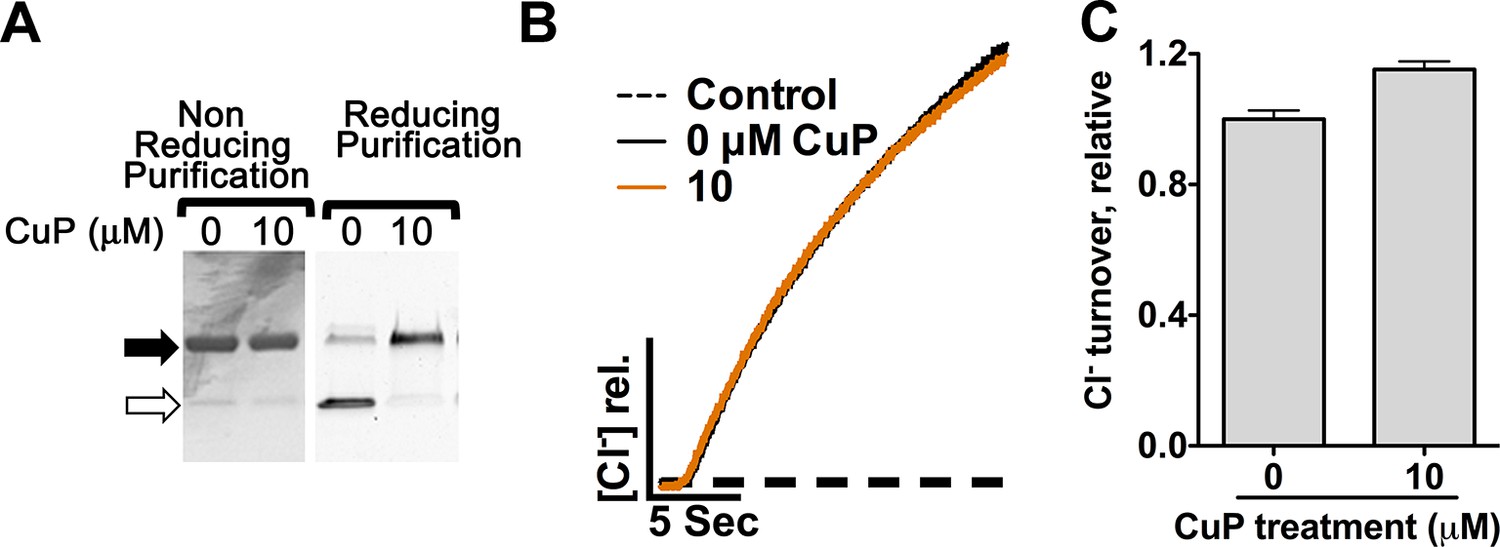
Control experiments on WT and cysteine-less ClC-ec1.
The WT ClC-ec1 background was used for Y419C and N-deletion (crystallization construct) mutants; the cysteine-less ClC-ec1 background was used with all other constructs in this study. (A) Control experiments on WT ClC-ec1. Left: SDS-PAGE analysis of CuP-treated WT ClC-ec1. Arrows indicate migration position for the cross-linked dimer (solid) or uncross-linked monomer (open). The presence of a prominent monomer band indicates that CuP does not cross-link this template. Middle: Representative traces of Cl--efflux mediated by WT or cysteine-less ClC-ec1. Right: Relative Cl- transport rates for WT and cysteine-less ClC-ec1 (mean ± SEM, n=3–4). (B) Control experiments on cysteine-less ClC-ec1. Panels as in (A).
Figure 4—figure supplement 4
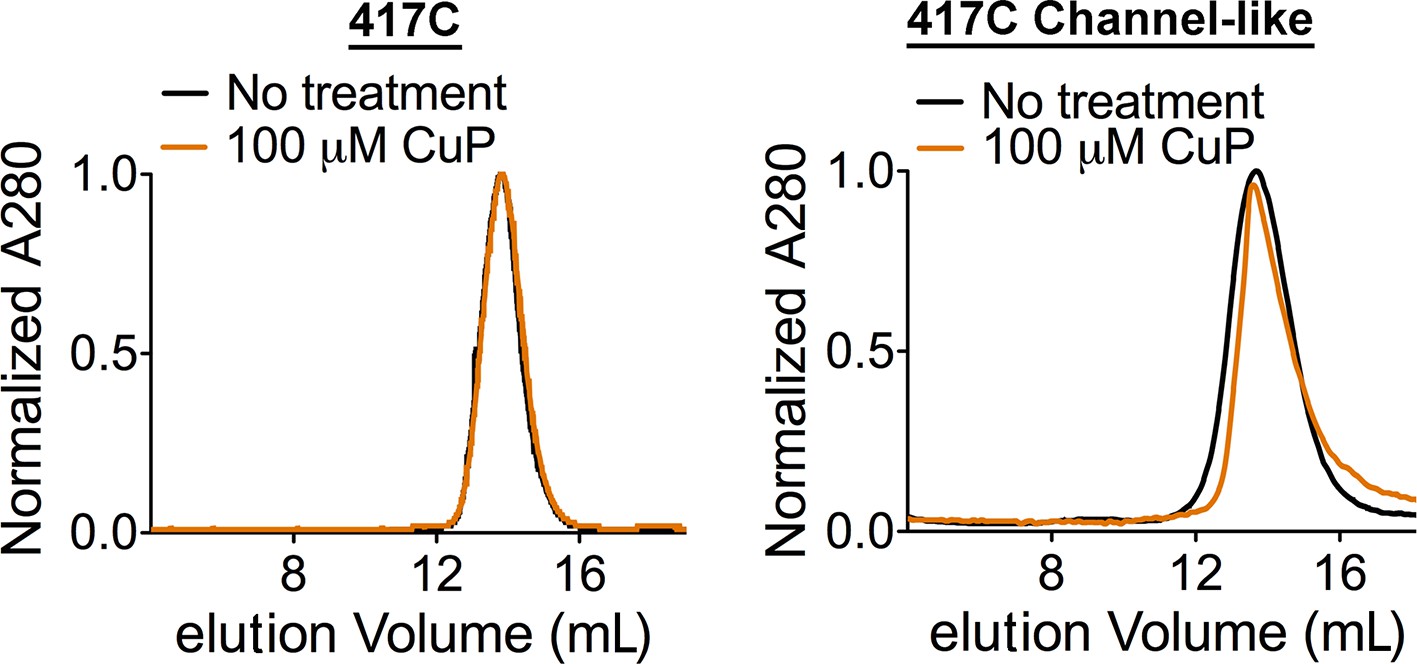
CuP-treated D417C proteins run as dimers on size exclusion chromatography.
Control: CuP-treated D417C proteins run as dimers on size exclusion chromatography (Superdex 200).
Figure 4—figure supplement 5
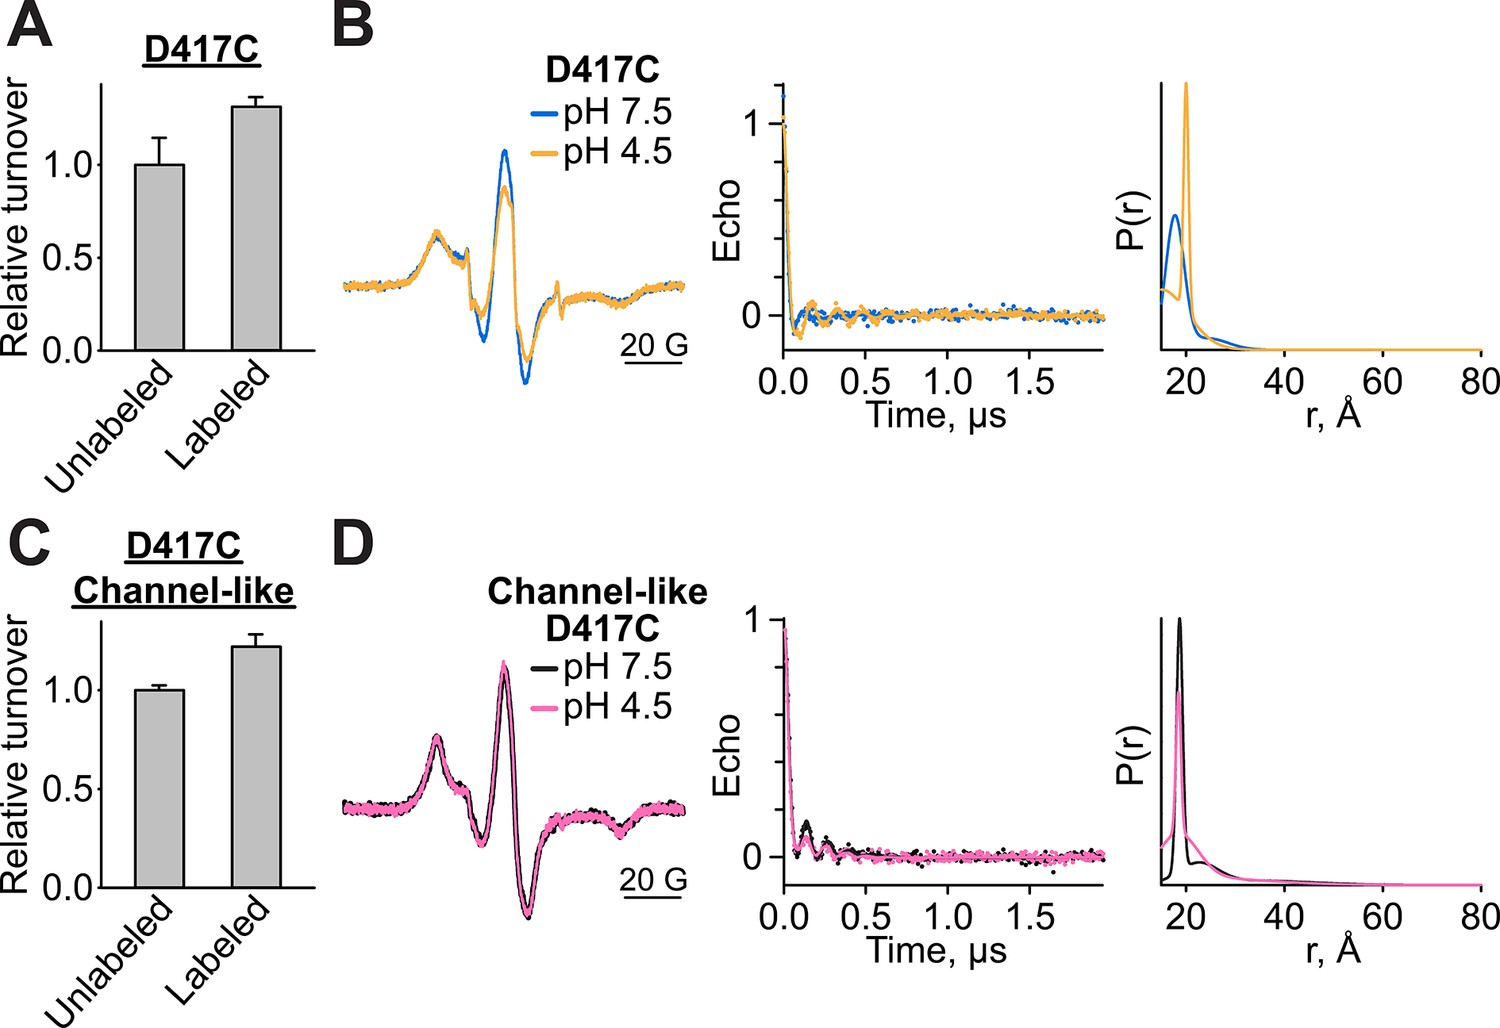
Functional-, CW-EPR, and DEER data analysis for spin-labeled D417C variants.
(A) MTSSL-labeled D417C retains Cl--transport function, mean ± SEM for n=3–4. Cl- turnover of labeled samples was measured after the sample was exposed to pH 4.5 for 1 hr at room temperature before adjusting back to pH 7.5 for reconstitution. (B) CW-EPR (left), baseline-corrected DEER signals (middle) and fits corresponding to distance distributions (right) for D417C at pH 7.5 and 4.5. (C) MTSSL-labeled D417C/channel-like retains Cl--transport function, mean ± SEM for n=4. Cl- turnover of labeled samples was measured after the sample was exposed to the pH 4.5 condition for 1 hr at room temperature before adjusting back to pH 7.5 for reconstitution. (D) CW-EPR (left), baseline-corrected DEER signals (middle) and fits corresponding to distance distributions (right) for D417C/channel-like at pH 7.5 and 4.5.
Figure 5

Structural integrity of cross-linked D417C.
(A) The cross-linked D417C backbone (PDB 5HD8, green) superposes with WT (PDB 1OTS, blue) (RMSD 0.57 Å for 862 Cα atoms). (B) Extra density between residues 417 on the two subunits was modeled as a disulfide bridge, shown in stereo. (C) Close up stereo view of key residues around the Cl- (upper panel) and H+ (lower panel) permeation pathways. In the upper panel, the residues shown (E148, S107, and Y445) are the same as those depicted in Figure 1A. In the lower panel, also shown are E203, the internal H+-transfer site (Accardi et al., 2005) and A404, a residue lining the portal for H+ entry from the intracellular solution (Han et al., 2014). Cl- modeled in the central binding site is depicted as green and blue spheres. 2F0-Fc maps are contoured at 1σ. (D) ITC experiments show Cl- binding to WT, D417C, and D417C cross-linked with 100 µM CuP. Top panels: heat liberated when 20 mM KCl is titrated into the ITC cell containing 25–50 µM protein (WT, 25 µM; D417C, 50 µM; D417C+CuP, 30 µM). (E) Summary data for ITC experiments, ± SEM. WT, n=3 from two separate protein preparations; D417C, n=4 from four separate preparations; cross-linked D417C n=4 from three separate protein preparations.
Figure 6 with 1 supplement
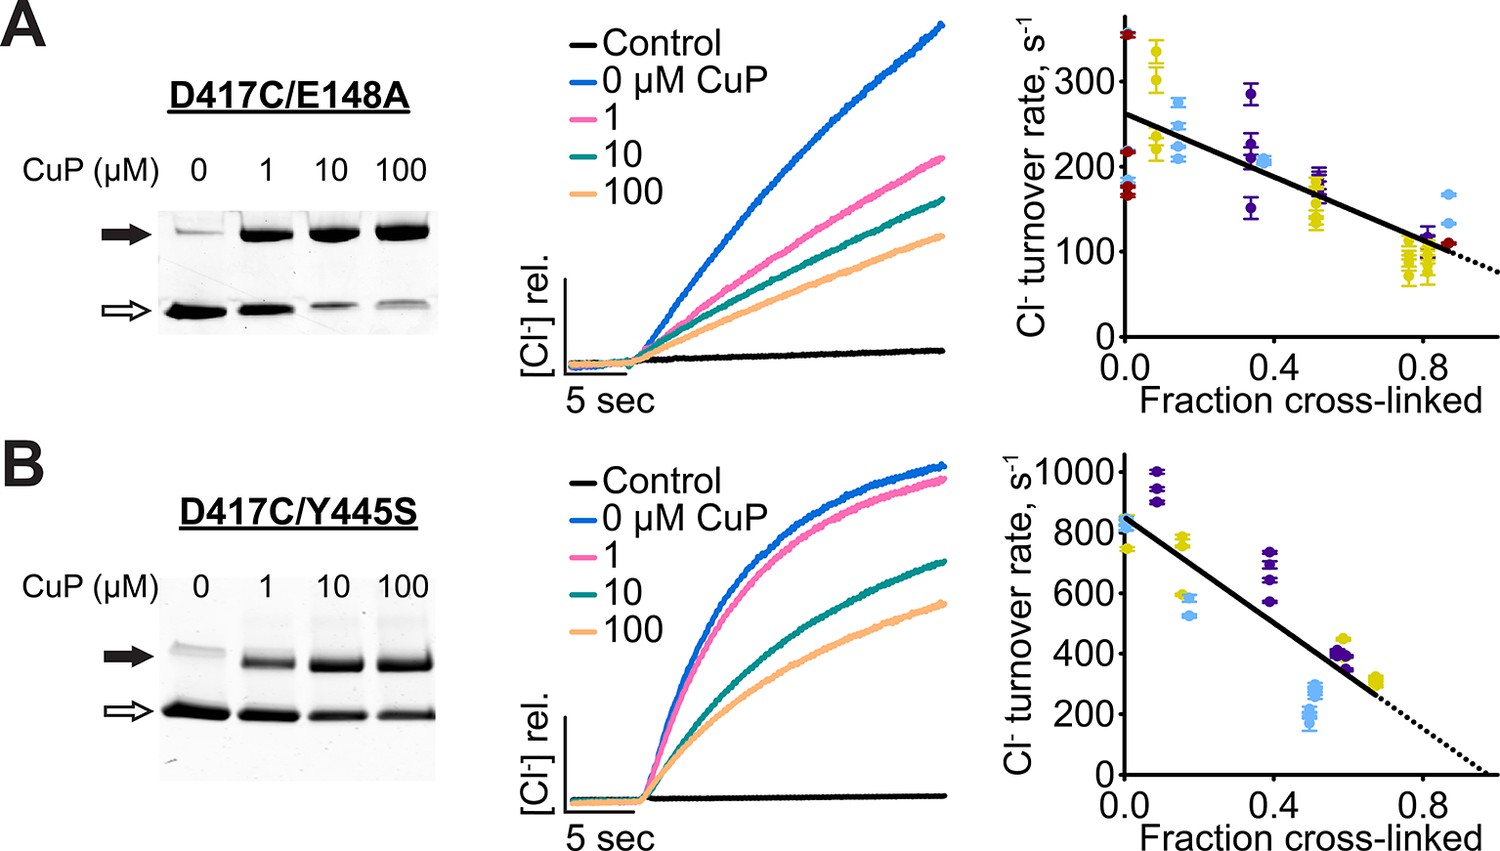
Cross-linking D417C in uncoupled transporter backgrounds.
(A) D417C/E148A – detection of inter-subunit disulfide cross-links by non-reducing SDS-PAGE. (B) Effect of cross-linking on activity of D417C/E148A. Left: Representative data traces showing Cl--transport activity. Right: Summary data showing Cl--transport activity as a function of disulfide cross-linking. Each data point represents one flux-assay measurement, with error bars indicating the uncertainty in curve-fitting to the primary data. Purple, yellow, blue, and dark red each represent data from a separate protein preparation. (C) D417C/Y445S – detection of inter-subunit disulfide cross-links. (D) Effect of cross-linking on activity of D417C/Y445S, as in panel B. Data are from three separate protein preparations (indicated in purple, yellow, and blue).
Figure 6—figure supplement 1
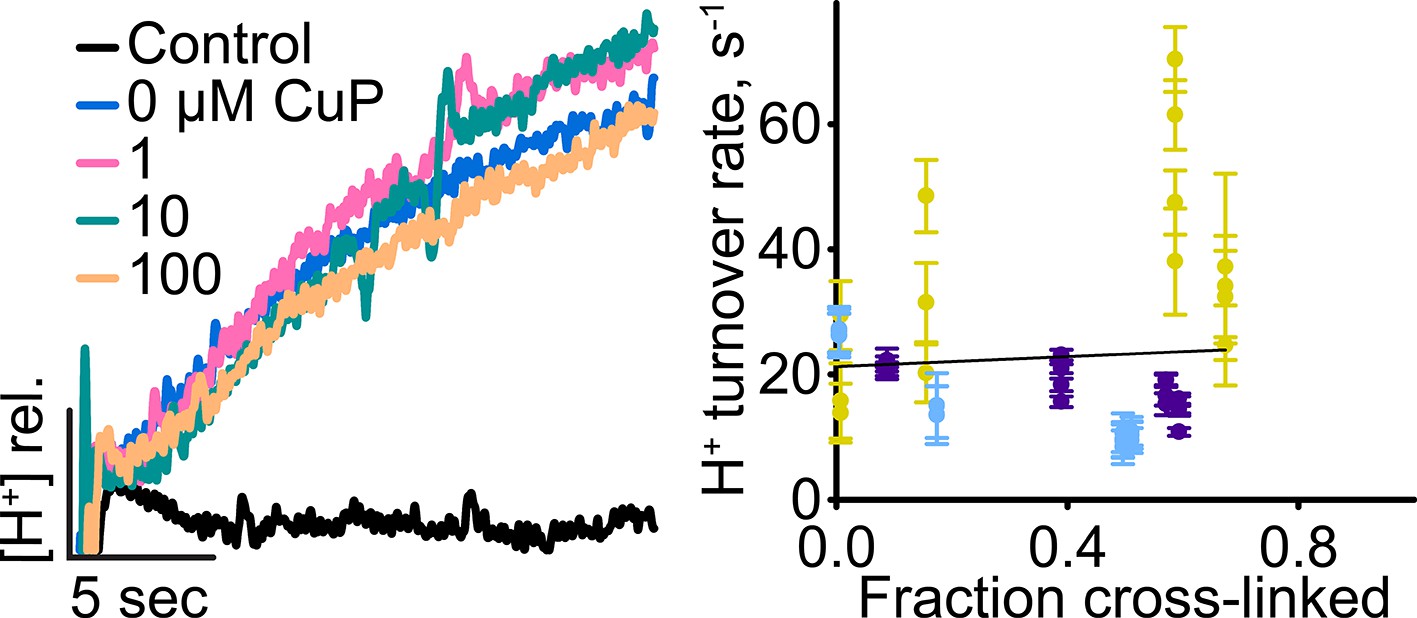
H+ turnover of D417C/Y445S.
Left: Representative data traces showing H+-transport activity. Right: Summary data showing H+-transport activity as a function of disulfide cross-linking. Each data point represents one flux-assay measurement, with error bars indicating the uncertainty in curve-fitting to the primary data. Data are from three separate preparations, with data from each preparation shown in a different color.
Figure 7
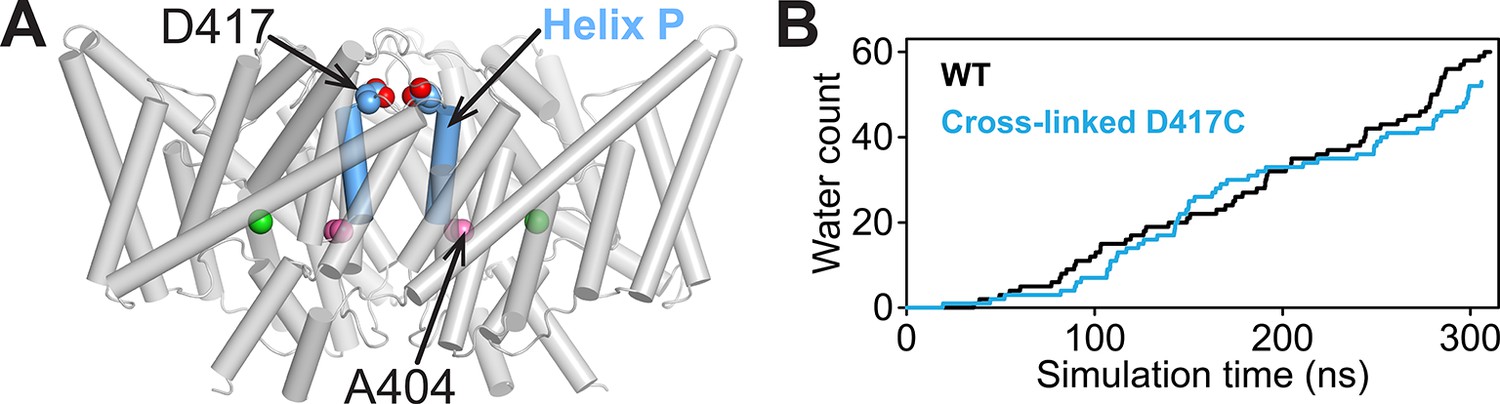
Computational analysis of water entry through the portal lined by A404 (Helix P).
(A) ClC-ec1 structure highlighting the location of the A404 “portal” residue at Helix P. (B) The D417C cross-link does not affect water entry into the pathway connecting Gluin and Gluex. The aggregate number of water molecules entering the region between the two residues was determined as described previously (Han et al., 2014) and compared for wild-type (WT) and cross-linked mutant (D417C) over the same timescales.
Figure 8
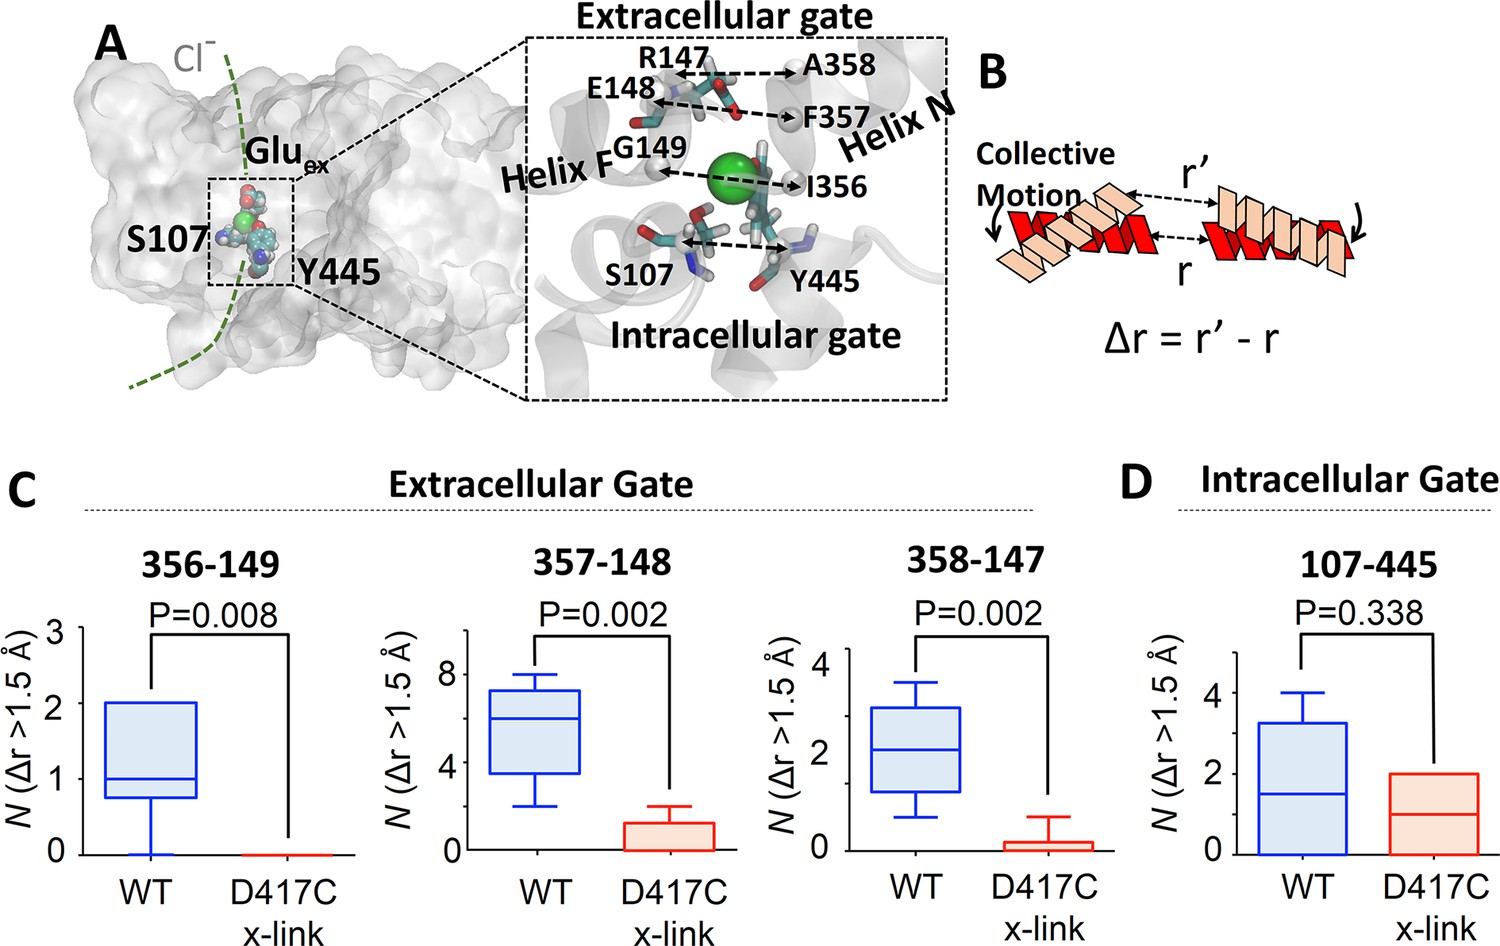
Coupling of extracellular and intracellular gating motions to collective motions in ClC-ec1 detected computationally.
(A) Key inter-Cα distances were employed to detect functional motions. The left panel shows the location of the Cl- gates (dashed box) and transport pathways (dashed green line) in ClC-ec1. Right panel shows a close-up of the Cl- gates where key inter-Cα distances for both the extracellular and intracellular gates are denoted by dashed double arrows. (B) Scheme for determining distance change (Δr) caused by a collective motion. Following a collective motion, a native structure (red helices) undergoes structural transition (peach helices). As a result, the distance between the helices increases by Δr = r’ – r. (C) Opening motions of the extracellular gate. The number (N) of collective motions that lead to distance changes (Δr > 1.5 Å) at each of the extracellular-gate residue pairs was determined from analysis of MD simulations for WT and cross-linked (“D417C x-link”) ClC-ec1, as described in the text. The data are shown in a box-and-whisker plot where the whiskers denote minimum and maximum of the data and the box denotes the range of 25th percentile to 75th percentile of the data when sorted. The horizontal line in the box denotes the median of the data. (D) The number (N) of collective motions that lead to distance changes (Δr > 1.5 Å) at the intracellular gate pair 107–445 is not significantly different between WT and cross-linked ClC-ec1.
Figure 9 with 1 supplement
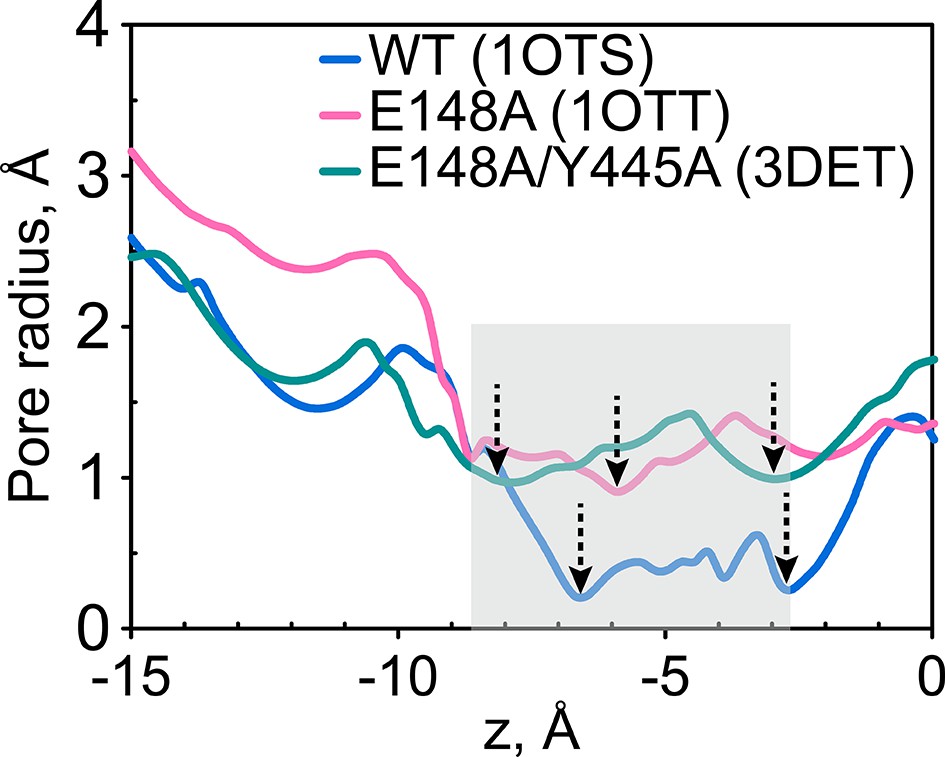
The extracellular gate remains narrow in the Gluex mutant (E148A) and in the channel-like variant E148A/Y445A.
The pore radius profiles of the ClC-ec1 Cl- transport tunnel for WT ClC-ec1 (blue), E148A (pink) and E148A/Y445A (green) along the z-axis (membrane normal). Shown are the profiles for subunit 1. The results for subunit 2 are very similar and thus not shown. The z-position of the central Cl--binding site is chosen as the origin of the z-axis. The shaded region denotes the extracellular-gate region; dashed arrows highlight the z-positions of the bottlenecks.
Figure 9—figure supplement 1
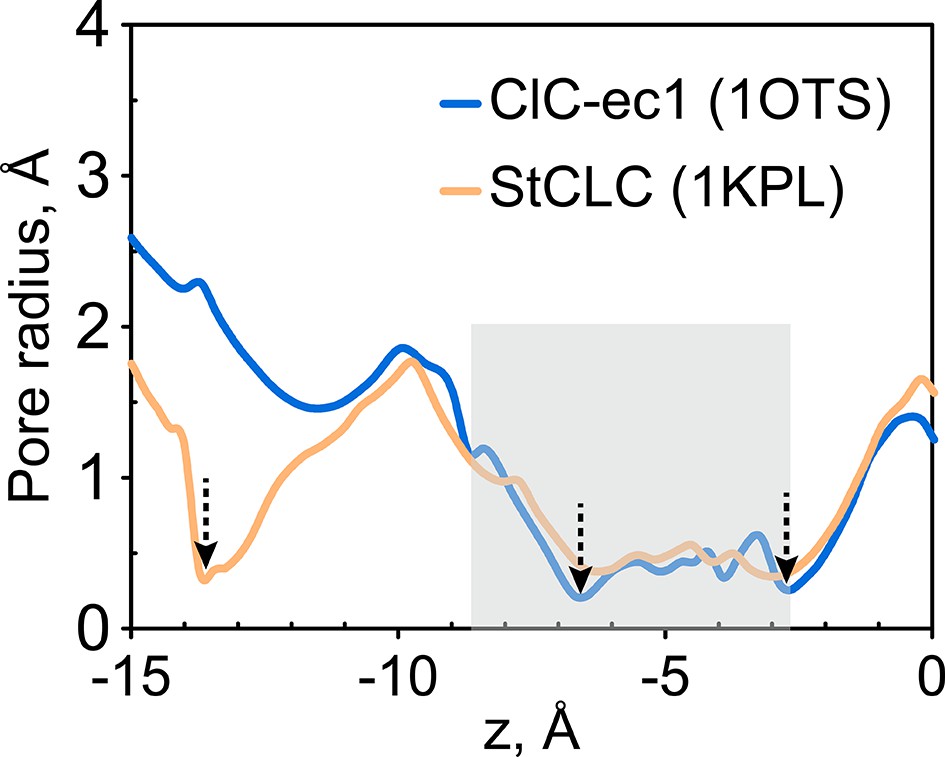
Radius pore profile of 1KPL (CLC structure determined at pH 4.6).
The extracellular gate is narrow in the Salmonella CLC (StCLC) structure determined at pH 4.6. The pore radius profiles of the Cl- transport tunnel for ClC-ec1 (blue) and StCLC (orange) along the z-axis (membrane normal). Shown are the profiles for subunit 1; the results for subunit 2 are very similar and thus not shown. The z-position of the central Cl--binding site is chosen as the origin of the z-axis. The shaded region denotes the extracellular-gate region; dashed arrows highlight the z-positions of the bottlenecks. StCLC exhibits an additional bottleneck towards the extracellular side of the ion-permeation pathway See also Figure 1—figure supplement 1 for a comparison of these two structures.
Figure 10
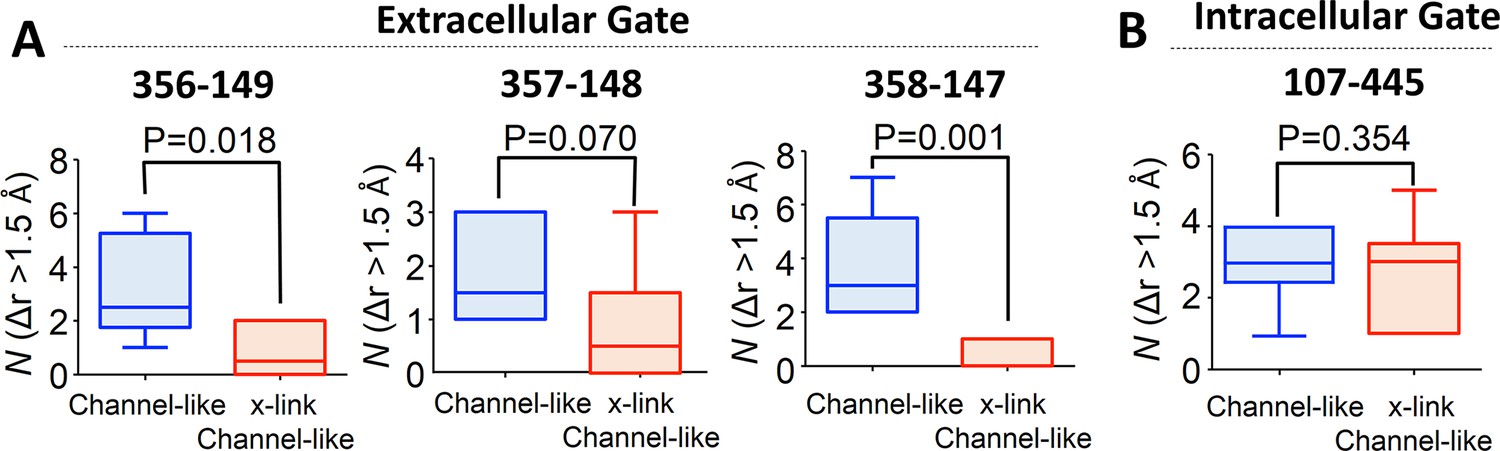
Cross-linking at 417 impedes opening of the extracellular but not the intracellular gate in channel-like ClC-ec1, as detected by computational analysis.
(A) Opening motions of the extracellular gate. The number (N) of collective motions that lead to distance changes (Δr > 1.5 Å) at each of the extracellular-gate residue pairs was determined from analysis of MD simulations for WT and cross-linked (“x-link”) channel-like ClC-ec1, as described in the text. The data are shown in a box-and-whisker plot where the whiskers denote minimum and maximum of the data and the box denotes the range of 25th percentile to 75th percentile of the data when sorted. The horizontal line in the box denotes the median of the data. (B) The number (N) of collective motions that lead to distance changes (Δr > 1.5 Å) at the intracellular gate pair 107–445 is not significantly different between WT and cross-linked channel-like ClC-ec1.
Figure 11
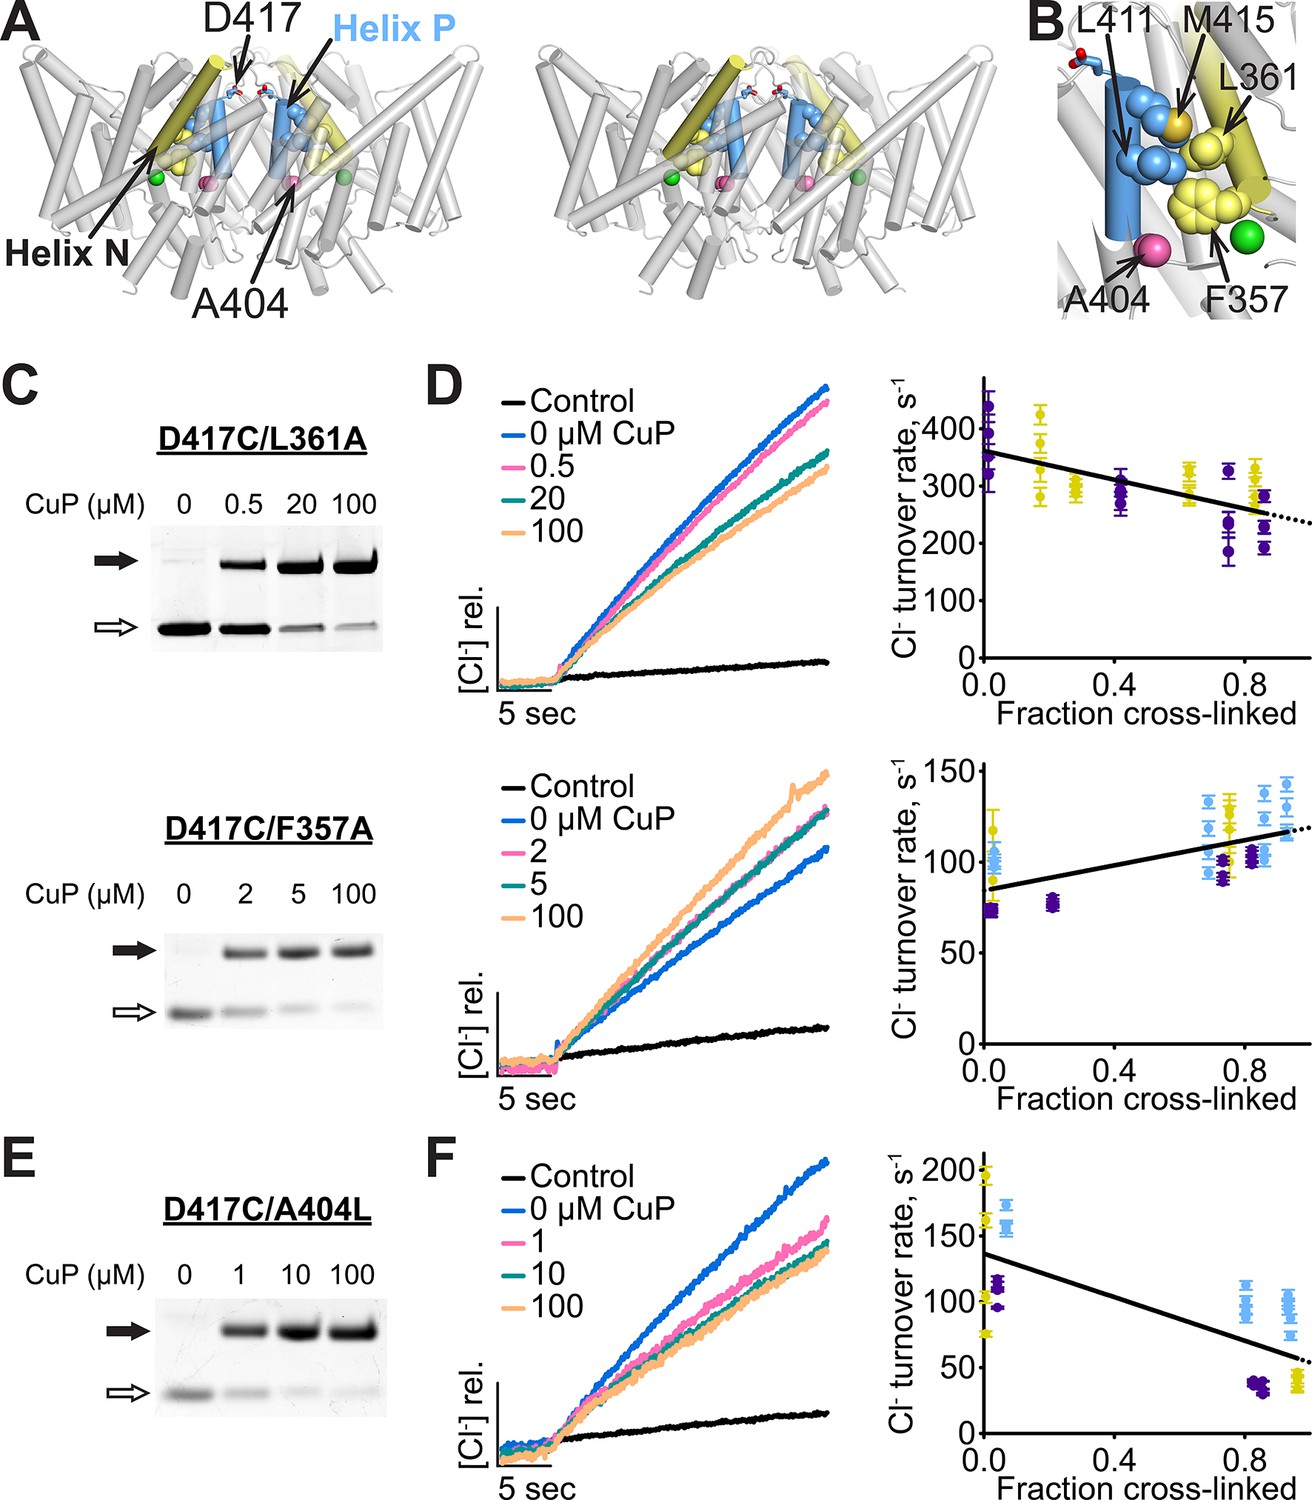
Helix P is coupled to the extracellular gate via Helix N.
(A) Side view of ClC-ec1, in stereo. Conserved residues L411 and M415 in Helix P (blue) make direct contact with conserved residues F357 and L361 in Helix N (yellow). (B) Close-up of Helices P and N. (C) Detection of inter-subunit disulfide cross-links by non-reducing SDS-PAGE in Helix-N mutants D417C/L361A (top) and D417C/F357A (bottom). (D) Effect of cross-linking on activity. Left: Representative data traces showing Cl--transport activity of D417C/L361A and D417C/F357A. Right: Summary data showing Cl--transport activity as a function of disulfide cross-linking. Each data point represents individual data points as described in Figure 4. Purple, yellow and blue each represent data obtained from a separate protein preparation. (E) Detection of inter-subunit disulfide cross-links on D417C/A404L (F) Effect of cross-linking on activity of D417C/A404L. Purple, yellow and blue represent data obtained from separate protein preparations.
Figure 12
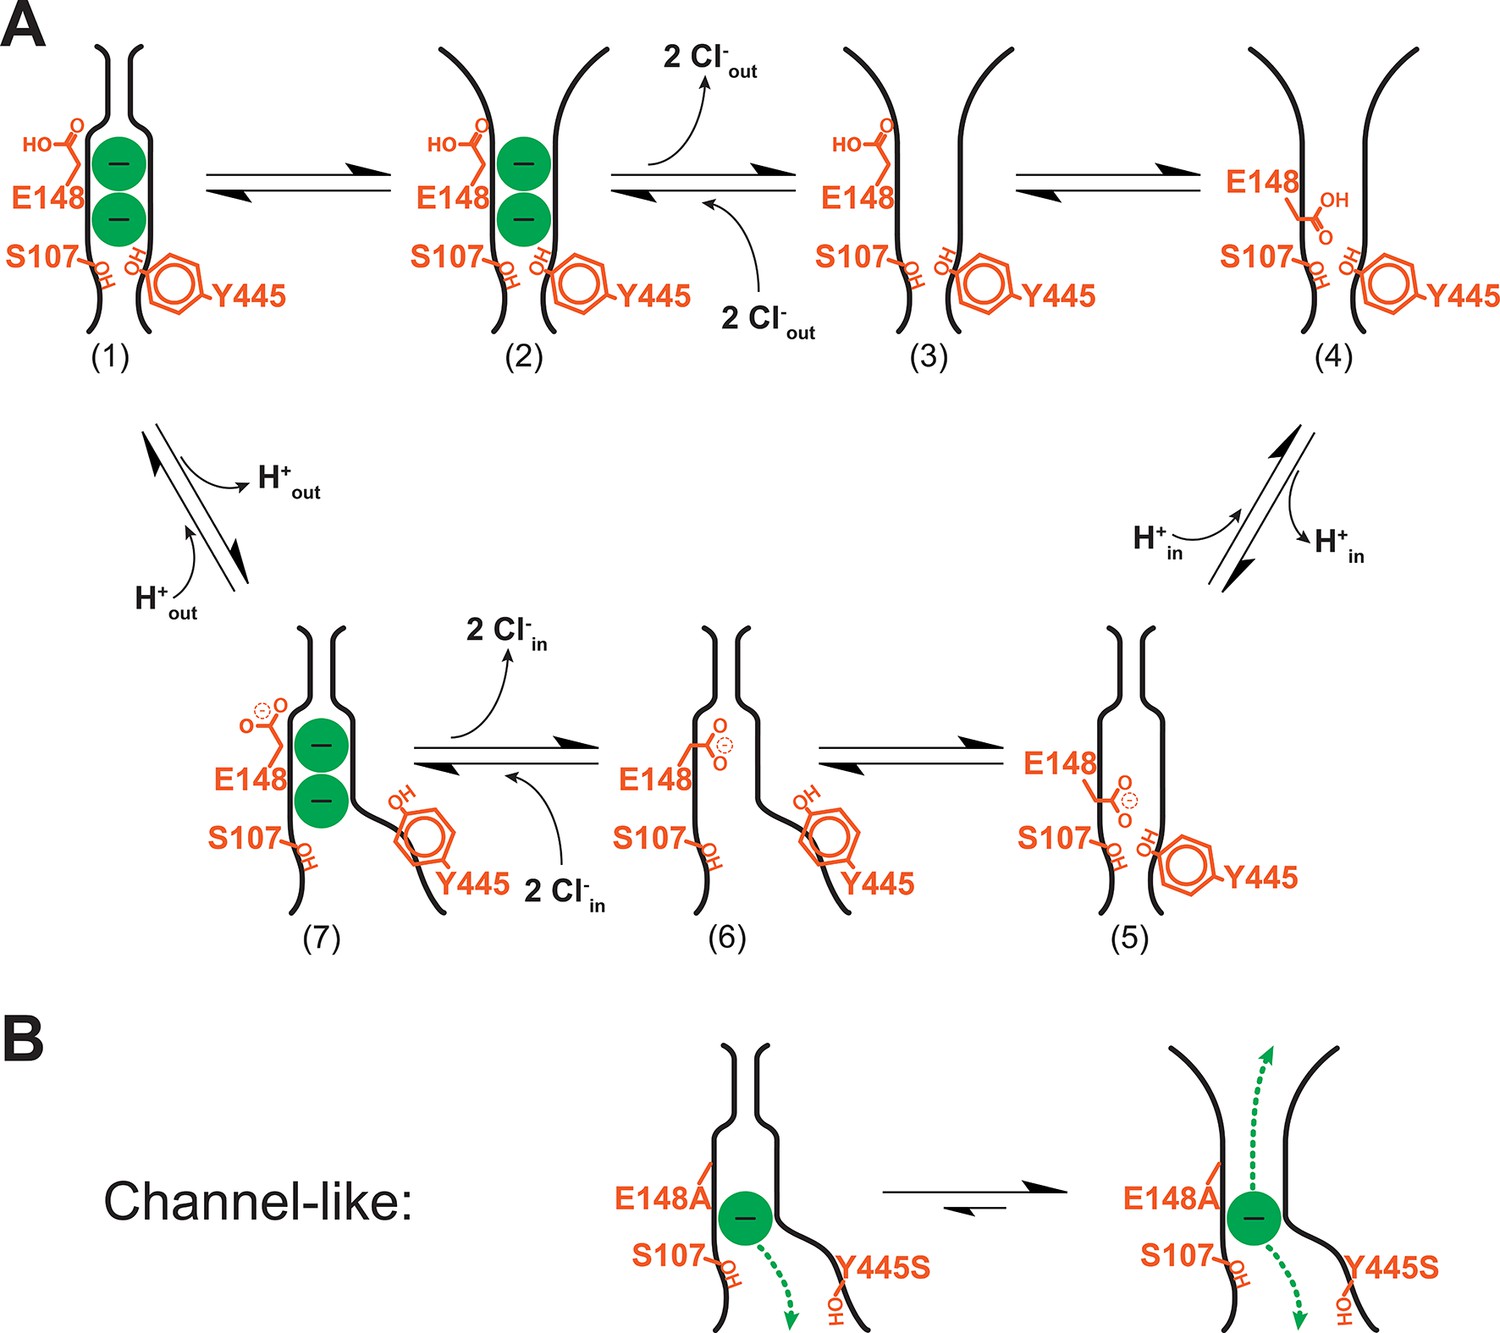
Revised model of the CLC transporter mechanism.
(A) CLC transporter cycle. The OFoccluded state (1) undergoes a conformational change to OFopen (2). This step is pH-dependent but may be promoted by protonation of residues other than Gluex (see Discussion). Two Cl- ions leave (3) and then entry of the protonated Gluex into the permeation pathway (4) facilitates H+-transfer to the inside (via Gluin, Figure 1B) (5). Conformational change to the inward-facing state (6) allows 2 Cl- ions to enter from the intracellular side, knocking Gluex out of the pathway (7). The cycle is reversible, with protonation favoring conformational change to the OFopen state. (B) Channel-like CLC states. The crystal structure of channel-like ClC-ec1 reveals a narrow constriction at the extracellular-gate region, depicted at left. However, results here demonstrate that the major conformation adopted in solution more closely resembles the OFopen state (equilibrium shifted to right). This finding is consistent with the high Cl- throughput observed in channel-like ClC-ec1.
Tables
Table 1
D417C activity extrapolated to 0 and 100% cross-link.
| D417C variant | Turnover at 0% cross-link (s-1) | Turnover at 100% cross-link (s-1) |
|---|---|---|
| WT | 1440 ± 70 | 280 ± 70 |
| E148A/Y445S (channel-like) | 14400 ± 1300 | 520 ± 5400 |
| E148A | 260 ± 20 | 76 ± 26 |
| Y445S | 850 ± 70 | -20 ± 105 |
| A404L | 140 ± 20 | 54 ± 17 |
| L361A (Helix N) | 360 ± 30 | 240 ± 30 |
| F357A (Helix N) | 84 ± 9 | 119 ± 8 |
Table 2
Data collection and refinement statisticsa.
| Data collection | |
|---|---|
| Space group | C121 |
| Unit cell dimensions | |
| a, b, c (Å) | 231.7, 96.1, 170.0 |
| α, β, γ (°) | 90, 132, 90 |
| Resolution range (Å) | 39.2–3.15 (3.23-3.15) |
| Completeness (%) | 90.2 (80.6) |
| Rmerge (%) | 7.7 (70.9) |
| I/σ (I) | 14.8 (1.7) |
| Redundancy | 3.6 (2.1) |
| Refinement statistics | |
| Resolution limit (Å) | 39.2–3.15 |
| No. of reflections | 41,839 |
| Rwork/Rfree (%) | 20.5/25.7 |
| Number of atoms | |
| Protein | 13,064 |
| Ligand/ion | 4 |
| B-factors | |
| Protein | 69.8 |
| Ions | 118.4 |
| r.m.s deviations | |
| Bond lengths (Å) | 0.007 |
| Bond angles (°) | 1.139 |
-
aValues in parentheses are for the highest-resolution shell. Data were collected from a single crystal.
Download links
A two-part list of links to download the article, or parts of the article, in various formats.
Downloads (link to download the article as PDF)
Open citations (links to open the citations from this article in various online reference manager services)
Cite this article (links to download the citations from this article in formats compatible with various reference manager tools)
Revealing an outward-facing open conformational state in a CLC Cl–/H+ exchange transporter
eLife 5:e11189.
https://doi.org/10.7554/eLife.11189


