Aurora-A mediated histone H3 phosphorylation of threonine 118 controls condensin I and cohesin occupancy in mitosis
- University of Texas MD Anderson Cancer Center, United States
- The Ohio State University, United States
- Royal Children's Hospital, Australia
Figures
Figure 1 with 1 supplement
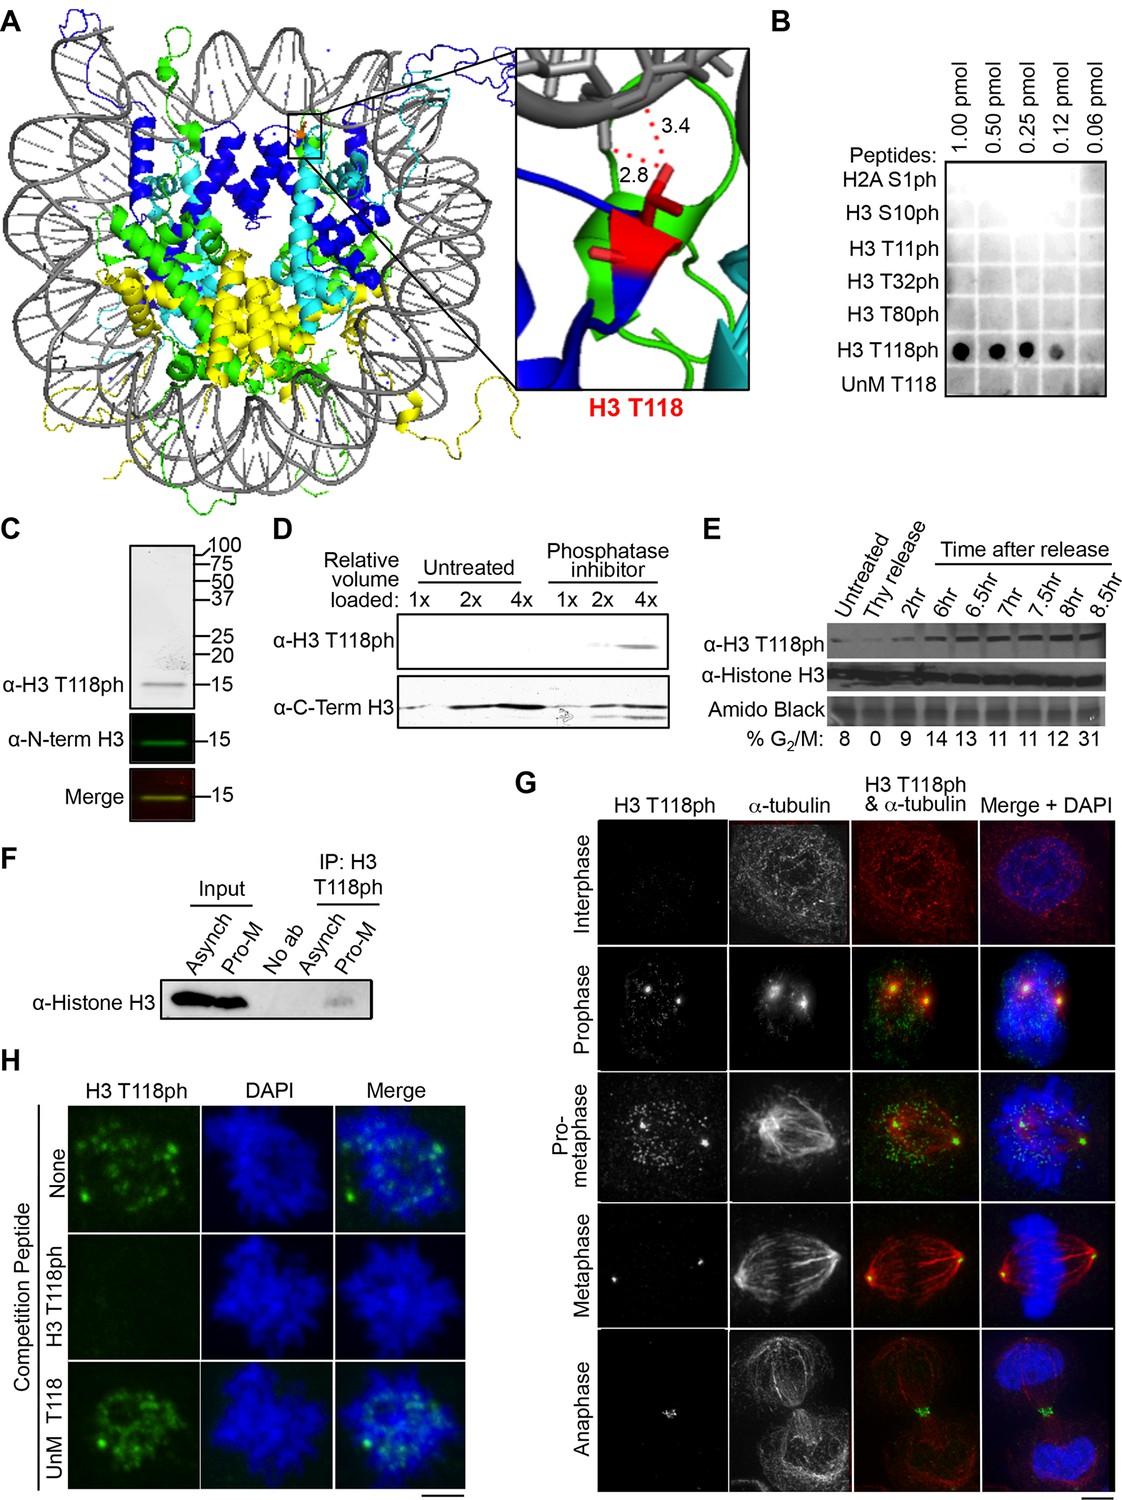
Dynamic mitotic phosphorylation of H3 T118.
(A) The side chain of H3 T118 (red) is close enough to form a hydrogen bond with the DNA (grey). Histone H3 is depicted in dark blue, Histone H4 is cyan, Histone H2A is green and H2B is yellow. Angstrom distances were drawn using nearest neighbor wizard in pymol. Protein Data Bank (PDB) code 1KX5. (B) The indicated amounts of the respective peptides were dotted and the membrane probed with an antibody to histone H3 T118ph. The UnM T118 peptide corresponds to human histone H3 aa 115 to 125. (C) Western blot of crude extract from HeLa cells, using infra-red labeled secondary antibodies. H3 T118ph (greyscale/red) and N-term histone H3 (green). (D) HeLa cell extracts untreated or treated with phosphatase inhibitor were probed with the indicated antibodies. Full western blot image can be found in Figure 1—figure supplement 1A. (E) HeLa cells were synchronized by a double thymidine arrest and released at the indicated times, followed by western blot analysis of whole cell extracts. (F) Immunoprecipitation (IP) using the H3 T118ph antibody from HeLa cells asynchronous (Asynch) or released from a G2 arrest (with 9 µM Ro-3306 for 16 hr) for 30 min resulting in pro-metaphase cells (Pro-M). Full western blot image can be found in Figure 1—figure supplement 1B. (G) Immunofluorescence analysis of H3 T118ph (green) and α-tubulin (red) in HeLa cells. Scale bar = 5 μm. (H) H3 T118ph antibody was pre-incubated with no peptide (top), H3 phosphorylated at T118 (middle) or unmodified (UnM T118, bottom). The supernatants were used to detect H3 T118ph in pro-metaphase HeLa cells. Scale bar = 5 μm.
Figure 1—figure supplement 1
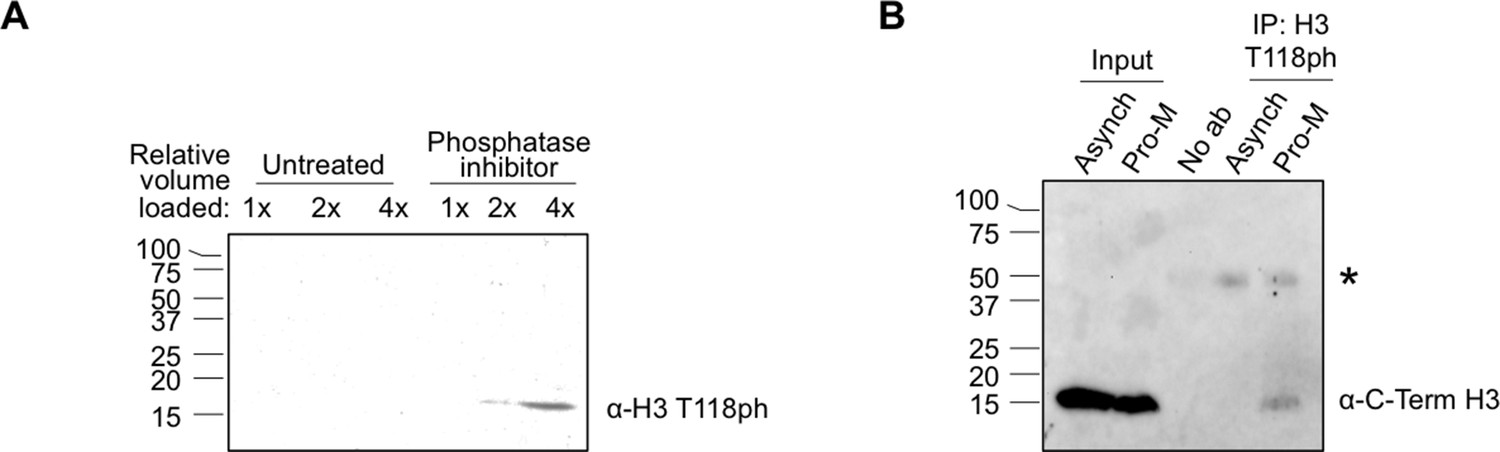
Full size western blots of data shown in Figure 1.
(A) Full image of western blot probed with H3 T118ph from Figure 1D. (B) Full image of immunoprecipitation analysis western blot probed with antibody to histone H3 for Figure 1F. labels are abbreviated the same as in Figure 1F. The “*” marks the non-specific IgG band.
Figure 2
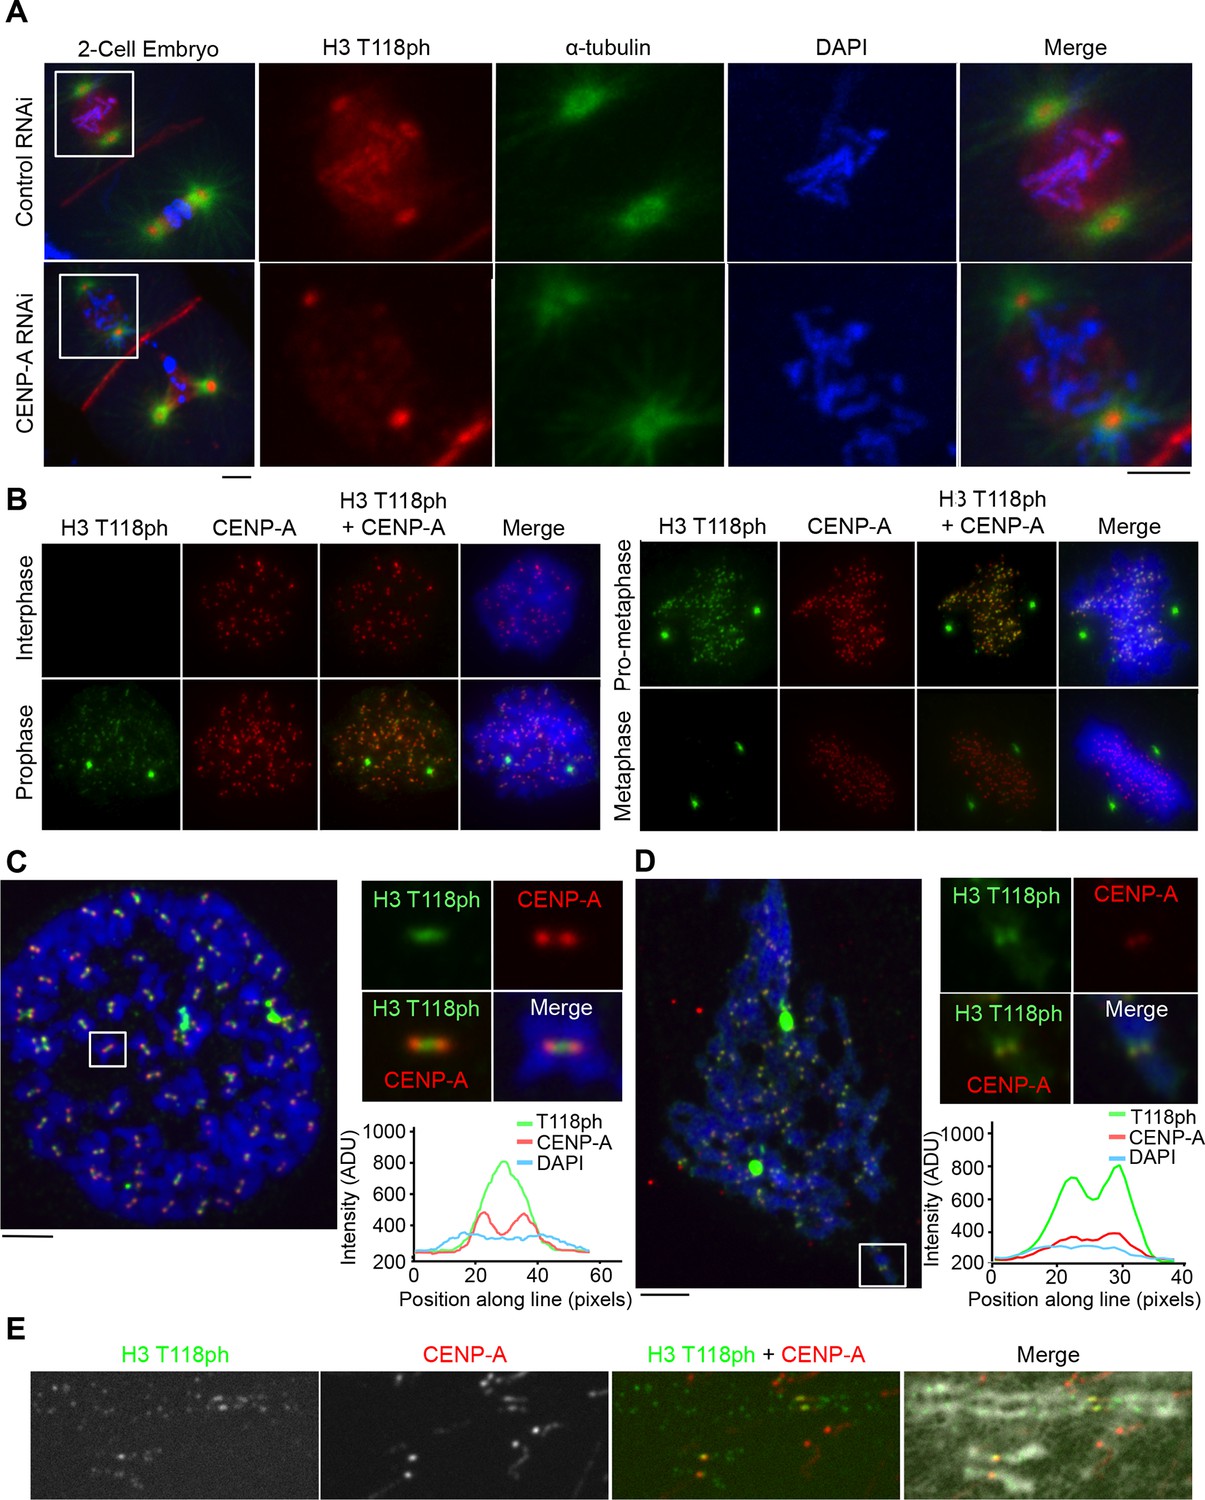
H3 T118ph localizes to pericentromeres and chromosome arms during prophase and pro-metaphase.
(A) Immunofluorescence of two-cell C. elegans embryos Control (RNAi) (top) and centromeric protein A CENP-A (RNAi)-depleted (bottom) embryos were fixed and stained with α-tubulin (green) and H3 T118ph (red) antibodies. DNA was stained with DAPI (blue). Scale bar = 5 μm. (B-E) Immunofluorescence of HeLa cells stained with CENP-A (red) and H3 T118ph (green) antibodies. (B) Images of progressive mitotic stages. (C) Mitotic spreads synchronized with colcemid (no tension across the kinetochores). The white box indicates magnified area. Intensity of the signal across centromeres is plotted. Scale bar = 5 μm. (D) Unsynchronized mitotic spread, as in C. (E) Extended metaphase chromatid fibers showing H3 T118ph localization to discrete regions of chromosome arms.
Figure 3 with 6 supplements
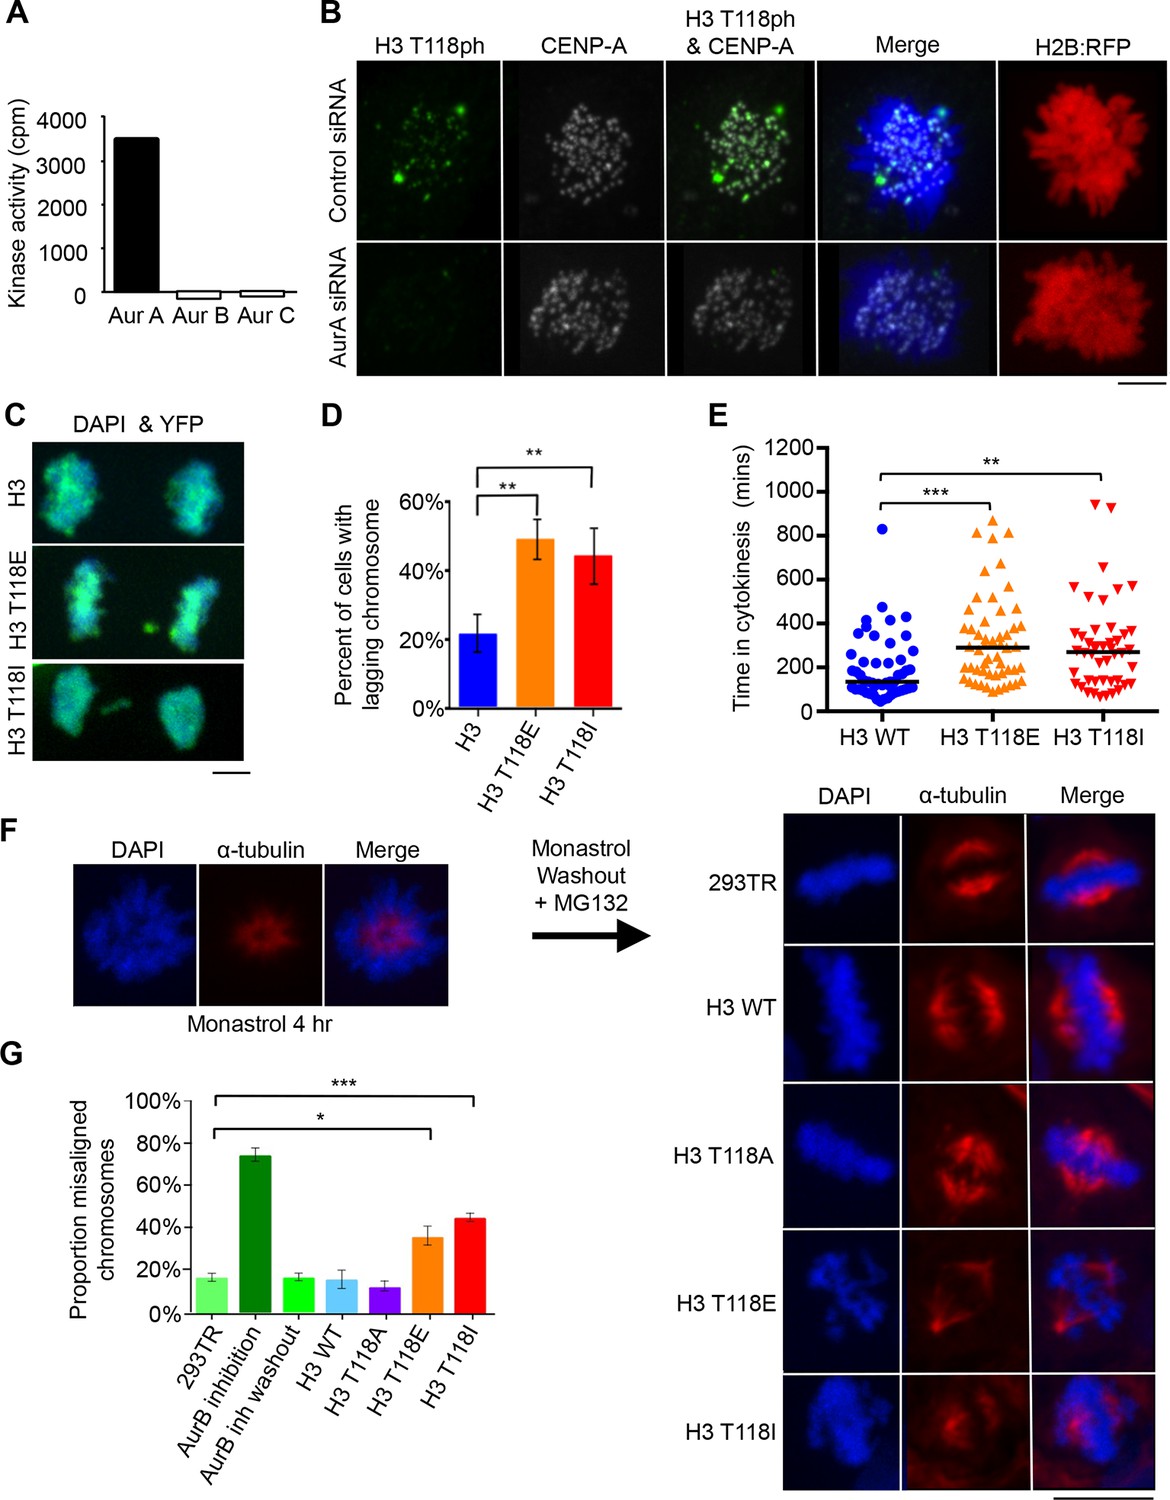
Aurora-A phosphorylates H3 T118 and mutations that mimic T118 phosphorylation cause mitotic defects.
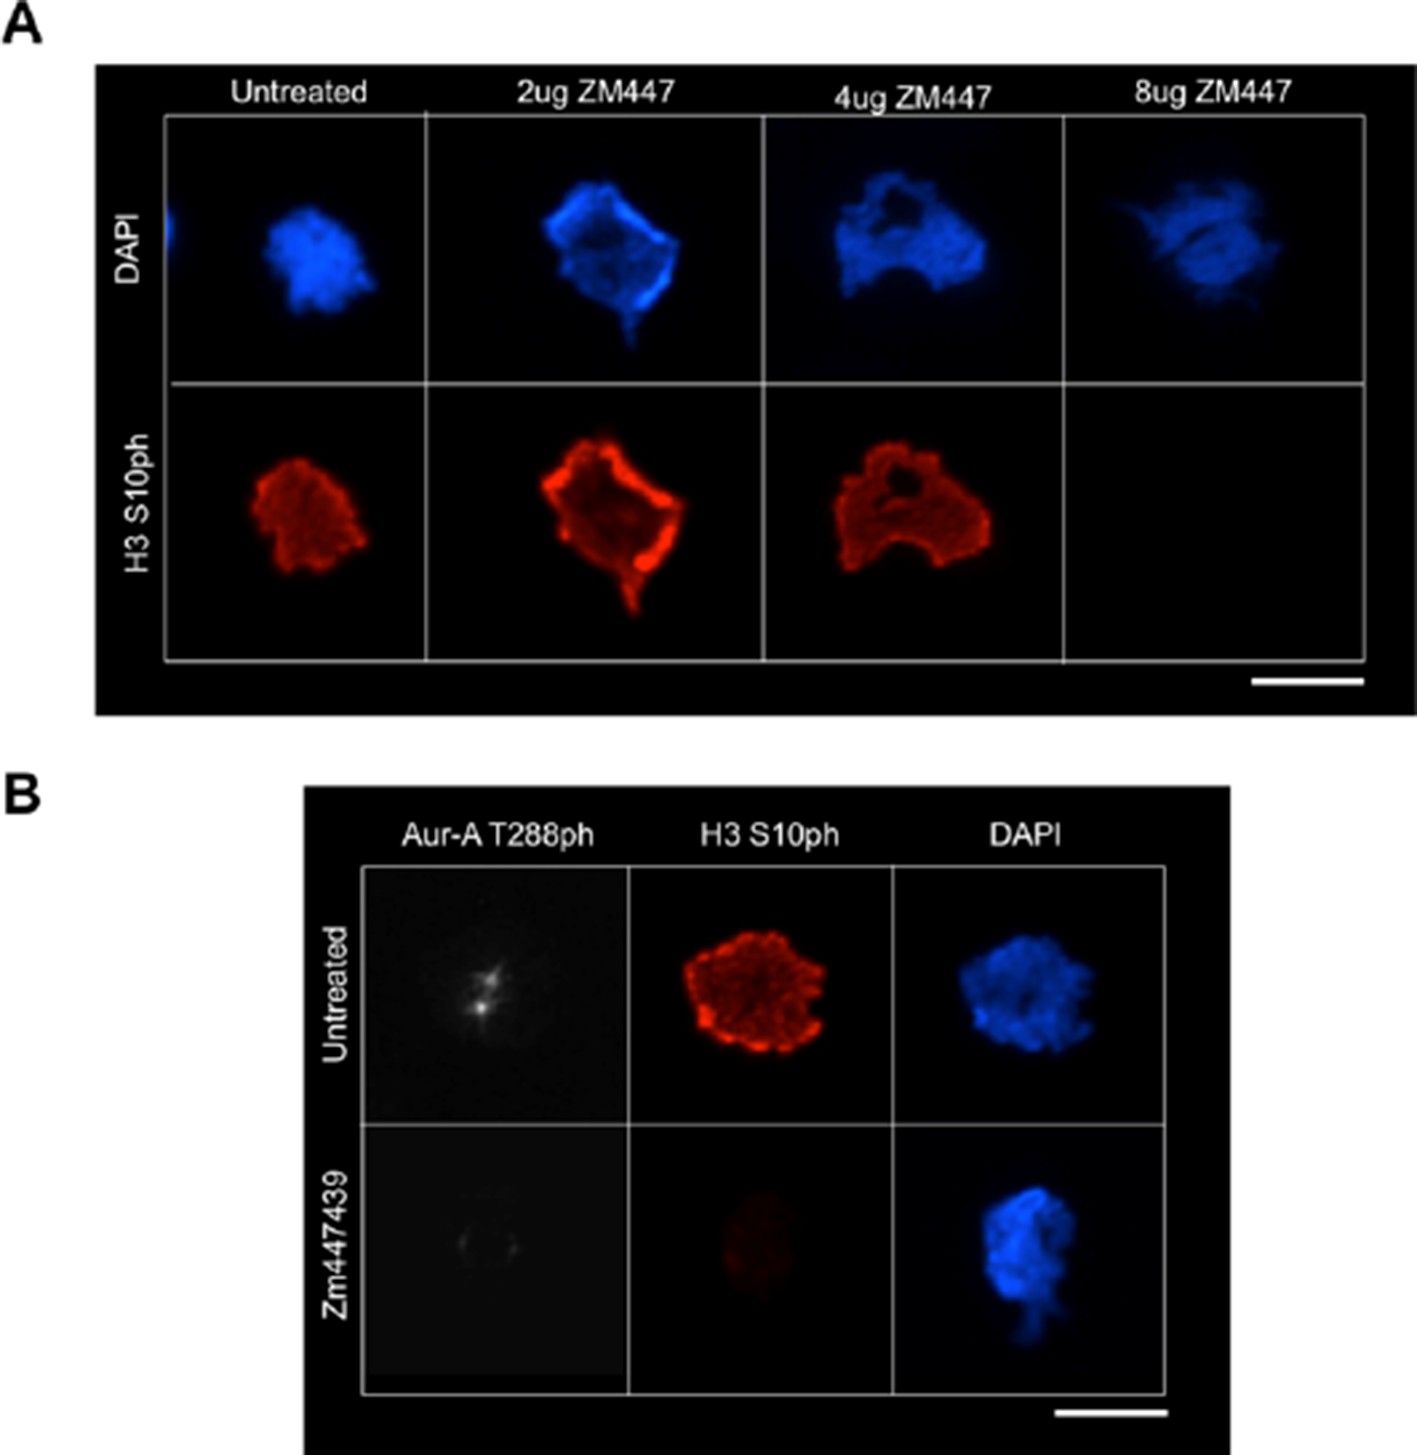
(A) In vitro kinase activity of Aurora-A,-B,-C for H3 T118 peptide. (B) Immunofluorescence of pro-metaphase HeLa cells cotransfected with H2B:RFP and siRNA to Aurora-A (bottom) or control scrambled siRNA (top). Scale bar = 5 μm. (C) Cytokinesis in 293TR cells transiently transfected with H3-YFP plasmids. YFP (yellow) and DNA stained with DAPI (blue). Scale bar = 5 μm. (D) Quantitation of C (n=30 cells in anaphase, **p=0.01, by Fishers exact test). Error bars represent SD of the mean (SDM). (E) Quantitative data of live cell imaging showing differences in average length in cytokinesis during live cell imaging (n = 50 cells, **p<0.01 and ***p<0.001 by unpaired student t-test). (F) Error correction assay for 293TR stable cell lines expressing H3. Inhibition of Aurora-B with ZM447439 represents an extreme case of inability to correct error. Scale bar =10 μm (G) Quantitation of cells with misaligned chromosomes on the metaphase plate as in F. (*p<0.05 and ***p<0.001 by Fishers exact test). Error bars represent SDM.
Figure 3—figure supplement 1
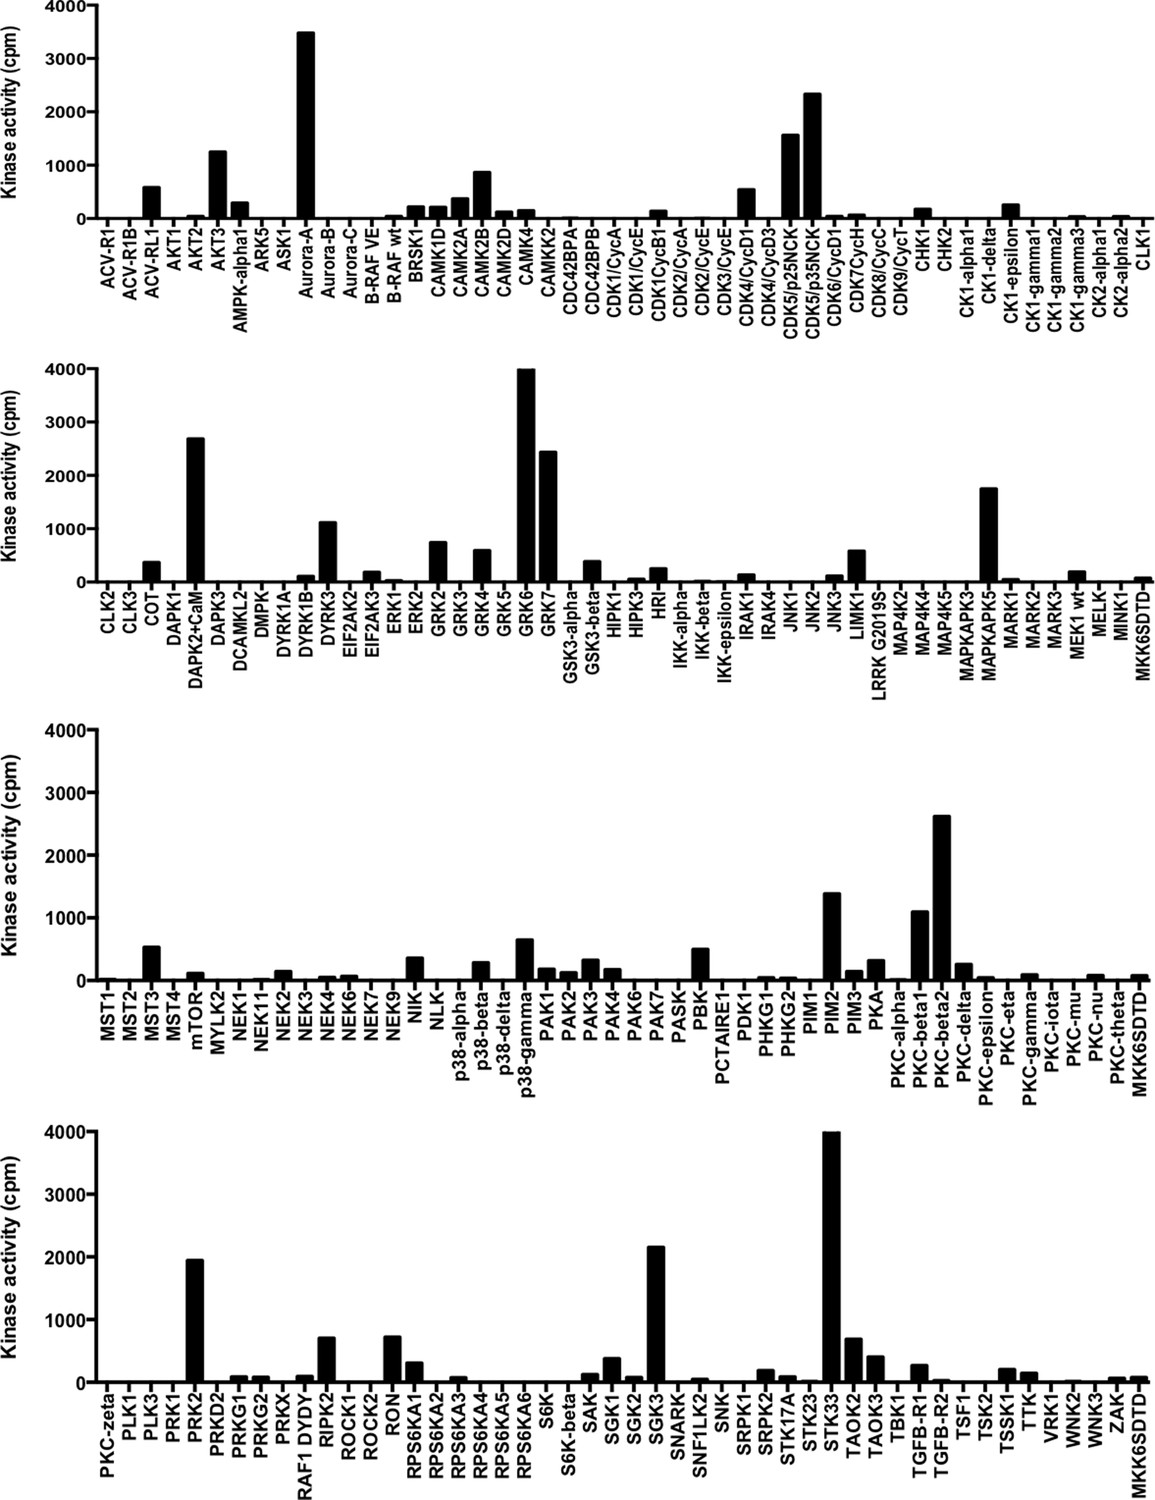
Results of in vitro kinase screen on peptide spanning H3 T118.
Kinase screen was performed by ProQinase. Kinase activity values (in cpm, corrected for peptide background) of 190 Ser/Thr kinases performed with 1 µM biotinylated peptide containing amino acids 112 to 123 of H3. The Y-axis set to zero.
Figure 3—figure supplement 2
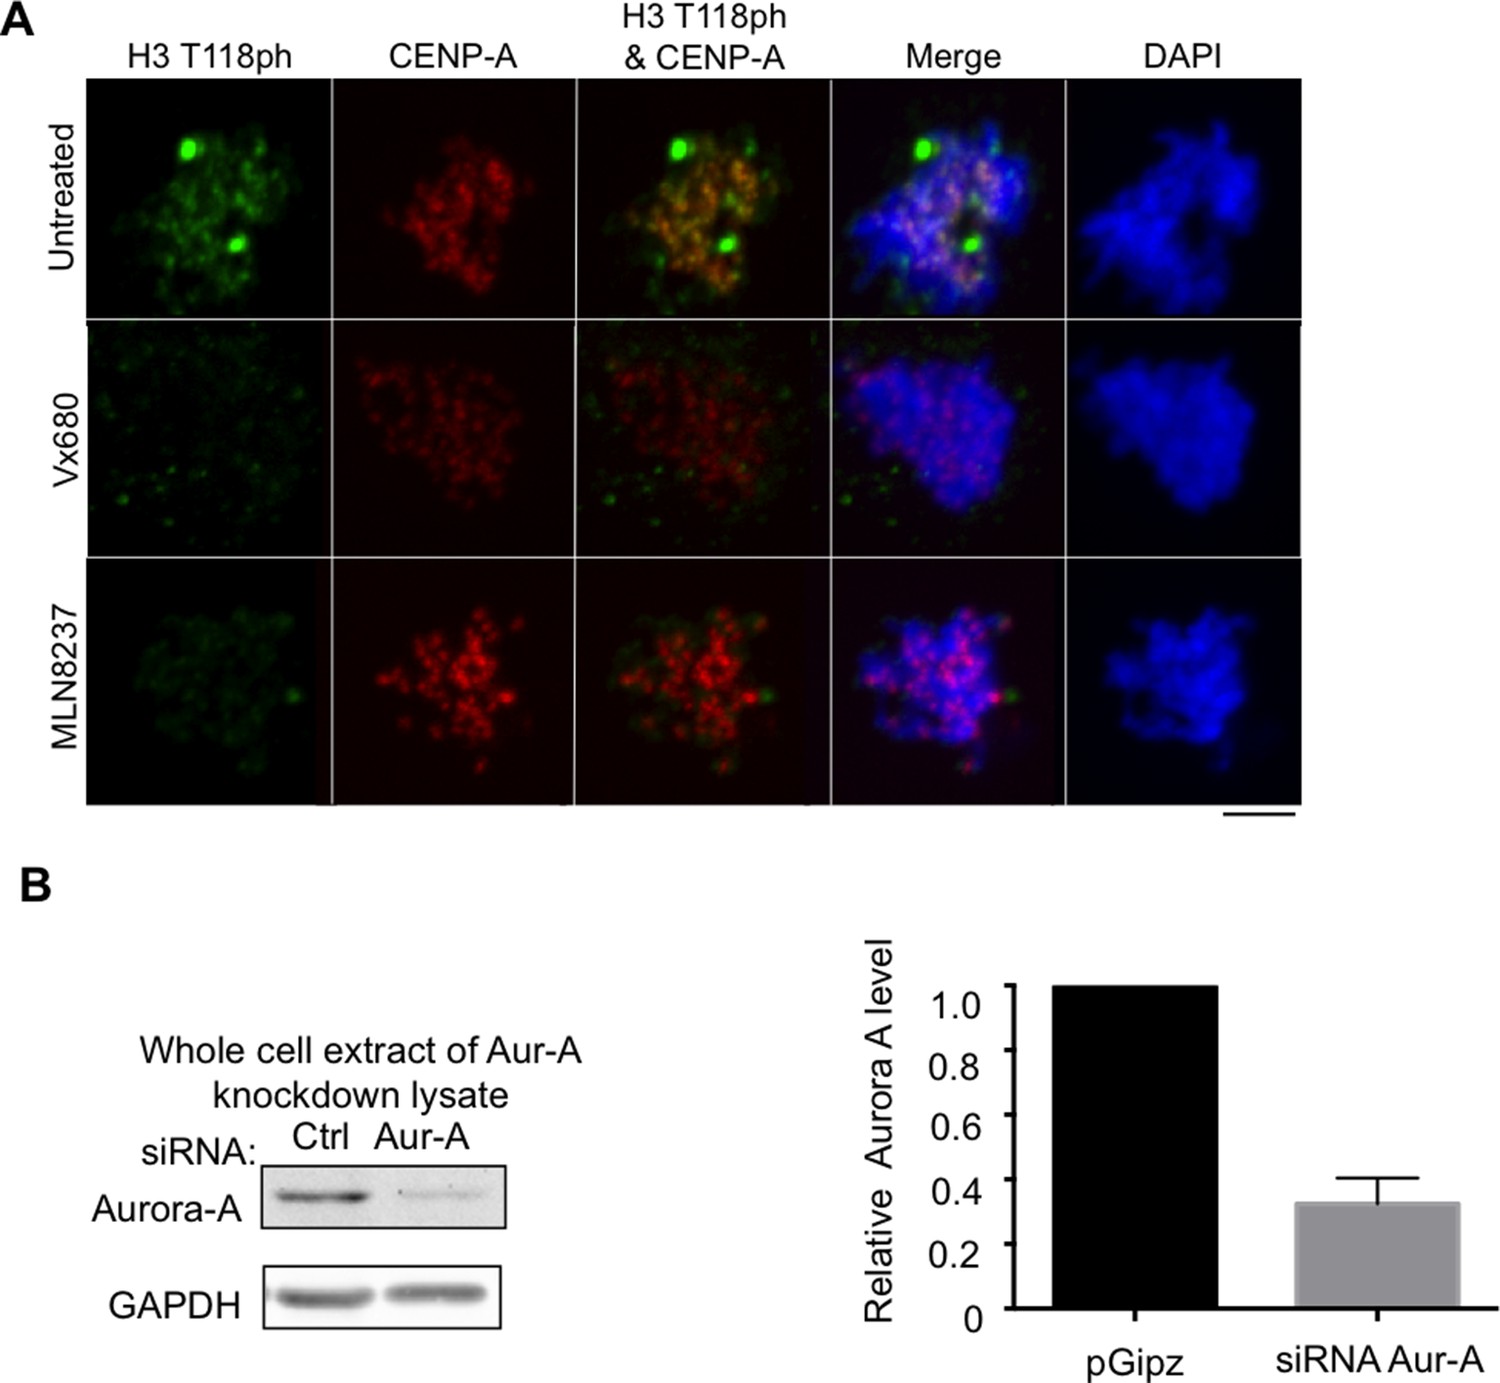
Aurora-A inhibitors lead to decreased H3 T118ph.
(A) Aurora-A inhibitors lead to decreased H3 T118ph. Asynchronous HeLa cells were treated with or without Mln8237 or Vx680 and immunostained with antibodies to H3 T118ph (green), and CENP-A (red) and DNA was stained with DAPI (blue). Representative pro-metaphase cells are shown. Scale bar = 5 μm. (B) Test of efficiency of the Aurora-A knockdown for experiments shown in Figure 3 onwards. Whole cell extracts were resolved by SDS-PAGE and analyzed by western blot with antibodies to Aurora-A and GAPDH. Quantitation of Aurora-A protein levels normalized to GAPDH. Shown is the average and standard deviation from three independent experiments.
Figure 3—figure supplement 3
Knockdown of TPX2 leads to reduced H3 T118ph.
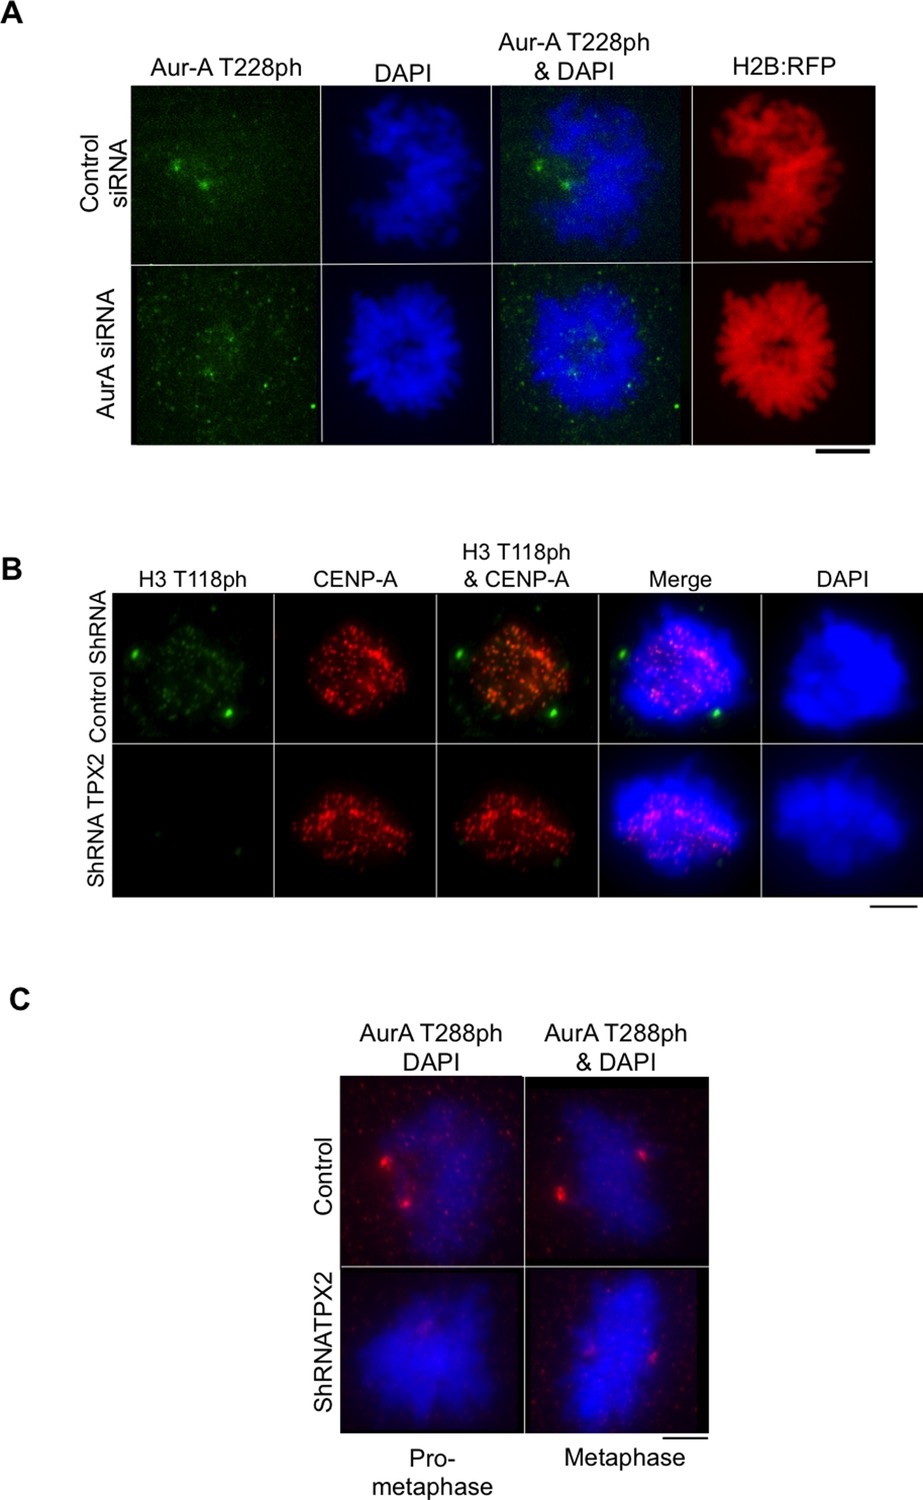
(A) Control for showing that Aurora-A knockdown worked to decrease phosphorylation of a known substrate. HeLa cells were cotransfected with H2B:RFP and siRNA to Aurora-A or control scrambled siRNA. Coverslips were collected 72 hr post transfection and immunostained with primary antibody Aurora-A T288ph (green). Scale bar = 5 μm. (B) Knockdown of TPX2 leads to reduced H3 T118ph. HeLa cells were cotransfected with H2B:RFP and siRNA to Aurora-A or control scrambled siRNA. Coverslips were collected 72 hr post transfection and immunostained with primary antibody Aurora-A T288ph (green). Scale bar = 5 μm. (C) Knockdown of TPX2 reduces Aurora-A activity in pro-metaphase. Knockdown was performed as in B. Representative images of immunostained with primary antibody to Aurora-A T288ph (red) are shown. Scale bars = 5 μm.
Figure 3—figure supplement 4
Characterization of transient transfections and stable cell lines of wild type and mutant H3.
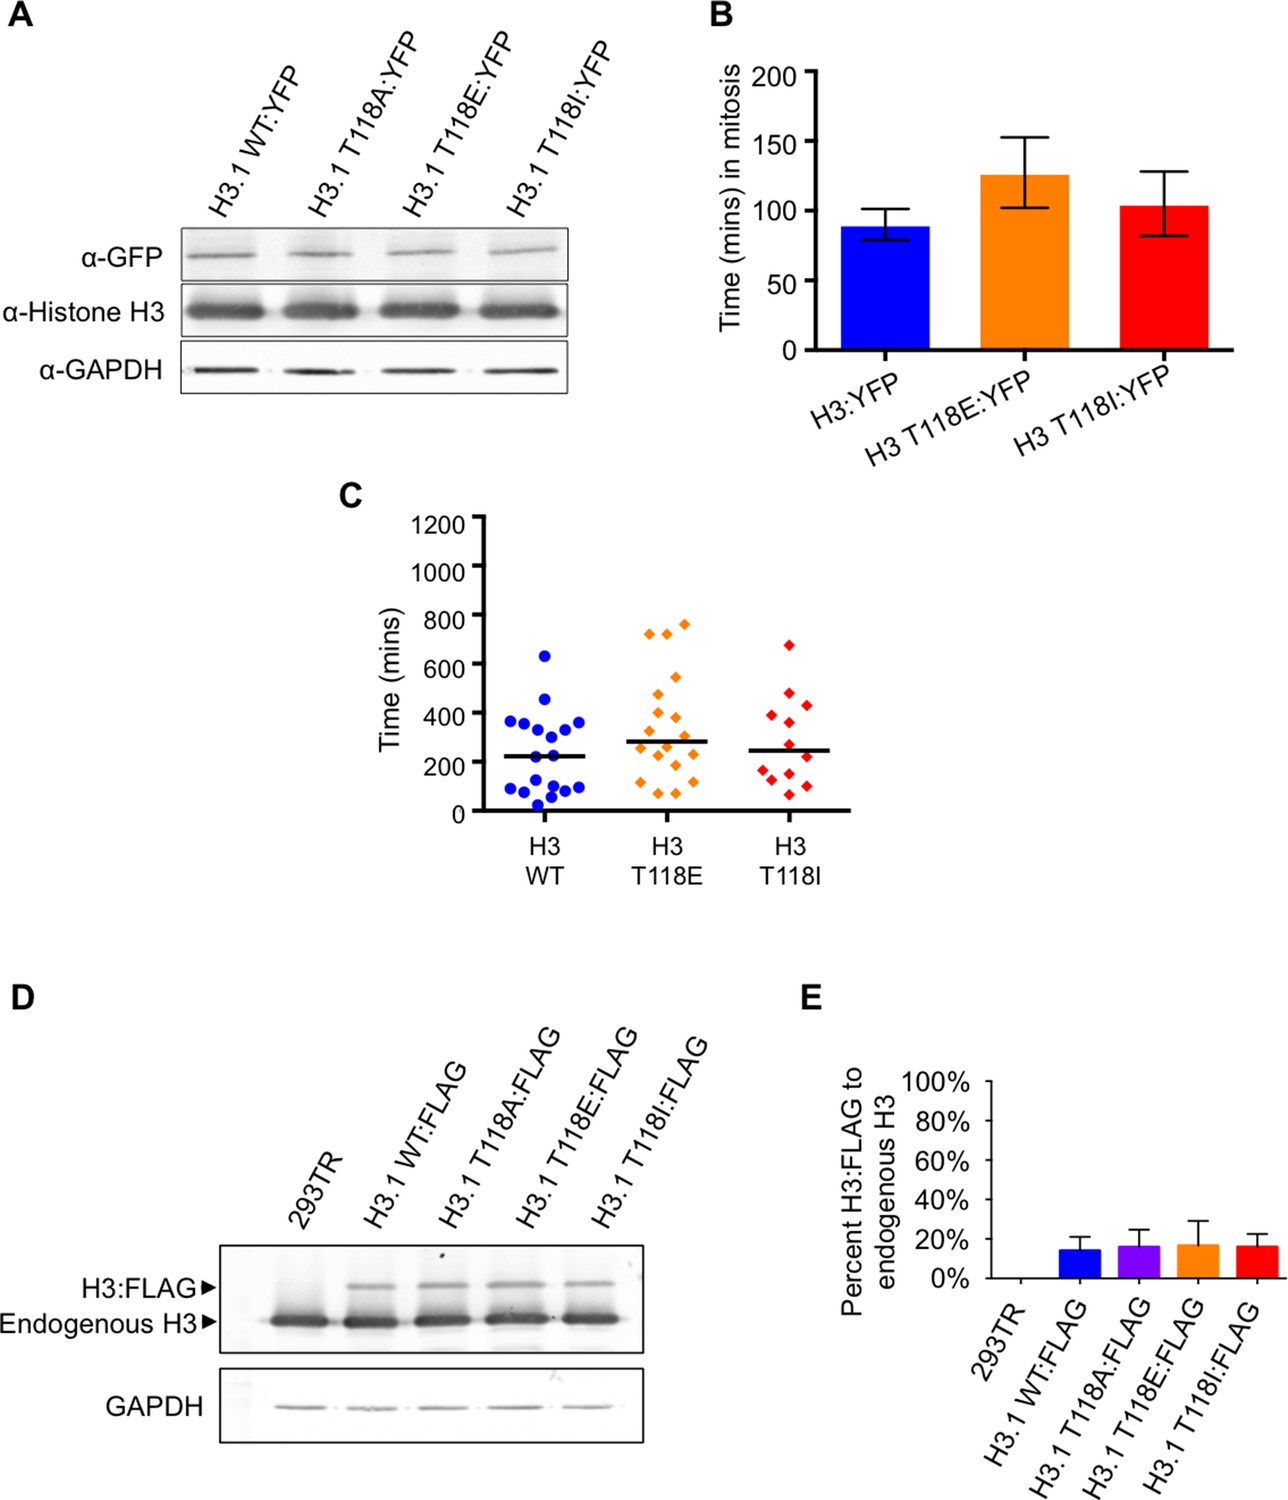
(A) Consistent level of expression of YFP tagged wild type and mutant H3. Western blot analysis of whole cell extract from transient transfections following live cell imaging of H3 WT:YFP and H3:YFP mutants. The blot was probed with a GFP specific antibody. Histone H3 and GAPDH are shown as loading controls. (B) Time spent in mitosis is not significantly affected by expression of H3 or T118 mutants. Quantitation of the duration pro-metaphase to an anaphase of transiently transfected H3.2:YFP, H3.2 T118E:YFP, and H3.2 T118I:YFP taken from analysis of live cell imaging of YFP. The average and standard deviation of three independent experiments is shown. (C) Time spent in mitosis is not significantly affected by addition of H3 or T118 mutants. Quantitative data of live cell imaging of cells progressing through cytokinesis with a lagging chromosome. The average length of cytokinesis for H3:YFP, H3 T118E:YFP, and H3T118I:YFP is marked by the horizontal line. Differences were not statistically significant. (D) Equal expression of the FLAG tagged H3 wild type and mutant constructs. Western blot analysis of whole cell extract from 293TR cells stably expressing wild type and mutant H3:FLAG. The blot was probed for histone H3 to detect endogenous H3 and H3:FLAG. GAPDH is shown as a loading control.(E) Quantitation of FLAG tagged H3 compared to endogenous H3. The average and standard deviation of three independent experiments is shown.
Figure 3—figure supplement 5
FLAG-tagged wild type and mutant H3 are equally incorporated into chromatin.
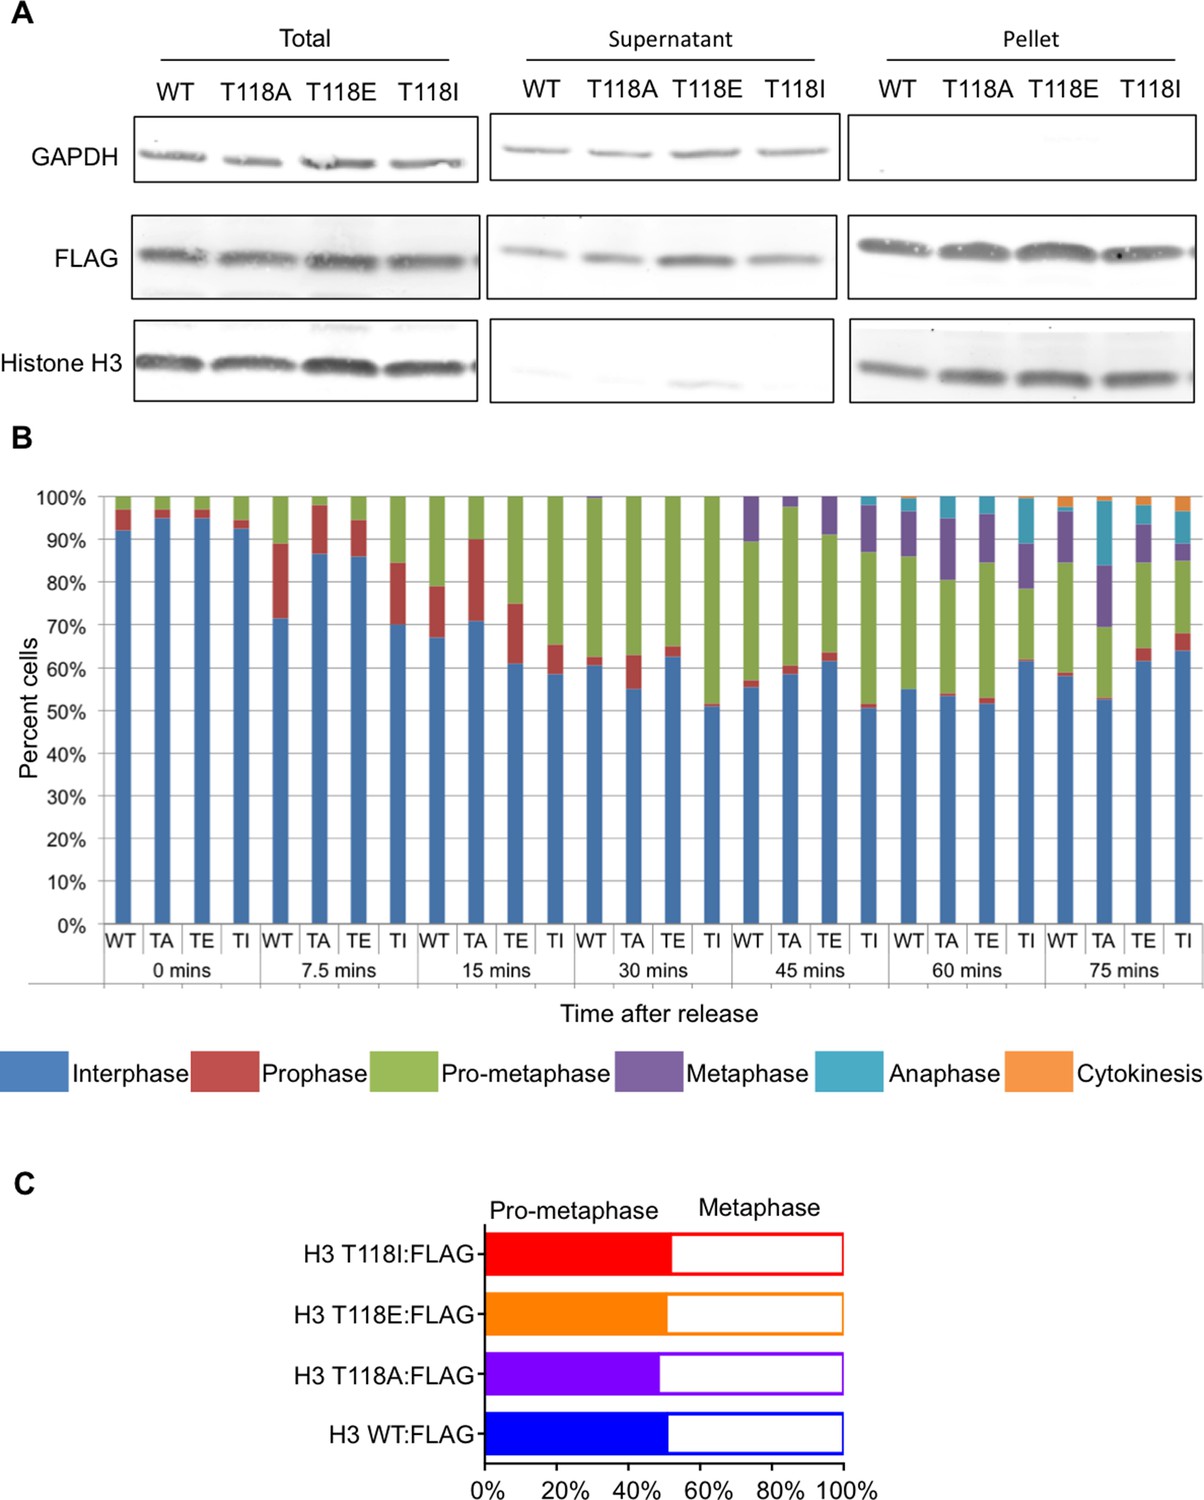
(A) FLAG-tagged wild type and mutant H3 are equally incorporated into chromatin. Chromatin fractionation following mitotic shake off of 293TR stable cell lines expressing wild type and mutant H3:FLAG. The blot was probed with α-FLAG to detect tagged H3; histone H3 and GAPDH were used as fractionation controls. “Supernatant” contains the soluble proteins while “pellet” contains the insoluble proteins including those on chromatin. (B) Analysis of distribution of cells in different phases of mitosis upon expression of FLAG-tagged wild type and mutant H3. Stable cell lines of histone H3 WT:FLAG (WT), H3 T118A:FLAG (TA), H3 T118E:FLAG (TE), or H3 T118I:FLAG (TI) were grown on coverslips and arrested in Ro-3306 inhibitor for 24 hr. Coverslips were collected at the times listed following release into fresh DMEM. At each time point the cells were scored for the phases of the cell cycle phase based on DAPI DNA stain (n=300 mitotic cells for each mutant, per time point, collected over 3 experiments). (C) Expression of wild type and mutant H3 does not make prophase longer. Quantitation of stable cell lines in pro-metaphase or metaphase upon release from monastrol with arrest in MG132 for 2 hr (n=75 cells, collected over 3 experiments.
Figure 3—figure supplement 6
Overview of the Drosophila system expressing wild type and mutant H3 proteins.
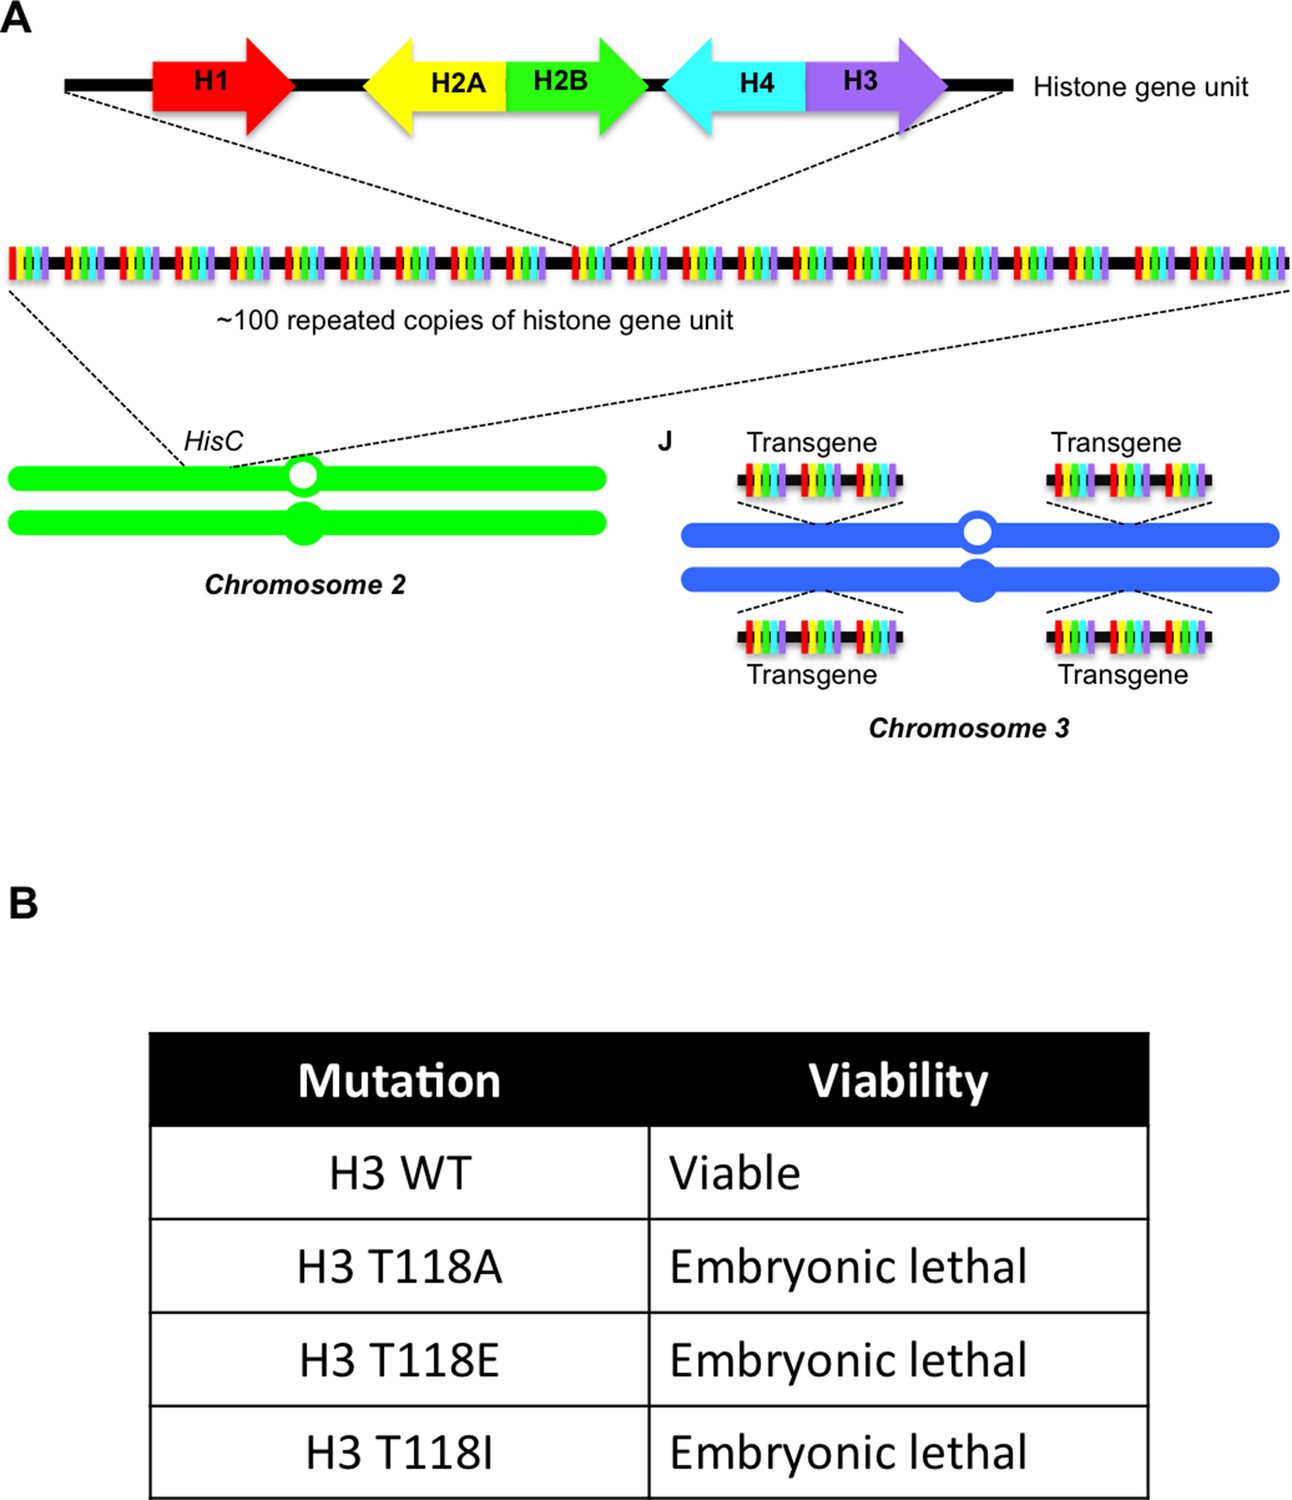
(A) Overview of the Drosophila system used to replace all H3 with exogenous wild type or mutant H3 expressed from 12 transgenes. Schematic representation of histone gene organization in Drosophila melanogaster. Each histone gene repeat unit contains a single His1 (red), His2B (blue), His2A (yellow), His4 (aqua) and His3 (purple) gene, which is repeated approximately 100 times on chromosome 2. Transgenes carrying three histone gene units were added one at a time into phiC31 recombination sites on the left and right arms of chromosome 3. This supplies 12 copies of each histone gene to rescue the ∆HisC deletion. (B) Stage of development at which lethality occurred due to replace all endogenous H3 with exogenous wild type or mutant H3 expressed from 12 transgenes.
Figure 4 with 2 supplements
H3 T118I, T118E and Aurora-A overexpression lead to premature loss of cohesion.
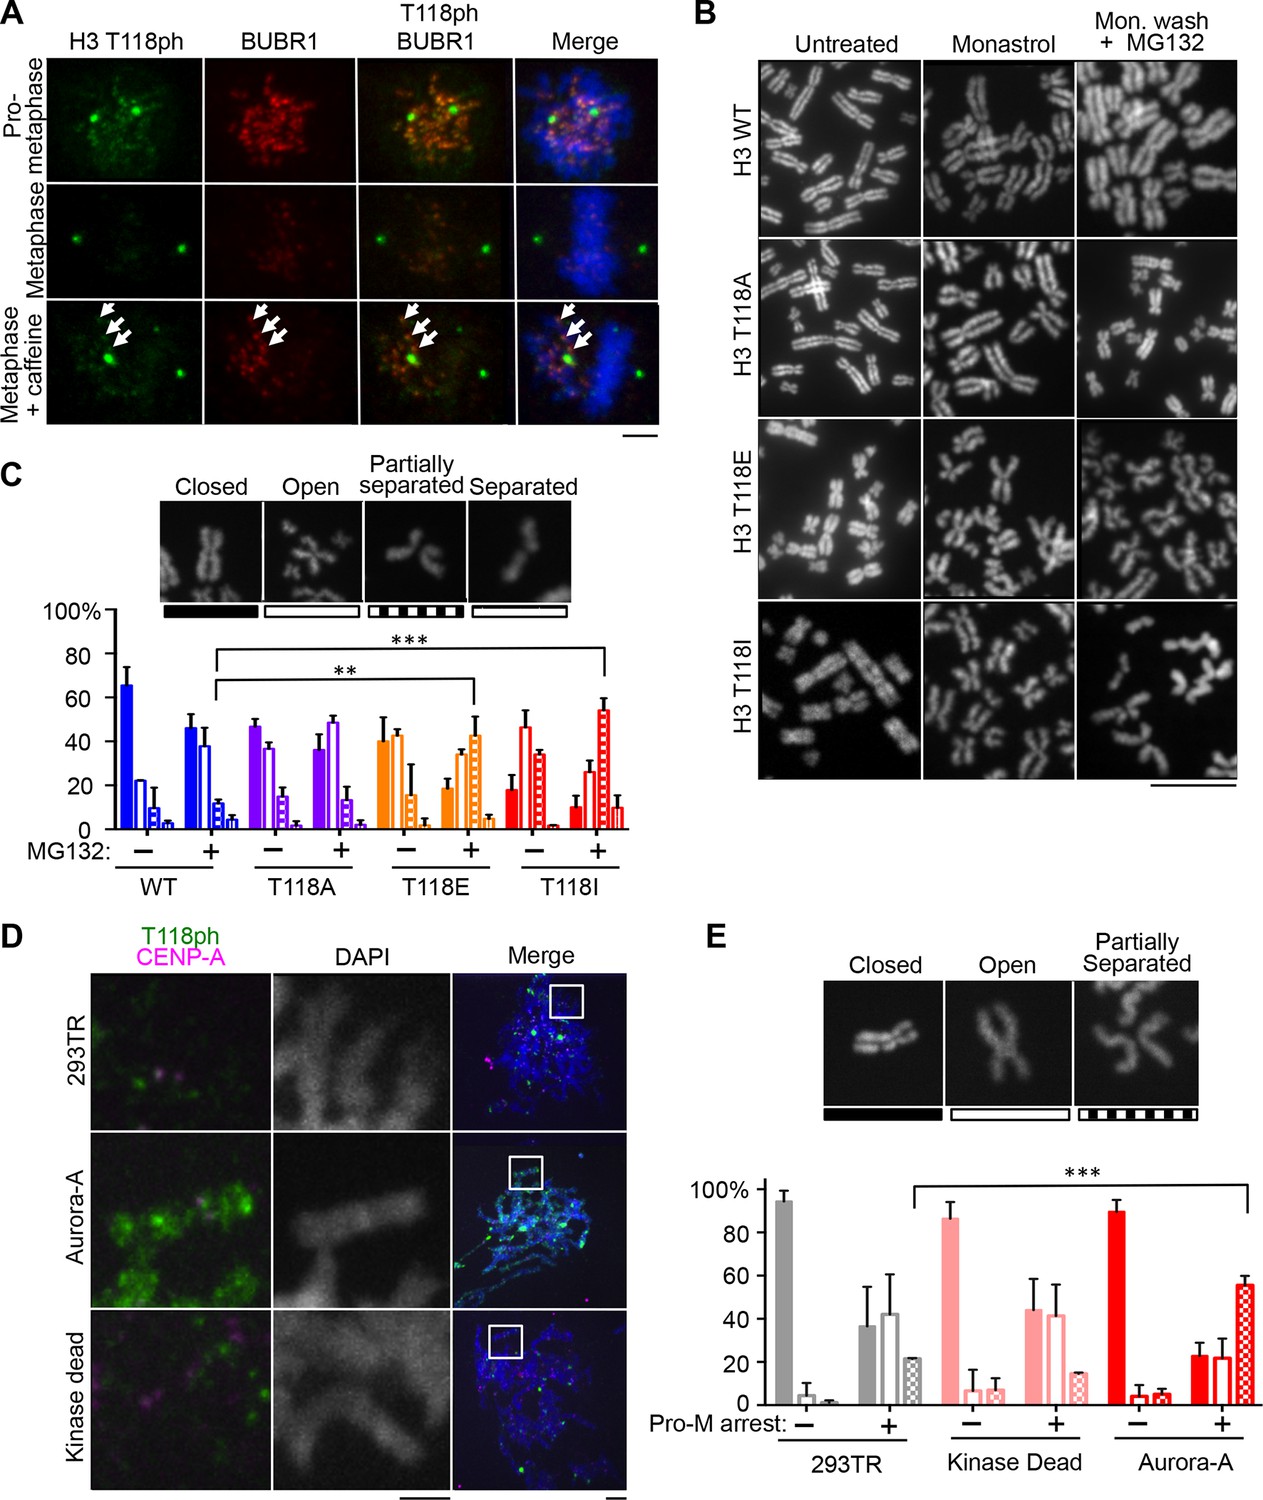
(A) Immunofluorescence of HeLa cells representing pro-metaphase (top panel), metaphase (middle panel) and caffeine-treated (bottom). The primary antibodies used were histone H3 T118ph (green), BubR1 (red) and DNA was stained with DAPI (blue). Scale bar = 5 μm. (B) Chromosome spreads of H3 T118 mutant cell lines following the error correction assay either untreated (left) or monastrol (middle) then released into MG132 (right). Scale bar = 5 μm. (C) The degree of cohesion loss for Monastrol (-) and Monastrol washout MG132 (+) treatments were scored from B. (n=100 cells per treatment collected over 3 experiments, **p<0.01 and ***p<0.001 by unpaired student t-test). Error bars represent the SDM. (D) Chromosome spreads of 293TR cell lines with over expression of Aurora-A or Aurora-A KD. The primary antibodies used were against CENP-A (magenta), H3 T118ph (green), and DNA was stained with DAPI (blue). Scale bar = 5 μm. (E) Quantitation of Fig. S4C colcemid pro-metaphase arrest (Pro-M). (n=100 cells per treatment, collected over 3 experiments ***p<0.001 by unpaired student t-test). Error bars represent the SDM.
Figure 4—figure supplement 1
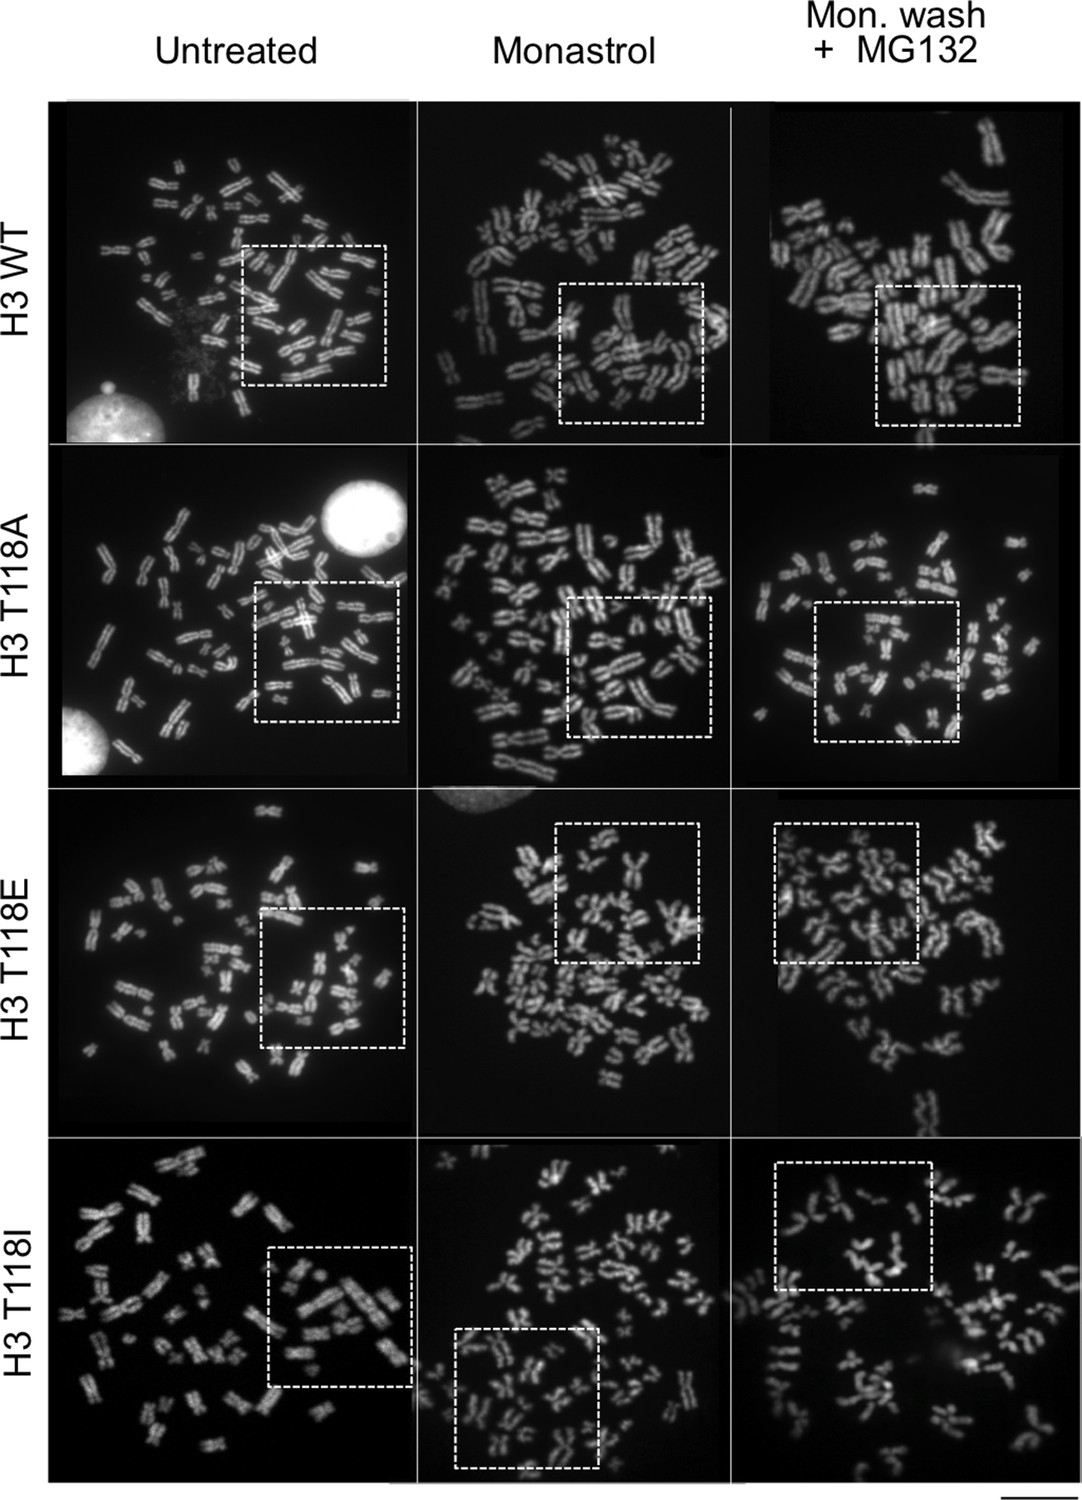
Metaphase spreads of 293TR stable cell lines expressing wild type H3 or mutant H3 proteins, to demonstrate cohesion defect upon prolonged pro-metaphase arrest.
The uncropped images of chromosome spreads in Figure 4B. The white boxes indicate the magnified image. Scale bar = 5 μm.
Figure 4—figure supplement 2
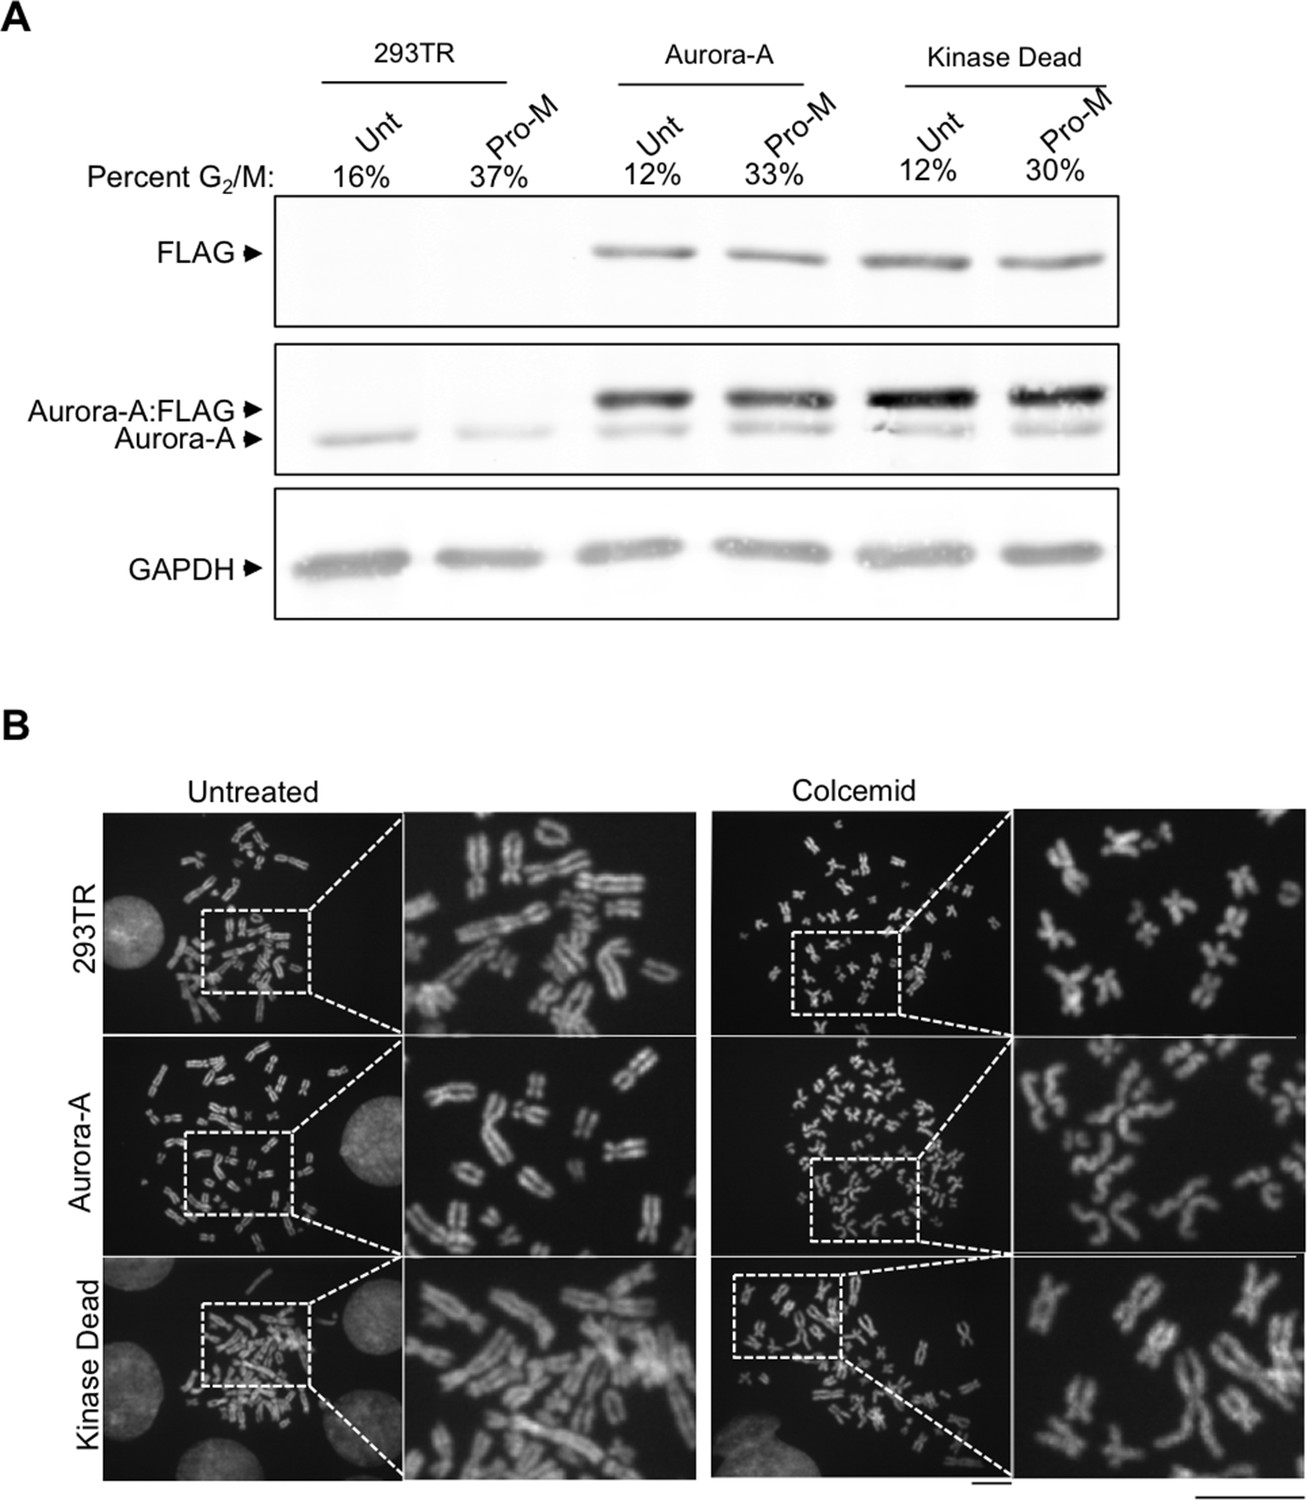
Characterization of 293TR stable cell lines expressing wild type Aurora-A:FLAG and Aurora-A Kinase Dead:FLAG.
(A) Demonstration of equivalent expression of exogenous Aurora-A and kinase dead Aurora-A. Total protein extracts from asynchronous and pro-metaphase (Pro-M) mitotically arrested 293TR, Aurora-A:FLAG, and Aurora-A KD:FLAG cells were resolved by SDS-PAGE and analyzed by western blot with antibodies to FLAG, Aurora-A, and GAPDH is used as a loading control. Samples were collected for flow cytometry analysis at the same time. The G2/M population is listed as a percentage of the mitotic population. (B) Aurora-A overexpression leads to cohesion defects. Representative chromosome spreads displaying cohesion defects for the control cell lines and overexpressed Aurora-A cell lines untreated (left), arrested with colcemid (right). DNA stained with DAPI (blue). Scale bar = 5 μm. The white boxes indicate the magnified image area. After mitotic shake-off to remove any cells in mitosis, cells were treated with colcemid and chromosome spreads were prepared.
Figure 5 with 2 supplements
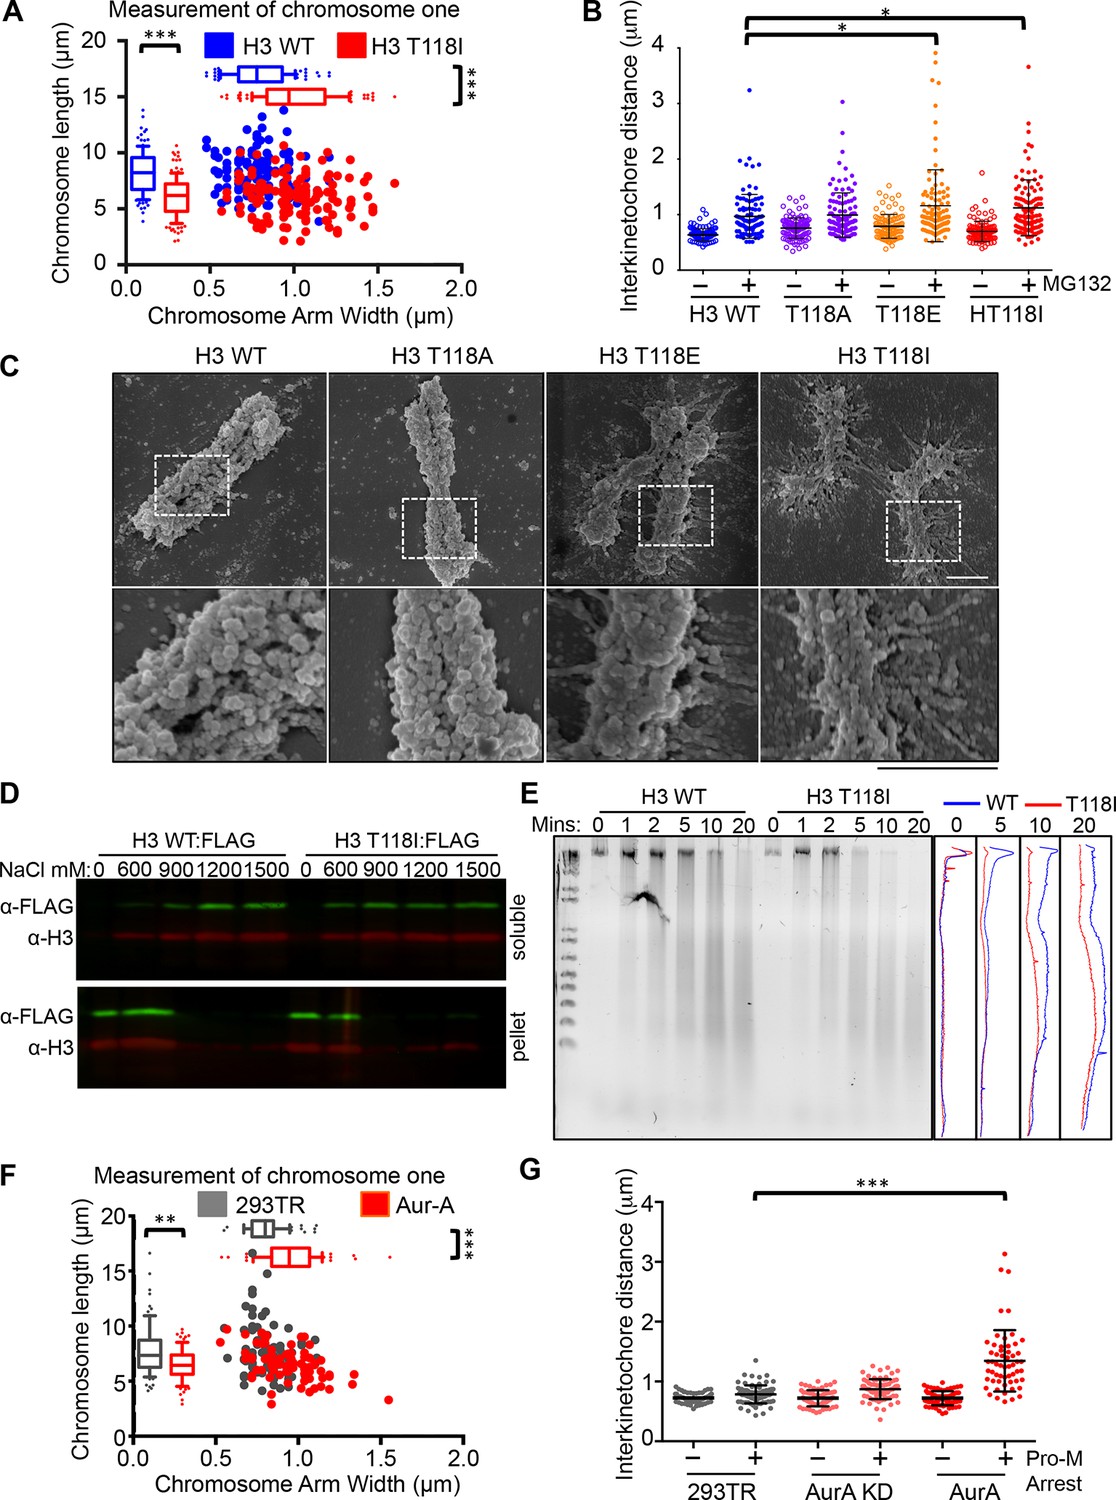
Altered chromosomal compaction due to H3 T118E, H3 T118I or overexpressing Aurora-A.
(A) Measurement of the width and length of chromosome one for over 50 chromatids for each H3 WT:FLAG and H3 T118I:FLAG stable cell lines (***p<0.001 by Wilcoxon rank sum test). (B) Interkinetochore distances for pairs of sister chromatids. N=100 centromeres from 5 mitotic chromosome spreads (*p<0.01 by student t-test). Error bars represent SD of the mean (SDM). (C) SEM images taken at 50 K and 100 K magnification upon prolonged mitotic arrest. Scale bar = 1 μm. (D) Western analysis of soluble (free histones) and pellet (chromatin) fractions following successive increasing concentration NaCl extractions. (E) Dnase-I digestion analysis on nocodazole arrested cells. Densitometric profiles are shown on the right. (F) As in A, comparing 293TR versus Aurora–A overexpressing cell lines for over 30 chromatids (***p<0.001 and **p<0.01 by Wilcoxon rank sum test). (G) As in B, comparing 293TR cell lines with over expression of Aurora-A or Aurora-A KD with and without colcemid arrest (Pro-M arrest, pro-metaphase arrest). N=50 centromeres from 5 mitotic spreads (***p<0.001 by student t-test). Error bars represent SDM.
Figure 5—figure supplement 1
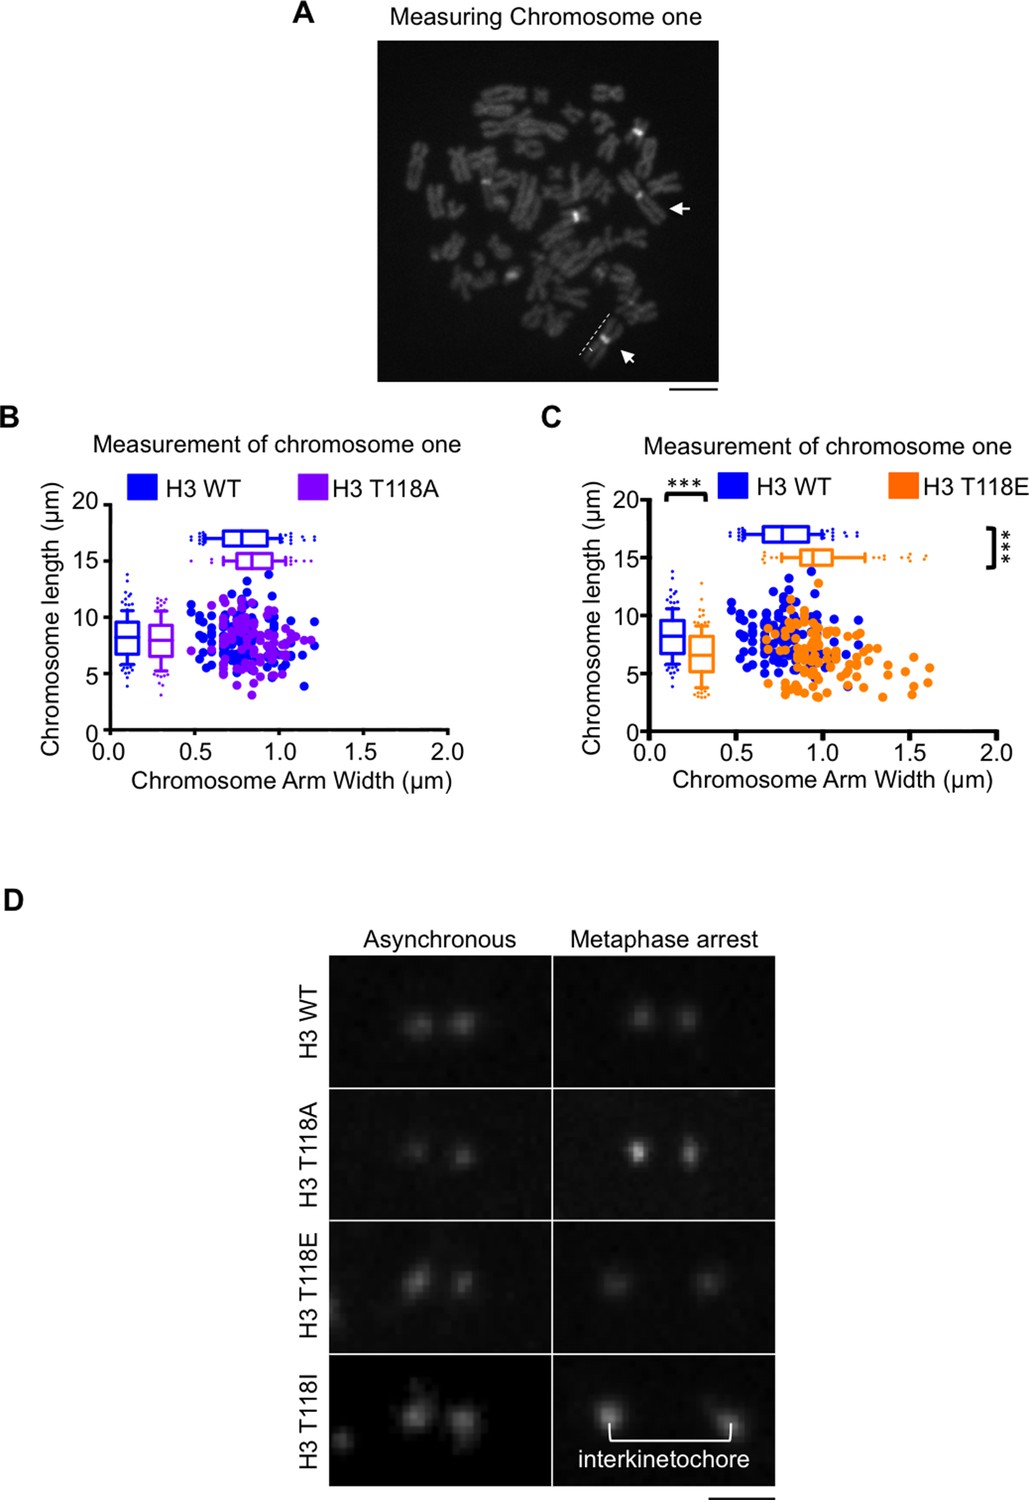
The interkinetochore distance becomes longer upon expression of T118I.
(A) Demonstration of how we measured chromosome 1 in metaphase spreads.Representative image of spread chromosomes treated with netropsin followed by DAPI staining. Arrows indicate characteristic heterochromatin of chromosome 1. Dashed lines exemplify the measurements taken of the telomere-to-telomere-length versus the width. Scale bar = 5 μm. (B) Packaging of chromosome 1 is unchanged by T118A. Chromosome one arm length was measured and plotted against the width of each chromatid for over 50 chromatids (***p<0.001 by Wilcoxon rank sum test). (C) Packaging of chromosome 1 is shortened and becomes wider by expression of H3 T118E. Chromosome one arm length was measured and plotted against the width of each chromatid for over 50 chromatids (***p<0.001 by Wilcoxon rank sum test). (D) The interkinetochore distance becomes longer upon expression of T118I. Representative interkinetochore distances are shown for individual centromeres of each stable cell line marked by CENP-A following a mitotic chromosome spread for asynchronous (left panels) and metaphase arrest (right panel). Scale bar = 1 μm.
Figure 5—figure supplement 2
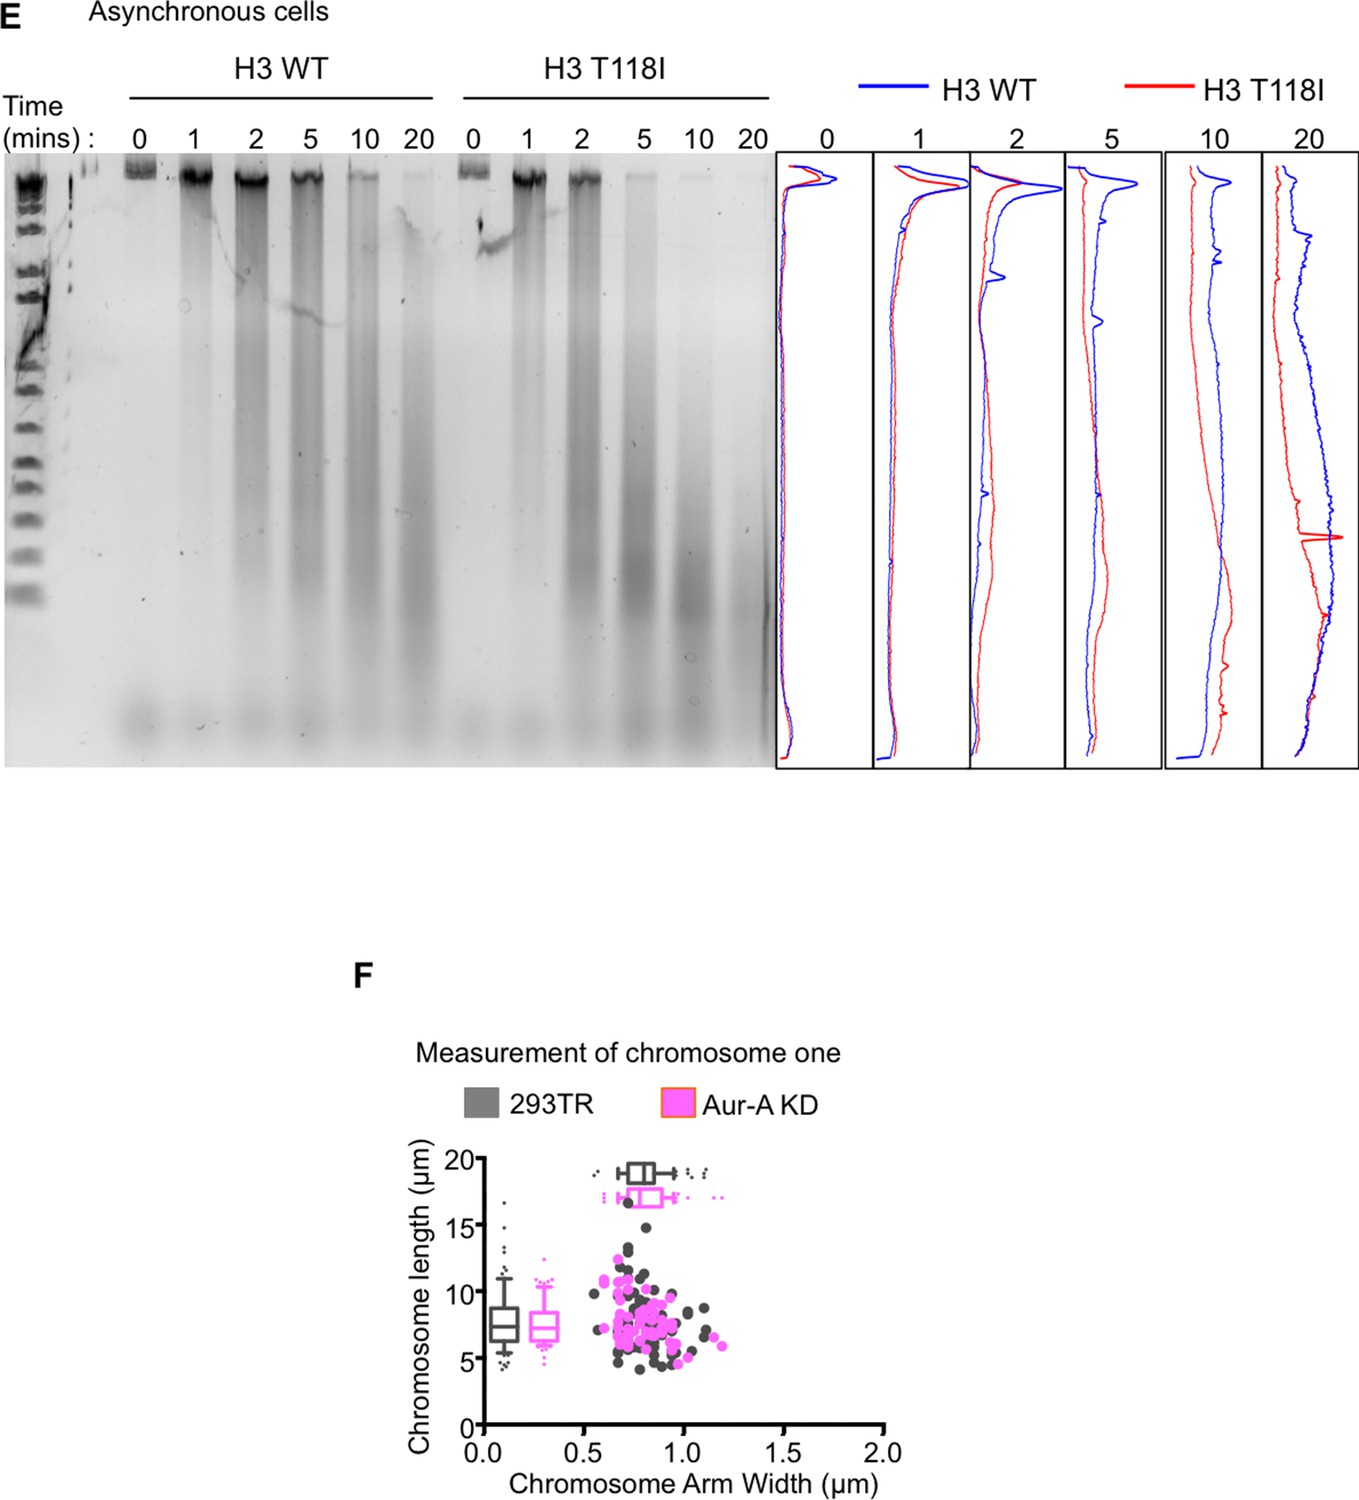
The Aurora-A kinase dead does not change the packaging of chromosome 1, as compared to expression of Aurora-A.
(A) H3 T118I makes chromatin more accessible to nuclease digestion. Analysis of the Dnase-I digestion products (time 0, 1 min, 2 min, 5 min, 10 min, 20 min) carried out on nuclei isolated from either asynchronous H3 WT:FLAG or H3 T118I:FLAG stable cell lines. Densitometric profiles of each time point of digestion products are shown H3 WT:FLAG (blue) or H3 T118I:FLAG (red). (B) The Aurora-A kinase dead does not change the packaging of chromosome 1, as compared to expression of Aurora-A (Figure 5). As in Figure 5 – figure supplement B,C. Analysis was of over 30 chromatids for the 293TR versus Aurora-A KD:FLAG stable cell line.
Figure 6 with 1 supplement
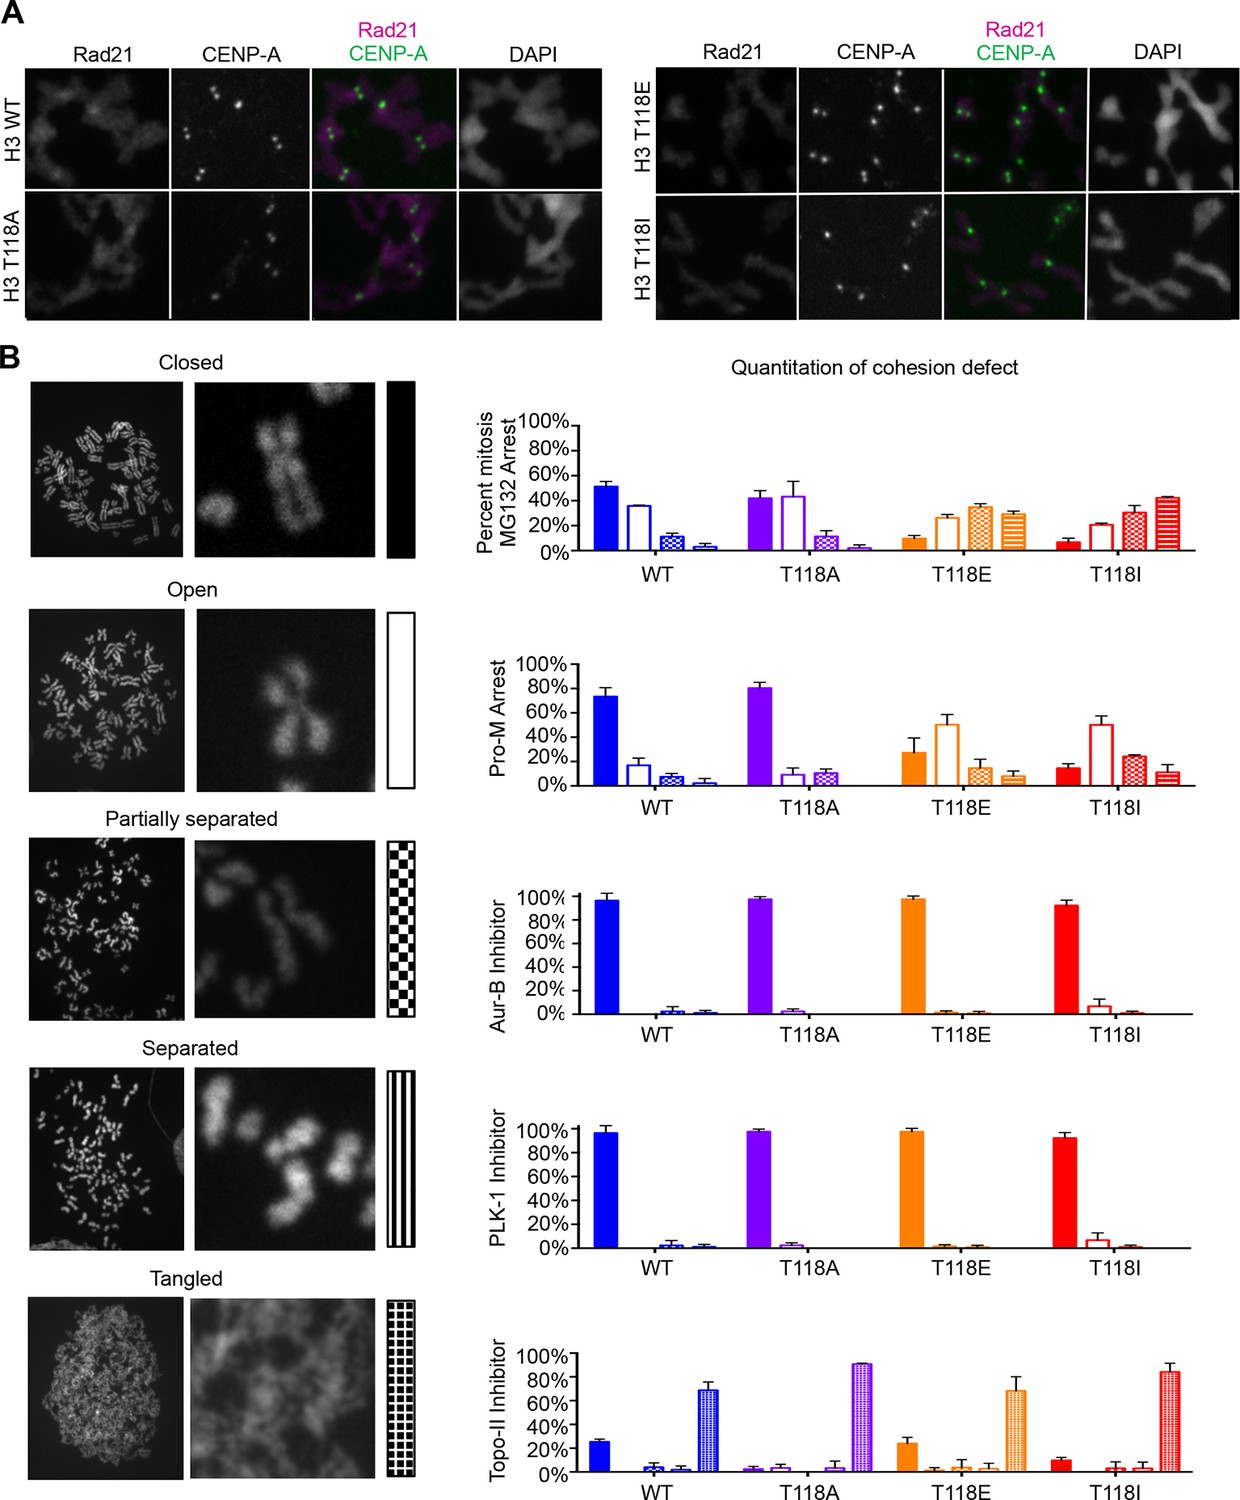
Premature cohesion loss in the phosphomimetic and SIN mutants is independent of separase activity, but dependent on proper centromere tension.
(A) Mitotic spreads following the error correction assay. The primary antibodies used were against Rad21, cohesion subunit (magenta), CENP-A (green), and DNA was stained with DAPI (blue). Scale bar = 5 μm. (B) Quantitation of the degree of cohesion loss for H3:FLAG stable cell lines, upon proteasome inhibition with MG132, treatment with colcemid, Aurora-B (hesperidin), Plk-1 (BI-2536), and Topo-II (ICRF-193) inhibitors for 3 hr was scored (n=75 cells, per treatment collected over 3 experiments). Insets show representative chromosomes for each type of defect: closed, open, partially separated, separated or tangled.
Figure 6—figure supplement 1
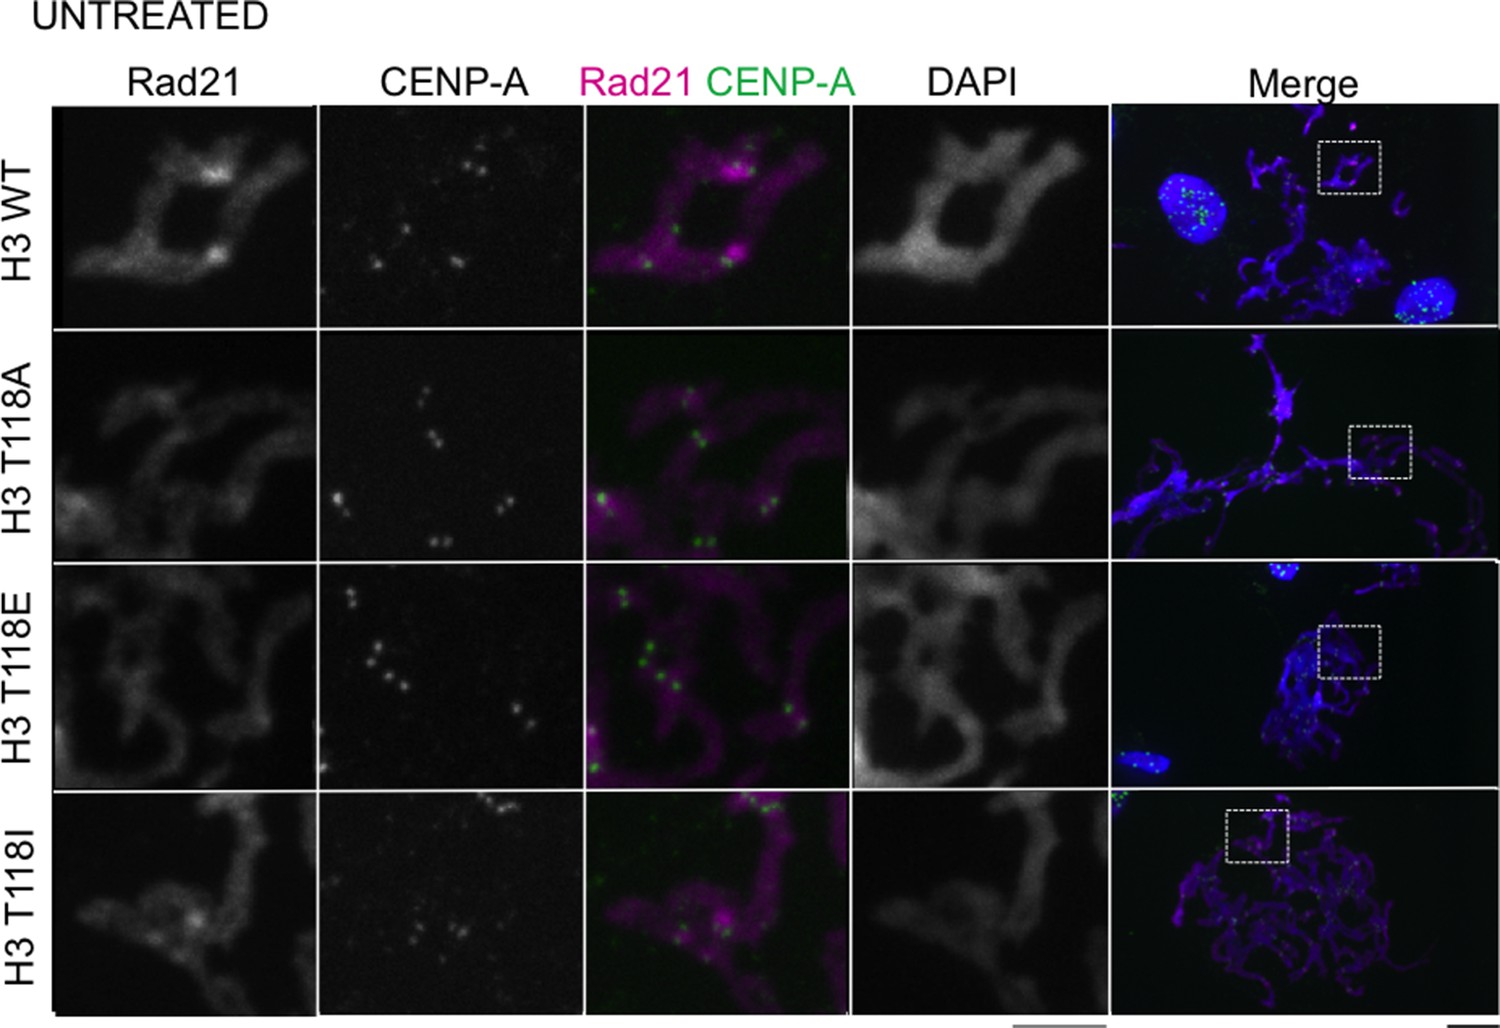
Stable cell lines expressing H3 T118 mutants do not alter Rad21 staining in an asynchronous cell population.
Mitotic spreads of an asynchronous cell population from each H3:FLAG stable cell line were subjected to indirect immunofluorescence. The primary antibodies used were Rad21 (magenta), CENP-A (green). DNA was stained with DAPI (blue). The white boxes indicate the magnified image area. Scale bars = 5 μm.
Figure 7 with 4 supplements
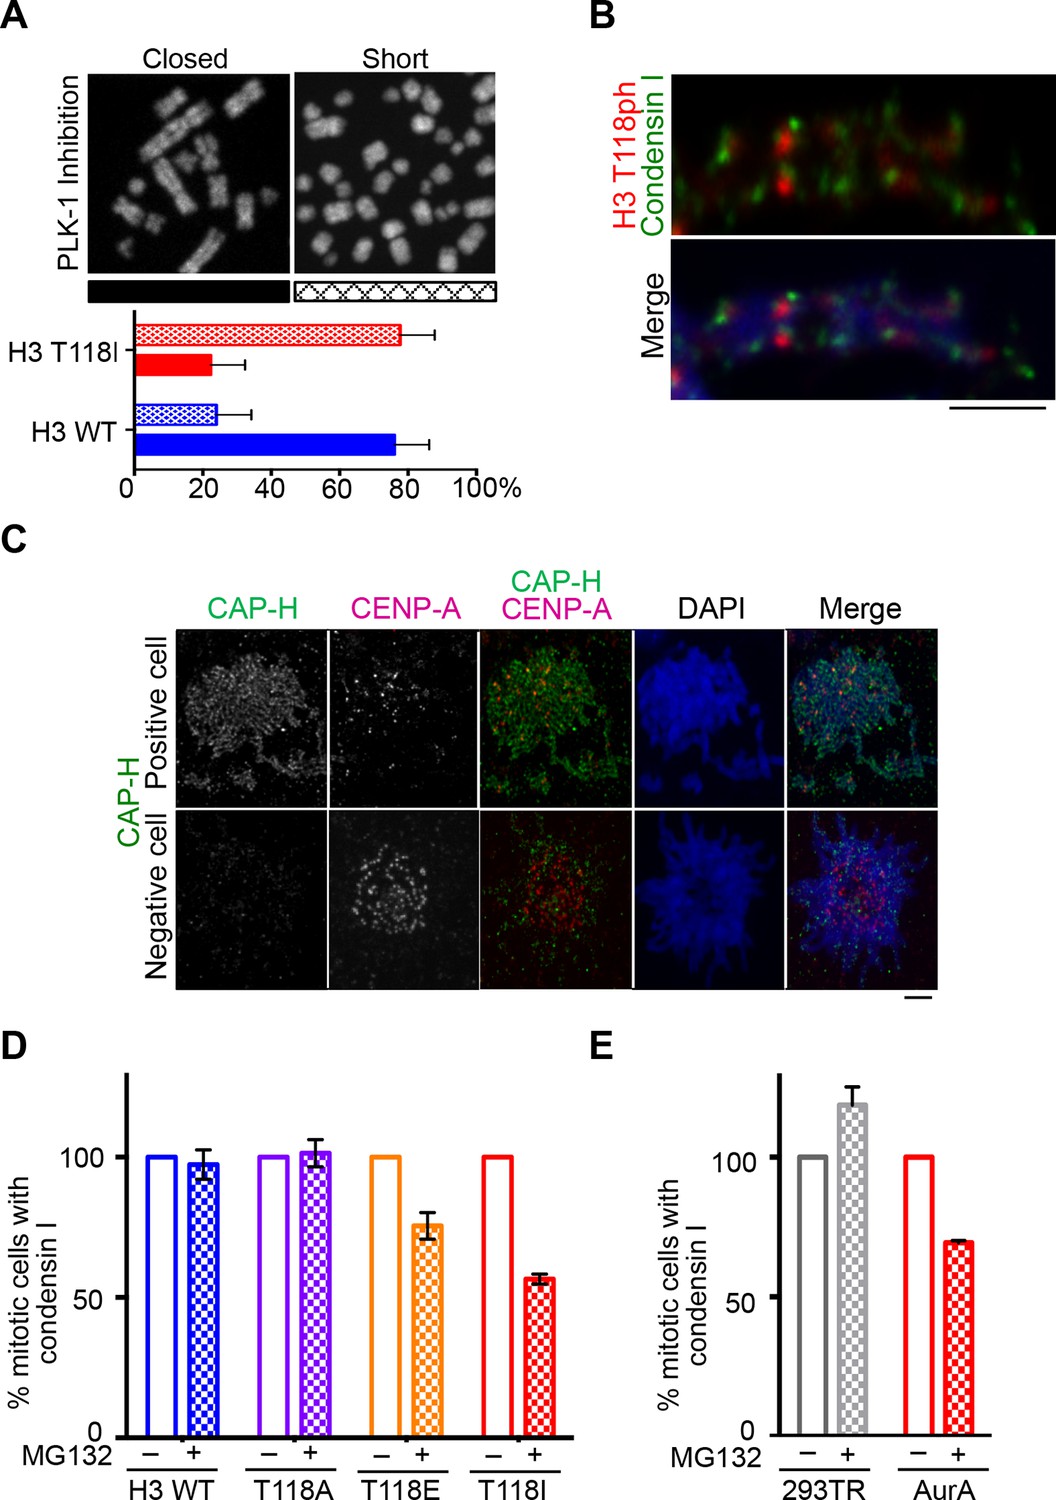
Reduced condensin I association with chromatin due to H3 T118E and T118I.
(A) Chromosome spreads upon PLK-1 inhibition and quantitation of the degree of cohesion loss for H3: WT:FLAG and H3 T118I:FLAG stable cell line. Insets show representative chromosomes for each type of defect: closed and short. (n=50 cells). Scale bar = 5 μm. (B) Extended chromatin fibers from 293TR CAP-H:tGFP cells. Scale bar = 2 μm. The primary antibodies used were against tGFP (green), H3 T118ph (red), and DNA was stained with DAPI (blue). (C) Representative mitotic spreads for condensin I (CAP-H:tGFP) positive and tGFP negative cell. The primary antibodies used were against tGFP (green), CENP-A (red), and DNA was stained with DAPI (blue). Scale bar = 5 μm. (D) Quantitation of number of cells with positive condensin I (CAP-H:tGFP) for mutant H3 stable cell lines treatment without Monastrol (-) and Monastrol washout followed by MG132 (+) treatments. SDM is for three independent experiments (n=100 per treatment). (E) As in D, quantitation using 293TR and Aurora-A overexpressing cell line from over 50 mitotic spreads in each condition. Error bars are SDM.
Figure 7—figure supplement 1
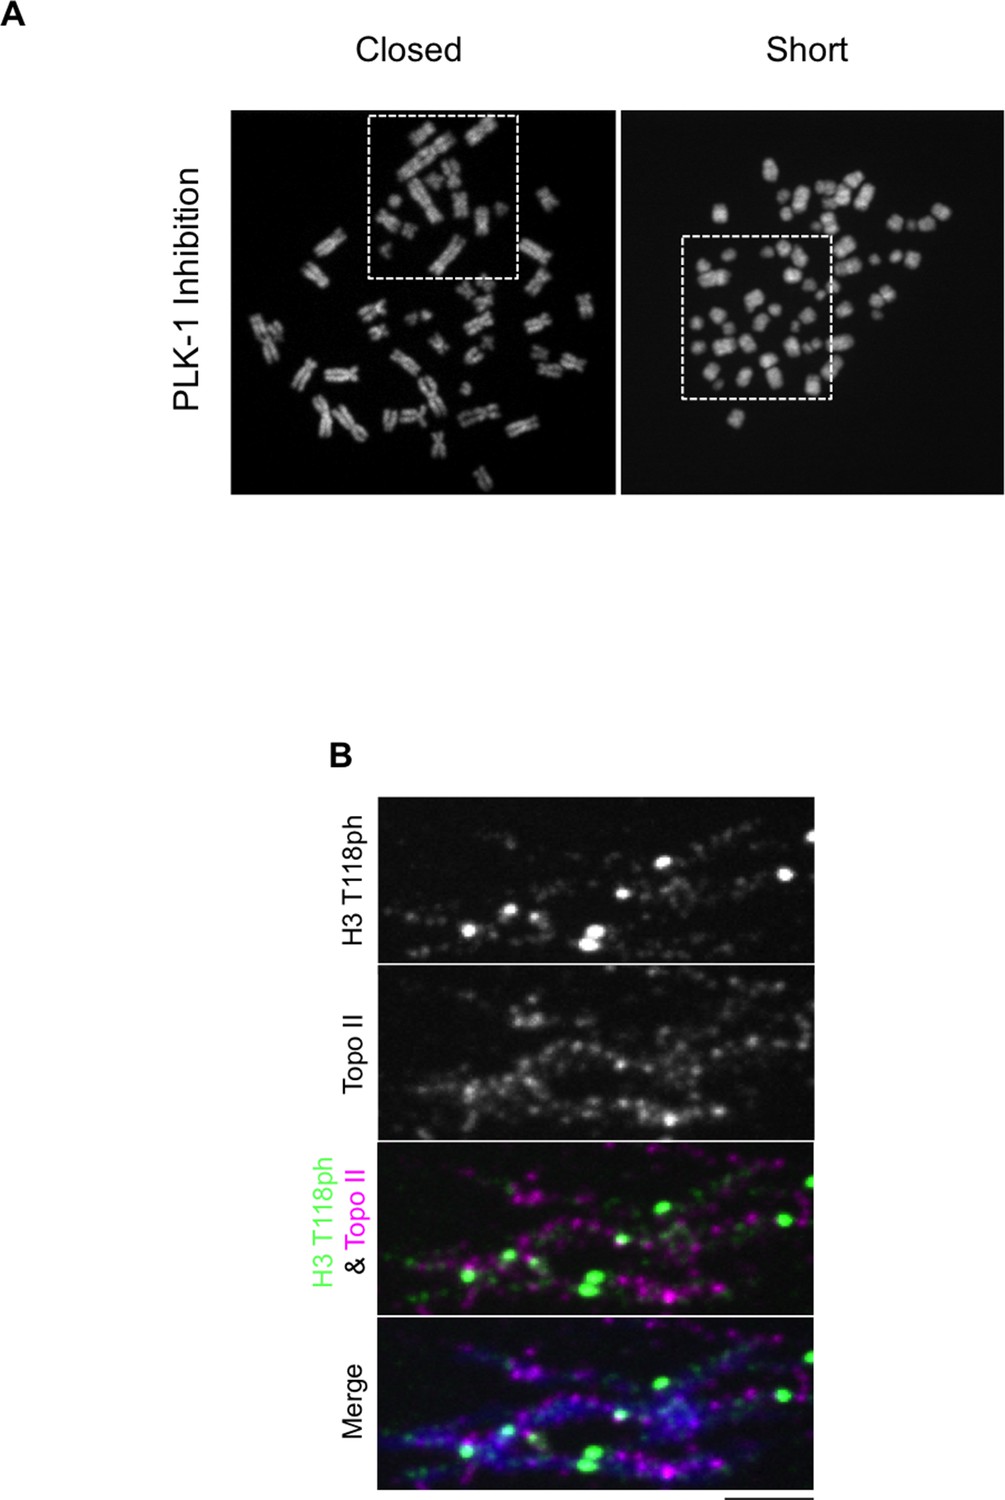
Topoisomerase II and H3 T118ph display different localization patterns along chromatin fibers.
(A) PLK-1 inhibition leads to very short chromosomes. The un-cropped images of chromosome spreads in Figure 7B are shown. The white boxes indicate the magnified image. (B) Topoisomerase II and H3 T118ph display different localization patterns along chromatin fibers. Extended chromatin fibers were isolated from HeLa cells released for 30 min from a G2 arrest. Cells were stained with primary antibodies to H3 T118ph (green) and costained with Topo II (magenta). DNA is stained with DAPI (blue). Scale bar = 5 μm.
Figure 7—figure supplement 2
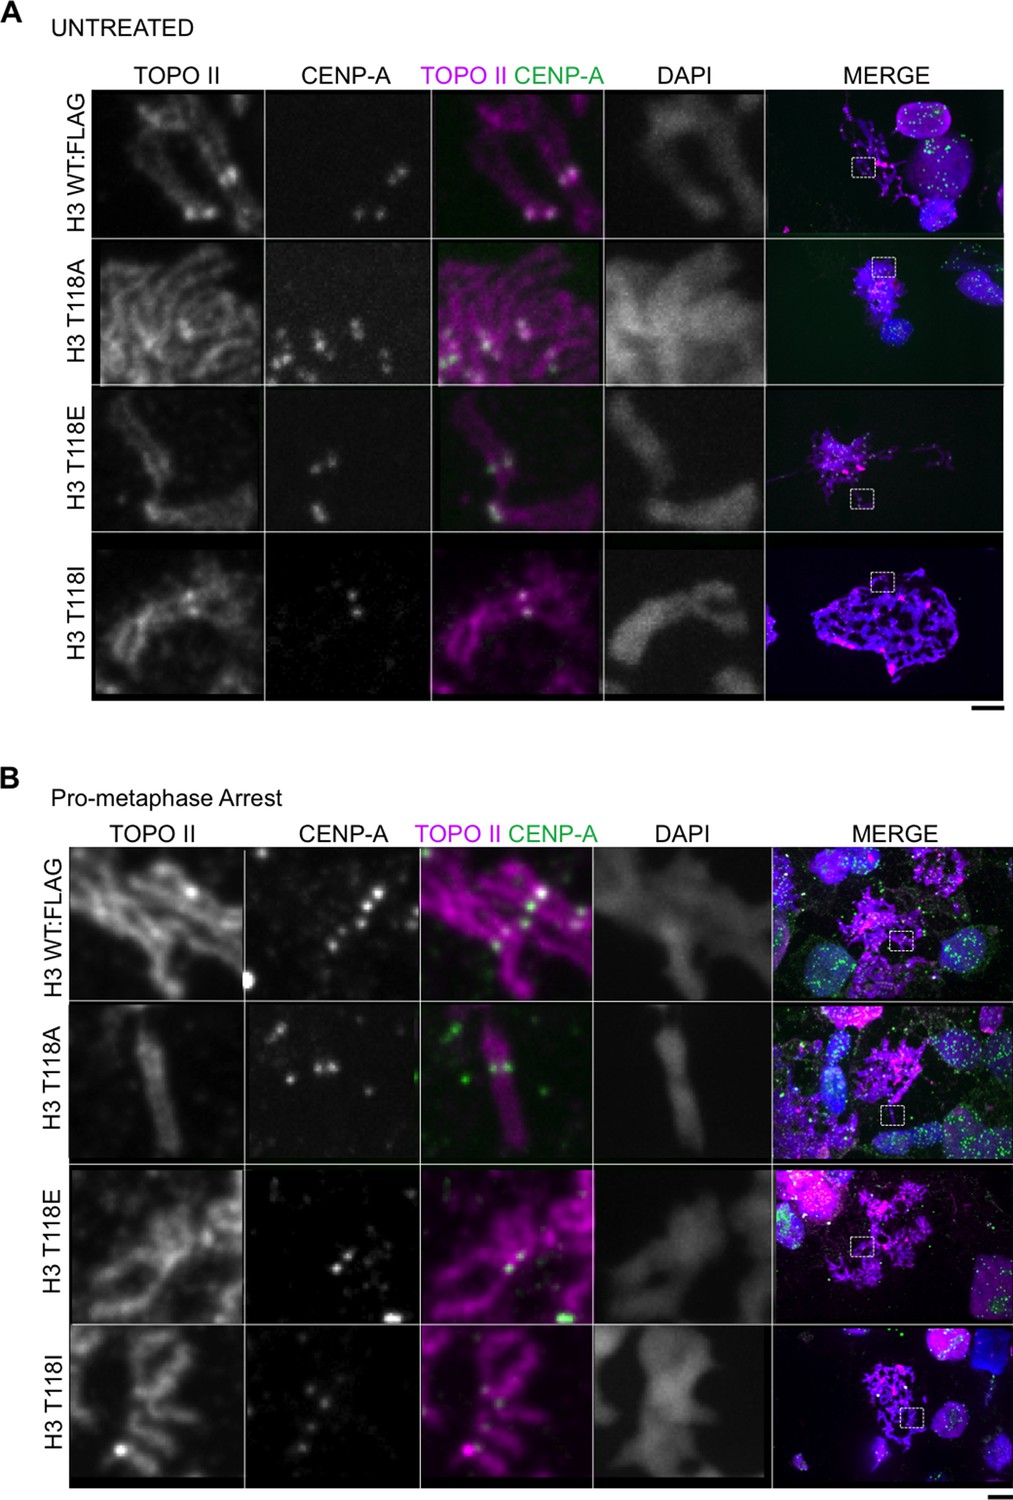
Topoisomerase II and its levels are unaltered in chromatin from cell lines expressiong H3 WT:FLAG, H3 T118A:FLAG, H3 T118E:FLAG and H3 T118:FLAG.
(A) Topoisomerase II and its levels are unaltered on chromatin from cell lines expressing H3 WT:FLAG, H3 T118A:FLAG, H3 T118E:FLAG and H3 T118I:FLAG. Representative mitotic spreads are shown from asynchronous cultures. The primary antibodies used were against Topo II (magenta), CENP-A (green), and DNA was stained with DAPI (blue). White box indicates magnified image area. Scale bar = 5 μm. (B) Topoisomerase II and its levels are unaltered on chromatin from cell lines expressing H3 WT:FLAG, H3 T118A:FLAG, H3 T118E:FLAG and H3 T118I:FLAG upon pro-metaphase arrest. Representative mitotic spreads are shown. The arrest was established via the error correction assay method from each H3:FLAG stable cell line.
Figure 7—figure supplement 3
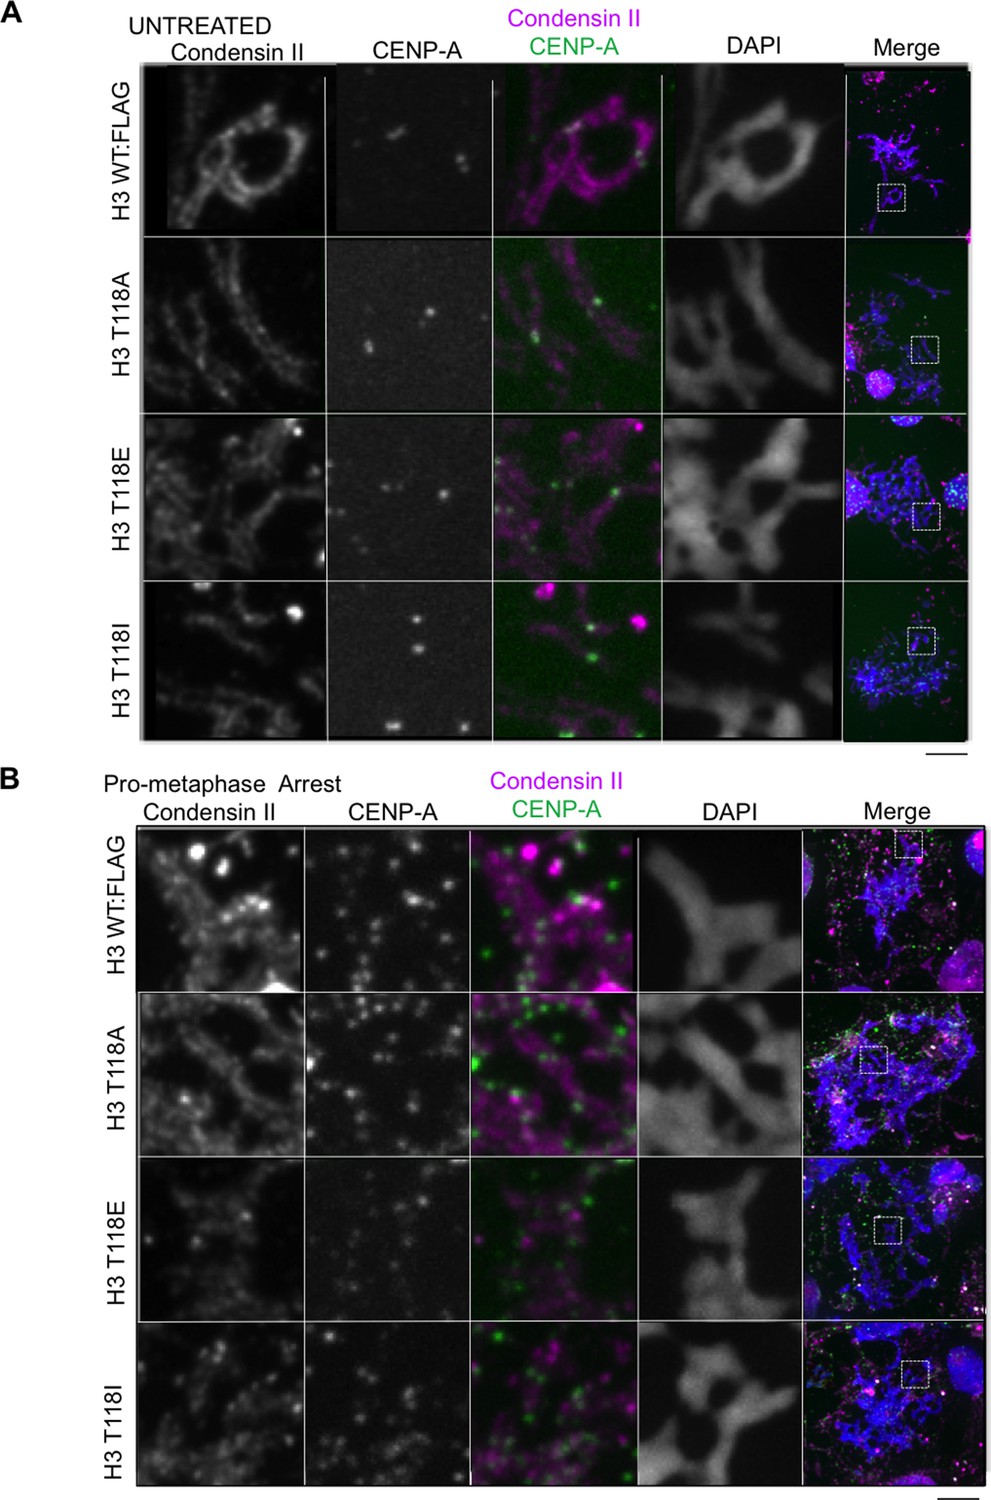
Condensin II and its levels are unaltered on chromatin from cell lines expressing H3 WT:FLAG, H3 T118A:FLAG, H3 T118E:FLAG and H3 T118I:FLAG
(A) Condensin II and its levels are unaltered on chromatin from cell lines expressing H3 WT:FLAG, H3 T118A:FLAG, H3 T118E:FLAG and H3 T118I:FLAG in asynchronous cultures. Representative mitotic spreads are shown. The primary antibodies used were CapD3 (condensin II subunit) (magenta) and CENP-A (green). DNA is marked by DAPI (blue). The white boxes indicate the magnified image area. Scale bar = 5 μm. (B) Condensin II and its levels are unaltered on chromatin from cell lines expressing H3 WT:FLAG, H3 T118A:FLAG, H3 T118E:FLAG and H3 T118I:FLAG upon pro-metaphase arrest. Representative mitotic spreads are shown. The arrest was established via the error correction assay method from each H3:FLAG stable cell line.
Figure 7—figure supplement 4
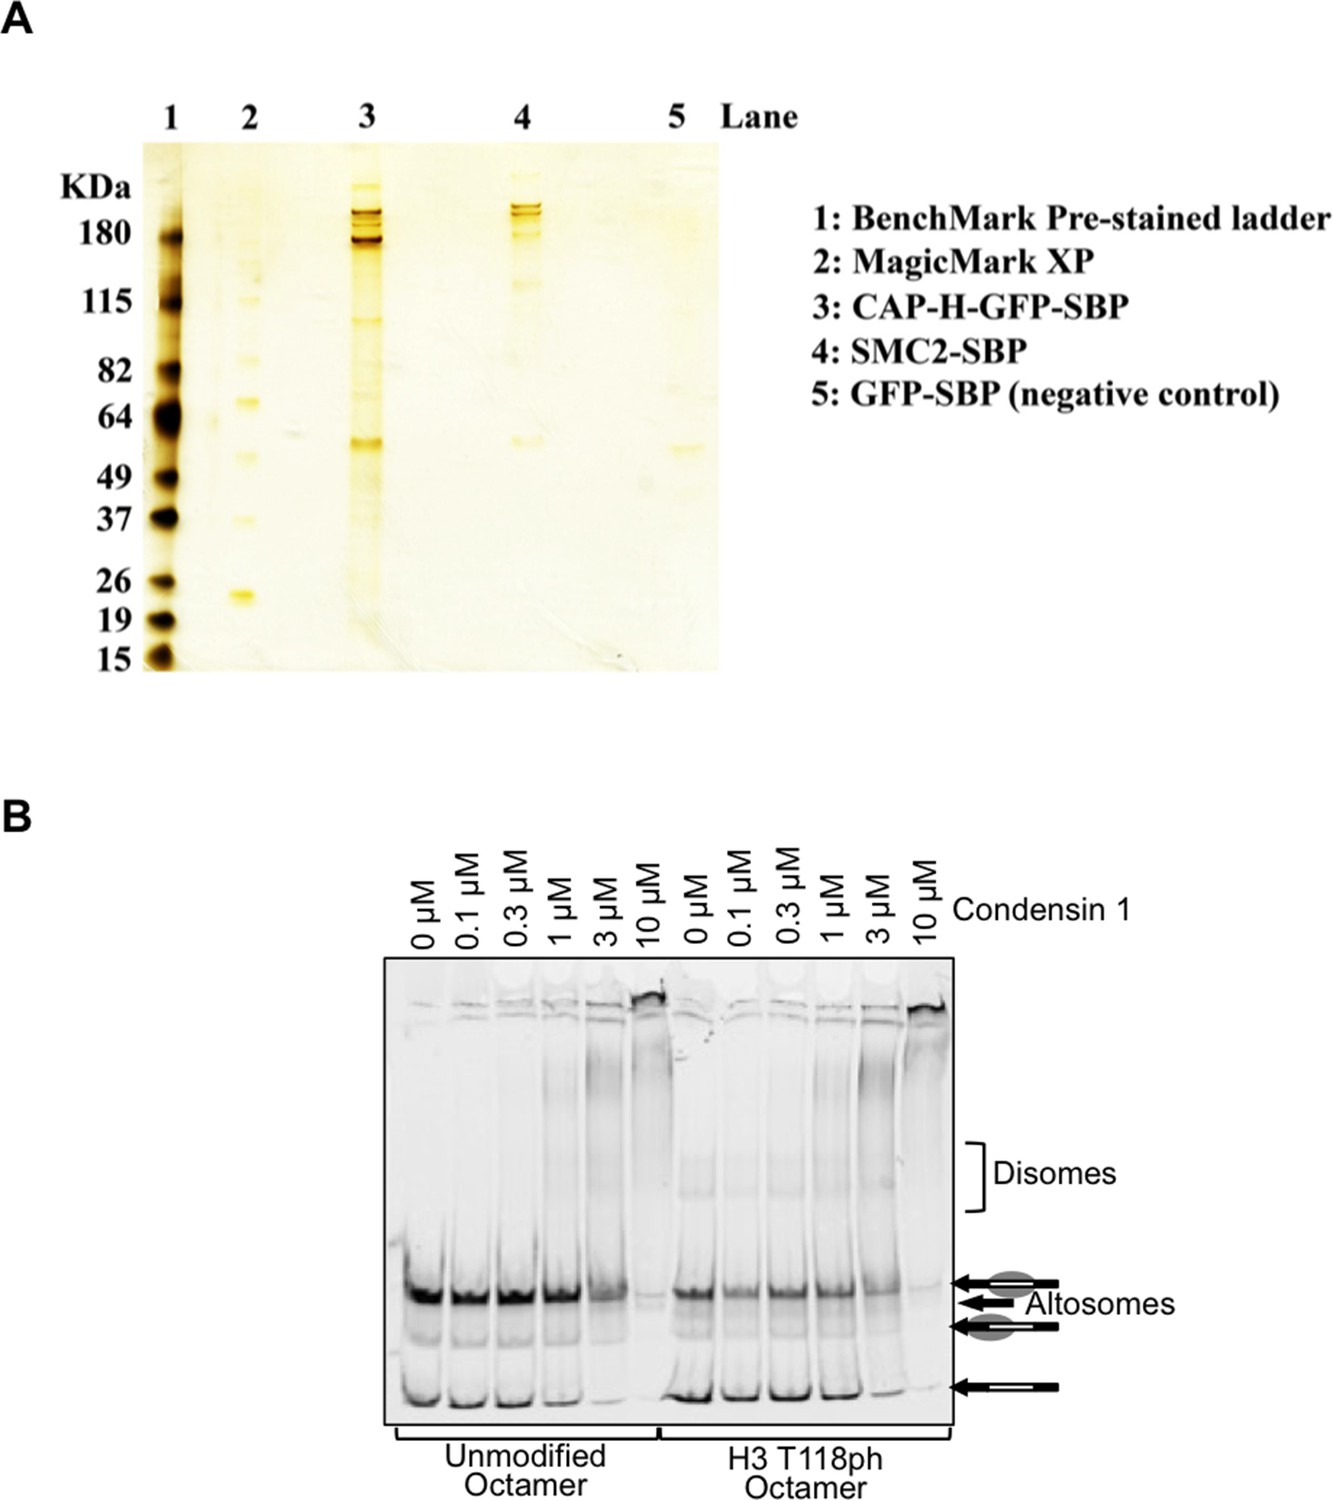
The binding of Condensin I to nucleosomes is not affected by H3 T118 mutations.
(A) Purified Condensin I. Silver stain analysis of Streptavidin-Binding Peptide (SBP) tagged SMC2 and CAP-H GFP isolated from chicken DT40 mitotically arrested cells. (B) The binding of Condensin I to nucleosomes is not affected by H3 T118 mutations. Binding of condensin I to unmodified or H3 T118ph histone octamers reconstituted onto cy5 labeled 247 bp DNA.
Figure 8
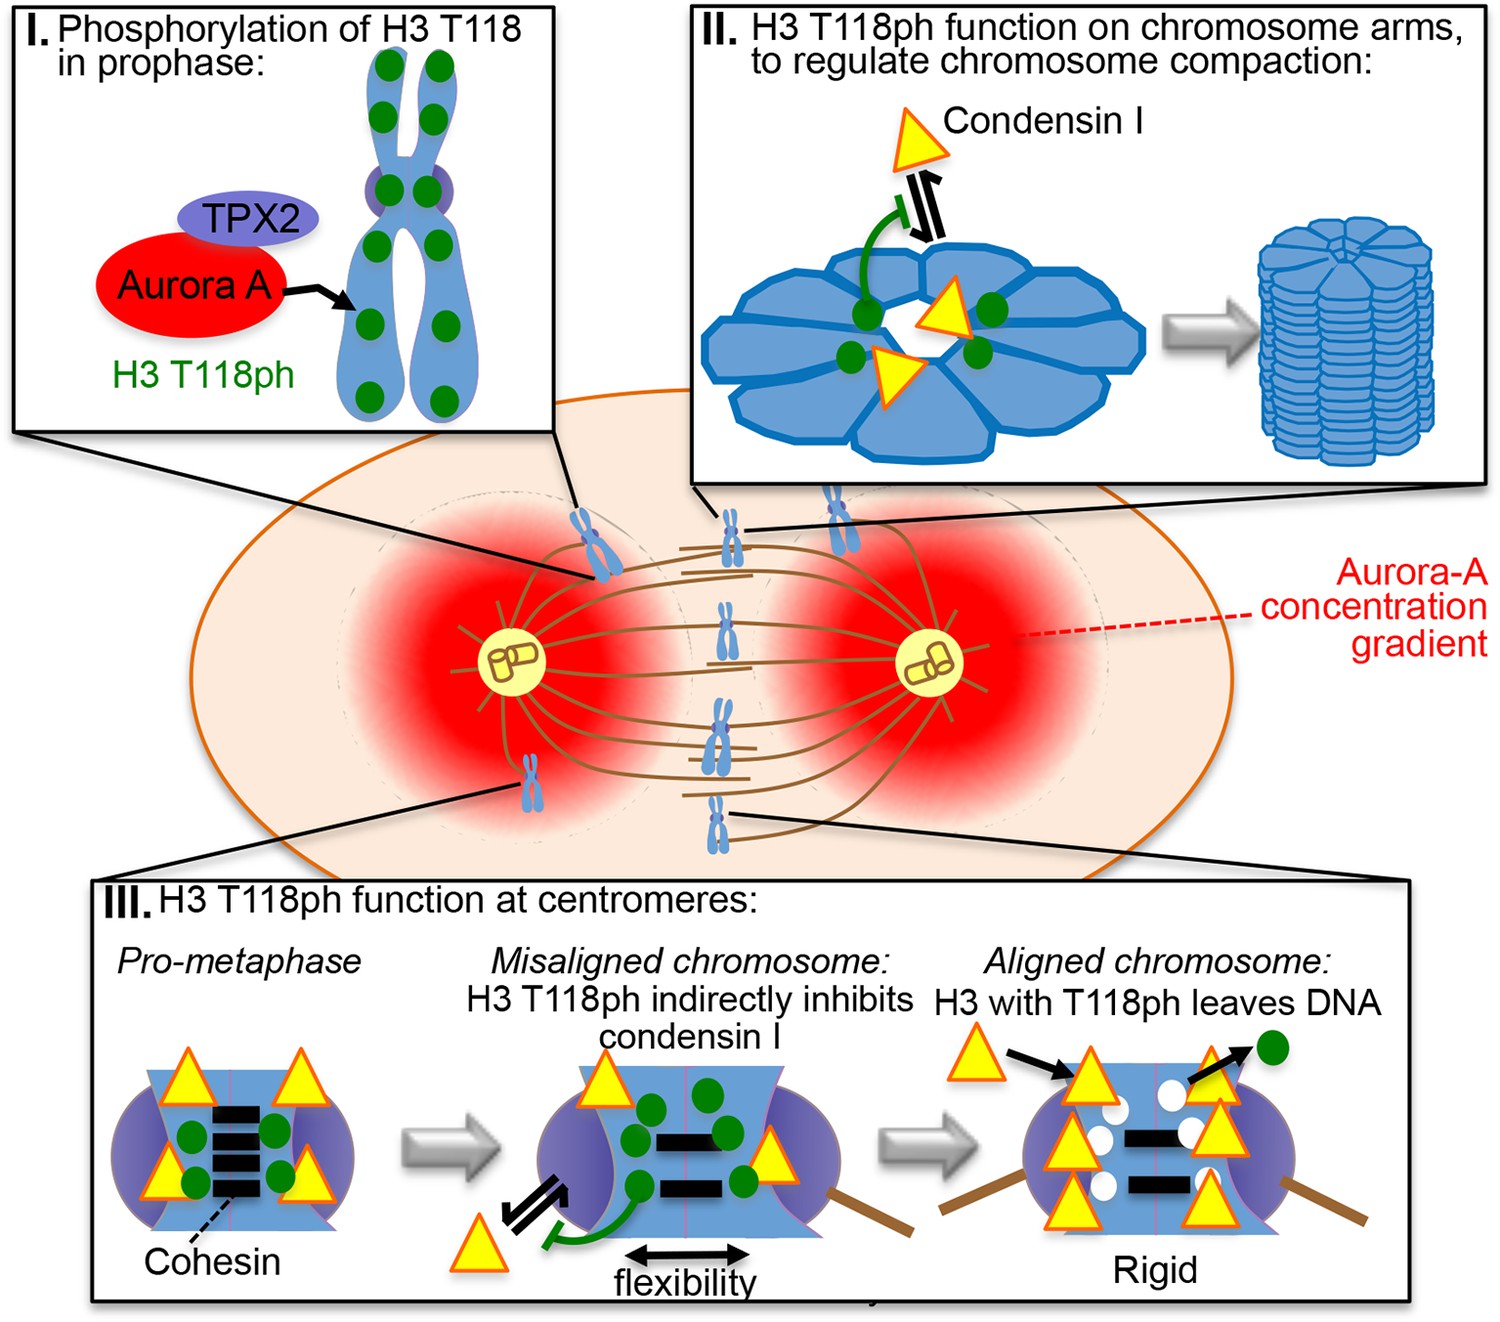
Model for the functions of H3 T118ph as explained in the text.
https://doi.org/10.7554/eLife.11402.026
Author response image 1
Download links
A two-part list of links to download the article, or parts of the article, in various formats.
Downloads (link to download the article as PDF)
Open citations (links to open the citations from this article in various online reference manager services)
Cite this article (links to download the citations from this article in formats compatible with various reference manager tools)
Aurora-A mediated histone H3 phosphorylation of threonine 118 controls condensin I and cohesin occupancy in mitosis
eLife 5:e11402.
https://doi.org/10.7554/eLife.11402


