The cation channel TRPA1 tunes mosquito thermotaxis to host temperatures
- The Rockefeller University, United States
- Howard Hughes Medical Institute, The Rockefeller University, United States
Figures
Figure 1 with 1 supplement
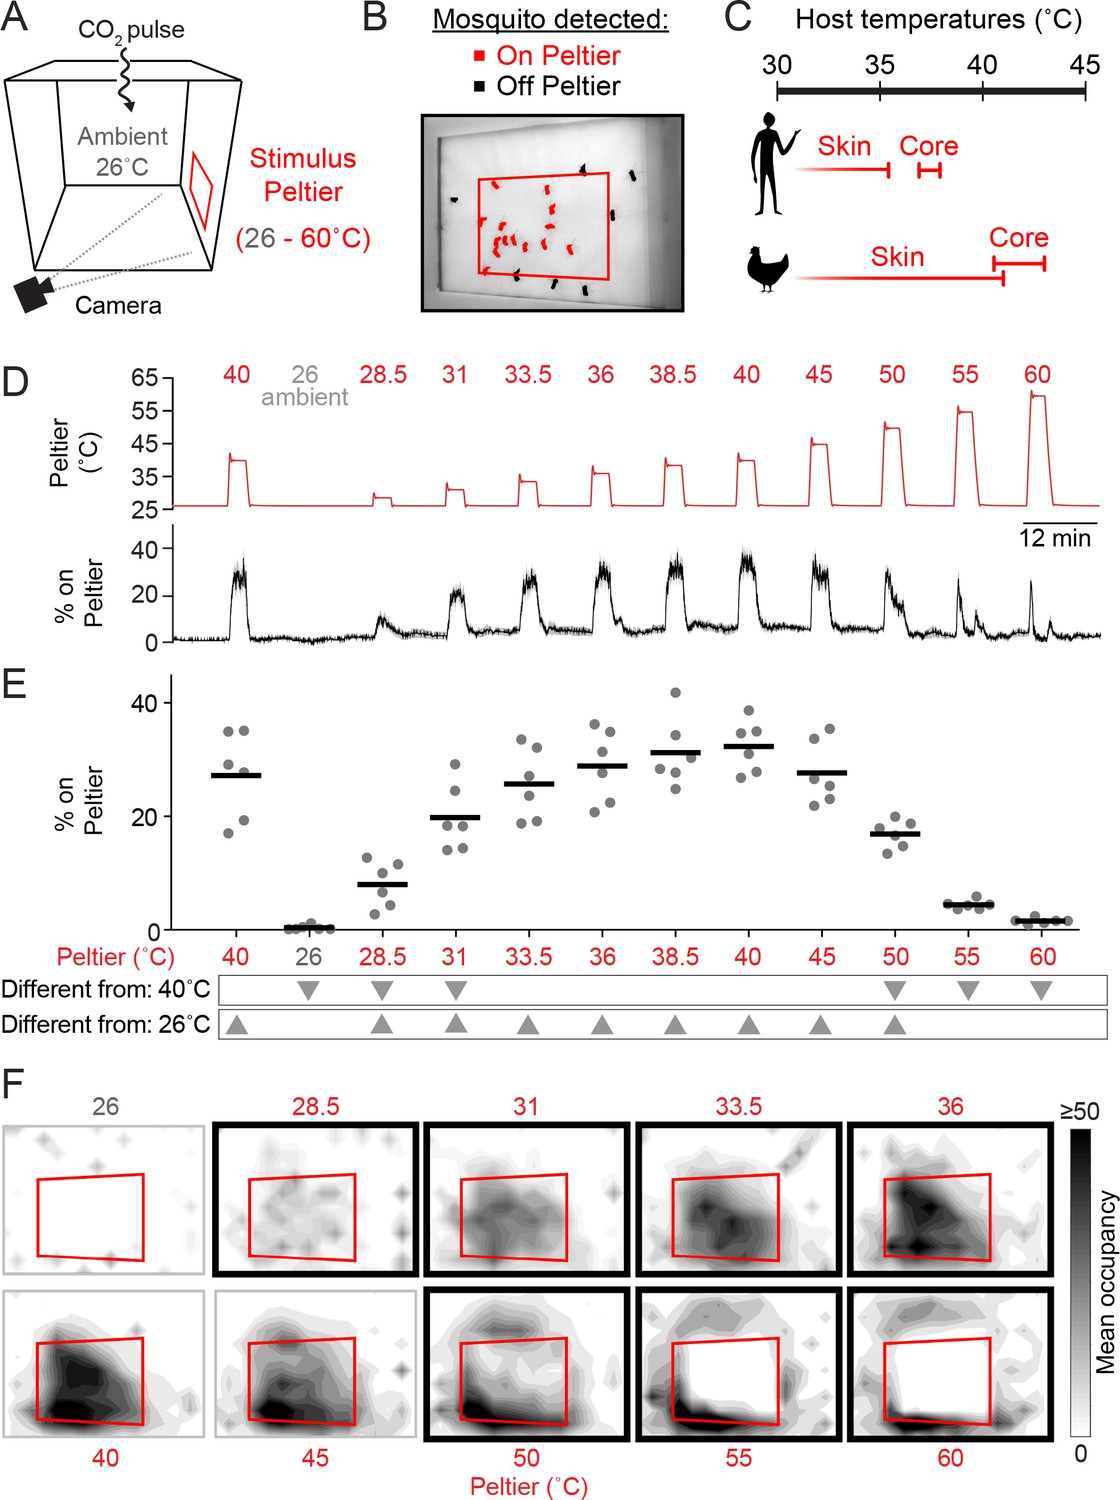
Mosquitoes thermotax to stimuli approximating host body temperature.
(A) Schematic of heat-seeking assay enclosure (30 × 30 × 30 cm). (B) Representative experimental image showing mosquitoes detected on and near the Peltier (red square). (C) Typical skin and core temperatures of Ae. aegypti hosts, humans and chickens (Richards, 1971; Yao, et al., 2008. (D–F) Heat-seeking behavior measured for a range of stimuli from 26 to 60°C (n = 6 trials per condition). Peltier temperature measured by thermocouple (D, top trace, mean in red, s.e.m. in gray) and percent of mosquitoes on Peltier (D, bottom trace, mean in black, s.e.m. in gray). We note that variance in both traces is low, making s.e.m. traces difficult to see. (E) Percent mosquitoes on Peltier during seconds 90–180 of each stimulus period in (D). Each replicate is indicated by a dot, and mean by a line. Arrowheads indicate significant differences (p < 0.05) from the second presentation of the 40°C stimulus or from 26°C (repeated measures one-way ANOVA with Bonferroni correction). (F) Heat maps showing mean mosquito occupancy on the Peltier (red square) and surrounding area, during seconds 90–180 of each stimulus period in (D). Bold borders indicate stimuli with responses significantly different from 26°C stimulus (top row) or 40°C stimulus (bottom row) in (E) (p < 0.05; repeated-measures ANOVA with Bonferroni correction).
Figure 1—figure supplement 1

Mosquitoes consistently thermotax to repeated 40°C stimuli.
(A) Peltier temperature measured by thermocouple (top trace, mean in red, s.e.m. in gray) and percent of mosquitoes on Peltier (bottom trace, mean in black, s.e.m. in gray). n = 10 trials. We note that variance in both traces is low, making s.e.m. traces difficult to see. (B) Percent mosquitoes on Peltier during seconds 90–180 of each stimulus period in (A). Each replicate is indicated by a dot, and the mean by a line. There is no significant difference (p > 0.05) in Peltier occupancy between the first and last stimulus (repeated measures one-way ANOVA with Bonferroni correction).
Figure 2 with 1 supplement
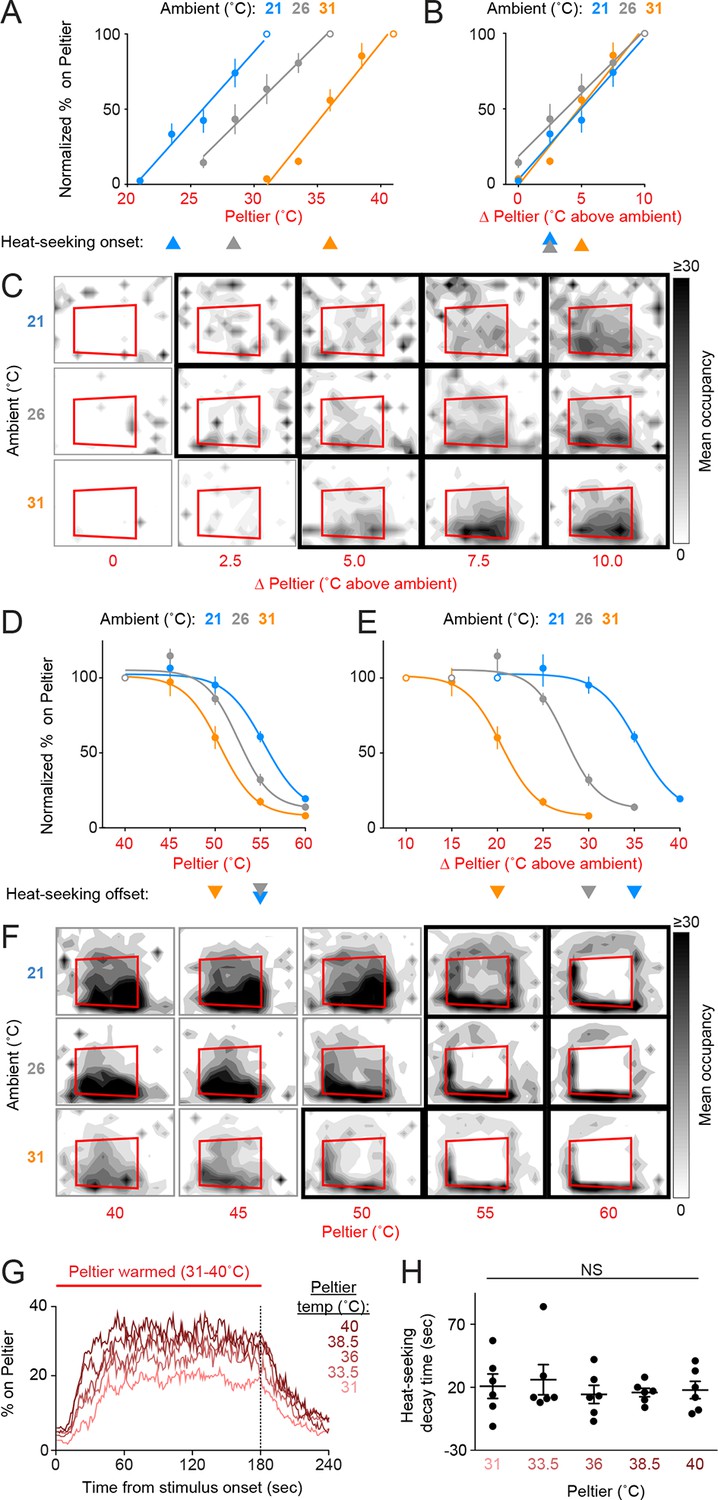
Mosquitoes thermotax to relative warmth and avoid both relative cooling and stimuli exceeding host body temperature.
(A–F) Heat-seeking at different ambient temperatures (n = 5–6 trials per condition): 21°C (blue), 26°C (gray), 31°C (orange). Data in A, B, D, and E are plotted as mean ± s.e.m. (A,D) Percent of mosquitoes on Peltier during seconds 90–180 of stimuli of indicated temperature, normalized to stimulus 10°C above ambient (A, open circle) or 40°C stimulus (D, open circle). (B,E) Same data as in (A) and (D), respectively, plotted using differential between ambient and Peltier temperature. For each ambient temperature, arrowheads indicate the lowest temperature stimulus found to elicit a significant increase in heat-seeking compared to an ambient temperature stimulus (A,B) or a reduction in heat-seeking compared to a 40°C stimulus (D,E) (p < 0.05; repeated-measures ANOVA with Bonferroni correction). For each ambient temperature, linear regressions (A, B, 21°C: 10.6/°C, R2 = 0.98, 26°C: 12/°C, R2 = 0.99, 31°C: 9.5/°C, R2 = 0.97) or variable slope sigmoidal dose–response curves (D, E, 21°C: IC50 = 55.4°C, R2 = 0.87, 26°C: IC50 = 52.5°C, R2 = 0.92, 31°C: IC50 = 50.5°C, R2 = 0.91) are plotted. (C,F) Heat maps showing mean mosquito occupancy on the Peltier (red square) and surrounding area, during seconds 90–180 of each stimulus period. Bold borders indicate stimuli with responses significantly different from an ambient-temperature stimulus (C) in (A,B), or significantly different from a 40°C stimulus (F) in (D,E) (p < 0.05; repeated-measures ANOVA with Bonferroni correction). (G,H) Analysis of mosquito responses to cooling from data in (Figure 1D). (G) Mean percent of mosquitoes on Peltier during thermal stimuli 31–40°C. Dashed line indicates the end of the stimulus period. (H) Post-stimulus time at which the percent of mosquitoes on Peltier has decayed to one half of the mean during seconds 90–180 of the stimulus period from (Figure 1E). Each replicate is indicated by a dot, mean ± s.e.m. by lines (NS, not significant; one-way ANOVA with Bonferroni correction).
Figure 2—figure supplement 1
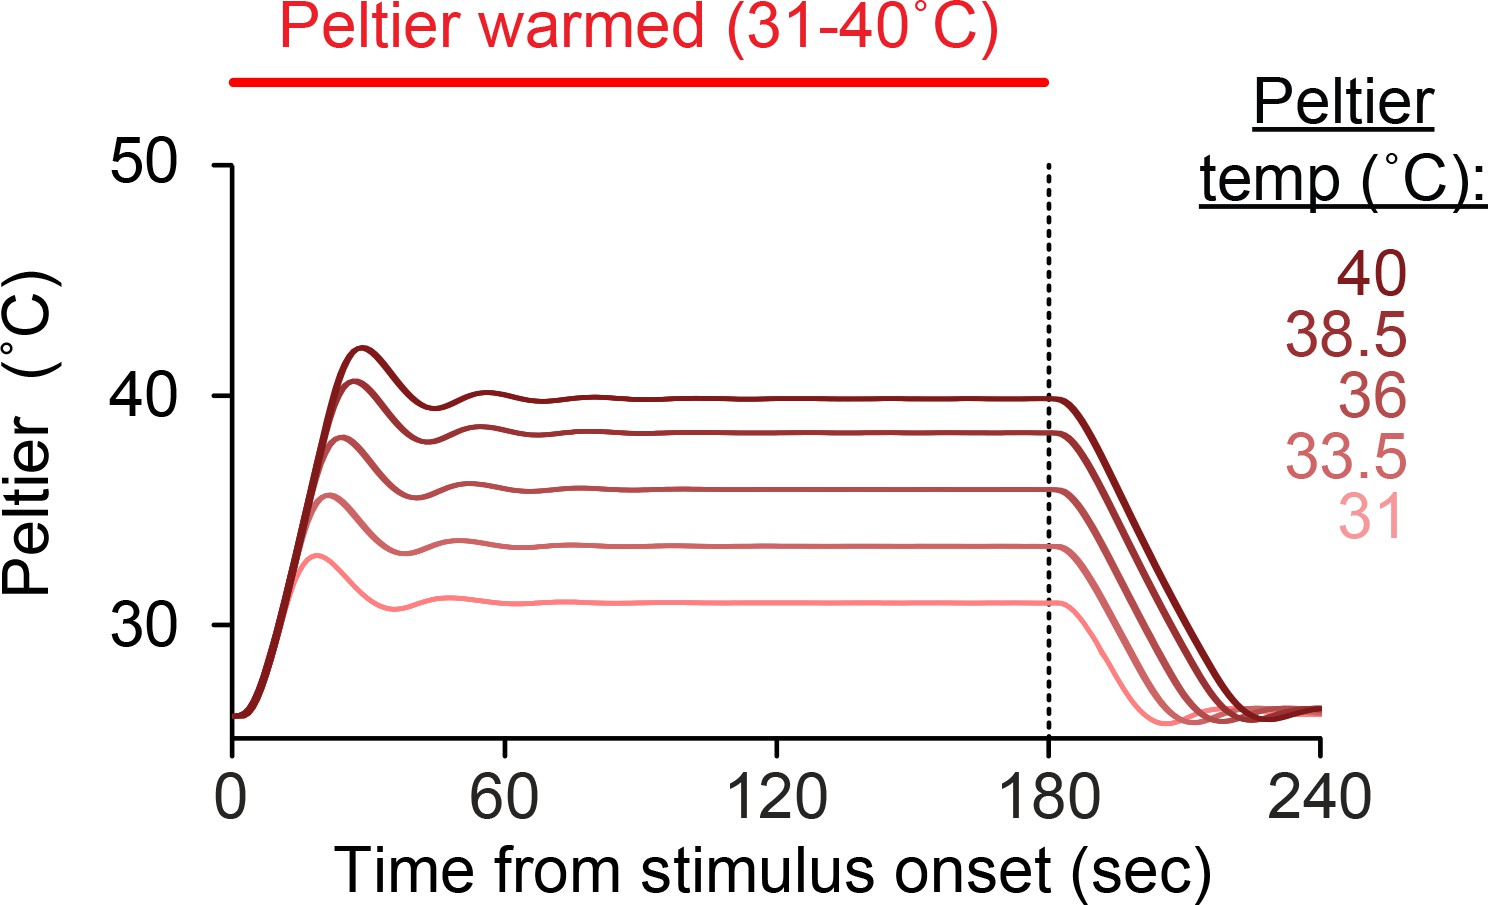
Dynamics of Peltier temperature during stimulus periods.
Mean Peltier temperature measured by thermocouple during presentation of thermal stimuli (31–40°C). Dashed line indicates the end of the stimulus period.
Figure 3 with 2 supplements
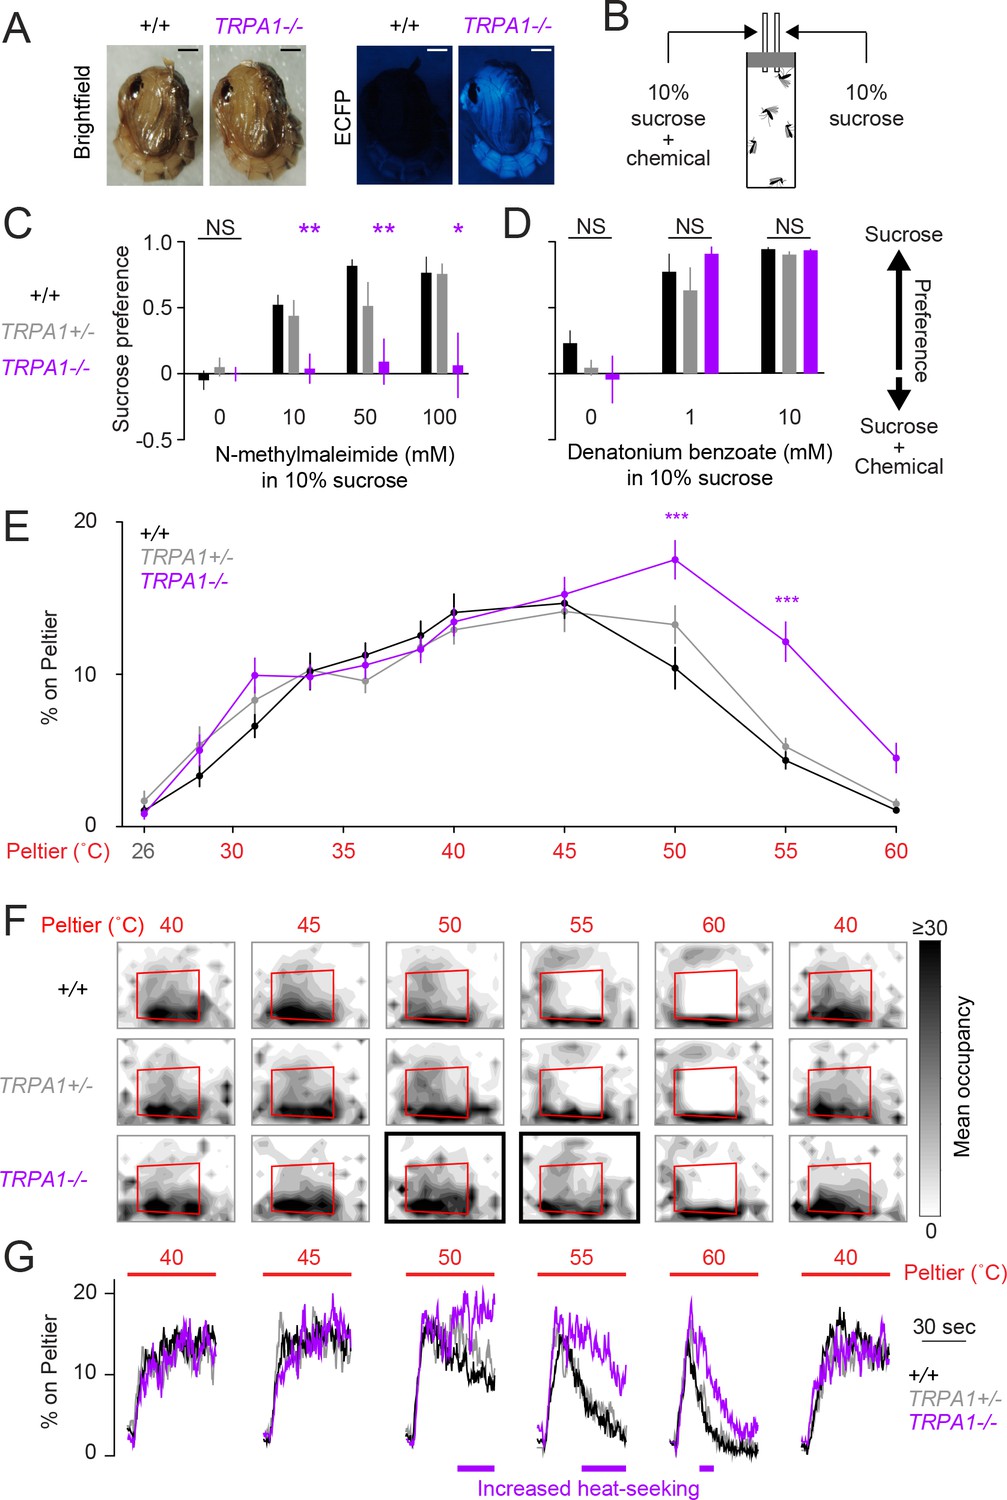
AaegTRPA1-/- mutants fail to avoid a chemical irritant and high-temperature stimuli.
(A) Representative bright field (left) and fluorescence (right) images of wild-type and AaegTRPA1-/- female pupae marked by ubiquitous expression of enhanced cyan fluorescent protein (ECFP). Scale bars: 0.5 mm. (B) Schematic of capillary feeding (CAFE) assay. (C,D) Sucrose preference over sucrose containing the indicated concentration of N-methylmaleimide (C, n = 10–12 trials per condition) or denatonium benzoate (D, n = 7 trials per condition) for mosquitoes of the indicated genotypes (NS, not significant; *p < 0.05, **p < 0.01; one-way ANOVA with Bonferroni correction compared to wild-type). (E) Percent of mosquitoes of indicated genotypes on Peltier during seconds 90–180 of stimuli of indicated temperature (mean ± s.e.m., n = 6–9 trials per genotype; ***p < 0.001; repeated measures one-way ANOVA with Bonferroni correction). (F) Heat maps showing mean mosquito occupancy for the indicated genotypes on the Peltier (red square) and surrounding area, during seconds 90–180 of each stimulus period. Bold borders indicate stimuli with responses significantly different from wild-type in (E) (p < 0.05; repeated-measures ANOVA with Bonferroni correction). (G) Mean percent of mosquitoes of indicated genotypes on Peltier during seconds 0–180 of thermal stimuli 40–60°C and during subsequent re-presentation of 40°C. Timespans with statistically significant increases in AaegTRPA1-/- mutant Peltier occupancy compared to wild-type are indicated by purple lines (calculated from 15 second bins; p < 0.05; one-way ANOVA with Bonferroni correction).
Figure 3—figure supplement 1

AaegTRPA1-/- mutants fail to avoid noxious heat in a thermal gradient.
(A) Genomic organization and targeted mutagenesis of AaegTRPA1. Non-coding (white) and coding (black) exons are shown to scale (vectorbase.org). Introns are denoted by connecting lines (not to scale). The AaegTRPA1 ZFN targets exon 12 (purple arrow). An insertion cassette (shown to scale), including the Ae. aegypti polyubiquitin (polyUB) promoter driving expression of enhanced cyan fluorescent protein (ECFP) and an SV40 polyadenylation signal, is integrated via homology-directed repair. (B) Schematic of the thermal gradient assay (top, side view). Representative experimental image (bottom, top view) showing mosquitoes outlined in red detected across one lane of the thermal gradient assay, with instantaneous air temperature reported for each of 8 analysis sectors. (C,D) Percent of mosquitoes of indicated genotypes detected in each sector and mean sector air temperature (rounded to nearest °C) in the absence (C) or presence (D) of a thermal gradient (n = 6 trials per genotype). Data are plotted as mean ± s.e.m. (***p < 0.001; two-way ANOVA with Bonferroni correction compared to wild-type). (E) Heat maps showing mean air temperature (left) and percent of mosquitoes of the indicated genotypes detected (right) in each sector over 90 min from the onset of a thermal gradient. (F) Same data as in (E), showing total percent of mosquitoes of the indicated genotypes detected in sectors 1–3 (cold side, solid line, mean; s.e.m., shading) and sectors 6–8 (hot side, dotted line, mean; s.e.m., shading) during onset and maintenance of a thermal gradient. G, Percent of total mosquitoes of the indicated genotypes found dead in sectors 6–8 at the conclusion of the experiment. Each replicate is indicated by a dot, and mean ± s.e.m. by lines. Genotypes with different letters are significantly different (p < 0.01, one-way ANOVA with Bonferroni correction).
Figure 3—figure supplement 2
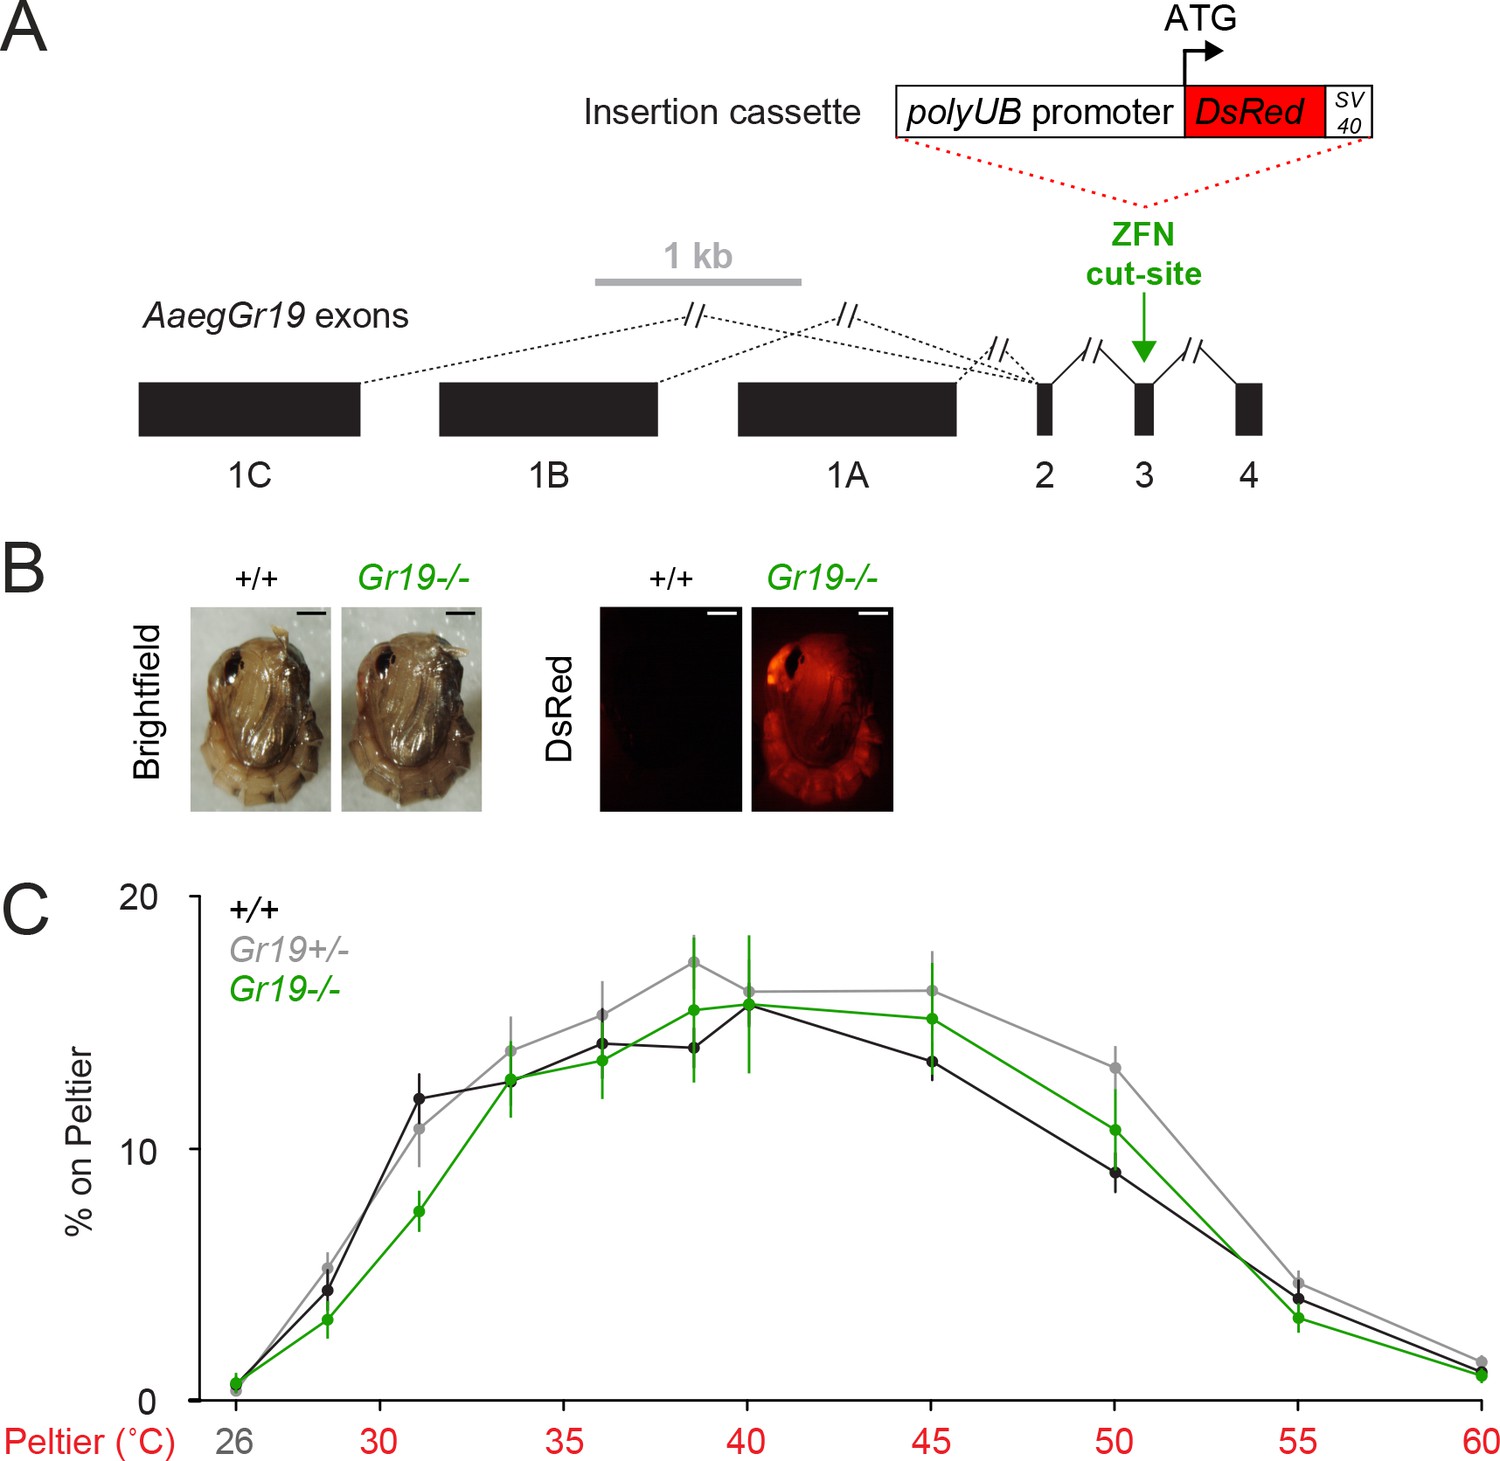
AaegGr19-/- mutants show normal thermotaxis.
(A) Genomic organization and targeted mutagenesis of AaegGr19. Coding (black) exons are shown to scale, introns are denoted by connecting lines (not to scale), and alternative splicing is denoted by dashed lines (vectorbase.org). The AaegGr19 ZFN targets exon 3 (green arrow). An insertion cassette (shown to scale), including the Ae. aegypti polyubiquitin (polyUB) promoter driving expression of Discosoma sp. red fluorescent protein (DsRed) and an SV40 polyadenylation signal, is integrated via homology-directed repair. (B) Representative bright field (left) and fluorescence (right) images of wild-type and AaegGr19-/- female pupae marked with ubiquitous expression of DsRed Scale bars: 0.5 mm. The wild-type bright-field image is duplicated from (Figure 3A). (C) Percent of mosquitoes of indicated genotypes on Peltier during seconds 90–180 of stimuli of indicated temperature (mean ± s.e.m., n = 6–9 trials per genotype). Neither AaegGr19-/- nor AaegGr19+/- were significantly different from wild-type at any stimulus temperature (repeated measures one-way ANOVA with Bonferroni correction).
Figure 4
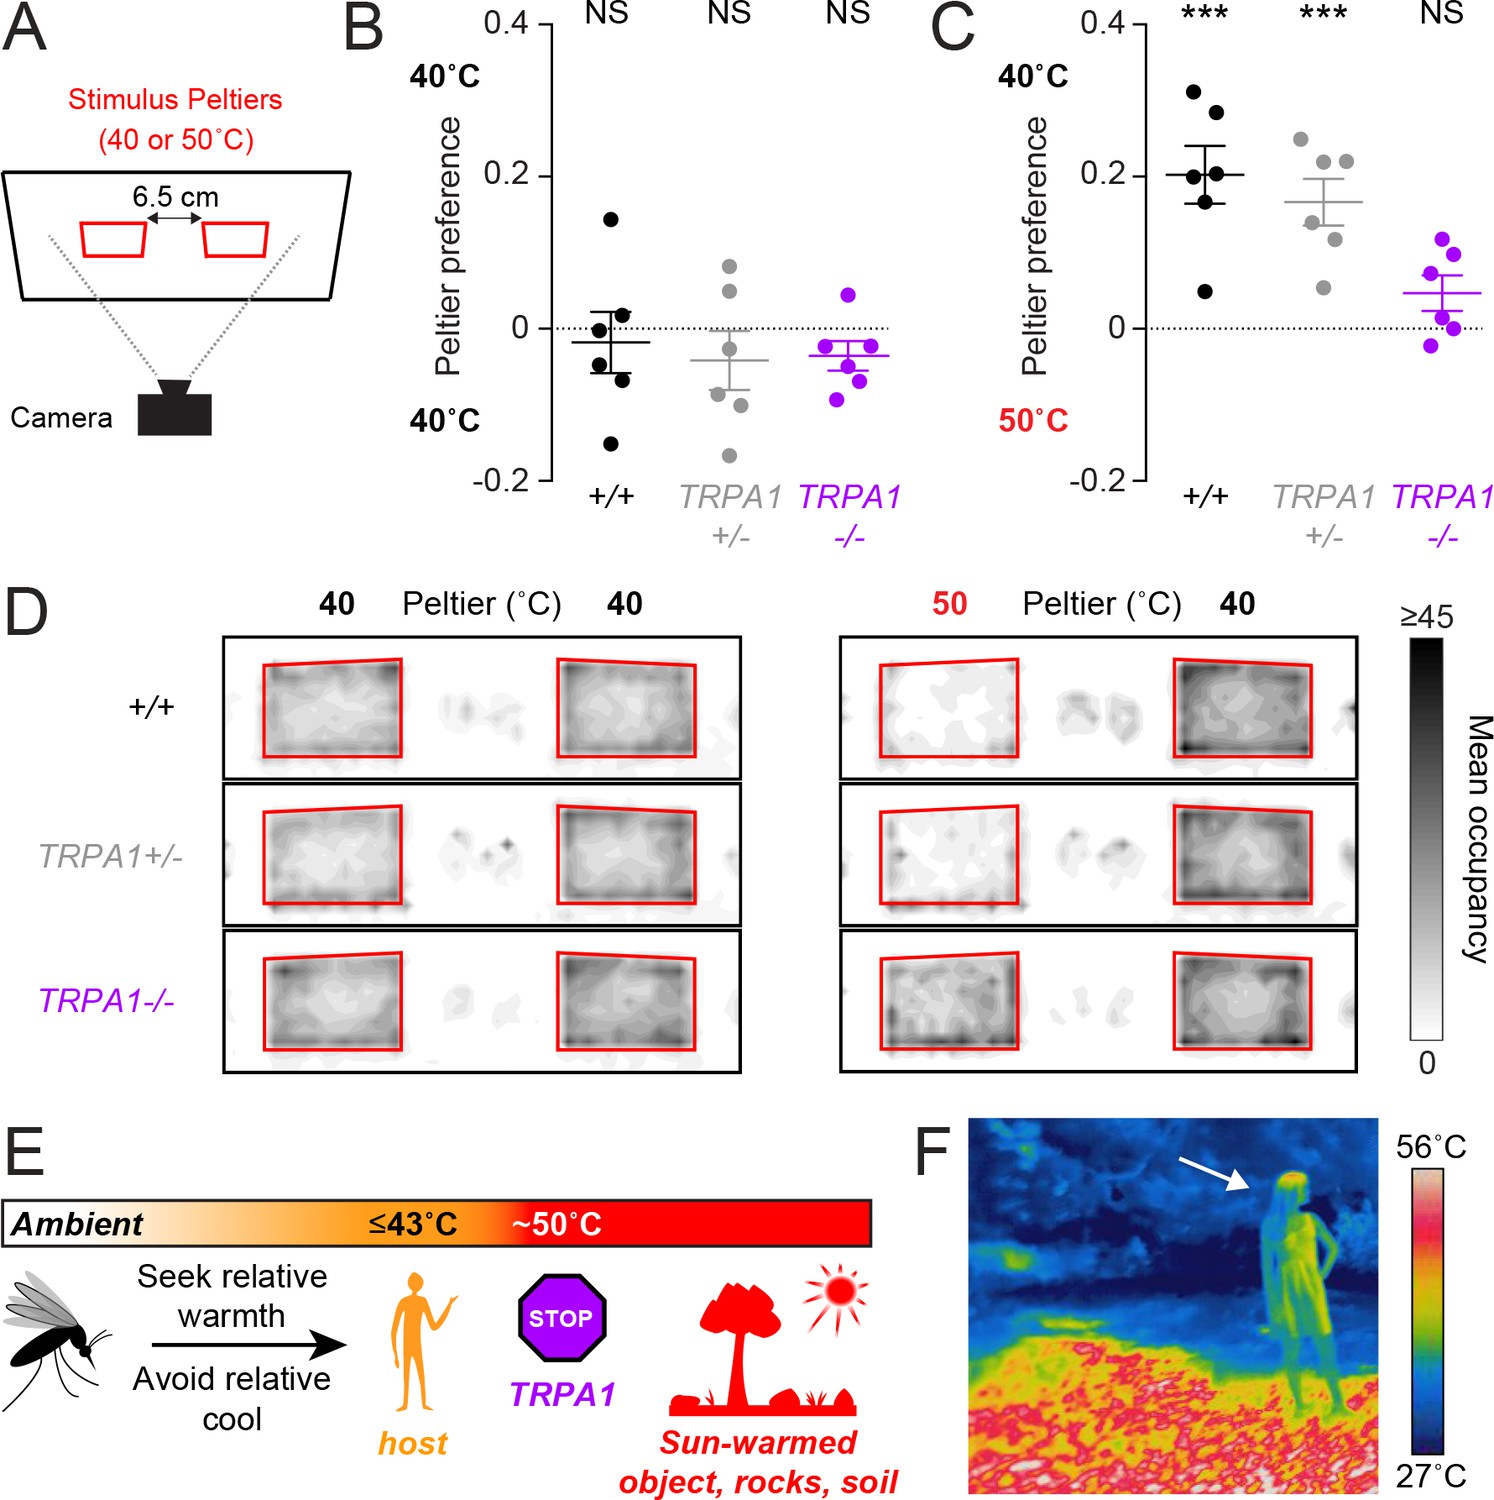
AaegTRPA1-/- mutants fail to discriminate between host-temperature and higher-temperature targets.
(A) Schematic of heat-seeking choice assay. (B,C) Preference for 40°C versus 40°C (B) or 50°C versus 40°C (C) Peltiers for indicated genotypes (n = 6 trials per genotype; mean ± s.e.m., with each replicate indicated by a dot; NS, not significant; ***p < 0.001; one sample t-test versus zero preference). In (C) AaegTRPA1-/- mutants are significantly different from wild-type and heterozygous mutants (p < 0.05, one-way ANOVA with Bonferroni correction). (D) Heat maps showing mean mosquito occupancy for the indicated genotypes on Peltiers (red squares) of the indicated temperatures and surrounding area, during seconds 60–240 of each stimulus period. (E) Model of mosquito thermotaxis. (F) Thermal image of a person (arrow) standing on a sunlit patch of grass in Central Park in New York City.
Videos
Video 1
AaegTRPA1 is required for tuning avoidance of high-temperature stimuli during heat-seeking.
AaegTRPA1-/- mutants presented with a choice between two Peltiers, one at 40°C and one at 50°C. Video is sped up 10-fold (images acquired at 1 Hz and reproduced at 10 frames/s), and shows seconds 60–240 of the stimulus period.
Additional files
-
Source code 1
Heat-seeking assay.
- https://doi.org/10.7554/eLife.11750.012
-
Source code 2
Heat-seeking assay count.
- https://doi.org/10.7554/eLife.11750.013
-
Source code 3
Gradient count.
- https://doi.org/10.7554/eLife.11750.014
Download links
A two-part list of links to download the article, or parts of the article, in various formats.
Downloads (link to download the article as PDF)
Open citations (links to open the citations from this article in various online reference manager services)
Cite this article (links to download the citations from this article in formats compatible with various reference manager tools)
The cation channel TRPA1 tunes mosquito thermotaxis to host temperatures
eLife 4:e11750.
https://doi.org/10.7554/eLife.11750


