Spatial sequestration and detoxification of Huntingtin by the ribosome quality control complex
- University of Gothenburg, Sweden
Figures
Figure 1
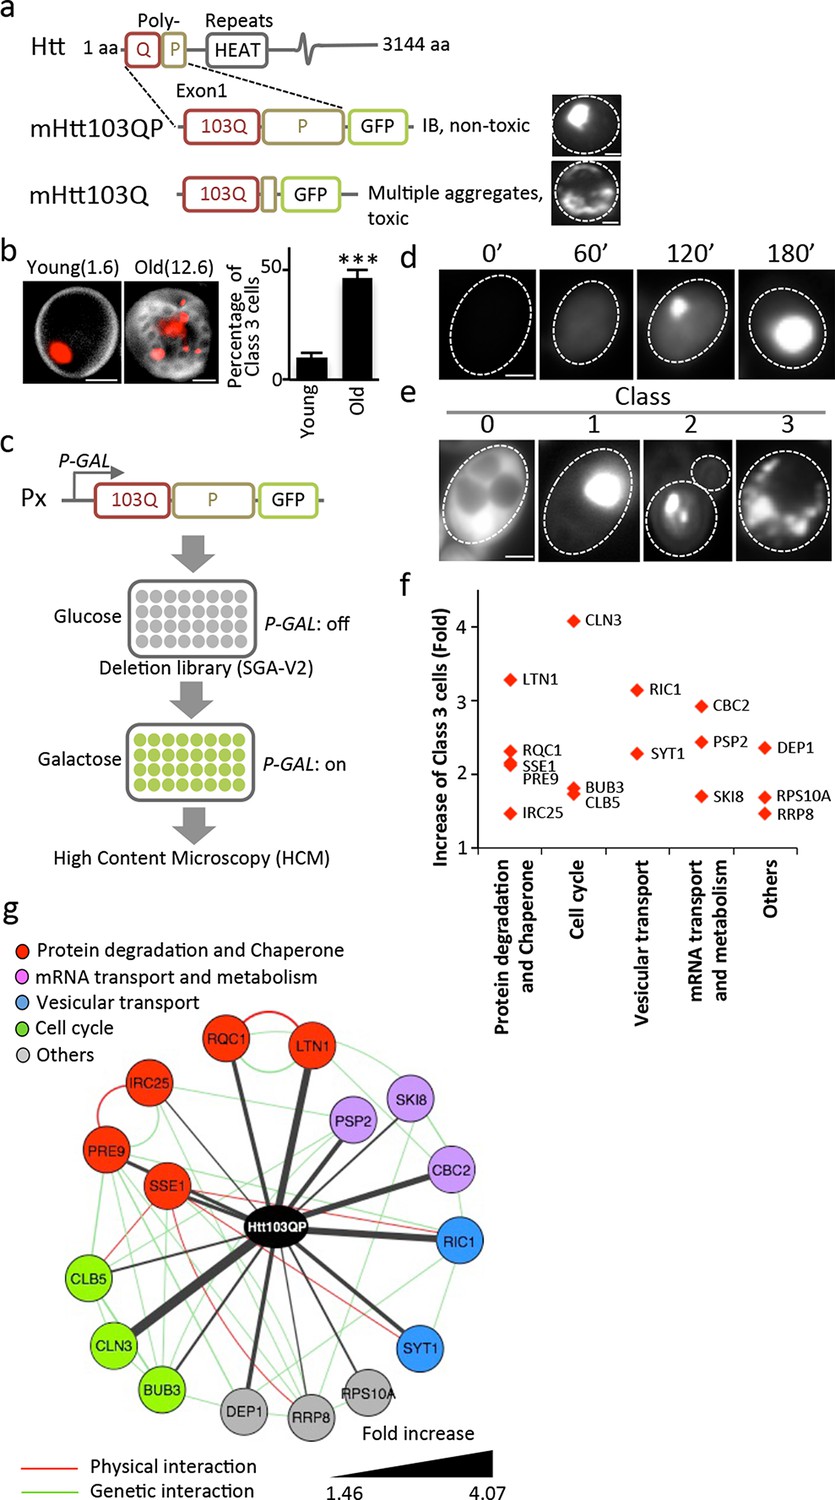
Screen approach and mHtt IB-forming mutants.
(a) Aggregation of different mHtt reporters as indicated. (b)Morphology of mHtt103QP aggregates (red) in young and old (1.6 and 12.6 bud scars (white), respectively) cells. Scale=2 μm. Bar graph shows percentages of Class3 cells in young and old cells. Mean ± s.d. (c) Schematic description of the HCM-based screen. (d) Htt103QP aggregation 0, 60, 120 and 180 min after HTT103QP induction. (e)Representative pictures of Class 0, 1, 2 and 3 cells. (f) Mutants displaying increased% of Class 3 cells, grouped according to functions. Y-axis shows fold increase relative to wild type. (g) Physical (red) and genetic (green) interaction between Class 3 genes/proteins and their quantitative interaction (thickness of grey lines) with mHtt103QP as indicated.
Figure 2 with 5 supplements
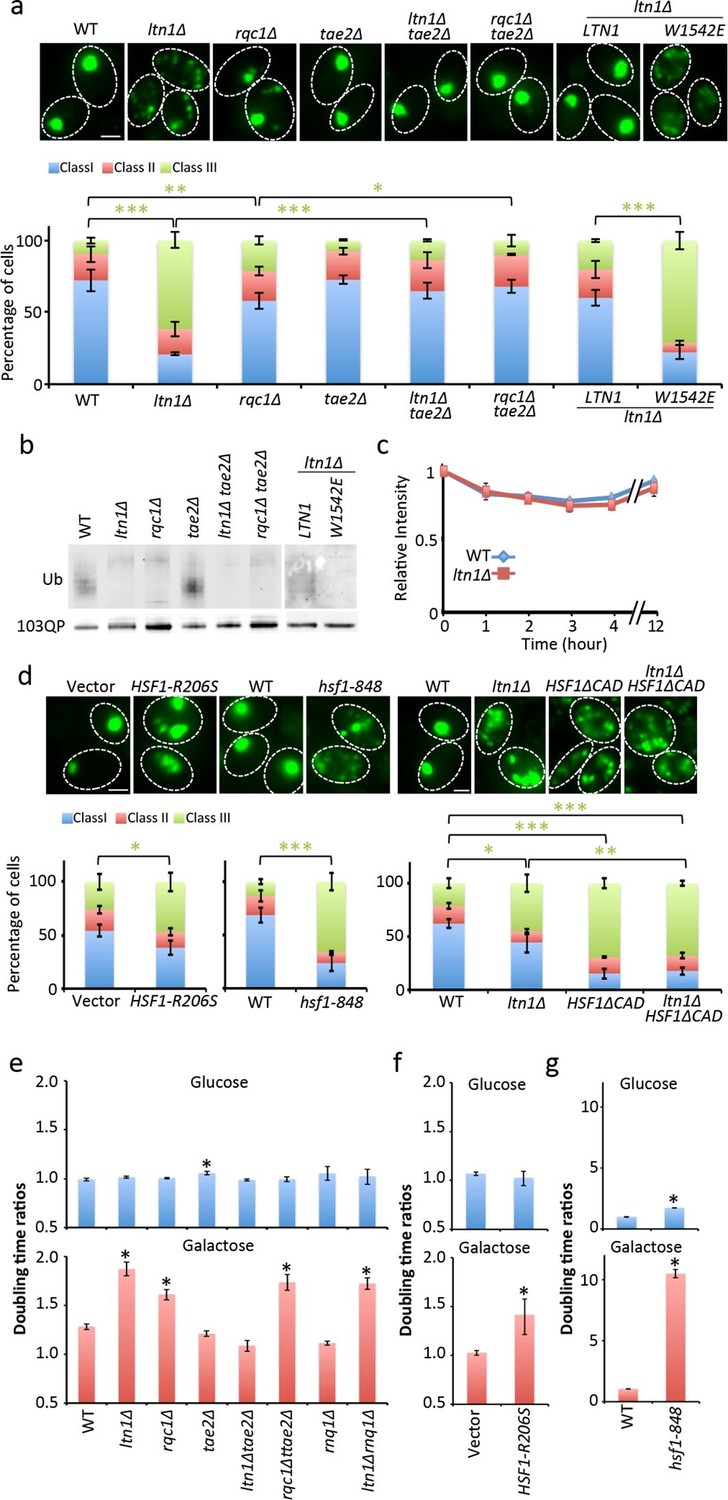
Role of RQC in mHtt103QP IB formation ubiquitination and toxicity.
(a, d)Htt103QP aggregate numbers (% Class 1,2&3 cells; see Figure 1) in mutants as indicated. W1542E encodes a ubiquitin-ligase-defect Ltn1 protein. HSF1-R206S encodes a hyper-active Hsf1. The hsf1-848 is a conditional ts mutant while HSF1ΔCAD lacks the c-terminal trans-activating domain. Scale=2 μm. Bar graphs show % of Class 1, 2 and 3 cells in each strain. Mean ± s.d. (b)Ubiquitination of mHtt103QP in strains from ‘a’. (c) Htt103QP stability in WT and ltn1Δ cells after a block in protein synthesis. Mean ± s.d. e-g. Fitness (see Materials and methods) of strains carrying pYES2-mHtt103QP-GFP compared to pYES2-GFP. Results from Galactose (mHtt induced) and Glucose (mHtt repressed) are shown. Ratios were calculated from the mean of three repeats (error bars are 95% confidence intervals) for WT, RQC, and rnq1∆ mutants (e) HSF1-R206S (f) and hsf1-848 (g).
Figure 2—figure supplement 1
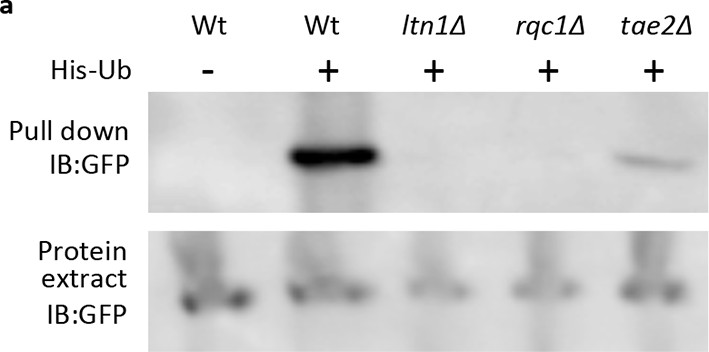
Western blot of His-Ub pull-down mHtt103QP in RQC mutants.
mHtt103QP-GFP ubiquitinated by His-tagged ubiquitin was pulled-down by Ni-beads and detected by GFP antibody.
Figure 2—figure supplement 2
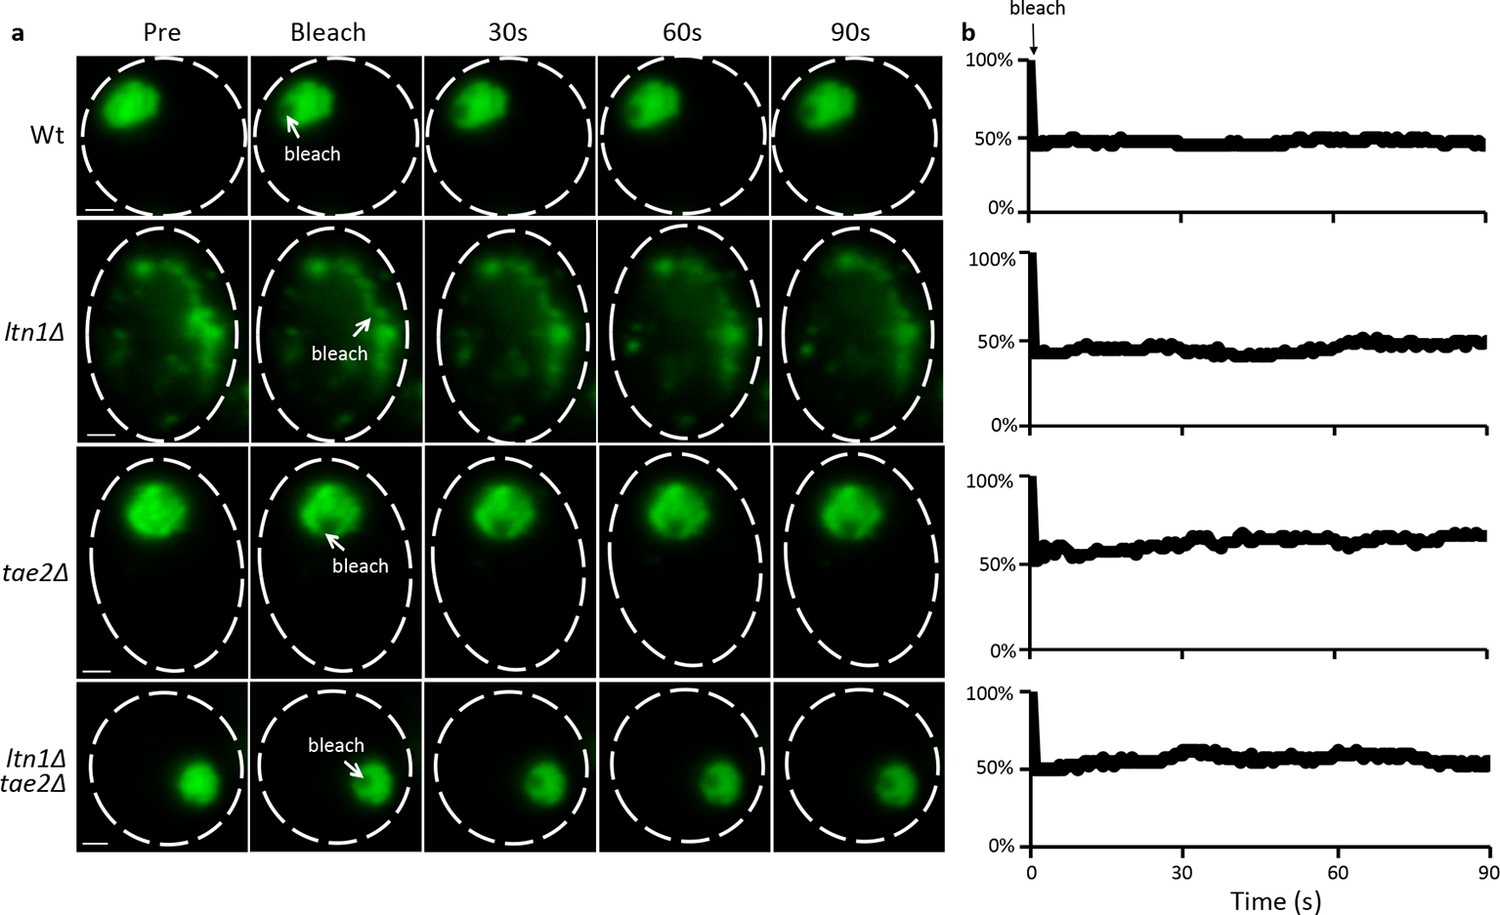
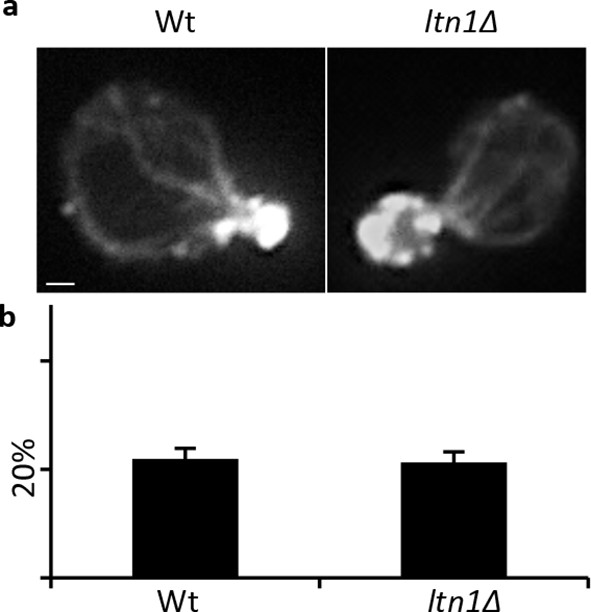
FRAP assay of mHtt103QP aggregate in Wt and RQC mutants.
(a) Representative images of mHtt103QP-GFP aggregate before and after laser bleach. (b) Relative fluorescence of the bleached region.
Figure 2—figure supplement 3
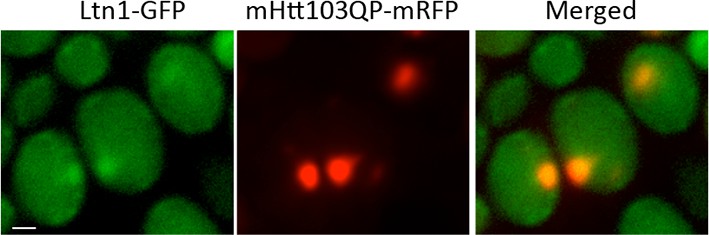
Ltn1-GFP co-localize with mHtt103QP-mRFP.
https://doi.org/10.7554/eLife.11792.007
Figure 2—figure supplement 4
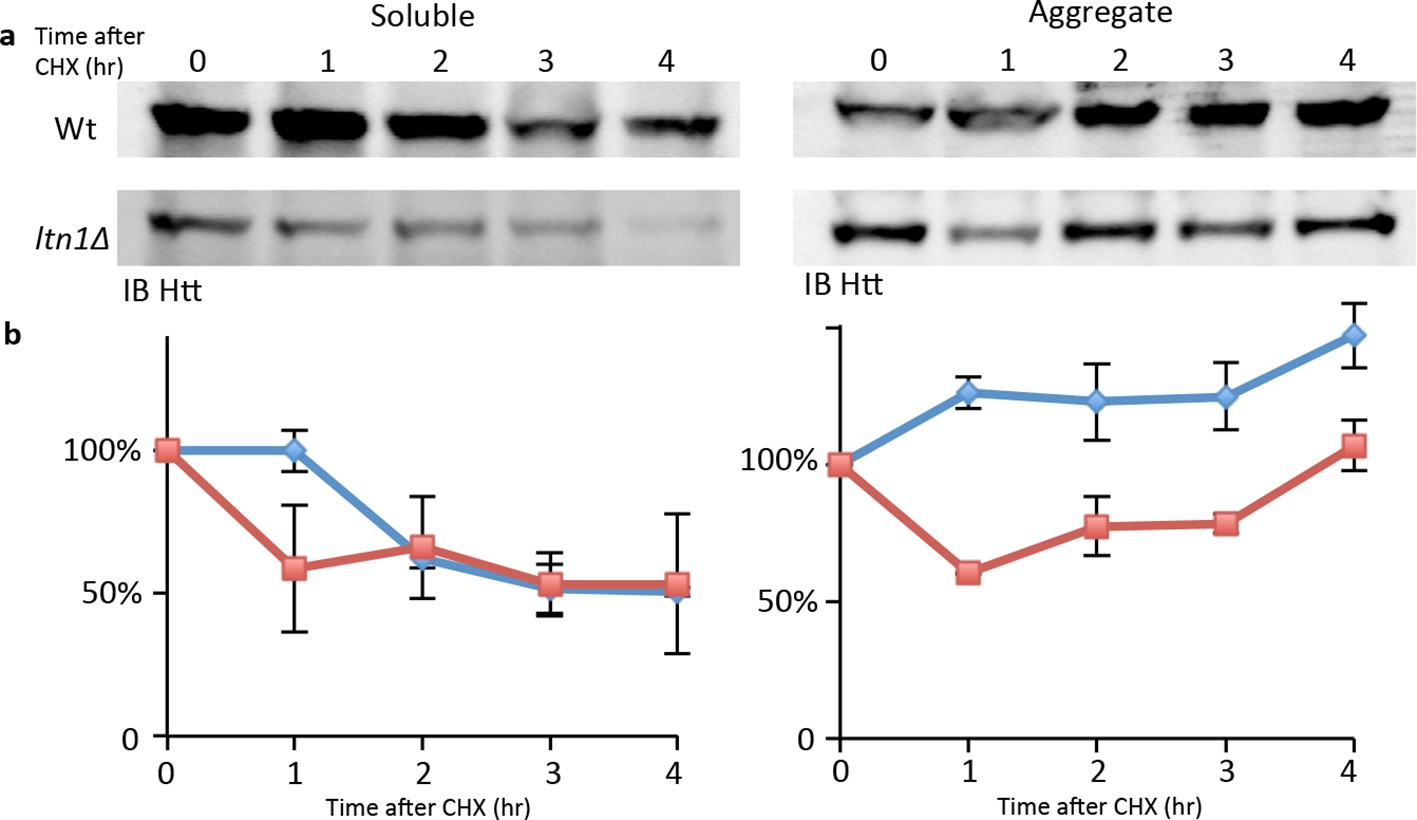
mHtt levels chase after cycloheximide treatment.
(a) Representative Western blots of soluble and aggregated mHtt103QP from Wt and ltn1Δ strains. (b) Quantitafication of three repeats.
Figure 2—figure supplement 5
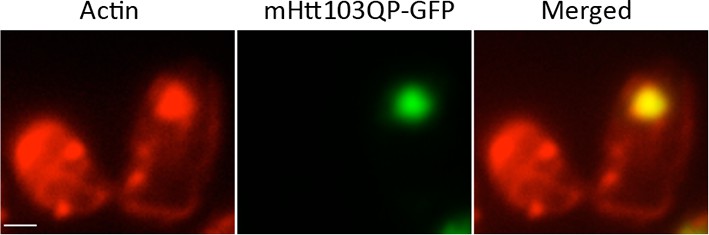
mHtt103QP aggregate in ltn1Δtae2Δ is also co-localized with dense actin structures.
https://doi.org/10.7554/eLife.11792.009
Figure 3 with 2 supplements
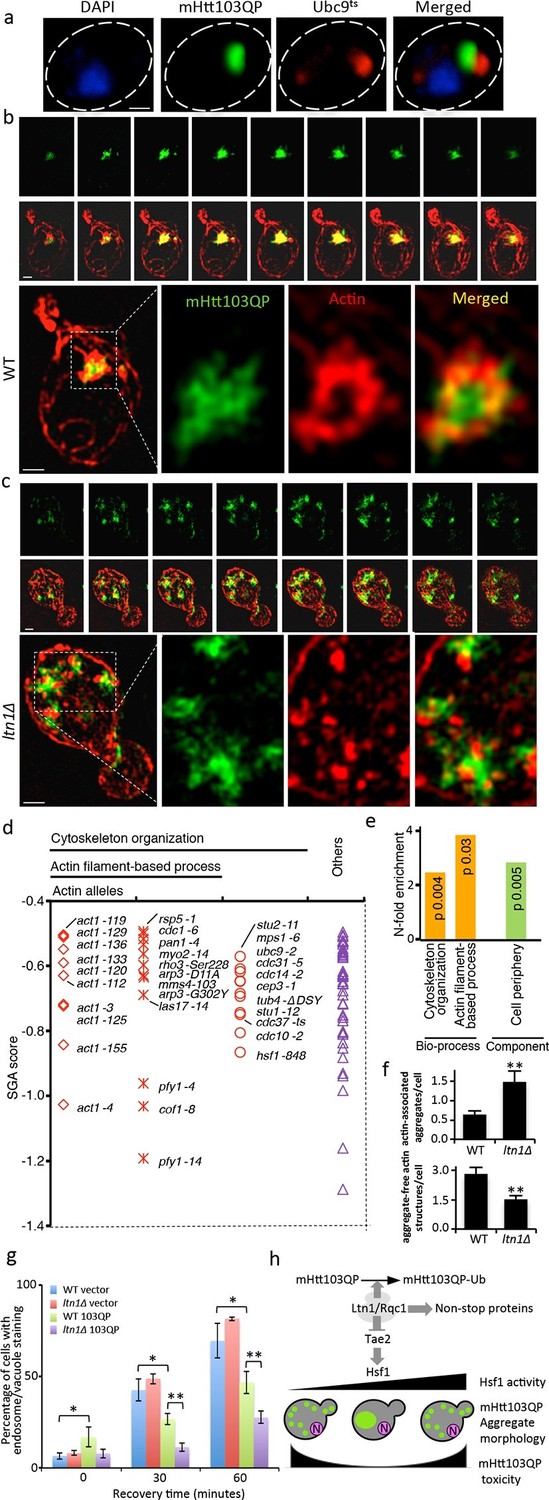
Role of actin in Htt103QP detoxification.
(a)Co-localization of mHtt103QP IBs and UBC9ts IPODs. (b, c) Actin structures (Red; phalloidin) and mHtt103QP (Green; GFP) aggregates in WT and ltn1Δ analyzed by 3D-SIM. Scale=1 μm. (d)Essential ts-alleles increasing toxicity of mHtt103QP, grouped according to biological processes. (e) Functional enrichment analysis of mHtt103QP-sensitive ts mutants. (f) Number of actin-associated aggregates and aggregate-free actin structures in WT and ltn1Δ cells. Mean ± s.d. g. Endocytotic activity in WT and ltn1Δ cells analyzed by FM4-64FX uptake to vacuoles. Mean ± s.d. (h)A model of the regulation of mHtt103QP IB formation and toxicity by RQC components and Hsf1.
Figure 3—figure supplement 1
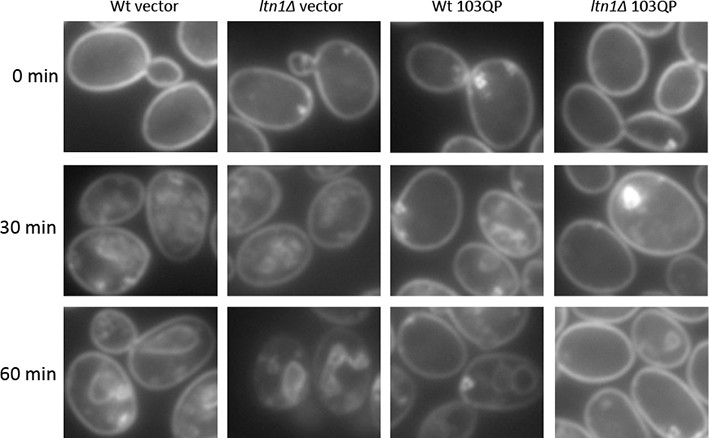
FM4-64FX stained cells.Images of FM4-64FX stained cells corresponding to Figure 3g.
Representative cells carrying pYES2-GFP ('Vector') or pYES2-mHtt103QP-GFP ('103QP') were shown.
ltn1Δ.
Figure 3—figure supplement 2
Actin integrity of Wt and a. Actin staining of Wt and ltn1Δ cells, b. Quantification of actin depolarization of Wt and ltn1Δ cells, see Materials and methods for details.
https://doi.org/10.7554/eLife.11792.012Videos
Video 1
3D structures of mHtt103QP aggregate and actin in WT.
mHtt103QP aggregates (green) and actin (red) structures of a WT cell shown in Figure 3b.
Video 2
3D structures of mHtt103QP aggregate and actin in ltn1Δ.
mHtt103QP aggregates (green) and actin (red) structures of a ltn1Δ cell shown in Figure 3c.
Additional files
-
Supplementary file 1
List of confirmed mutants from the HCM-based screen that have increased Class 3 cells.
- https://doi.org/10.7554/eLife.11792.015
-
Supplementary file 2
List of ts alleles that increased mHtt103QP toxicity in SGA screen.
- https://doi.org/10.7554/eLife.11792.016
-
Supplementary file 3
List of S. cerevisiae strains and plasmids.
A. List of S. cerevisiae strains. B. List of plasmids
- https://doi.org/10.7554/eLife.11792.017
Download links
A two-part list of links to download the article, or parts of the article, in various formats.
Downloads (link to download the article as PDF)
Open citations (links to open the citations from this article in various online reference manager services)
Cite this article (links to download the citations from this article in formats compatible with various reference manager tools)
Spatial sequestration and detoxification of Huntingtin by the ribosome quality control complex
eLife 5:e11792.
https://doi.org/10.7554/eLife.11792


