Ceapins inhibit ATF6α signaling by selectively preventing transport of ATF6α to the Golgi apparatus during ER stress
- Howard Hughes MedicaI Institute, University of California, San Francisco, United States
- University of California, San Francisco, United States
Figures
Figure 1 with 3 supplements

Ceapins induce foci formation and prevent ER-stress induced nuclear translocation of GFP-ATF6.
(A–H) U2-OS cells stably expressing GFP-ATF6α were treated either with vehicle (A, E) or ER stress inducer (B–D and F–H) in the absence (A, B, E and F) or presence of active (6 μM Ceapin-A7, C, G) or inactive (6 μM Ceapin-A5, D, H) Ceapin analogs for five hours prior to fixation and fluorescent imaging of GFP-ATF6α (green) and DNA (magenta). In unstressed cells (A, E, DMSO) GFP-ATF6α is in the ER. Addition of either 100 nM thapsigargin (B) or 2.5 μg/mL tunicamycin (F) induces nuclear translocation of cleaved GFP-ATF6. The presence Ceapin-A7 (C, G) but not the inactive Ceapin analog A5 (D, H) prevents nuclear translocation. Scale bar is 10 μm. (I–N) Time-lapse images of U2-OS cells stably expressing GFP-ATF6α treated either with vehicle (I, DMSO), ER stress (J, 100 nM Tg), ER stress plus 5 μM Ceapin-A1 (K, IC50 4.9 ± 1.2 μM), ER stress plus 5 μM Ceapin-A7 (L, IC50 0.59 ± 0.17 μM) or Ceapin analogs alone (M, 5 μM Ceapin-A1; N, 5 μM Ceapin-A7). The addition of Ceapin analogs induces formation of GFP-ATF6α foci and either partially (K, Ceapin-A1) or completely (L, Ceapin-A7) inhibits nuclear translocation of GFP-ATF6α in response to ER stress. Scale bar is 10 μm.
Figure 1—figure supplement 1
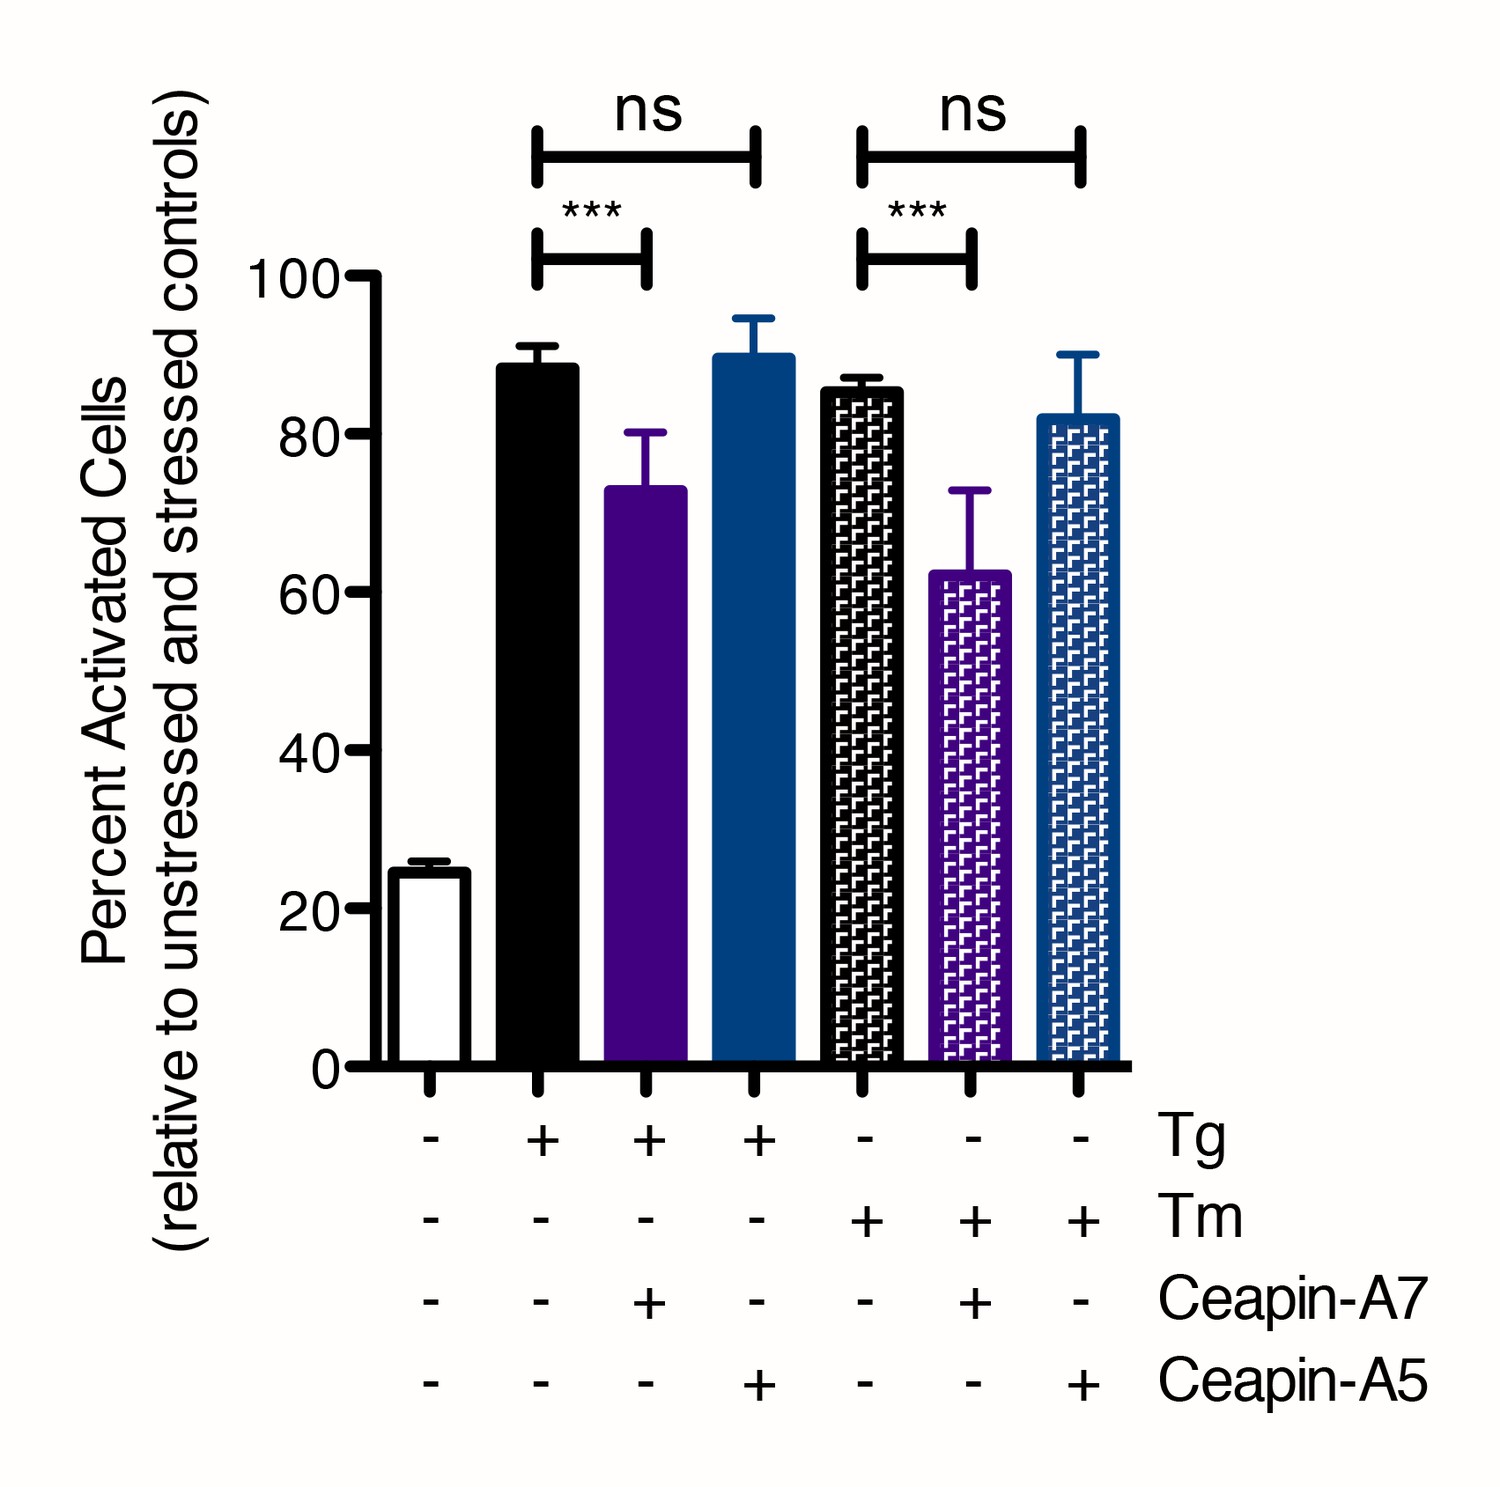
Quantification of nuclear translocation assay with Ceapin Analogs.
Cells were treated without (white bar) or with (colored bars) ER stressor (100 nM Tg, solid bars or 2.5 μg/mL Tm, patterned bars) in the absence (black bars) or presence of active (6 μM Ceapin-A7, purple bars) or inactive (6 μM Ceapin-A5) Ceapin analogs. Means from three different wells are plotted; error bars are 95% confidence limits. Statistical analysis is one-way ANOVA of all groups.
Figure 1—figure supplement 2
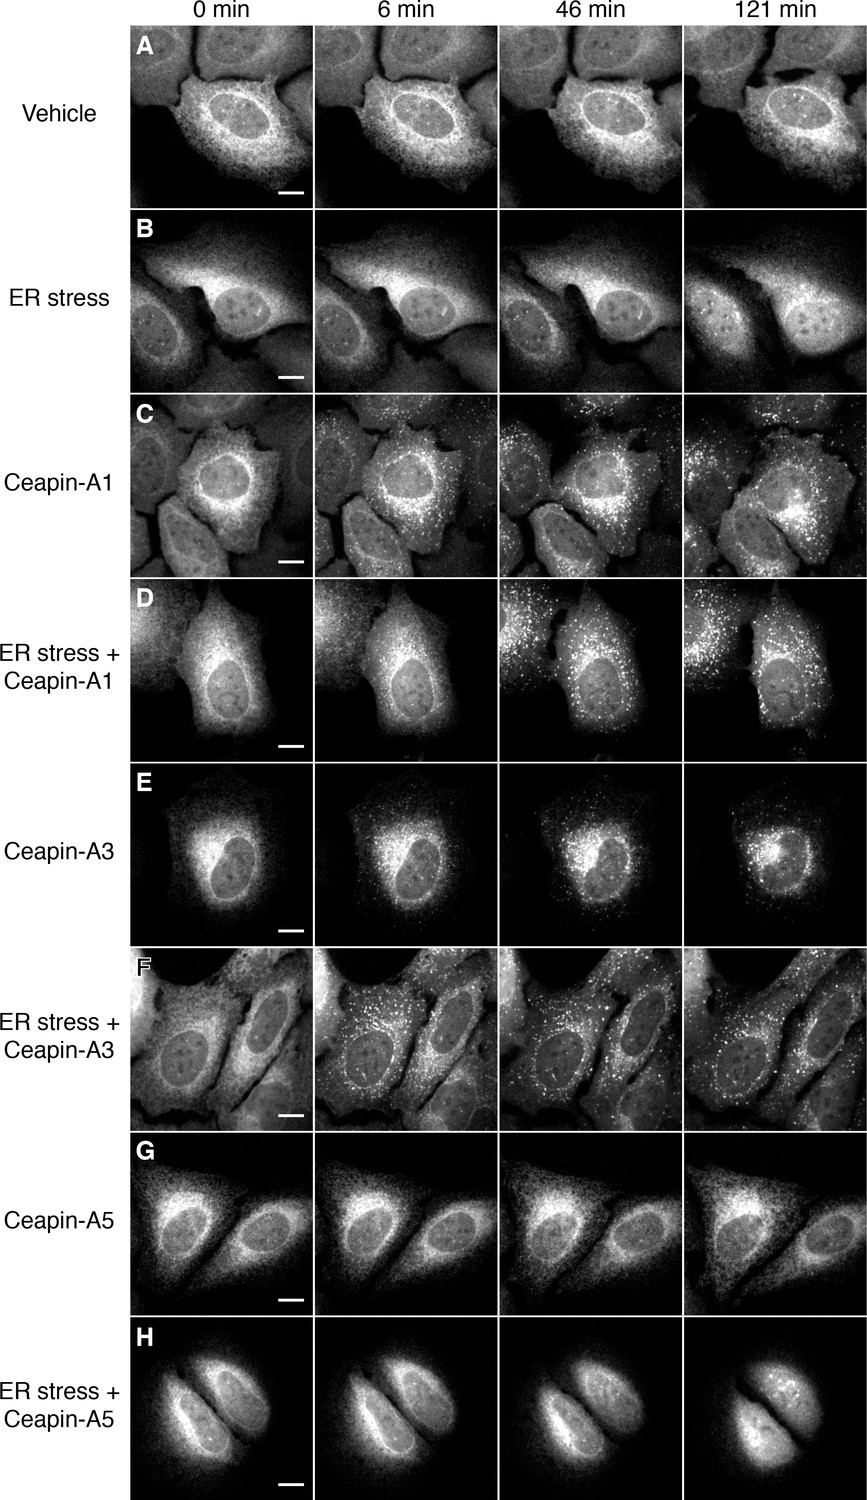
Active but not inactive analogs of Ceapin induce foci formation and prevent nuclear translocation of GFP-ATF6.
(A–H) Time-lapse images of U2-OS cells stably expressing GFP-ATF6α treated either with vehicle (A,C,E,G, DMSO), ER stressor (B,D,F,H, 100 nM Tg), in the absence (A,B) or presence (C–H) of Ceapin analogs. Addition of active Ceapin analogs, 5 μM Ceapin-A1 (C,D, IC50 = 4.9 ± 1.2 μM) or 5 μM Ceapin-A3 (E,F, IC50 = 6.9 ± 0.7 μM) but not the inactive Ceapin analog, 5 μM Ceapin-A5 (G,H, IC50 > 30 μM) induce foci formation of GFP-ATF6. Cells treated with ER stressor (B, 121 min time point) show nuclear translocation of GFP-ATF6. Active Ceapin analogs (D,F, 121 min time point) but not the inactive analog (H, 121 min time point) prevent this ER-stress induced nuclear translocation and GFP-ATF6α remains in foci. Scale bar is 10 μm. Images are representative of at least three independent experiments where three positions per well were imaged in each experiment.
Figure 1—figure supplement 3
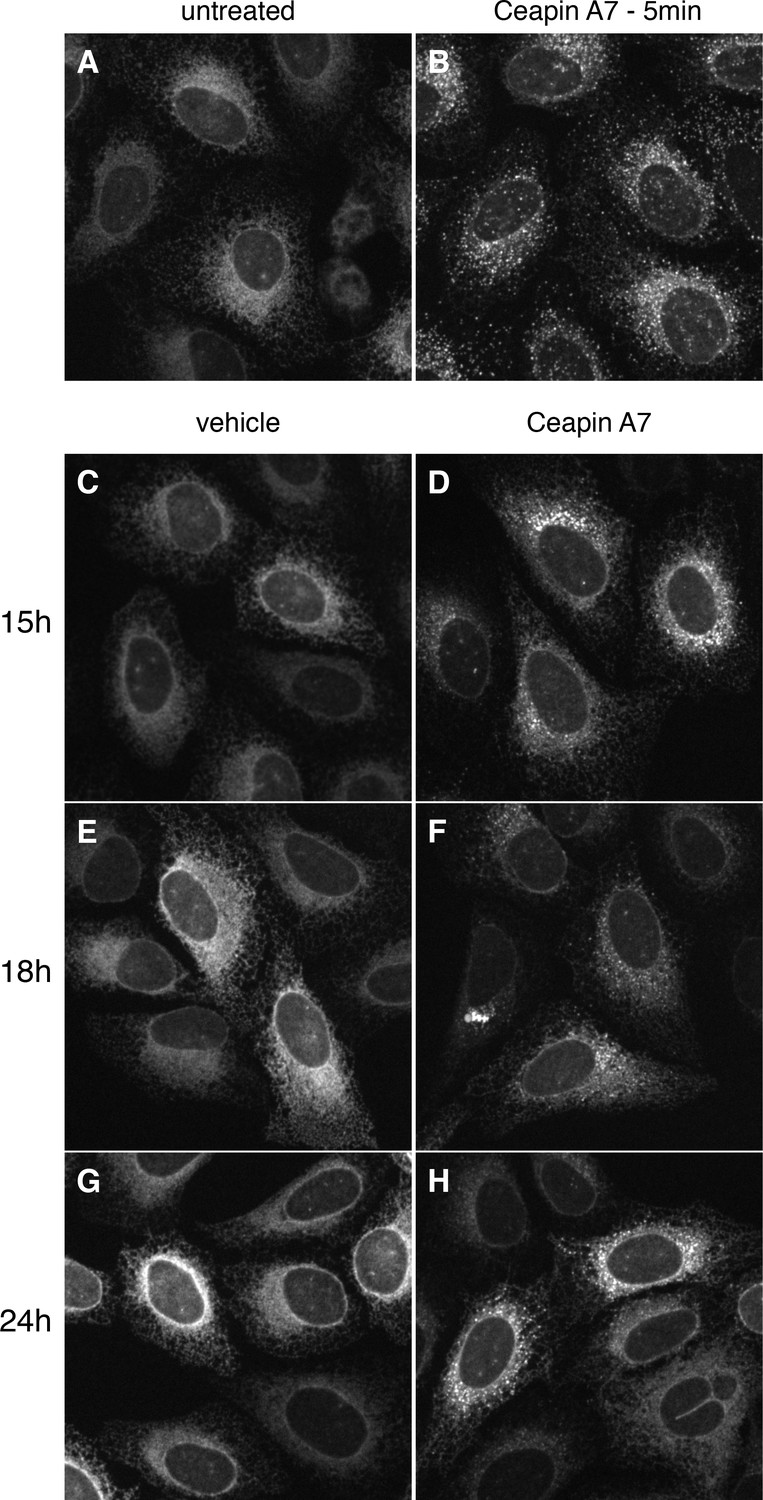
GFP-ATF6 foci persist for up to 24 hr after addition of Ceapin A7.
(A–H) U2-OS cells stably expressing GFP-ATF6α were either untreated (A) or treated either with vehicle (C, E, G, DMSO) or Ceapin-A7 (6 μM B, D, F, H) for five minutes (B), fifteen (C, D), eighteen (E, F) or twenty-four (G, H) hours prior to fluorescent imaging of GFP-ATF6α. In untreated (A) or vehicle treated cells (C, E, G, DMSO) GFP-ATF6α is in the ER. Addition of 6 μM Ceapin-A7 induces foci formation of GFP-ATF6 that persists for up to twenty-four hours. DMSO concentration for all wells was 0.034%.
Figure 2 with 1 supplement

Ceapin-induced foci are reversible and correlate with inhibition of ATF6.
(A–C) Time-lapse images of U2-OS cells stably expressing GFP-ATF6α treated either with vehicle (A, DMSO) or active Ceapin analogs (B, 10 μM Ceapin-A1), (C, 1 μM Ceapin-A7) for seventeen minutes to allow foci formation. Cells were then washed once with PBS and then media without compound was added. Scale bar is 10 μm. Images are representative of three independent experiments where three positions per well were imaged for each experiment. (D–G) Time-lapse images of U2-OS cells stably expressing GFP-ATF6α treated either with vehicle (A,B, DMSO) or 10 μM Ceapin-A1 (C,D). After fifteen minutes, the cells were washed with PBS and then media without (A,C, DMSO) or with ER stressor (B,D, 100 nM Tg) was added. After washout, ATF6α inhibitor foci resolve (C,D) and nuclear translocation of GFP-ATF6α occurs with similar kinetics in cells initially treated with either DMSO (B) or Ceapin-A1 (D). Scale bar is 10 μm. Images are representative of three independent experiments where three positions per well were imaged for each experiment.
Figure 2—figure supplement 1
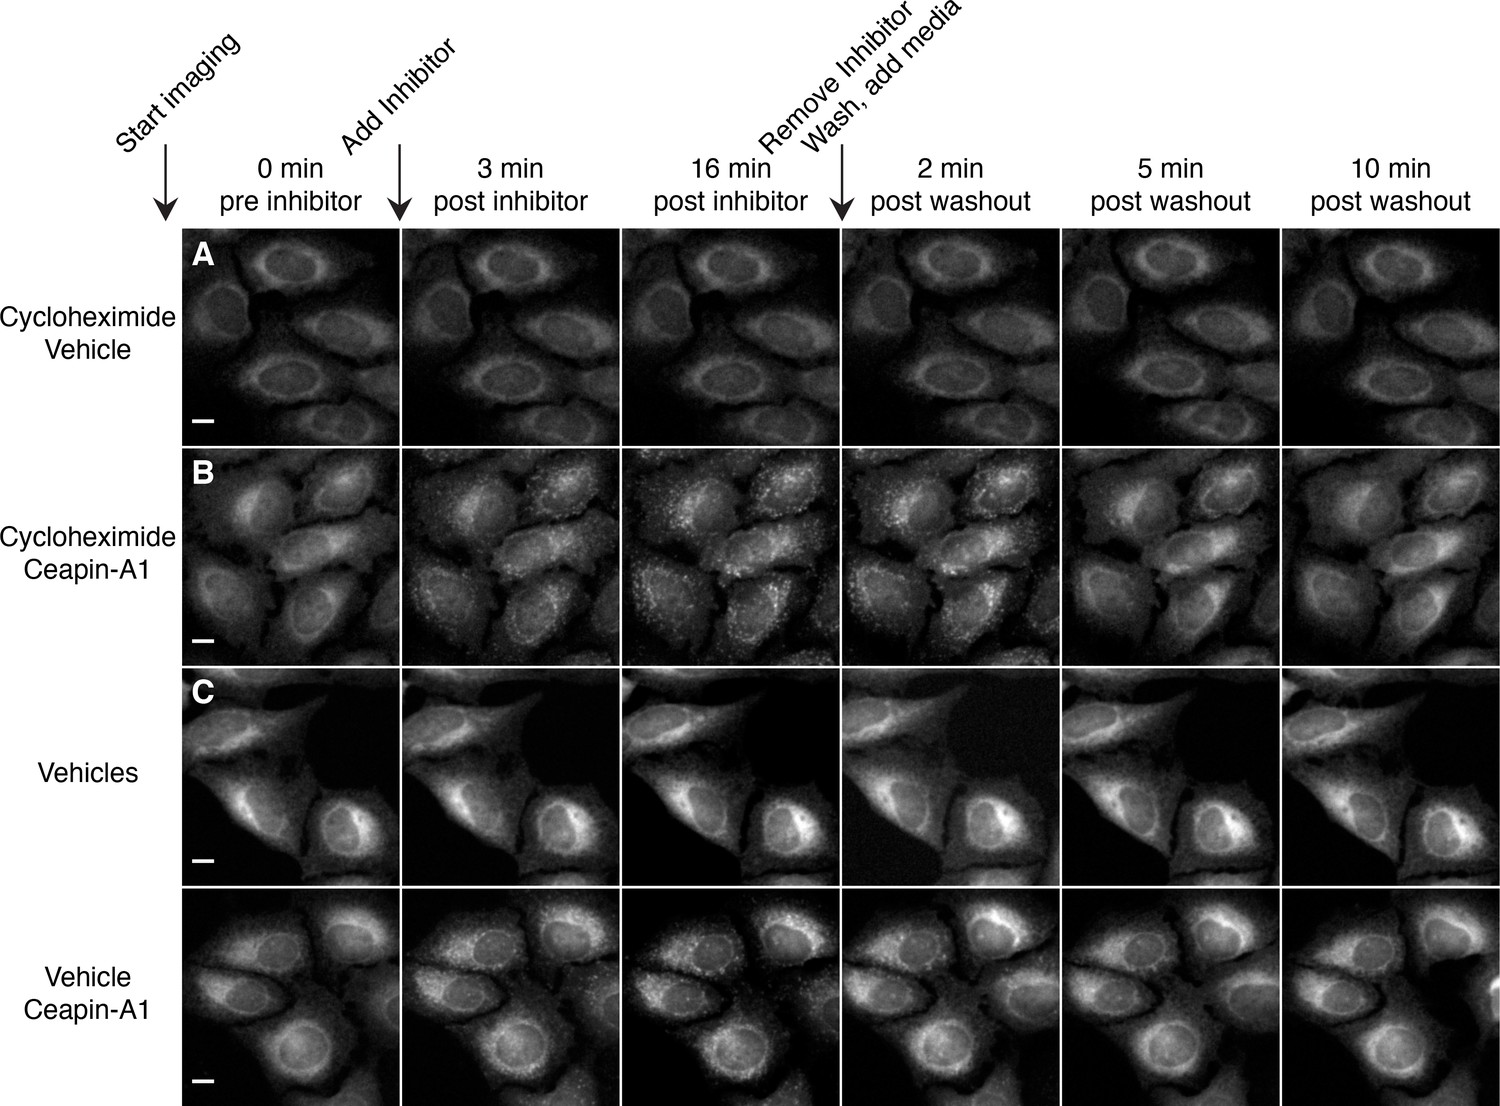
Redistribution of GFP-ATF6 from foci into the ER after washout of Ceapin-A1 does not require protein synthesis.
(A–D) Time-lapse images of U2-OS cells stably expressing GFP-ATF6α pretreated with either cycloheximide (A, B 0.1 μg/ml CHX) or vehicle (C, D ethanol) for three hours prior to imaging. During imaging, cells were treated either with vehicle (A, C DMSO) or Ceapin-A1 (B, D 10 μM Ceapin-A1) for sixteen minutes to allow foci formation. Cells were then washed once with PBS with (A, B) or without (C, D) cycloheximide and then media without compound with (A, B) or without (C, D) cycloheximide was added. Scale bar is 10 μm. Images are representative of three independent experiments where three positions per well were imaged for each experiment.
Figure 3
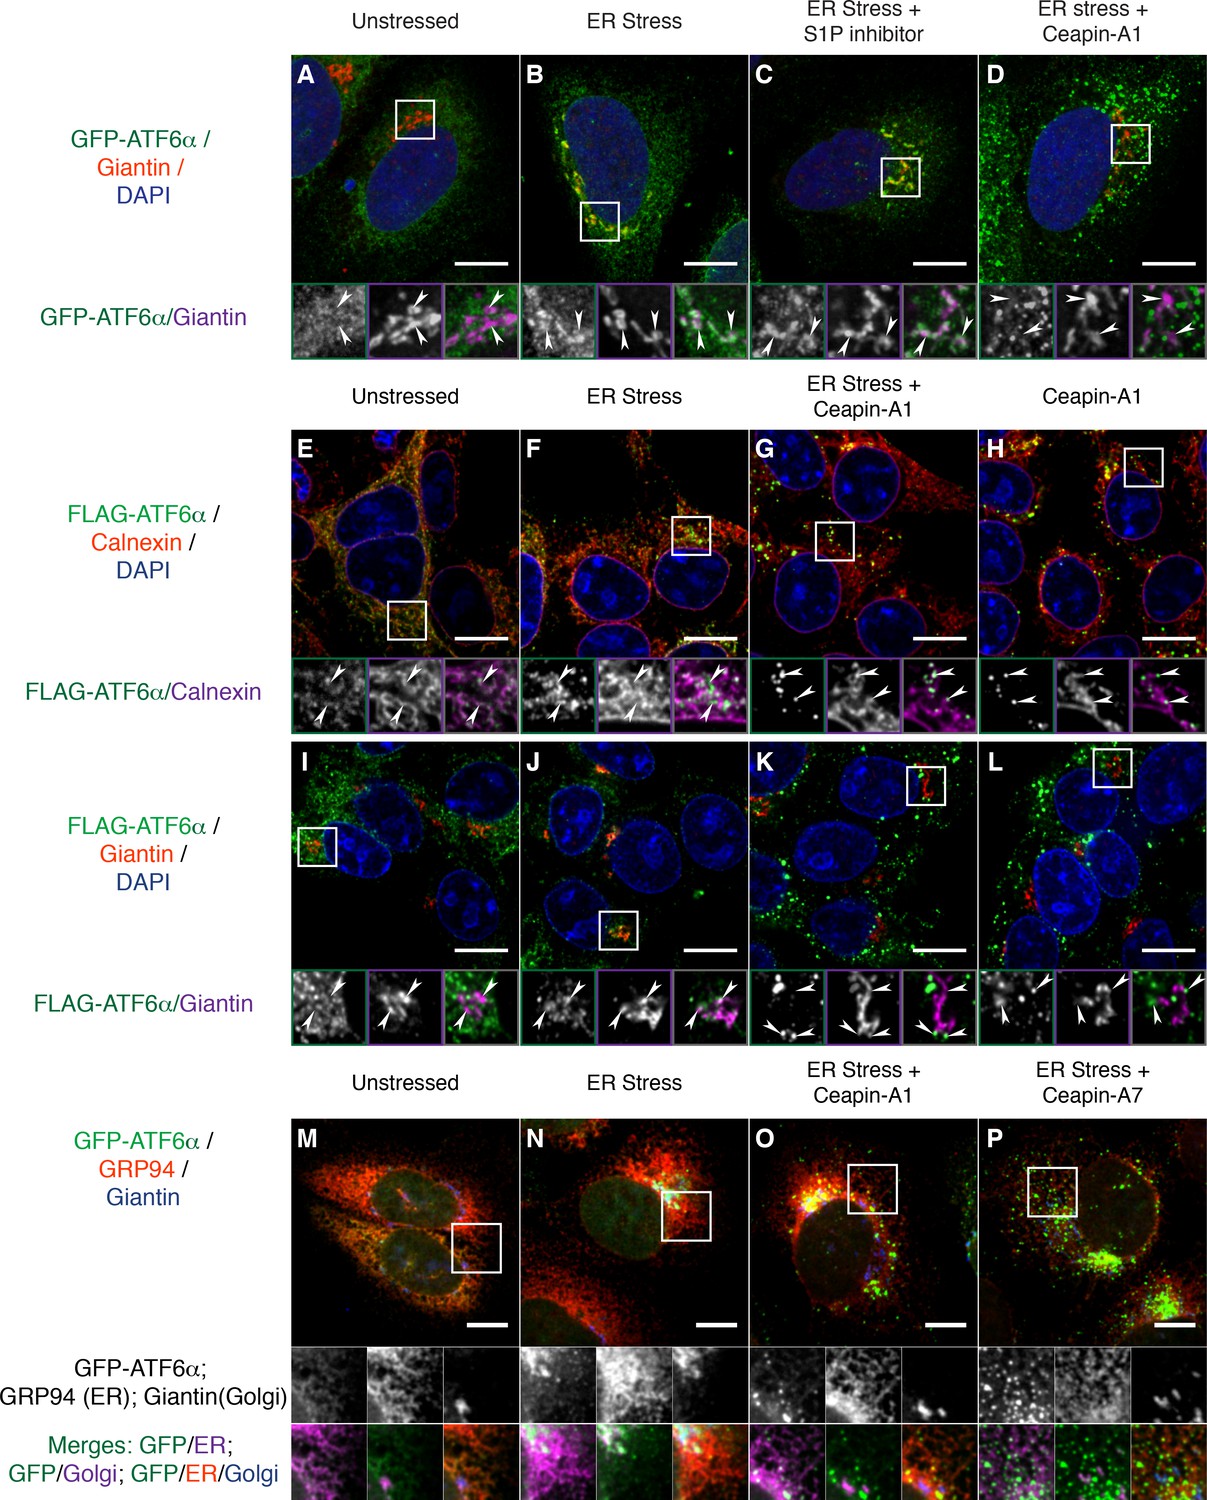
Ceapins retain tagged-ATF6α as foci in the ER and prevent trafficking of tagged ATF6α to the Golgi apparatus.
(A-–D) U2-OS cells stably expressing GFP-ATF6α were treated either with vehicle (A, DMSO), ER stress (B, 100 nM Tg), ER stress and site-1-protease inhibitor (C, 1 μM Pf-429242) or ER stress and Ceapin-A1 (D, 10 μM Ceapin-A1) for thirty minutes prior to fixation and fluorescent imaging of GFP-ATF6α (green), anti-Giantin to mark the Golgi apparatus (red in RGB, purple in GM insets) and DNA (blue). (A) Unstressed cells have minimal co-localization of GFP-ATF6α and Giantin. (B) ER stress induces trafficking of GFP-ATF6α to the Golgi apparatus where it colocalizes with Giantin. (C) ER stress combined with the site-1 protease inhibitor inhibits cleavage of GFP-ATF6α in the Golgi apparatus causing GFP-ATF6α to accumulate there. (D) ER stress combined with Ceapin-A1 shows minimal colocalization of GFP-ATF6α with Giantin, indicating GFP-ATF6α has not trafficked to the Golgi apparatus in the presence of the Ceapin-A1. (E–L) 293 T-REx cells stably expressing doxycycline inducible 3xFLAG-ATF6α were treated either with vehicle (E,I, DMSO), ER stress (F,J, 100 nM Tg), ER stress and Ceapin-A1 (G,K, 5 μM Ceapin-A1) or Ceapin-A1 alone (H,L, 5 μM Ceapin-A1) for thirty minutes prior to fixation and fluorescent imaging of 3xFLAG-ATF6α (green) and DNA (blue) and either an ER marker Calnexin (E–H, red in RGB, purple in GM inset) or a Golgi apparatus marker Giantin (I–L, red in RGB, purple in GM inset). ER stress induced Golgi trafficking of 3xFLAG-ATF6α (J, arrowheads) is prevented by the addition of the Ceapin-A1 (K). Ceapin-A1 either in combination with ER stress (G) or alone (H) induces formation of 3xFLAG-ATF6α foci that co-localize with ER tubules (arrowheads). (M–P) U2-OS cells stably expressing GFP-ATF6α were treated either with vehicle (M, DMSO), ER stress (N, 100 nM Tg), ER stress and active Ceapin analogs (O, 5 μM Ceapin-A1), (P, 5 μM Ceapin-A7). After time-lapse imaging for 2.4 hr, cells were fixed and stained for GFP-ATF6α (green), anti-GRP94 to mark the ER (red) and anti-Giantin to mark the Golgi apparatus (blue). ER stress induced trafficking to the Golgi apparatus (N) is blocked by the Ceapin analogs, and the induced GFP-ATF6α foci remain co-localized with ER tubules even after almost 2.5 hr of ER stress (O,P). Note that fixation conditions to visualize the ER and Golgi apparatus are not suitable for imaging the nuclear translocated fraction of GFP-ATF6α (see Materials and methods). Higher magnification panels underneath each image show each channel singly in greyscale (middle row), pairwise merges bottom row) of GFP-ATF6α (green) with either ER (magenta, bottom left) or Golgi markers in (magenta, and triple merge (bottom row, right) of GFP-ATF6α (green), ER (red) and Golgi (blue). In each panel, scale bars are 10 μm and boxed inserts are 7 x 7 μm (A–L) or 11.8 x 11.8 μm (M–P).
Figure 4
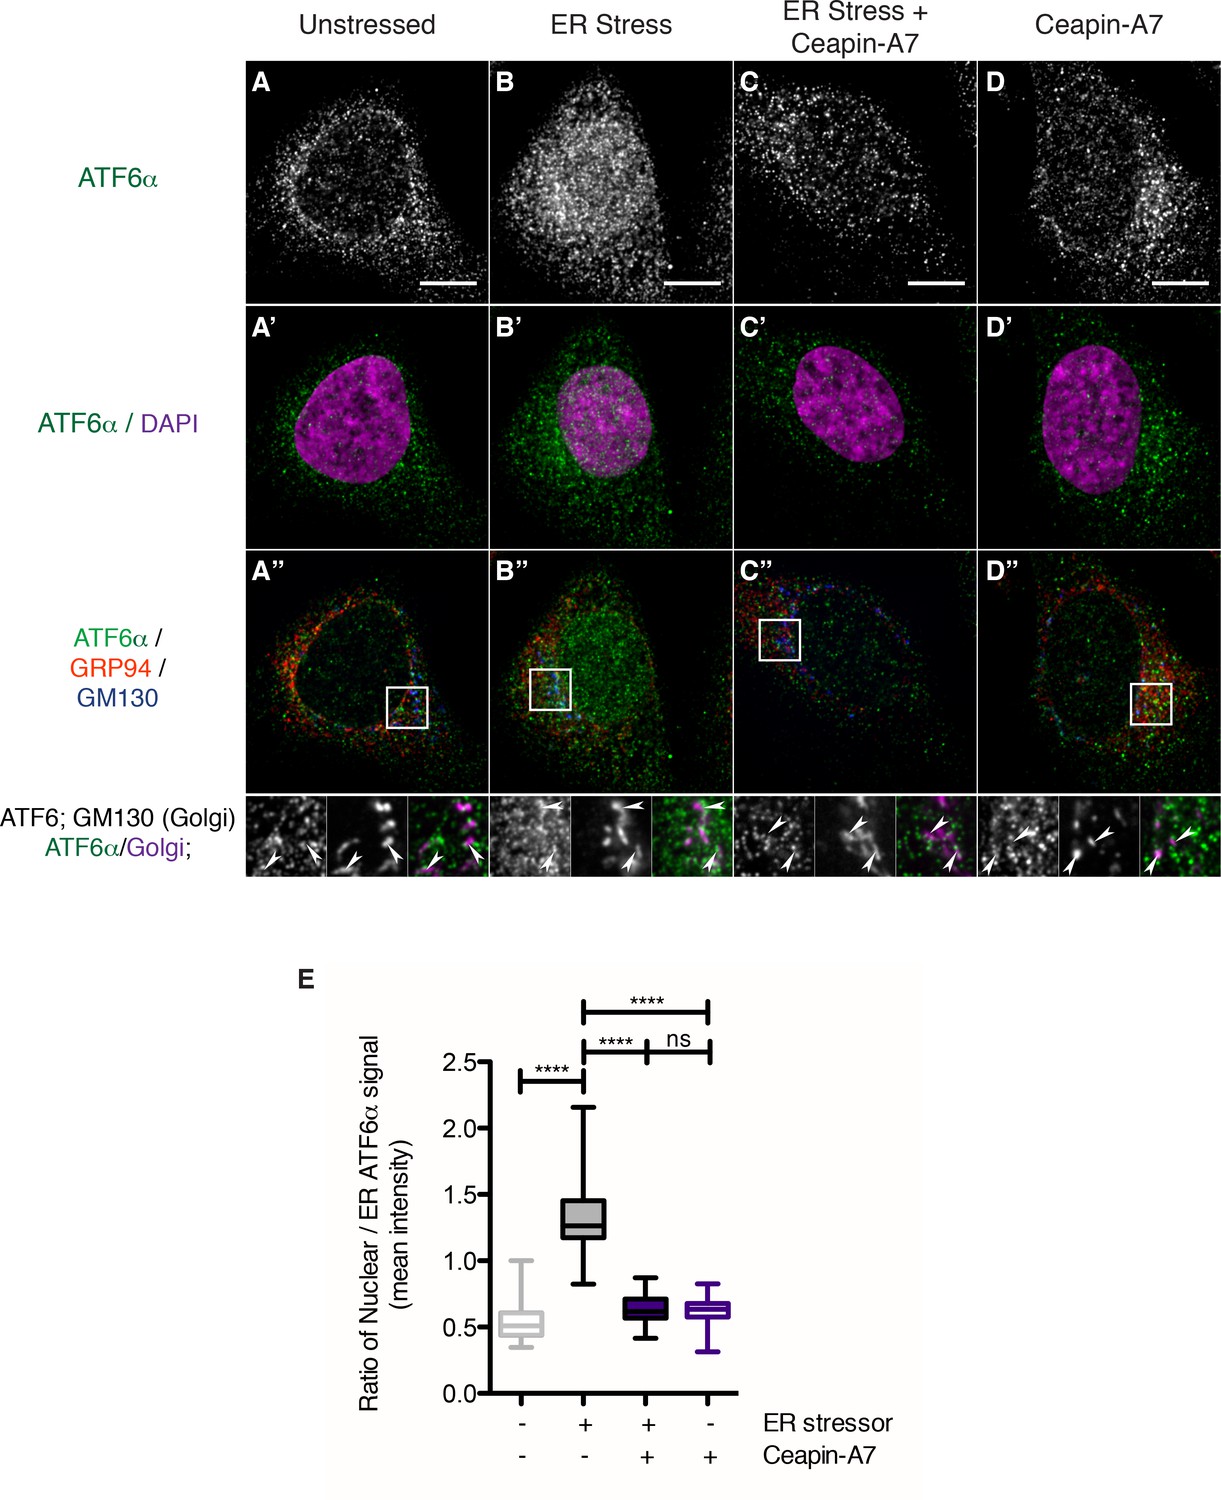
Endogenous ATF6α is in foci in unstressed cells and these foci are not changed by Ceapin-A7 either in the presence or absence of ER stress.
(A–D) Nuclear translocation of endogenous ATF6α in response to ER stress is inhibited by Ceapin-A7. U2-OS cells treated with either vehicle (A, A’,A”) or ER stress (100 nM Tg), in the absence (B,B’,B”) or presence of Ceapin-A7 (C,C’,C”, 6 μM Ceapin-A7) or with Ceapin-A7 alone (D,D’,D”) for two hours prior to fixation and fluorescent imaging of endogenous ATF6, anti-GM130 to mark the Golgi apparatus, GRP94 to mark the ER and DAPI to mark DNA. (A–D) Greyscale images of ATF6α for each treatment. (A’–D’) Merged images of ATF6α (green) and nuclear staining (purple). (A”–D”) Triple color merges of ATF6α (green) with ER (GRP94, red) and Golgi markers (GM130, blue). Boxed insets in (A”–D”) are shown below either as greyscale images of each channel (top row) or double (green/magenta) or triple (green/red/blue) merged images (bottom row). White arrows in boxed inserts point to Golgi staining. Scale bar is 10 μm and boxed inserts are 7 x 7 μm. (E) Quantification of nuclear translocation of endogenous ATF6. Plotted is the ratio of nuclear to ER intensity of ATF6α signal per cell as a box plot, whiskers are minimum and maximum values of the data. Statistics show the results of unpaired, two-tailed t-tests between indicated groups. Data plotted is from one of two independent experiments, each with at least twenty cells per treatment group.
Figure 5

Collapsing the Golgi apparatus on to the ER restores cleavage of 3xFLAG-ATF6α in the presence of Ceapins.
(A) 293 T-REx cells stably expressing doxycycline inducible 3xFLAG-ATF6α were treated either with vehicle (ethanol) or Brefeldin A (5 μg/mL BFA) in the absence or presence of increasing concentrations of either S1P inhibitor (Pf-429242) or active (Ceapin-A1, Ceapin-A3) or inactive (Ceapin-A5) Ceapin analogs for one hour prior to harvesting lysates for Western Blot analysis of 3xFLAG-ATF6α. (B) 293 T-REx cells stably expressing doxycycline inducible 3xFLAG-ATF6α were treated either with vehicle (DMSO) or ER stressor (100 nM Tg) in the absence or presence of increasing concentrations of either S1P inhibitor (Pf-429242) or active (Ceapin-A1, Ceapin-A3) or inactive (Ceapin-A5) Ceapin analogs for one hour prior to harvesting lysates for Western Blot analysis of 3xFLAG-ATF6α. For both A and B inhibitor concentrations were 0.5, 5, 15, 25 μM respectively. GAPDH is shown as a loading control. Black arrowheads – 3xFLAG-ATF6α, white arrowheads – 3xFLAG-ATF6α-N. White lines in A indicate where intervening lane has been removed.
Figure 6 with 1 supplement
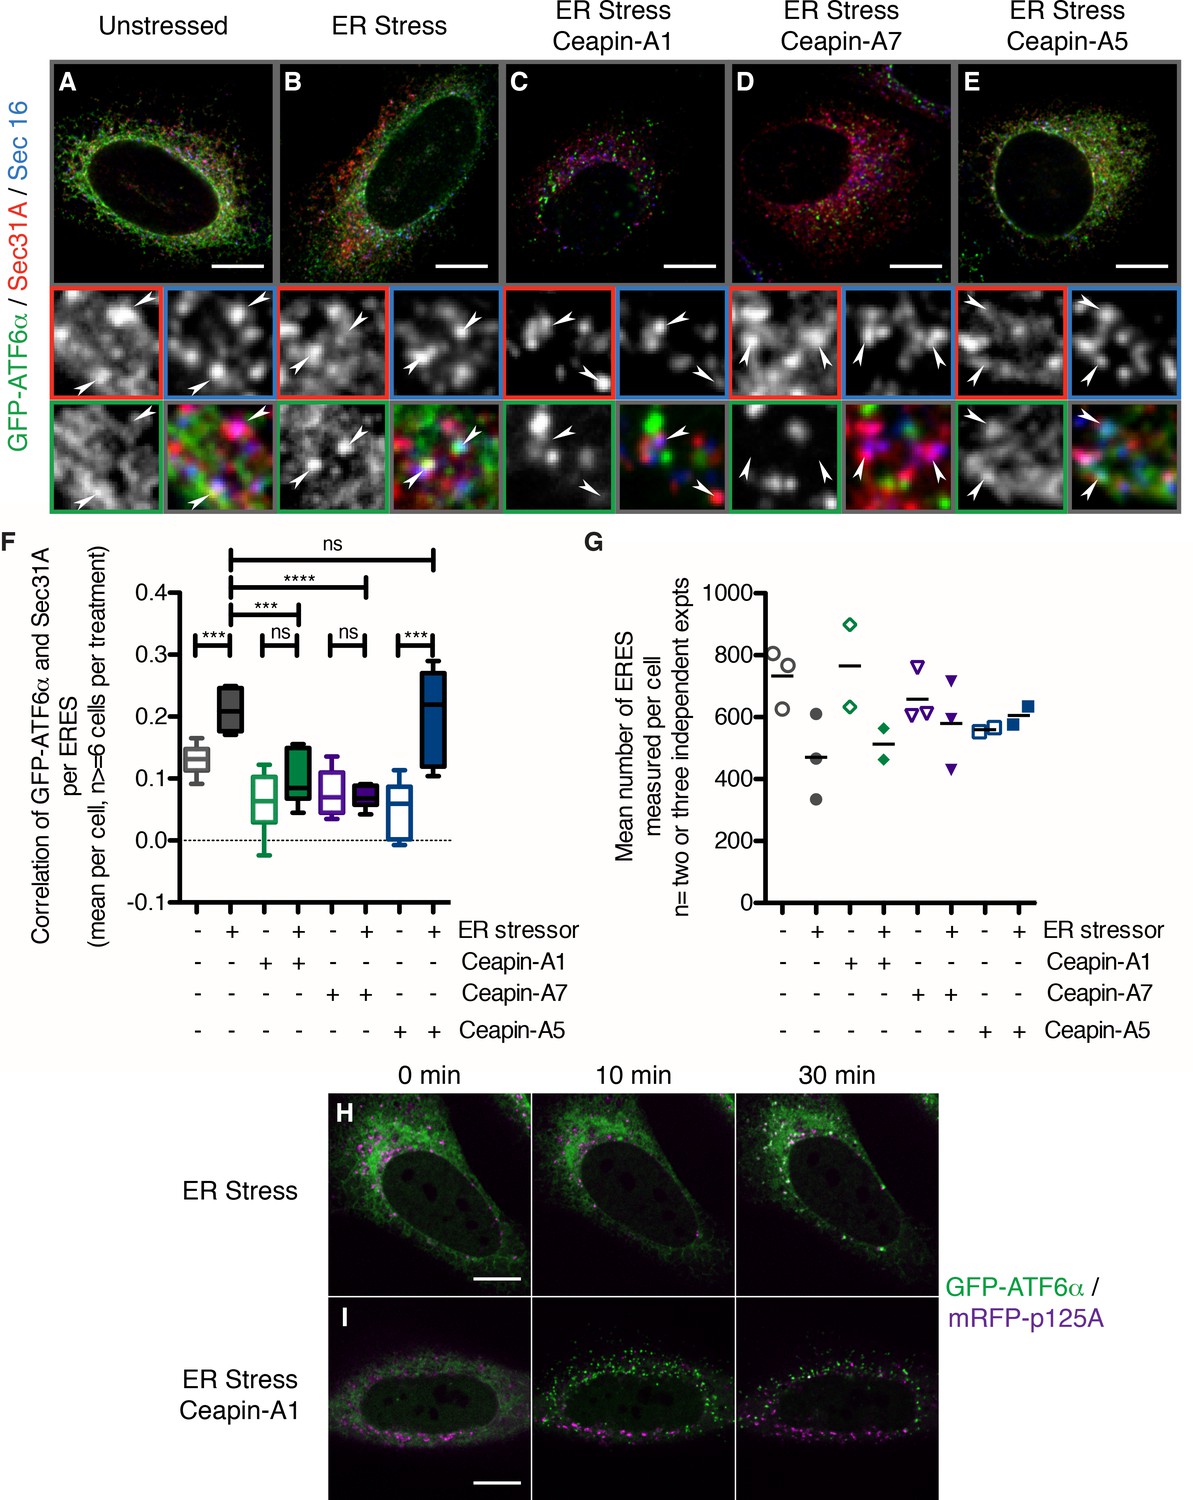
In the presence of Ceapins, GFP-ATF6α is no longer selected for transport from the ER in COP II vesicles.
(A–E). U2-OS cells stably expressing GFP-ATF6α were treated either with vehicle (A, DMSO), or ER stressor (B, 100 nM Tg), in the absence or presence of either active (C, 10 μM Ceapin-A1, D, 1 μM Ceapin-A7) or inactive (E, 10 μM Ceapin-A5) Ceapin analogs for thirty minutes prior to fixation and fluorescent imaging of GFP-ATF6α (green), the COP II outer coat component Sec31A (red), the transmembrane ER exit site marker Sec16 (blue) and GRP94 to mark the ER (not shown). Punctae containing both Sec31A and Sec16 were denoted ER exit sites (ERES) and are marked with arrowheads in the inserts. Scale bar is 10 μm. Inserts are 3.3 μm x 3.3 μm or 39x zoom of lower magnification images. Note that the exposure times for GFP signal that is diffuse throughout the ER are not the same as those for GFP-ATF6α in foci (see Materials and methods). (F) Quantification of the correlation of GFP-ATF6α with Sec31A within Sec31A / Sec16 positive ERES for a single experiment where for at least 6 cells per condition, each cell imaged as a stack of 6 slices. Plotted is the mean and standard deviation of the mean per cell correlation of GFP-ATF6α and Sec31A. Statistical analysis used unpaired two-tailed t-tests. *** indicates p< 0.0009, **** indicates p= 0.0001, ns stands for non-significant. Variances were not different between treatments (F test). (G) The mean number of ERES analyzed per cells. Plotted is mean number of ERES measured per cell from either two or three independent experiments. None of the treatments were reproducibly statistically significantly different from each other. (H-I) Time lapse images of U2-OS cells stably expressing GFP-ATF6α (green) and transiently transfected with mRFP-p125A (purple) to mark ERES. Cells were treated with ER stressor (100 nM Tg) in the absence (H) or presence (I) of Ceapin-A7 and images were acquired at one frame every five minutes. Scale bar is 10 μm. Images are representative of at least three independent experiments.
Figure 6—figure supplement 1
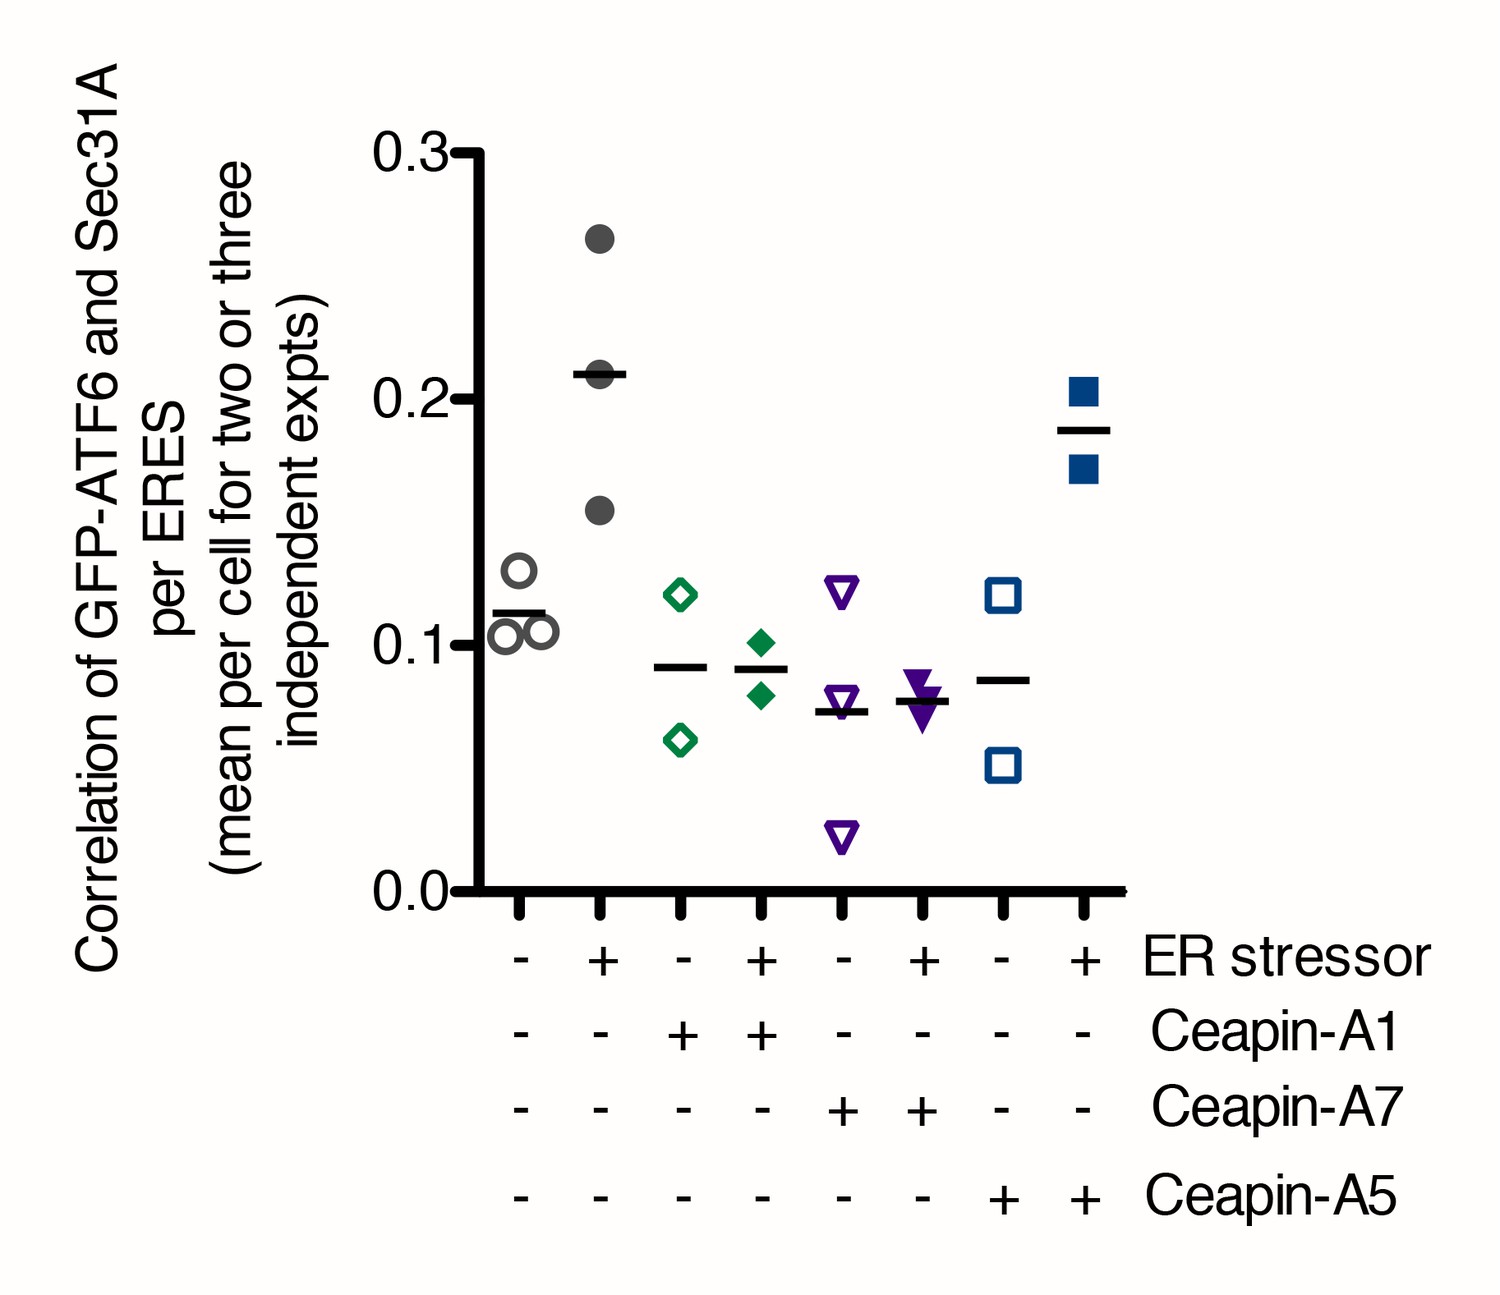
In the presence of Ceapins, GFP-ATF6 is no longer selected for transport from the ER in COP II vesicles.
Quantification of the correlation of GFP-ATF6α with Sec31A within Sec31A / Sec16 positive ERES for a two or three independent experiments. Plotted is the mean per experiment of the mean per cell correlation of GFP-ATF6α and Sec31A. For each treatment, at least 41 cells per treatment (three experiments) or 21 cells per treatment (two experiments) in total were analyzed.
Figure 7
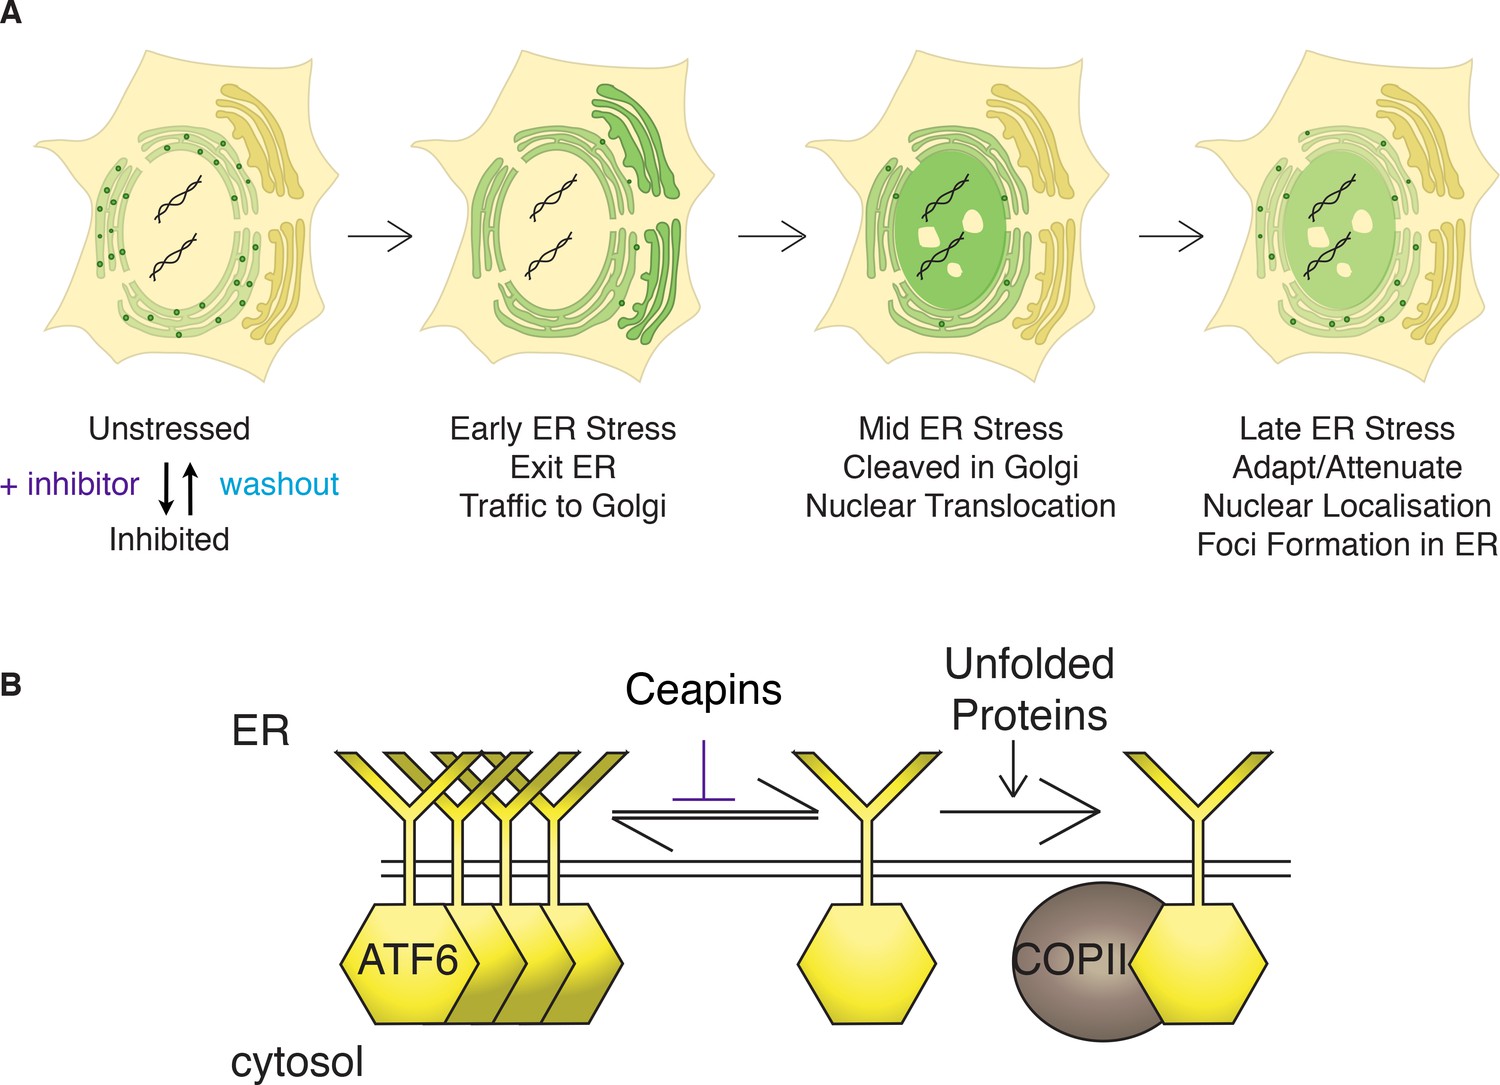
Model: Ceapins trigger an oligomeric state of ATF6α resembling the adapted / attenuated state.
(A) Ceapin treatment inhibits COPII-mediated trafficking of ATF6a from the ER to the Golgi. In unstressed cells, ATF6α is in foci in the ER. Upon ER stress, ATF6a moves from the ER to the Golgi, where it is proteolyzed to release ATF6α-N that translocates to the nucleus and activates transcription of ATF6α target genes. After prolonged ER stress ATF6α signaling attenuates and ATF6α foci are seen in the ER. The appearance and stability of these foci are increased by Ceapin treatment in the absence or presence of ER stress. (B) In this model, Ceapin treatment stabilizes the inactive or attenuated form of ATF6a, which we hypothesize is an oligomeric state of ATF6α. In contrast, the monomeric form is stabilized by unfolded proteins and this form is capable of binding to the COPII coat and exiting the ER upon ER stress.
Videos
Video 1
GFP-ATF6α expressing U2-OS cells treated with vehicle.
https://doi.org/10.7554/eLife.11880.007
Video 2
GFP-ATF6α expressing U2-OS cells treated with ER stressor.
https://doi.org/10.7554/eLife.11880.008
Video 3
GFP-ATF6α expressing U2-OS cells treated with ER stressor and Ceapin-A1.
https://doi.org/10.7554/eLife.11880.009
Video 4
GFP-ATF6α expressing U2-OS cells treated with ER stressor and Ceapin-A7.
https://doi.org/10.7554/eLife.11880.010
Video 5
GFP-ATF6α expressing U2-OS cells treated with Ceapin-A1.
https://doi.org/10.7554/eLife.11880.011
Video 6
GFP-ATF6α expressing U2-OS cells treated with Ceapin-A7.
https://doi.org/10.7554/eLife.11880.012
Video 7
Addition and washout of vehicle to GFP-ATF6α expressing cells.
https://doi.org/10.7554/eLife.11880.015
Video 8
Addition and washout of Ceapin-A1 to GFP-ATF6α expressing cells.
https://doi.org/10.7554/eLife.11880.016
Video 9
Addition and washout of Ceapin-A7 to GFP-ATF6α expressing cells.
https://doi.org/10.7554/eLife.11880.017
Video 10
Addition and washout of vehicle to GFP-ATF6α expressing cells pretreated with vehicle.
https://doi.org/10.7554/eLife.11880.018
Video 11
Addition and washout of Ceapin-A1 to GFP-ATF6α expressing cells pretreated with vehicle
https://doi.org/10.7554/eLife.11880.019
Video 12
Addition and washout of vehicle to GFP-ATF6α expressing cells pretreated with cycloheximide.
https://doi.org/10.7554/eLife.11880.020
Video 13
Addition and washout of Ceapin-A1 to GFP-ATF6α expressing cells pretreated with cycloheximide.
https://doi.org/10.7554/eLife.11880.021Download links
A two-part list of links to download the article, or parts of the article, in various formats.
Downloads (link to download the article as PDF)
Open citations (links to open the citations from this article in various online reference manager services)
Cite this article (links to download the citations from this article in formats compatible with various reference manager tools)
Ceapins inhibit ATF6α signaling by selectively preventing transport of ATF6α to the Golgi apparatus during ER stress
eLife 5:e11880.
https://doi.org/10.7554/eLife.11880


