Recurring patterns in bacterioplankton dynamics during coastal spring algae blooms
- Max Planck Institute for Marine Microbiology, Germany
- Alfred Wegener Institute for Polar and Marine Research, Germany
Figures
Figure 1
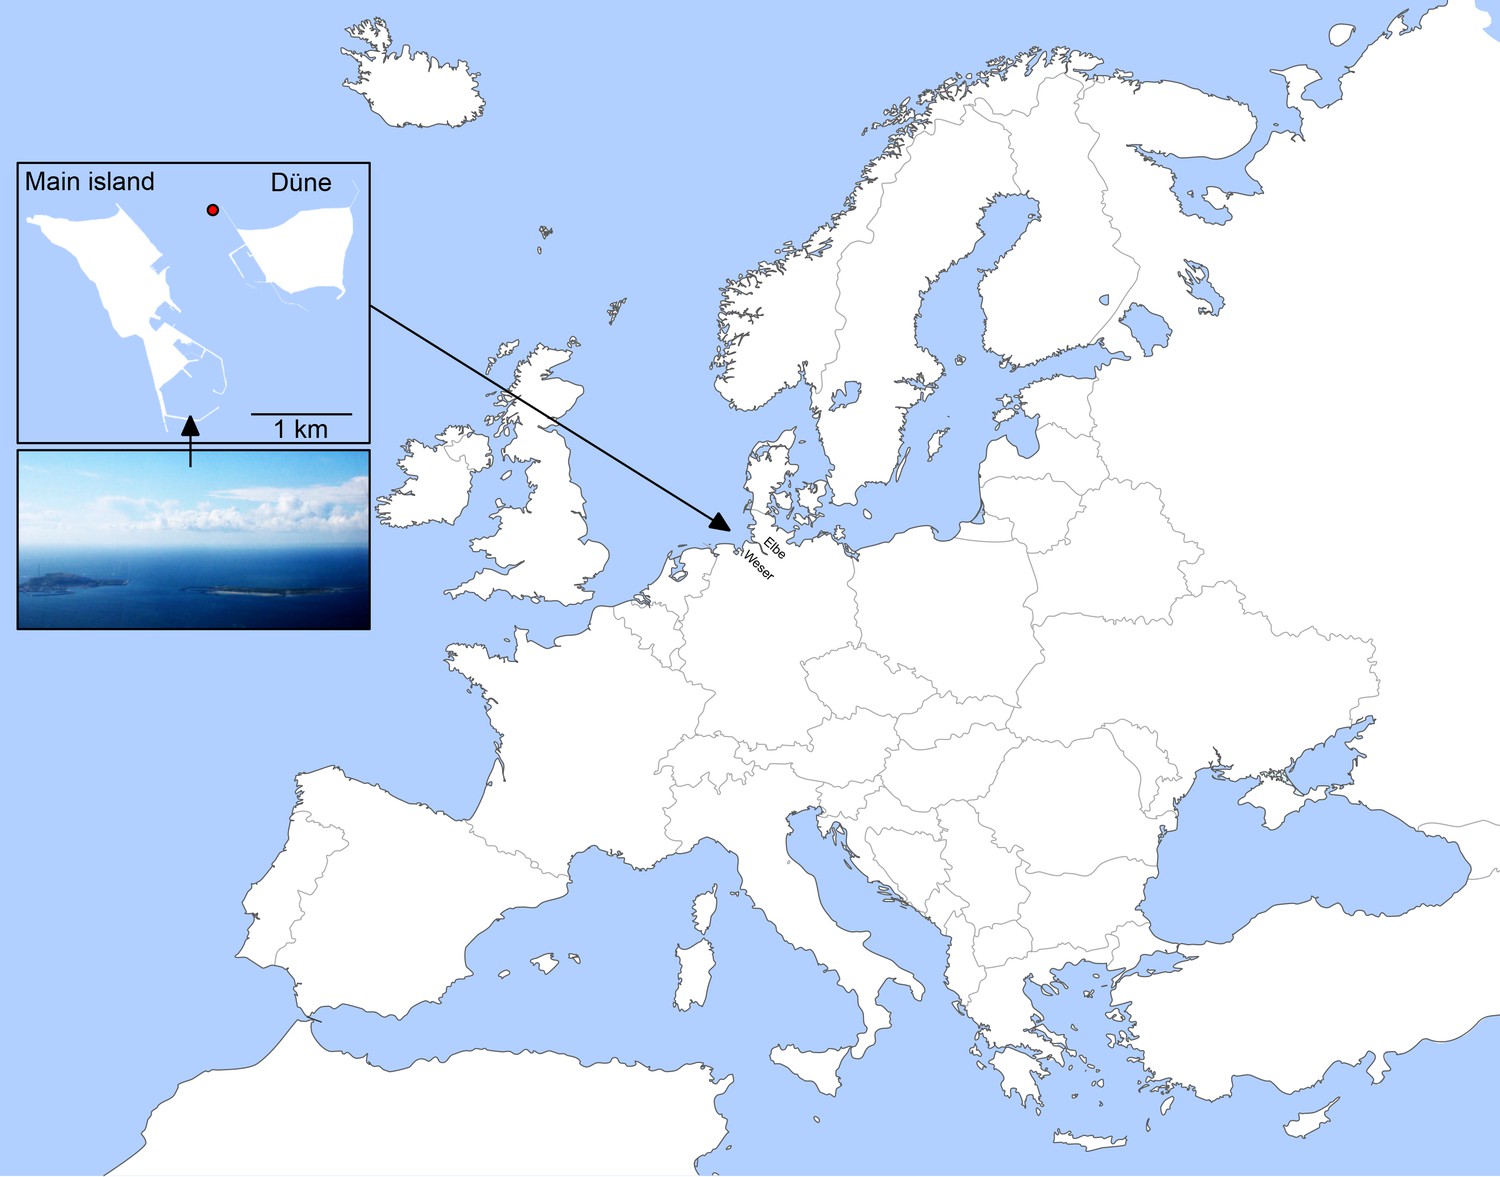
Location of Helgoland Island (ca. 40 km offshore the northern German coastline) and the long-term ecological research site 'Kabeltonne' (red circle: 54° 11.3' N, 7° 54.0' E) in the German Bight of the North Sea.
https://doi.org/10.7554/eLife.11888.003
Figure 2
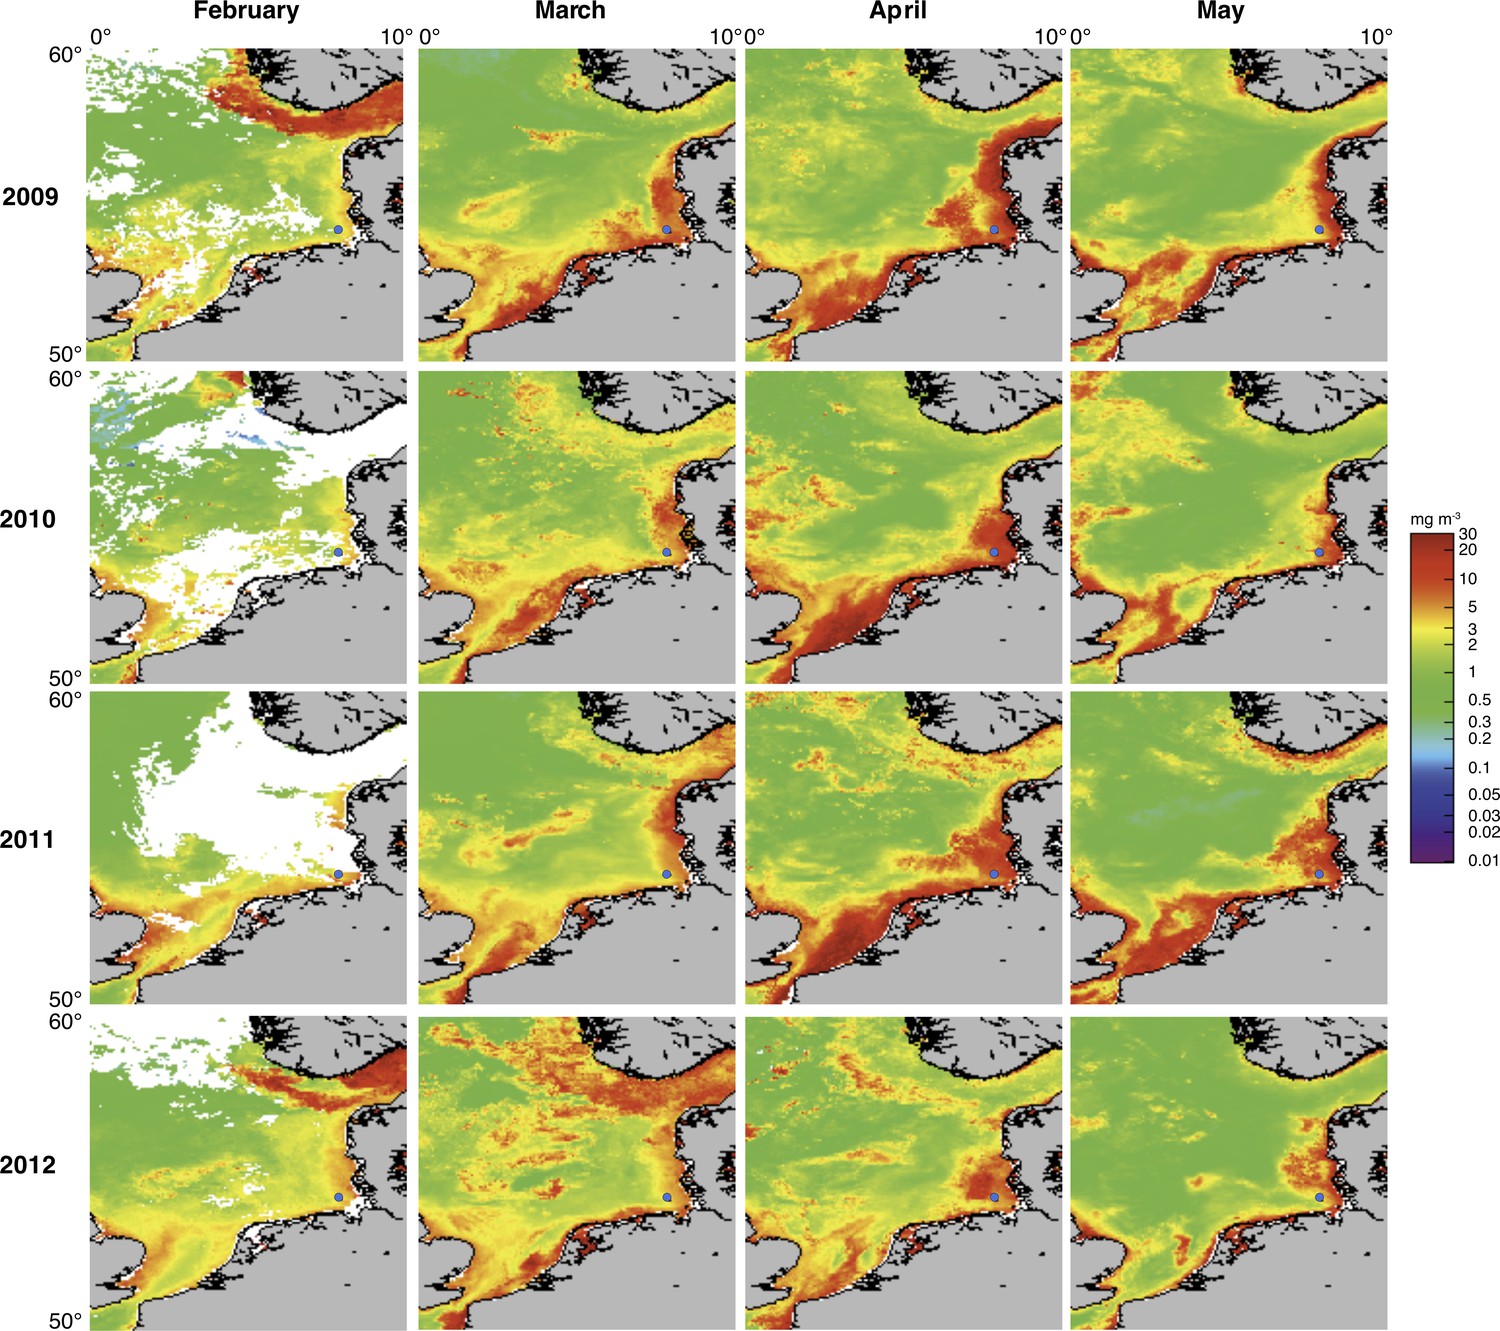
Satellite chlorophyll a measurements.
Data are shown for the southern North Sea for the months February to May (monthly averages) of the years 2009 to 2012. Images were retrieved from the GlobColour website using the ‘extended Europe area’ at full resolution (1 km) as merged products of weighted averages from the following sensors: MERIS, MODIS AQUA, SeaWIFS and VIIRS. See GlobColour website for details (http://hermes.acri.fr). The position of Helgoland Island is indicated by a blue dot.
Figure 3
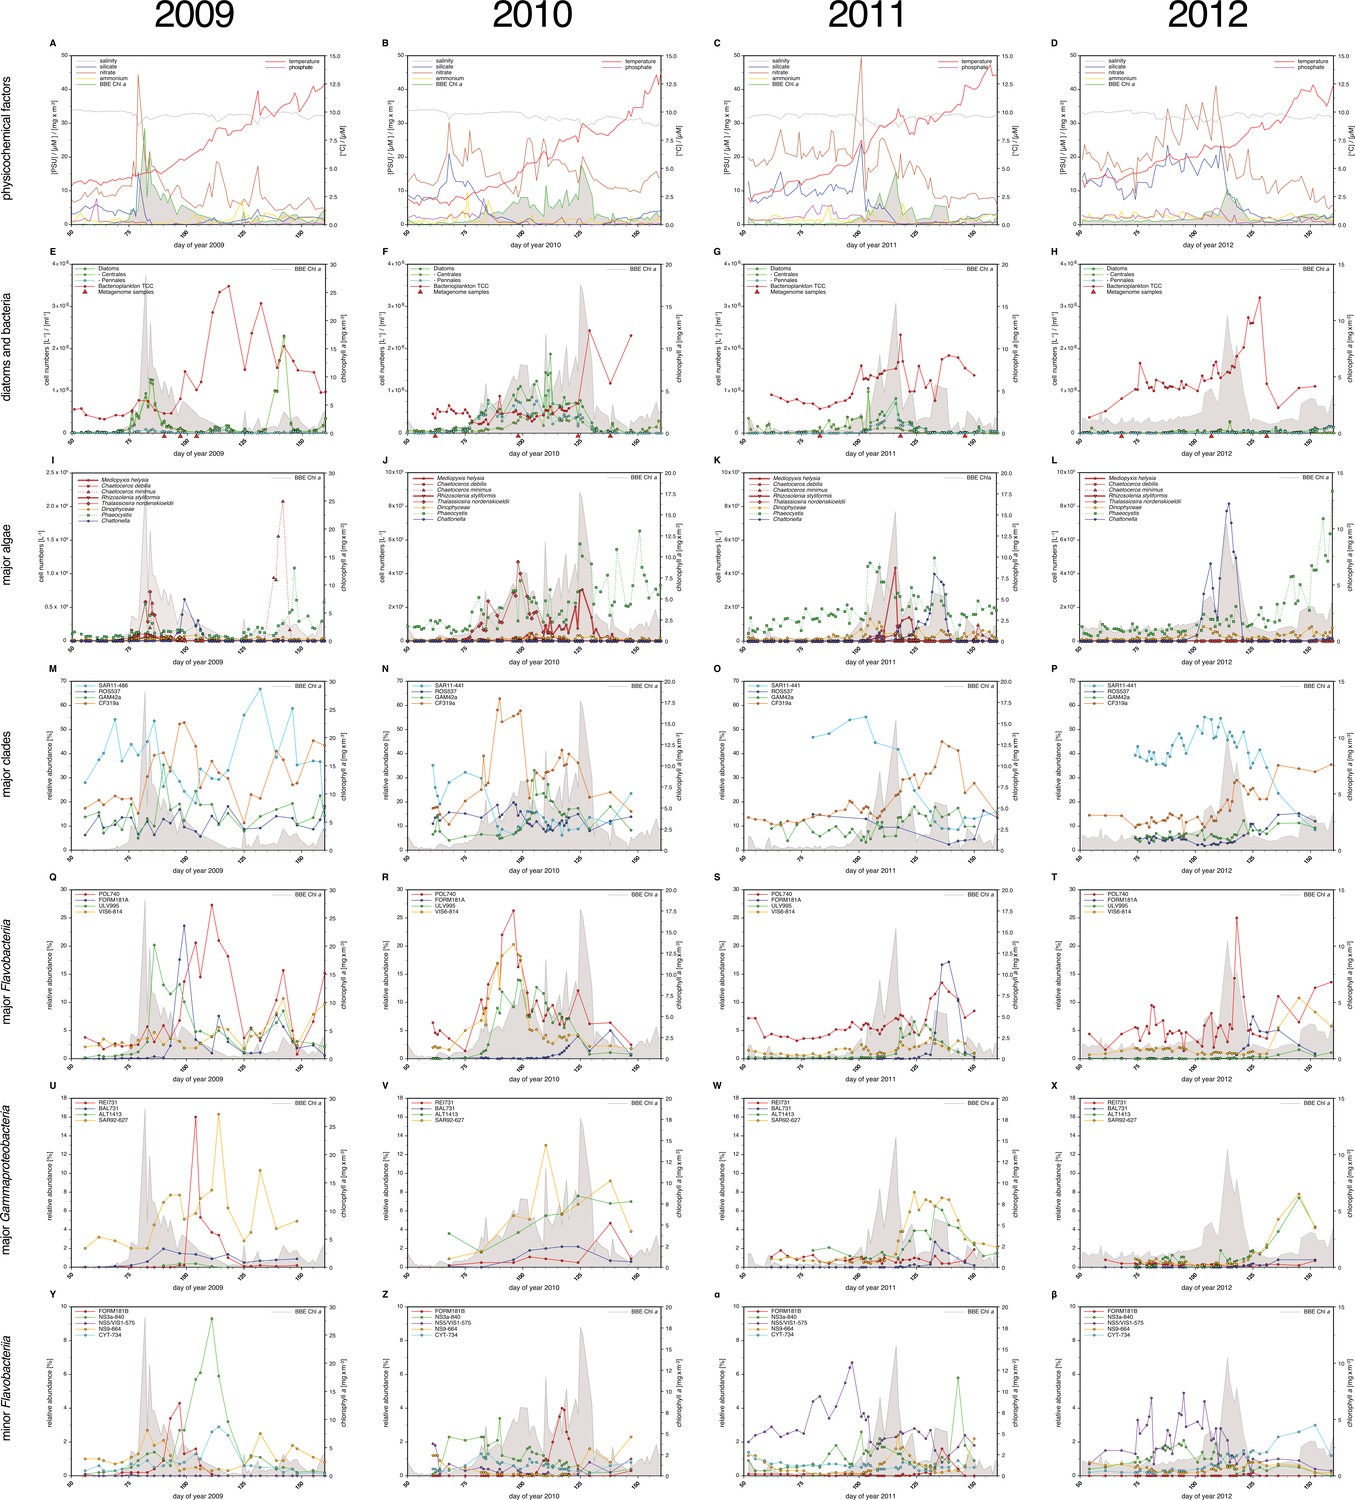
Physicochemical parameters, phytoplankton composition and bacterioplankton composition as assessed by CARD-FISH.
Sampling: Surface seawater samples were taken at the North Sea island Helgoland between the main island and the minor island 'Düne' (station 'Kabeltonne', 54°11'03''N, 7°54'00''E) using small research vessels (http://www.awi.de/en/expedition/ships/more-ships.html) and processed in the laboratory of the Biological Station Helgoland within less than two hours after sampling. Cells for microscopic visualization methods were first fixed by the addition of formaldehyde to sampled seawater, which was then filtered directly onto 0.2 µm pore sized filters. Physicochemical and phytoplankton data: Physicochemical parameters and phytoplankton data were assessed in subsurface water on a weekday basis as part of the Helgoland Roads LTER time series as described in Teeling et al. (2012). The Helgoland Roads time series is accessible via the public database Pangaea (http://www.pangaea.de) and can be used to assess long-term changes of the North Sea pelagic ecosystem. Left-hand side legends correspond to ordinates on the left, and right-hand side legends to ordinates on the right. A-D: Physicochemical measurements including measurements of BBE Chl a (chlorophyll a fluorescence by algal group analyzer sensor). Left ordinate: salinity [PSU], silicate [µM], nitrate [µM], ammonium [µM] and chlorophyll a [mg/m3]; right ordinate: temperature [°C] and phosphate [µM]. E-H: Counts of the diatom groups. I-L: Microscopic cell counts of the most abundant algae genera (red: diatoms; orange: dinoflagellates: green: haptophytes; blue: silicoflagellates). Algae with large cells and thus large biovolumes are depicted by bold solid lines and algae with small cells are represented by dotted lines. Rhizosolenia styliformis and Mediopyxis helysia feature large cells, whereas Chaetoceros minimus and in particular Phaeocystis species feature small cells. The latter typically reaches lengths of below 10 µm and Phaeocystis spp. biovolumes therefore typically are hundreds to thousands fold smaller than those of R. styliformis and M. helyisa cells (Olenina, 2006; Loebl et al., 2013). Physicochemical data are summarized in Supplementary file 1, and data on the major phytoplankton clades in Supplementary file 2. Total cell counts and CARD-FISH of bacterioplankton: E-H: TCC (total cell counts); red triangles depict sampling of metagenomes. M-β: Recurrent bacterioplankton clades as assessed by CARD-FISH (Catalyzed Reporter Deposition-Fluorescence in situ Hybridization) with the following probes: M-P (major bacterial groups): SAR11-486 and SAR11-441: alphaproteobacterial SAR11-clade; ROS537: alphaproteobacterial Roseobacter clade; GAM42a: Gammaproteobacteria; CF319a: Bacteroidetes. Q-T (major Flavobacteriia clades): POL740: genus Polaribacter; FORM181A: genus Formosa; ULV995: genus Ulvibacter; VIS6-814: genus-level clade VIS6 within the family Cryomorphaceae-Owenweeksia; U-X (major Gammaproteobacteria clades): REI731: genus Reinekea; BAL731: genus Balneatrix; ALT1413: families Alteromonadaceae and Colwelliaceae; SAR92-627: genus-level clade SAR92. Y-β (minor Bacteroidetes clades): FORM181B: species-specific for Formosa sp. Hel1_33_131; NS3a-840: NS3 marine group; NS5/VIS1-575: VIS1 genus-level clade within the NS5 marine group; NS9-664: NS9 marine group; CYT-734: Cytophagia clade Marinoscillum. Total and CARD-FISH cell counts are summarized in Supplementary file 3 and the corresponding probes in Supplementary file 4.
Figure 4
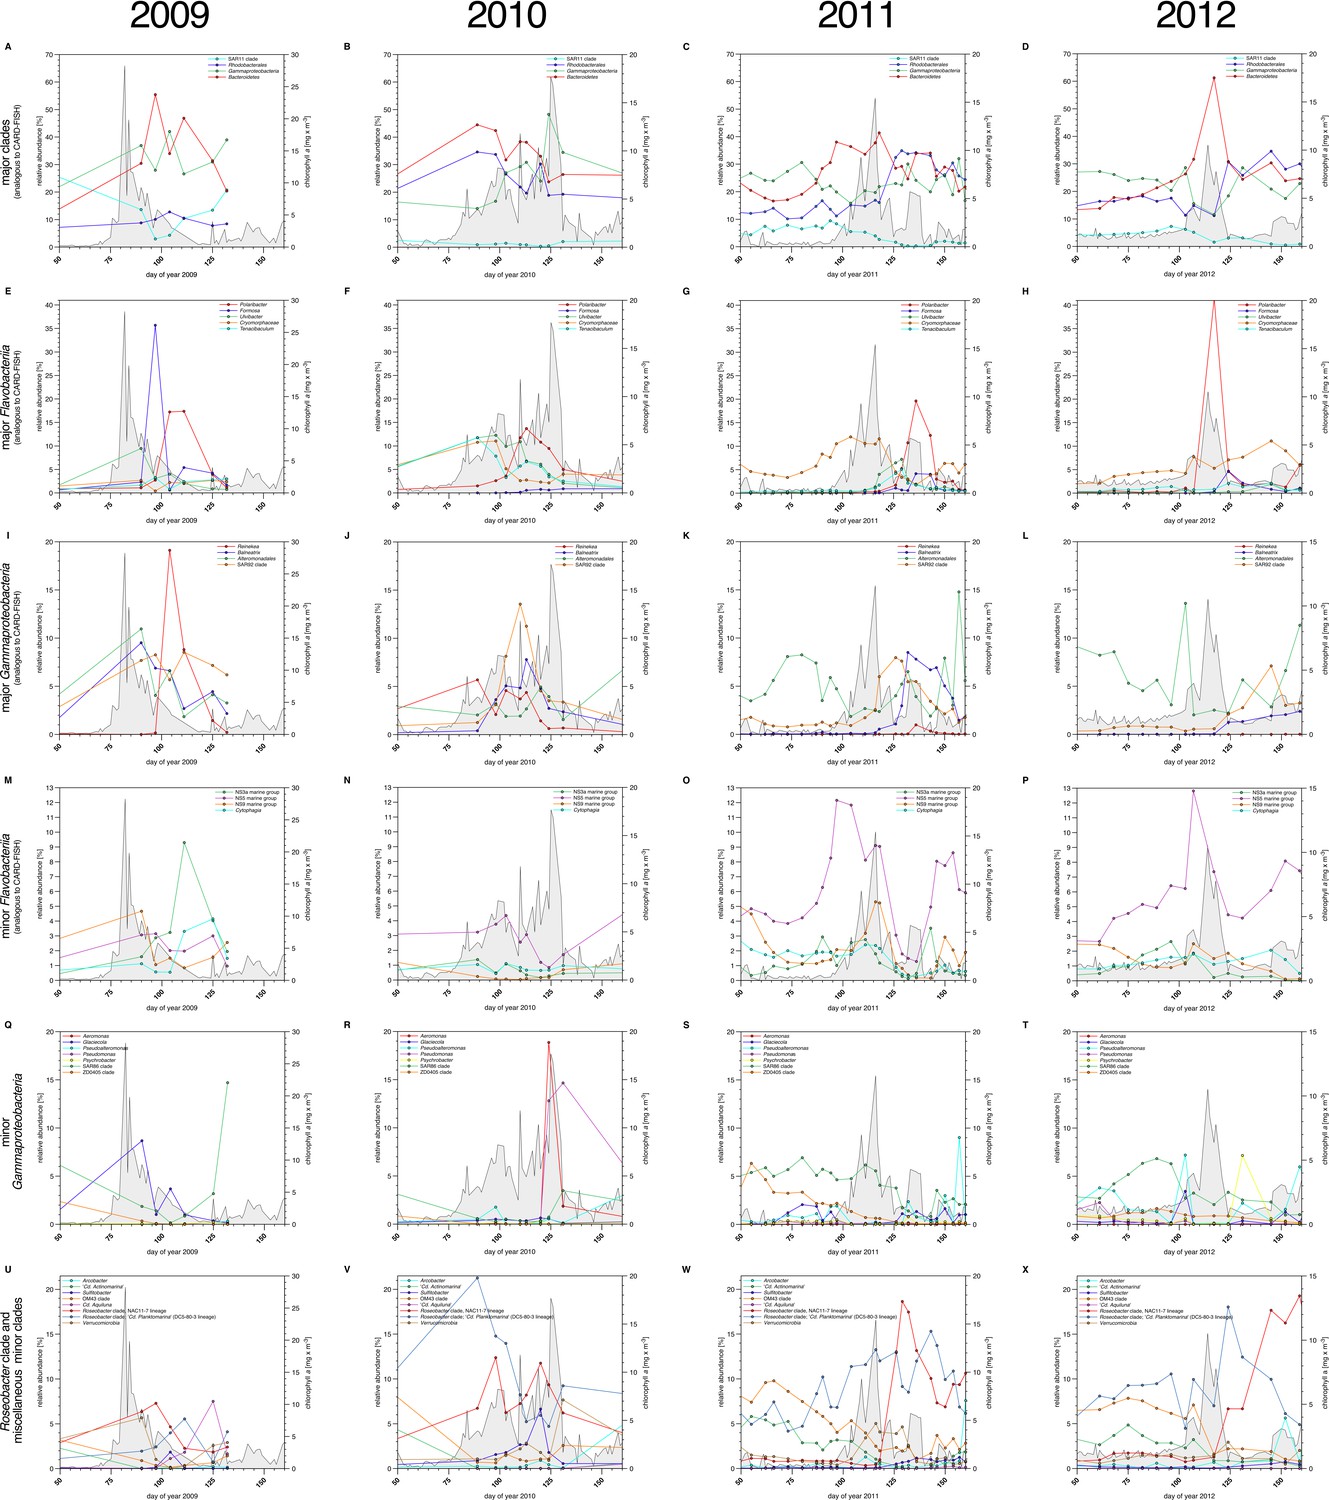
Bacterioplankton diversity as assessed by 16S rRNA gene tag sequencing.
Sampling: Surface seawater samples were taken at the North Sea island Helgoland between the main island and the minor island 'Düne' (station 'Kabeltonne', 54°11'03''N, 7°54'00''E) using small research vessels (http://www.awi.de/en/expedition/ships/more-ships.html) and processed in the laboratory of the Biological Station Helgoland within less than two hours after sampling. Biomass of free-living bacteria for DNA extraction was harvested on 0.2 µm pore sized filters after pre-filtration with 10 µm and 3 µm pore sized filters to remove large debris and particle-associated bacteria. Biomass of the 0.2–3 µm bacterioplankton fraction was used for DNA extraction and subsequent 16S rRNA gene tag sequencing. 16S rRNA gene tag sequencing: A total of 142 samples were collected for the years 2010 to 2012. After DNA extraction, the V4 region of the 16S rRNA gene was amplified using the primers 515F (5' GTGCCAGCMGCCGCGGTAA 3') and 806R (5' GGACTACHVGGGTWTCTAAT 3') (Caporaso et al., 2011). Sequencing was carried out on an Illumina (San Diego, CA, USA) MiSeq sequencer with and 2x250 bp chemistry. This dataset was complemented by 16S rRNA gene tags from 7 samples from our initial study on the 2009 spring bloom (Teeling et al., 2012). DNA of these samples was amplified using the primers 314F (5’ CCTACGGGNGGCWGCAG 3') and 805R (5’ GACTACHVGGGTATCTAATCC 3') (Herlemann et al., 2011) and sequenced on the 454 FLX Ti platform. Data analysis: All tag data were analyzed using the SILVAngs pipeline with the SILVA (Quast et al., 2013) v119 database. The SAR92 clade was subsequently reclassified to comply with the recently released SILVA v123, where the SAR92 no longer belong to the order Alteromonadales. The corresponding abundance data is summarized in Supplementary file 5. Time points from days 50 to 160 were plotted for all years. Panel A-P depict data that are analogous to the CARD-FISH data presented in Figure 3, with addition of the Flavobacteriia genus Tenacibaculum (E-H). Panels Q-X show minor Gammaproteobacteria clades (Q-T) and Roseobacter clades together with miscellaneous other minor clades (U-X) that were not tested by CARD-FISH probes.
Figure 5
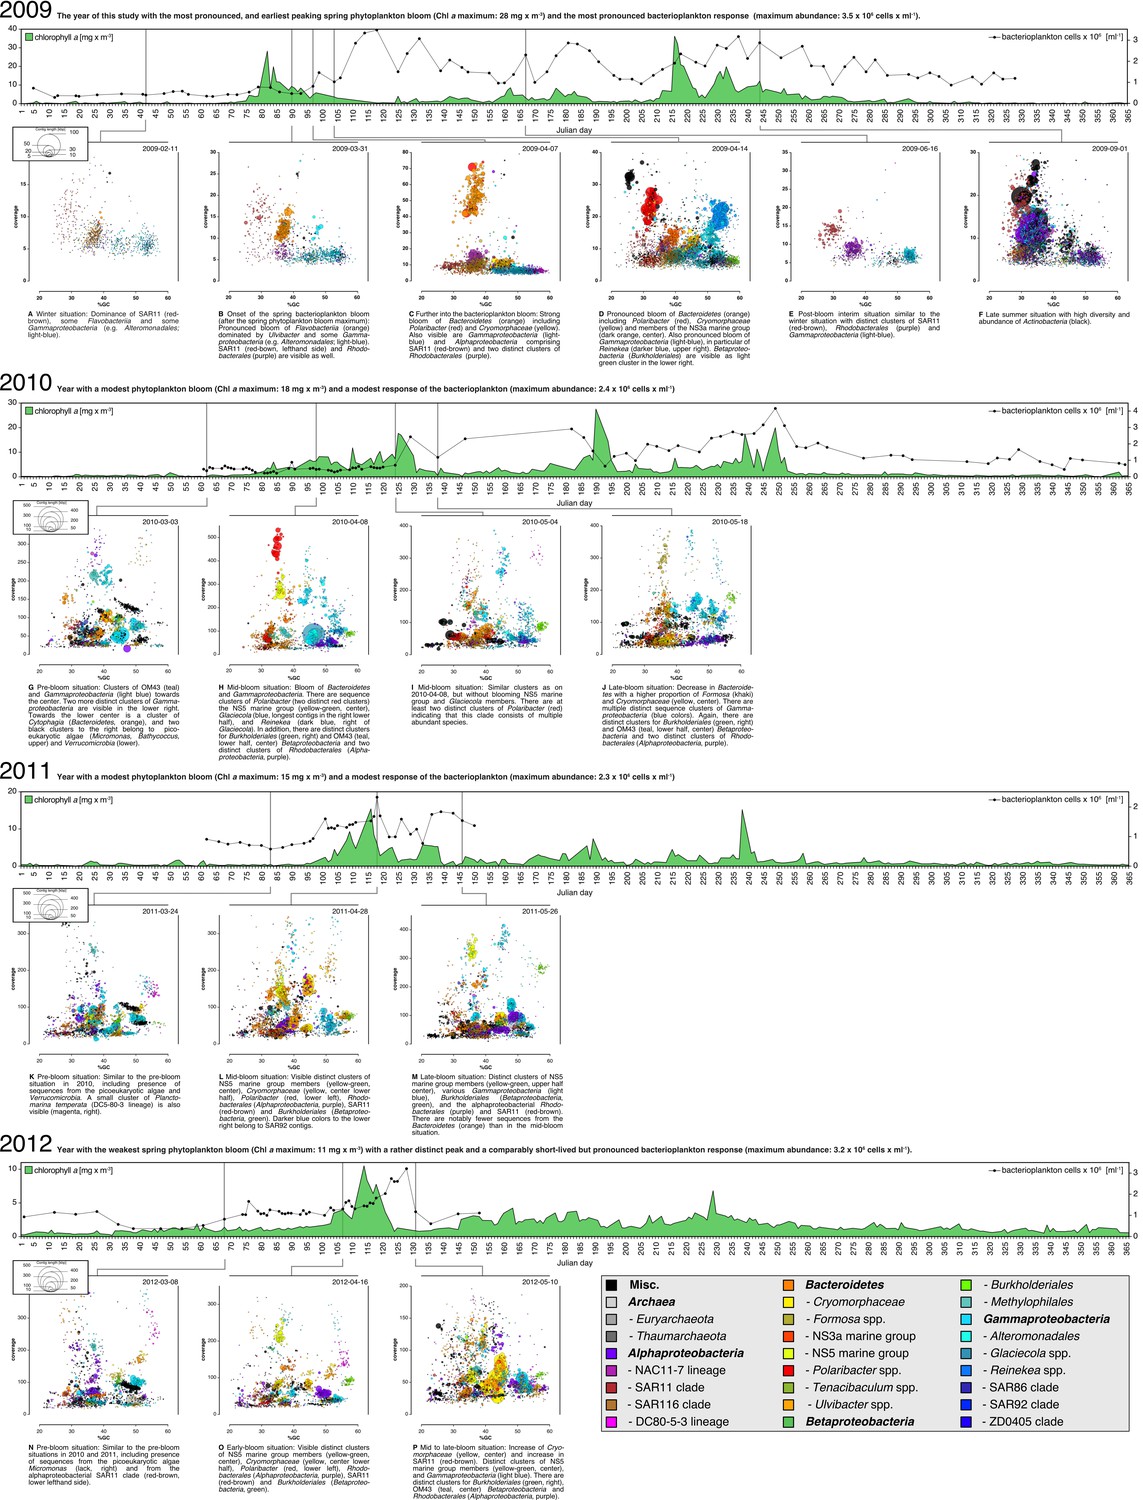
Taxonomic classification of bacterioplankton metagenomes
Sampling: Surface seawater samples were taken at the North Sea island Helgoland between the main island and the minor island 'Düne' (station 'Kabeltonne', 54°11.03' N, 7°54.00' E) and processed in the laboratory of the Biological Station Helgoland within less than two hours after sampling. Biomass of free-living bacteria was harvested on 0.2 µm pore sized filters after pre-filtration with 10 µm and 3 µm pore sized filters to remove large debris and particle-associated bacteria. Sequencing: Community DNA was extracted and sequenced; 2009 samples were sequenced on the 454 FLX Ti platform, and 2010-2012 samples on the Illumina HiSeq2000 platform (16 metagenomes in total). Reads were assembled using Newbler (2009) or a combination of SOAPdenovo and Newbler (2010-2012) and the resulting contigs were taxonomically classified (Supplementary file 9). Visualization: The resulting metagenome contigs are visualized as bubbles with radii that are proportional to their lengths and colors that indicate their predicted taxomomic affiliations. These bubbles are drawn in planes that are defined by the contig's GC contents and coverage values. Colors are restricted to selected abundant taxa (see legend below) to highlight distinct clusters, mostly from the Bacteroidetes, Alphaproteobacteria, Betaproteobacteria and Gammaproteobacteria. Likewise only contigs are shown that exceed a minimum length of 2750 bp for pyrosequencing data (2009) and 15,000 bp for llumina data (2010-2012), respectively. Sparse contigs with very high coverage or GC contents below 20% or above 60% were also excluded from visualizations. The 16 metagenomes are shown arranged in order on yearly timescales that depict chlorophyll a contents as proxies for phytoplankton abundance. Metagenome sizes*: 2009-02-11: 49.1 Mbp / 2009-03-31: 44.9 Mbp / 2009-04-07: 52.7 Mbp / 2009-04-14: 96.0 Mbp / 2009-06-16: 29.8 Mbp / 2009-09-01: 79.2 Mbp 2010-03-03: 537.3 Mbp / 2010-04-08: 325.8 Mbp / 2010-05-04: 453.0 Mbp / 2010-05-18: 512.3 Mbp 2011-03-24: 629.1 Mbp / 2011-04-28: 541.8 Mbp / 2011-05-26: 604.0 Mbp 2012-03-08: 574.0 Mbp / 2012-04-16: 543.9 Mbp / 2012-05-10: 614.1 Mbp *sums of assembled bases
Figure 6 with 2 supplements
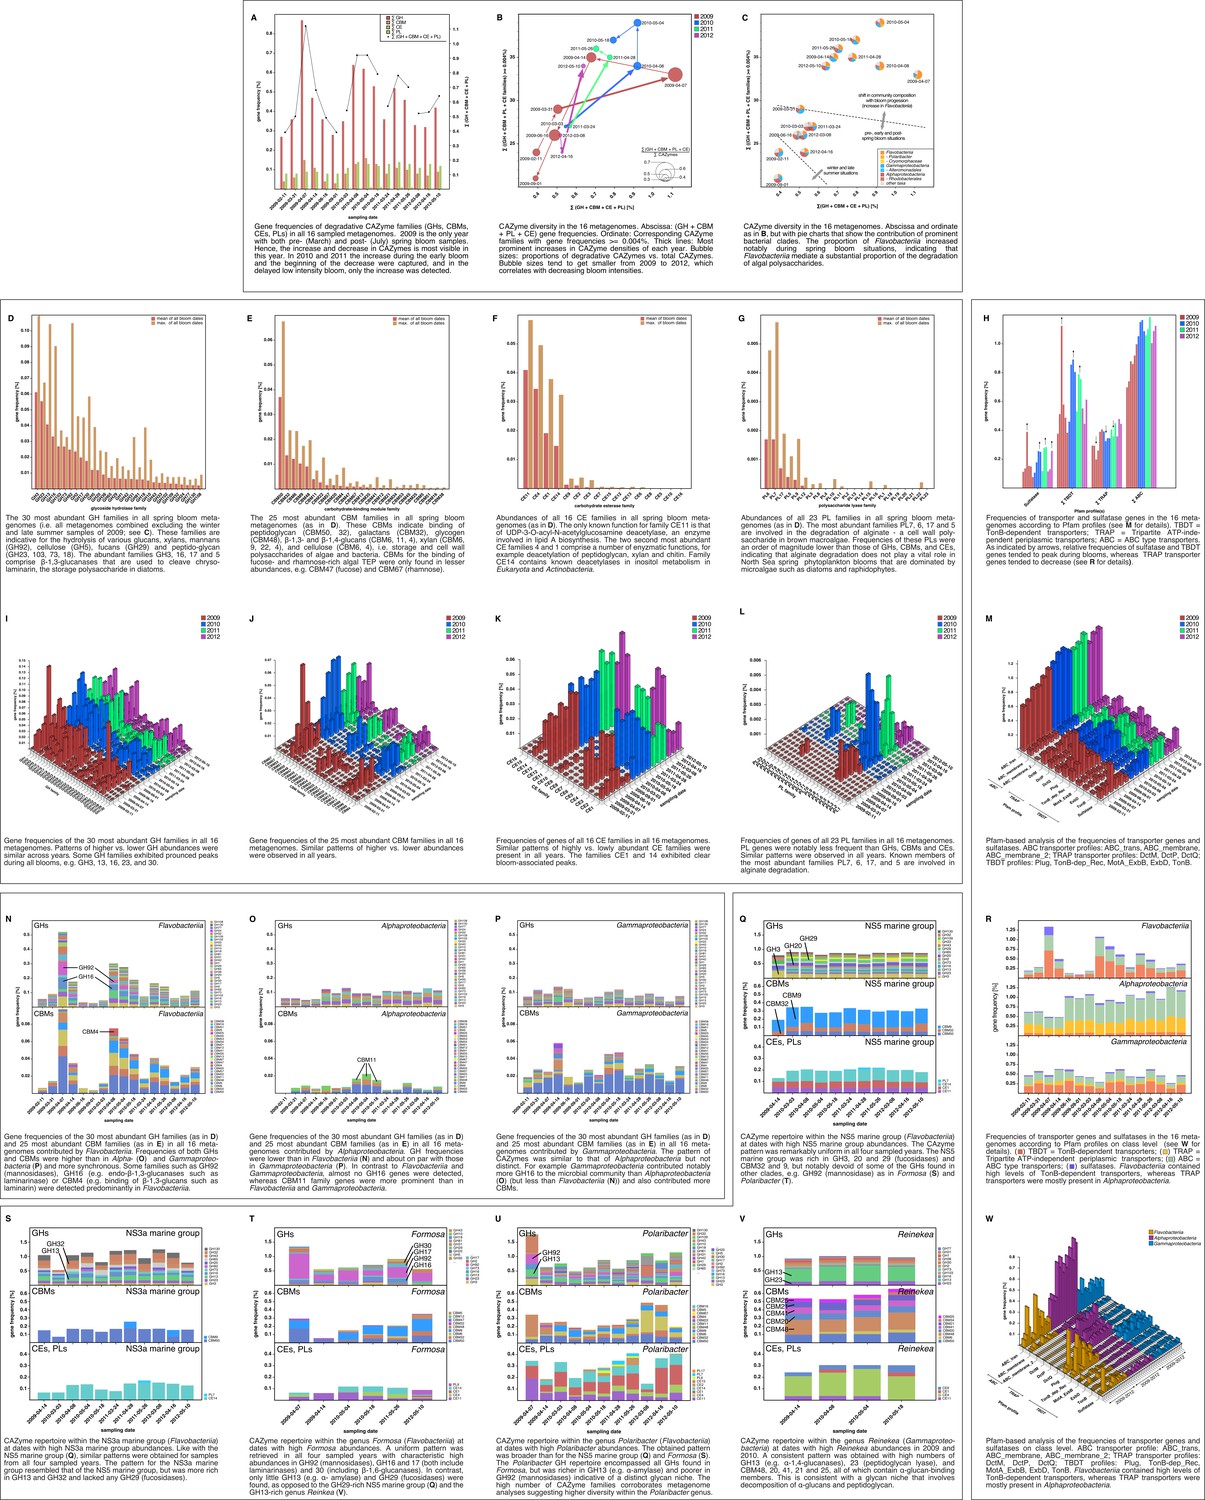
Metagenome functional analyses: CAZyme, sulfatase and transporter gene frequencies.
Sampling: Surface seawater samples were taken at the North Sea island Helgoland between the main island and the minor island Düne' (station 'Kabeltonne', 54°11'03''N, 7°54'00''E) and processed in the laboratory of the Biological Station Helgoland within less than two hours after sampling. Biomass of free-living bacteria was harvested on 0.2 µm pore sized filters after pre-filtration with 10 µm and 3 µm pore sized filters to remove large debris and particle-associated bacteria. Sequencing: Community DNA was extracted and sequenced. 2009 samples were sequenced on the 454 FLX Ti platform, and 2010–2012 samples on the Illumina HiSeq2000 platform (16 metagenomes in total). Reads were assembled using Newbler (2009) or a combination of SOAPdenovo and Newbler (2010–2012) and the resulting contigs were taxonomically classified (Supplementary file 9). Metagenome sizes*: 2009-02-11: 49.1 Mbp / 2009-03-31: 44.9 Mbp / 2009-04-07: 52.7 Mbp / 2009-04-14: 96.0 Mbp / 2009-06-16: 29.8 Mbp / 2009-09-01: 79.2 Mbp 2010-03-03: 537.3 Mbp / 2010-04-08: 325.8 Mbp / 2010-05-04: 453.0 Mbp / 2010-05-18: 512.3 Mbp 2011-03-24: 629.1 Mbp / 2011-04-28: 541.8 Mbp / 2011-05-26: 604.0 Mbp 2012-03-08: 574.0 Mbp / 2012-04-16: 543.9 Mbp / 2012-05-10: 614.1 Mbp *sums of assembled bases Data Analysis: CAZymes were predicted as consensus of searches against the CAZy, dbCAN and Pfam databases with custom E-value cutoffs (Supplementary file 11). Sulfatase and transporter genes were predicted based on HMMER searches against the Pfam databases with an E-value cutoff of E-5. Gene frequencies were computed as [(sum of average coverage of target genes) *100 / (sum of average coverage of all genes)]. All dates in the graphs are in the format [yyyy-mm-dd].
Figure 6—figure supplement 1
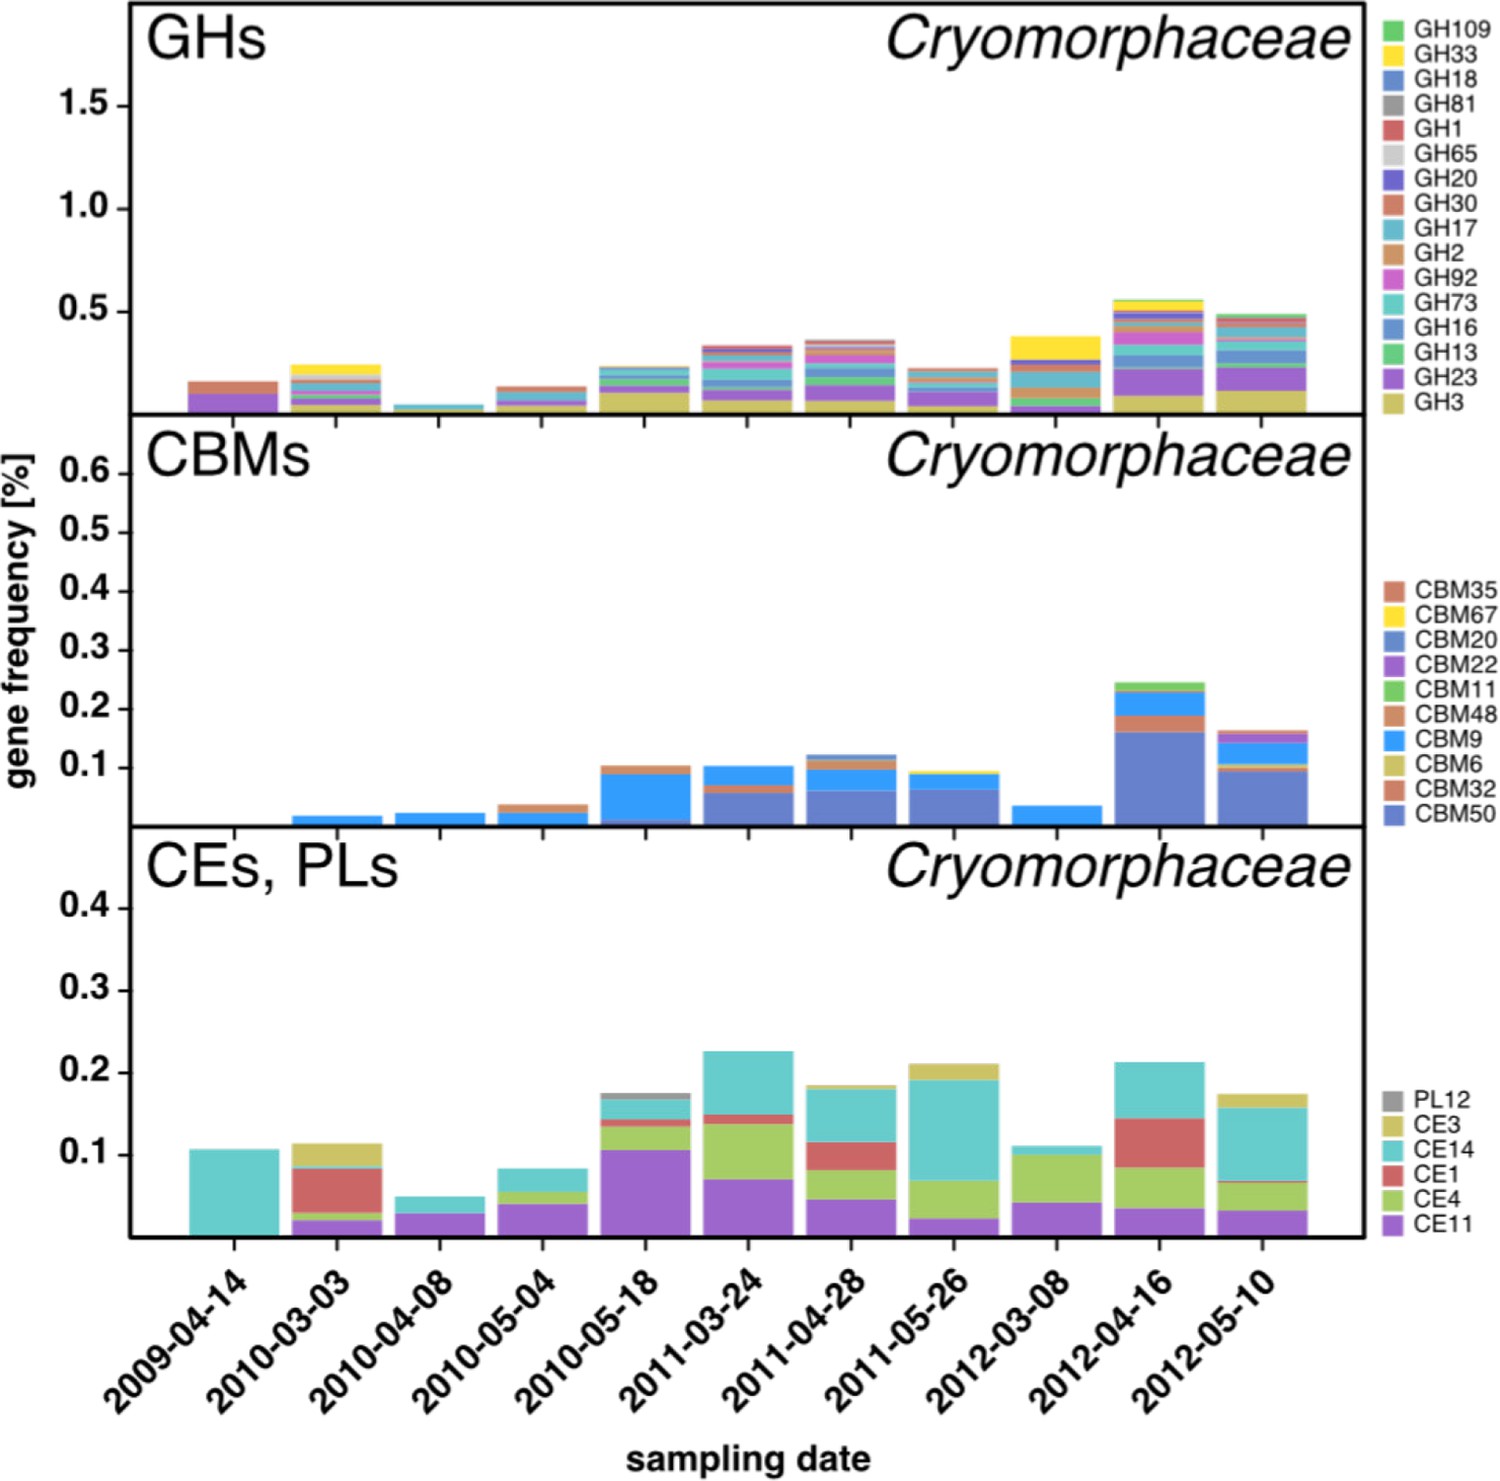
CAZyme repertoire within the family Cryomorphaceae (Flavobacteriia) at dates with high Cryomorphaceae abundances.
GH and CBM frequencies were low compared to those of other abundant Flavobacteriia clades (see Figure 6Q,S,T,U), indicating that these Cryomorphaceae might have a distinct ecophysiological niche in which polysaccharide degradation plays a lesser role.
Figure 6—figure supplement 2
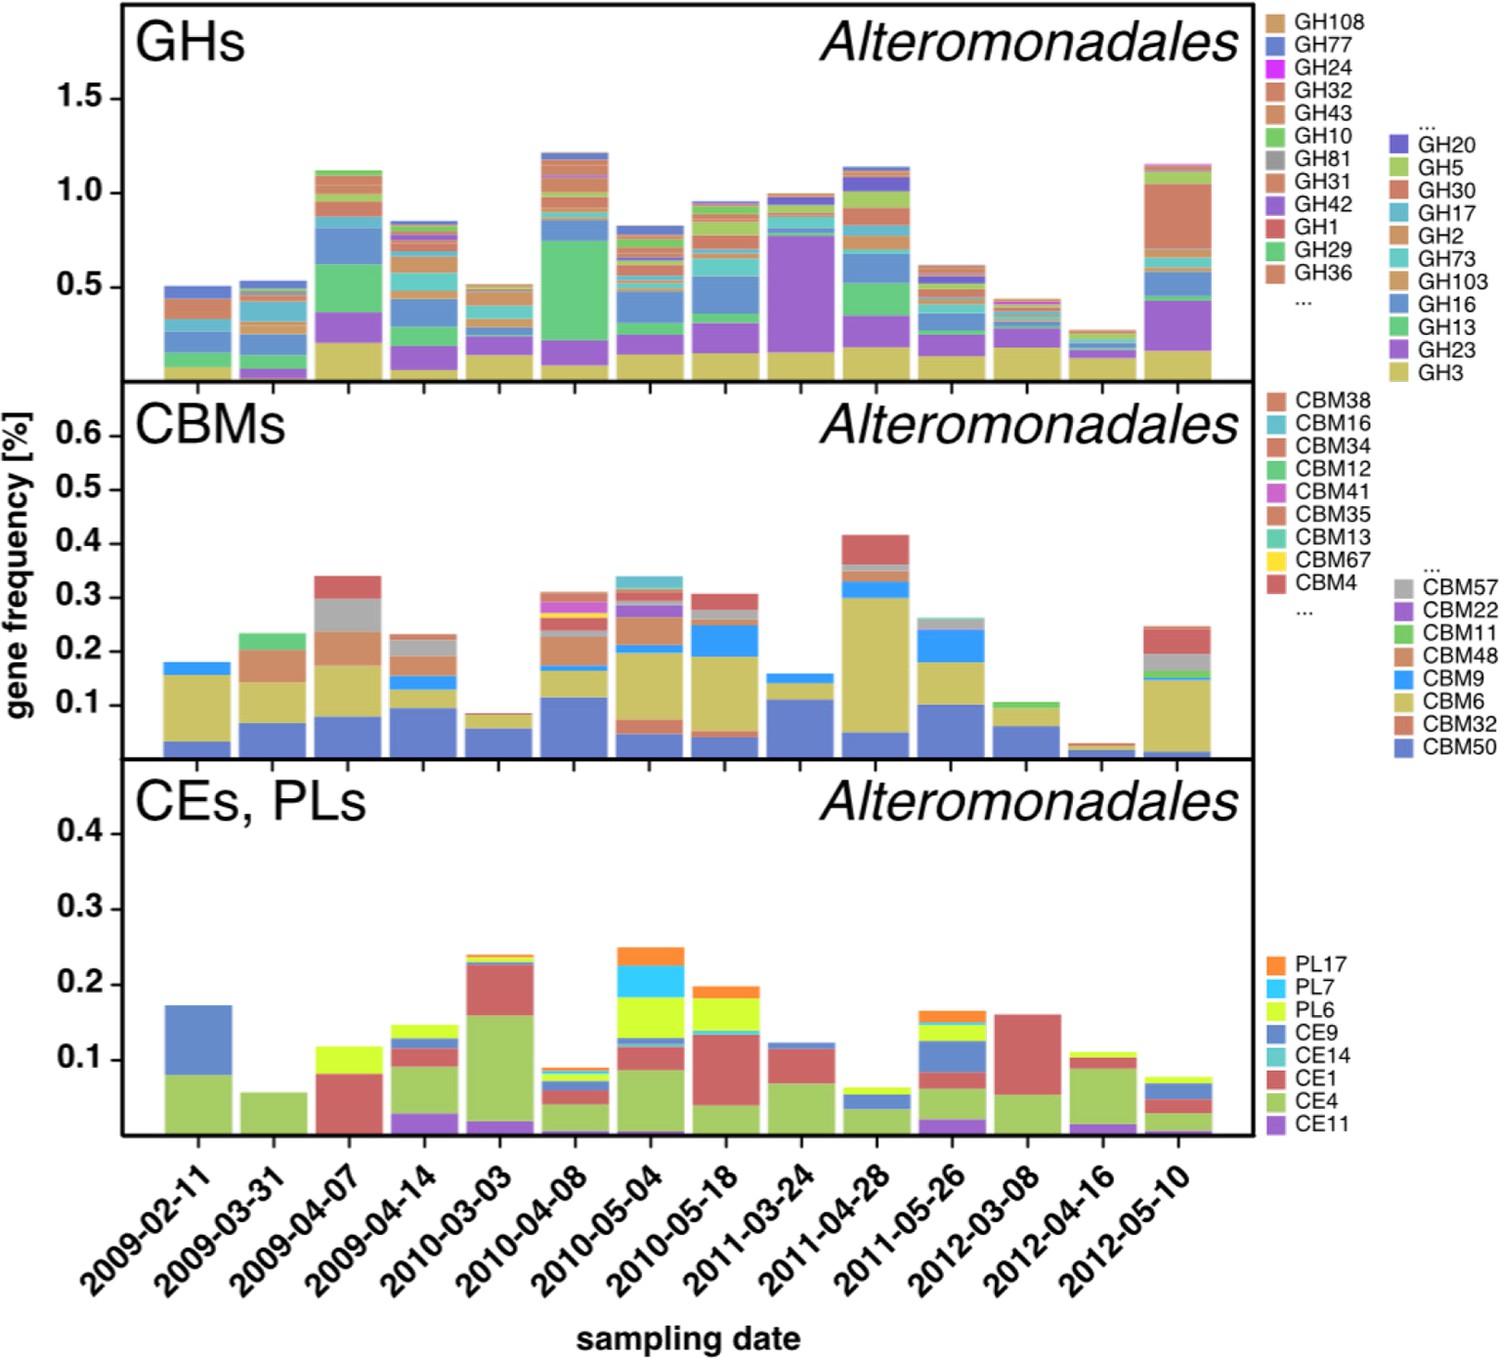
CAZyme repertoire within the order Alteromonadales (Gammaproteobacteria) at dates with high abundances of Alteromonadales.
As expected at the taxomomic level of order, the CAZyme repertoire was diverse. Nonetheless, the obtained pattern was relatively consistent across all four studied years and at some dates notably enriched in CAZymes that play a role during phytoplankton blooms such as GH13 and GH16
Additional files
-
Supplementary file 1
Physicochemical parameters.
- https://doi.org/10.7554/eLife.11888.011
-
Supplementary file 2
Cell counts of dominating phytoplankton.
- https://doi.org/10.7554/eLife.11888.012
-
Supplementary file 3
Total cell and CARD-FISH cell counts of bacterioplankton.
- https://doi.org/10.7554/eLife.11888.013
-
Supplementary file 4
Specific oligonucleotide probes used for quantification of free-living (0.2 - 3 µm) bacterioplankton populations by fluorescence in situ hybridization (FISH).
- https://doi.org/10.7554/eLife.11888.014
-
Supplementary file 5
Abundance matrix of the 16S rRNA gene tag sequence analysis.
- https://doi.org/10.7554/eLife.11888.015
-
Supplementary file 6
Spearman rank correlations of abundant Bacteroidetes clades to phytoplankton groups.
Correlation values were considered only when p-value <0.05. Spearman rank correlations measure the strength of association between two ranked variables. A precondition (assumption) for this nonparametric statistical analysis is that the two variables share a monotonic relationship (i.e. when one variable increases, the other either consistently increases as well or consistently decreases). This monotonic relationship does, however, not need to be linear. While no particularly strong correlations were found between major algae groups and bacterioplankton clades, some noteworthy trends were detected. For example, Ulvibacter abundances were positively correlated with diatoms (in particular centrales) and negatively correlated with silicoflagellates, whereas an opposite trend was observed for the VIS1 clade of the NS5 marine group (i.e. negative correlation with diatoms and a positive correlation with silicoflagellates). While the explanatory power of such pairwise rank-based correlations is limited and correlation does not necessarily imply causation, these data suggest at least for Ulvibacter sp. (and to a lesser extent for Formosa clade B) that they are associated with diatoms, while the NS3a, NS5 and NS9 marine groups seemed to be rather positively correlated with flagellates such as dino- and silicoflagellates. The positive correlation between Ulvibacter sp. and diatoms was supported by Spearman rank correlation analysis between the abundances of prominent bacterioplankton clades and distinct phytoplankton groups. Ulvibacter abundances were positively correlated with the diatoms Mediopyxis helysia, Chaetoceros debilis, Chaetoceros minimus, Thalassiosira nordenskioeldii and the Phaeocystis spp. haptophytes. Correlations of other bacterioplankton groups with distinct phytoplankton groups were less pronounced. Noteworthy positive correlations were found between Chattonella spp. and Bacteroidetes abundances (probe CF319a), in particular Marinoscillum spp. (probe CYT-734), Polaribacter spp. (probe POL740) and the NS5/VIS1 and NS3a marine groups. The NS5/VIS1 marine group was negatively correlated with most diatom groups and the Phaeocystis sp. haptophytes, and only positively correlated with Chattonella species. This might indicate a preference for Chattonella spp. or simply reflect that the members of the VIS1 clade of the NS5 marine group were less competitive than other Flavobacteriia under the conditions where other algae dominated. Spearman rank correlations between major bacterioplankton clades and physicochemical parameters were most conclusive for Ulvibacter species. Ulvibacter abundances were positively correlated with chlorophyll a, consistent with the previously detected positive correlation with in particular diatoms. Ulvibacter abundances were also negatively correlated with silicate, phosphate, nitrate and ammonium. In particular the strong negative correlation with silicate, which is the limiting factor for diatom frustule formation, supports a particularly strong association of Ulvibacter spp. and diatoms. Similar but weaker trends were observed also for other bacterioplankton clades, such as Polaribacter, Formosa clade B, or VIS6 clade Cryomorphaceae. Of all genus-level clades, Polaribacter and Formosa clade A showed the strongest associations with temperature.
- https://doi.org/10.7554/eLife.11888.016
-
Supplementary file 7
Linear regression analyses were computed in order to test, whether the abundances of major clades of Flavobacteriia were influenced by abiotic factors or by abundant algae groups.
For all tested clades of Flavobacteriia, multiple abiotic factors and multiple algae groups were obtained as explanatory variables. The strongest abiotic predictors were temperature, salinity, silicate and nitrate. The strongest biotic predictors were Phaeocystis spp. haptophytes, Rhizosolenia spp., Chaetoceros debilis, and Chaetoceros minimus diatoms and the silicoflagellate Chattonella. It should be noted though that these regressions were computed based on log-transformed abundance data and not algae biovolumes (which were not measured). Insofar the in influence of the rather small cell-sized algae such as Chaetoceros miniumus is likely overestimated. Such limitations notwithstanding it is noteworthy that in no case a simple one-to-one relationship between specific algae and specific bacterioplankton groups was obtained so far.
- https://doi.org/10.7554/eLife.11888.017
-
Supplementary file 8
Statistics of the 16 metagenomes from free-living (0.2 - 3.0 µm) North Sea bacterioplankton that were used in this study.
Two additional metagenomes are listed in italics for completeness, one from a test run sampled on August 21th, 2008, and a metagenome of particle-attached (3 - 10 µm) bacterioplankton sampled on April 14th, 2009.
- https://doi.org/10.7554/eLife.11888.018
-
Supplementary file 9
Results of the taxonomic classification of the metagenome sequences.
- https://doi.org/10.7554/eLife.11888.019
-
Supplementary file 10
Sizes in basepairs of the metagenome taxonomic bins that were used for CAZyme frequency analyses on order to genus level.
Taxonomic bins with too small sizes for a sound analysis were excluded (red text).
- https://doi.org/10.7554/eLife.11888.020
-
Supplementary file 11
E-value thresholds used for automated CAZyme family detection.
Searches were performed against the CAZy database, the dbCAN database and the Pfam database using E-value thresholds that were adjusted for each family by extensive manual annotations. CAZymes were only annotated when at least two of the three database searches yielded positive results (GH = glycoside hydrolase; CBM = carbohydrate- binding module; CE = carbohydrate esterase; PL = polysaccharide lyase; GT = glycoside transferase; AA = auxiliary activities).
- https://doi.org/10.7554/eLife.11888.021
Download links
A two-part list of links to download the article, or parts of the article, in various formats.
Downloads (link to download the article as PDF)
Open citations (links to open the citations from this article in various online reference manager services)
Cite this article (links to download the citations from this article in formats compatible with various reference manager tools)
Recurring patterns in bacterioplankton dynamics during coastal spring algae blooms
eLife 5:e11888.
https://doi.org/10.7554/eLife.11888


