Mutational scanning reveals the determinants of protein insertion and association energetics in the plasma membrane
- Weizmann Institute of Science, Israel
Figures
Figure 1
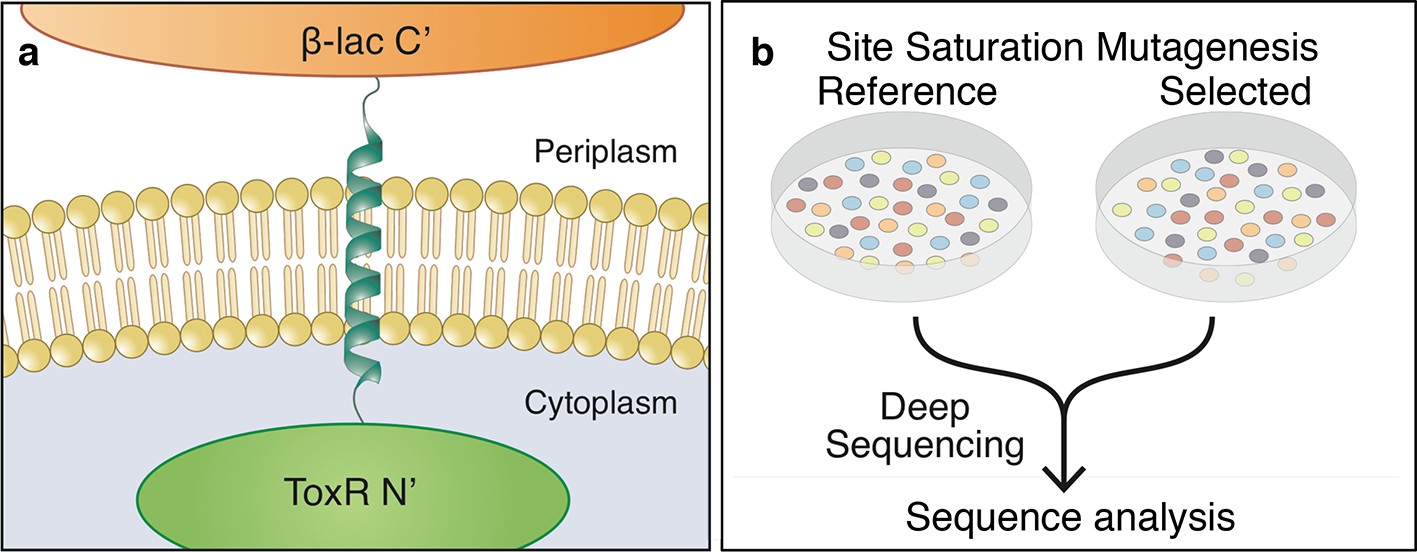
The dsTβL assay for measuring the sequence determinants of membrane-protein energetics.
(a) The TβL genetic construct fuses a membrane segment to two antibiotic selection markers: β-lactamase and ToxR, which report on insertion and self-association, respectively. (b) Libraries encoding every point mutation of a membrane segment are plated on selective and non-selective medium. Following overnight growth, the libraries are extracted and DNA segments, which encode the membrane domain, are subjected to deep-sequencing analysis.
-
Figure 1—source data 1
Deep-sequencing read quality is high throughout the membrane-spanning segment.
The deep-sequencing analysis software (Babraham Institute, Cambridge, UK) provides a quality control assessment, which is high (green) throughout the membrane span (marked by red lines).
- https://doi.org/10.7554/eLife.12125.004
-
Figure 1—source data 2
Deep-sequencing counts for each mutant.
Amino acid positions and substitutions are represented in rows and columns, respectively. (Top) spectinomycin selection (reference) counts. (Bottom) spectinomycin and ampicillin selection.
- https://doi.org/10.7554/eLife.12125.005
Figure 2 with 4 supplements
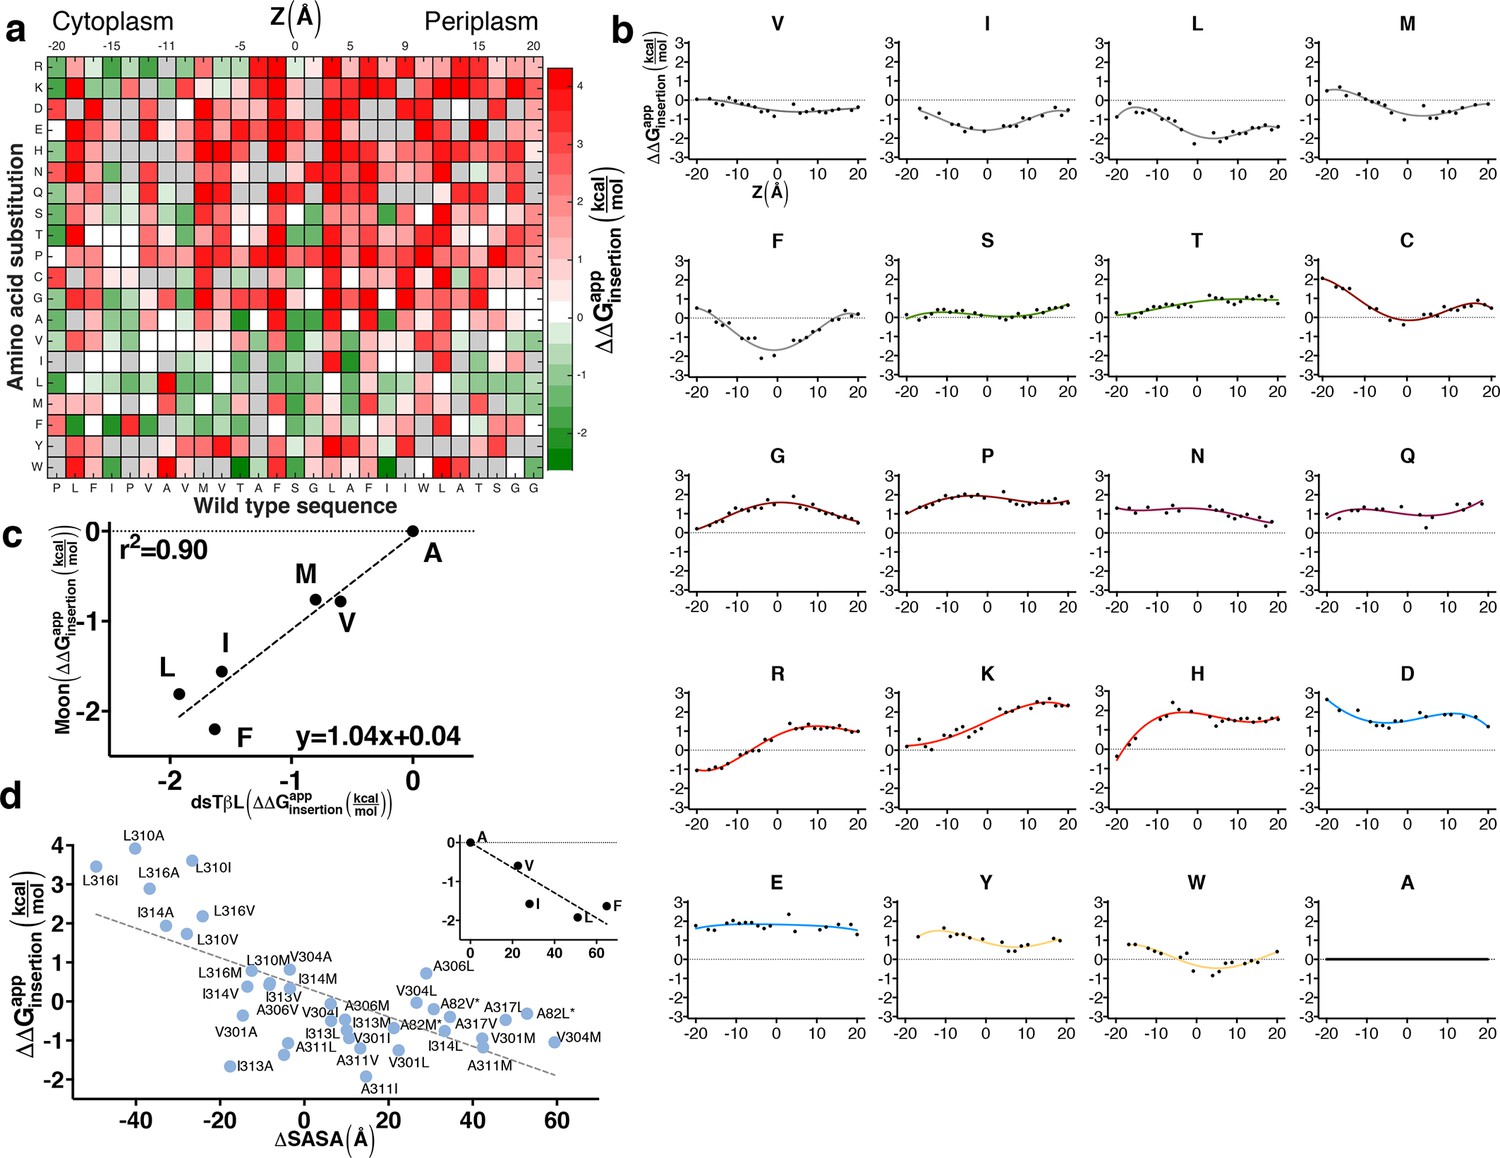
The sequence determinants of protein expression in native bacterial membranes.
(a) Each tile reports the apparent change in free energy relative to wild type for every CLS point mutant (see equation 3 in Materials and methods). Gray tiles mark substitutions that were eliminated from the analysis due to low counts (<100) in the reference population. (b) Per-position insertion profiles for each amino acid residue. (c) Comparison of dsTβL insertion results at the plasma membrane mid-plane (Z = 0) with values from the Moon scale (Moon and Fleming, 2011). (d) The apparent atomic-solvation parameter is the slope of the linear regression of and computed change in solvent-accessible surface area (SASA) due to each mutation (slope = -37 cal/mol/Å2, r2 = 0.48, p<0.0001) (see Materials and methods). (inset) Inferring the atomic-solvation parameter from the relationship of at Z = 0 for aliphatic residues and their change in SASA computed on a model poly-Ala α helix (slope=-32 cal/mol/Å2, p = 0.002). CLS, C-terminal portion of human L-Selectin
Figure 2—figure supplement 1

Human CLS and its single-site mutation library do not self associate.
By plating wild-type human CLS (a) and the library encoding every single-site mutation in its putative membrane span (b) on agar containing different antibiotic markers (spectinomycin on the left; ampicillin in the middle; and chloramphenicol on the right), we show that human CLS inserts into the membrane (ampicillin marker, middle plate) but does not self associate (Srinivasan et al., 2011) (right plate). Supplementary file 2 lists antibiotic concentrations. CLS, C-terminal portion of human L-Selectin
Figure 2—figure supplement 2
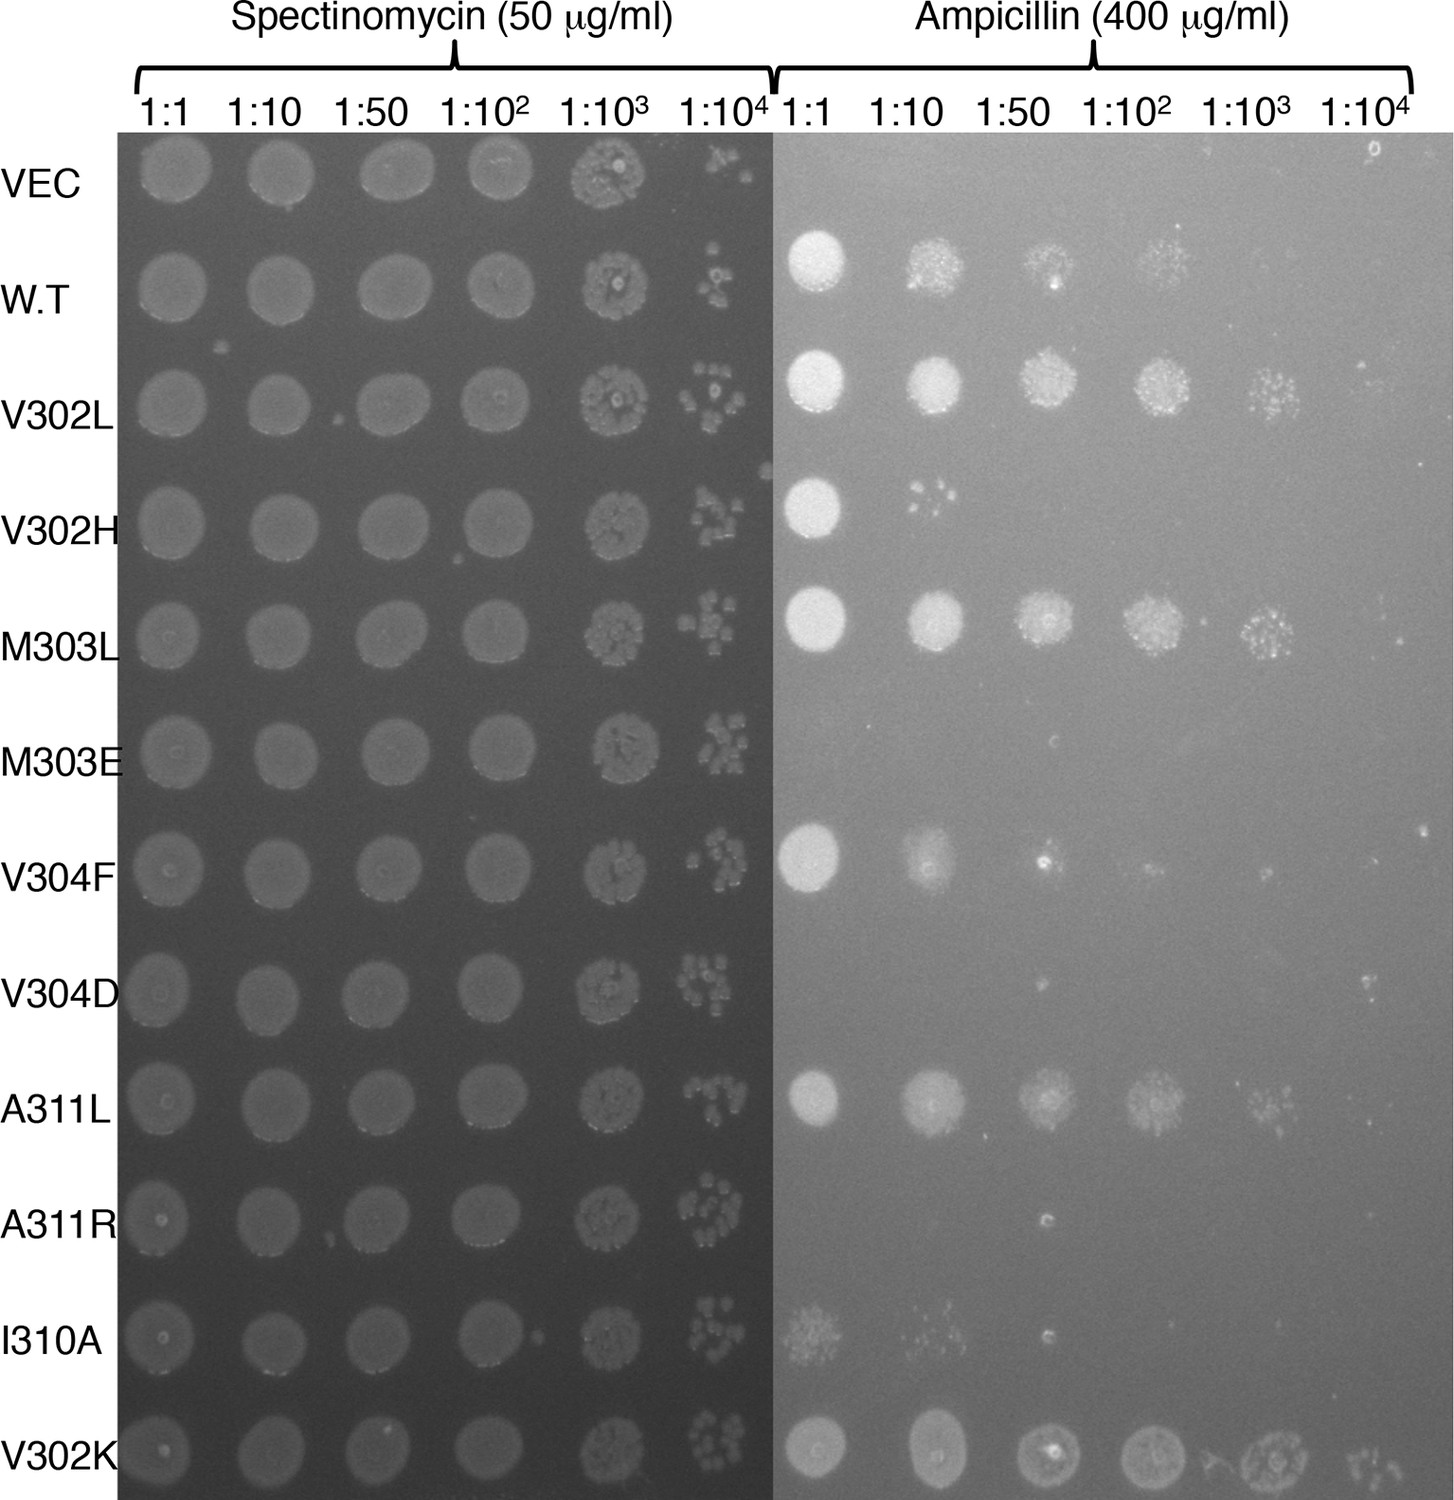
Deep-sequencing data reflects trends observed in clone-by-clone experiments.
10 single-point substitutions at the membrane-spanning segment’s amino terminus and at its core were grown overnight in non-selective medium, normalized to the same density, and plated in serial dilutions on agar containing 400 μg/ml ampicillin to estimate relative viability.
Figure 2—figure supplement 3

Western blot quantification of membrane expression of TβL mutants.
Cells harboring the wild-type construct and point mutations were fractionated by ultra-centrifugation. Whole-cell extract and pelleted membrane fractions are shown with anti-β-lactamase antibody. The band intensity was analyzed by densitometry and normalized to wild type and displayed as log2 fold change.
Figure 2—figure supplement 4
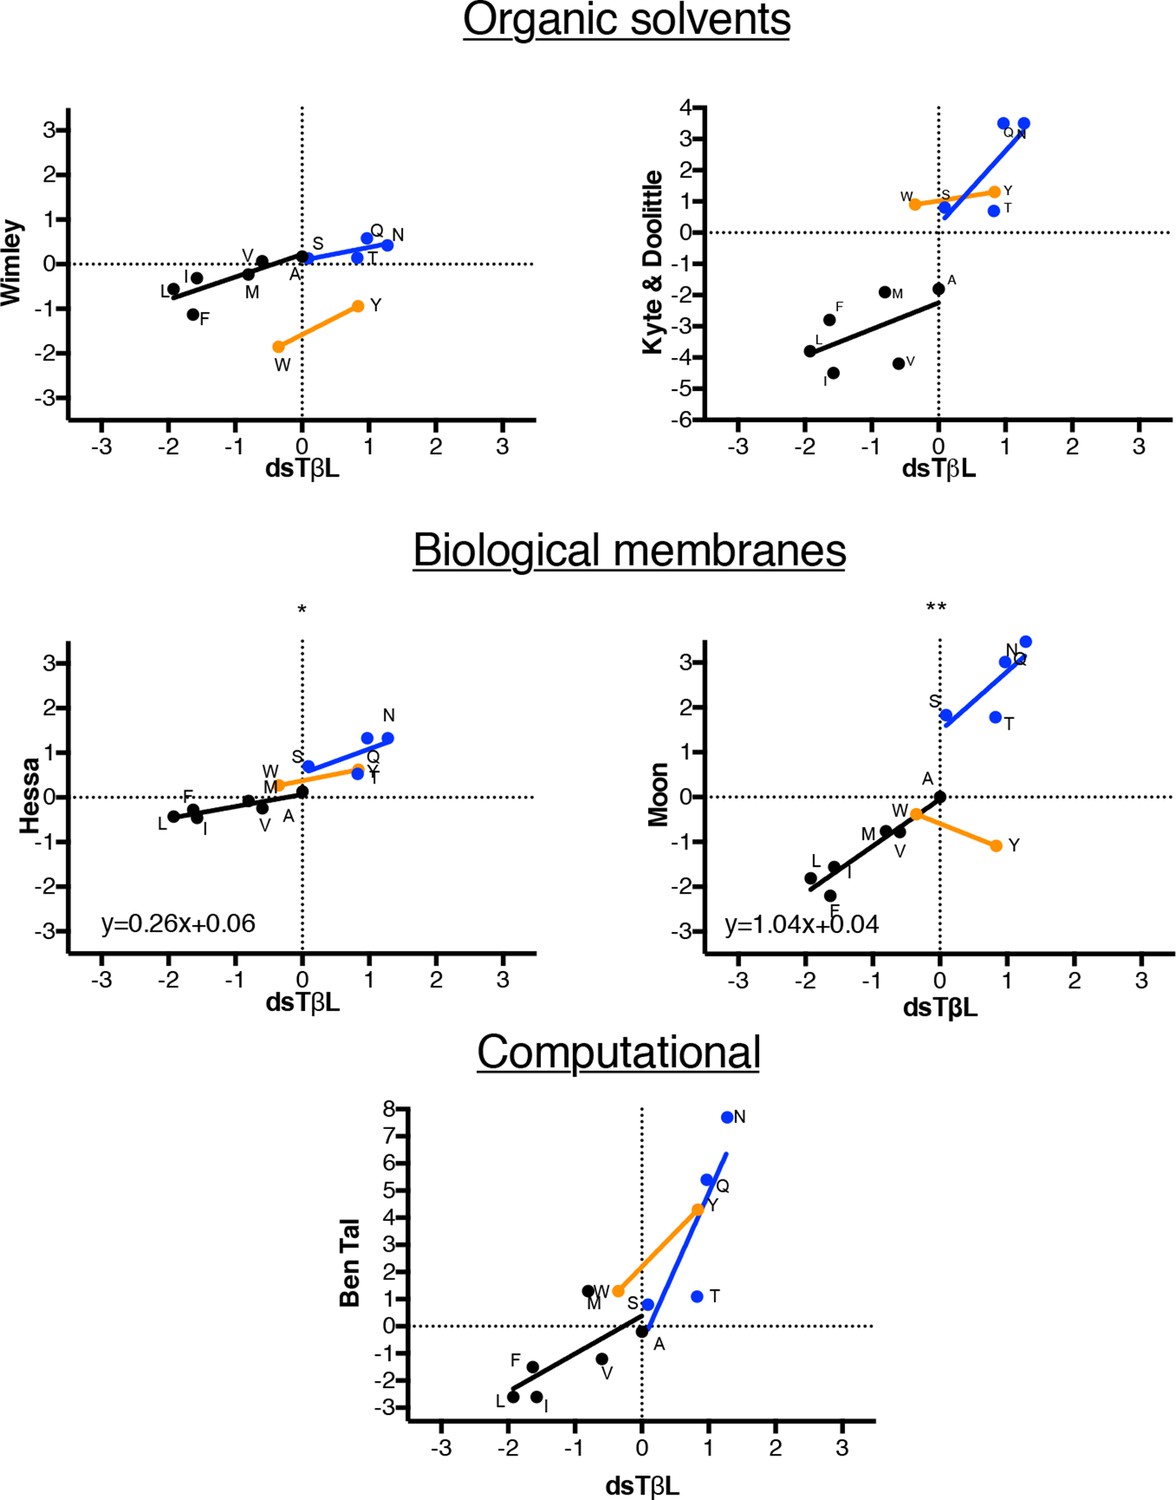
Comparison of dsTβL insertion results at the membrane mid-plane with published hydrophobicity scales.
Comparing the membrane mid-plane insertion energy (parameter c in Supplementary file 1 with corresponding values from previously published hydrophobicity scales (Wimley et al., 1996; Kyte and Doolittle, 1982; Kessel and Ben-Tal, 2002; Hessa et al., 2007; Moon and Fleming, 2011). Black points represent aliphatic amino acids, blue represent polar amino acids, orange aromatic amino acids. The aliphatic insertion data in dsTβL and the Hessa scale (Hessa et al., 2007) and Moon scale (Moon and Fleming, 2011) are highly correlated (r2 = 0.79 and r2 = 0.90, respectively). The slope of the correlation line for the aliphatics is close to 1 for the Moon scale, whereas it is 0.26 for the Hessa scale, reflecting a roughly four-fold lower change in hydrophobicity upon membrane insertion in the Hessa et al. (2007) assays compared to the dsTβL assay.
Figure 3
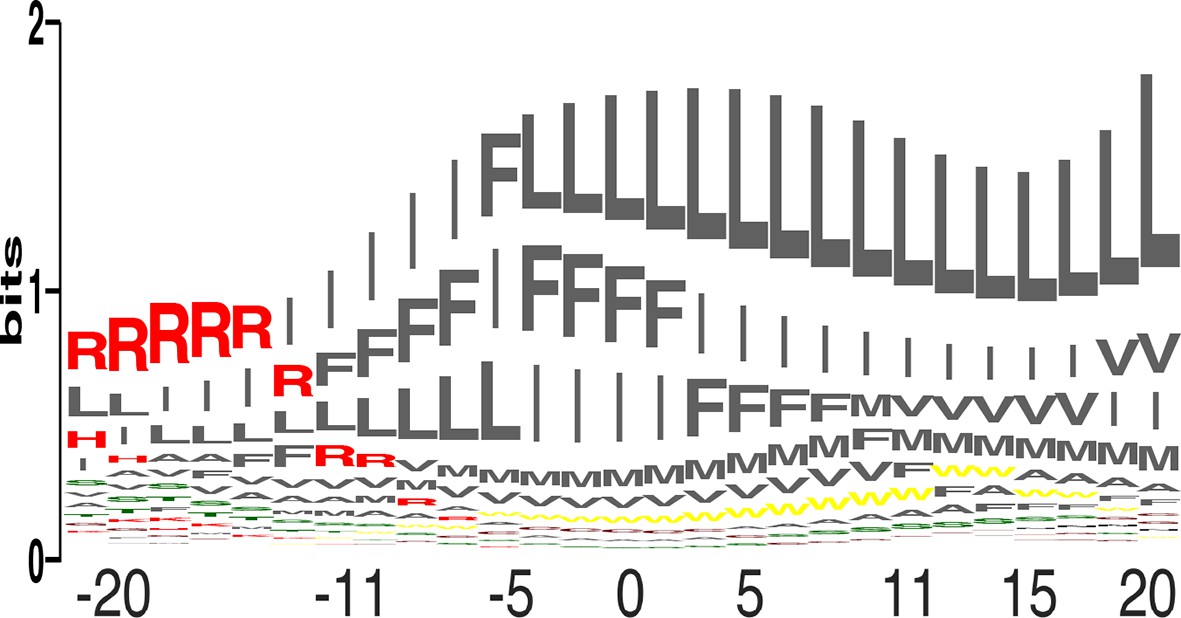
Amino acid propensities across the plasma membrane.
(a) The relative frequencies of each amino acid within the membrane (see equation 4 in Materials and methods) in sequence-logo format; the height of each letter corresponds to the amino acid’s propensity.
Figure 4

Comparison of the dsTβL insertion profiles and knowledge-based profiles of amino acid distributions in membrane-protein structures.
Equations for the knowledge-based profiles were taken from Ulmschneider et al. (2005), Schramm et al. (2012), and Senes et al. (2007).
Figure 5 with 2 supplements
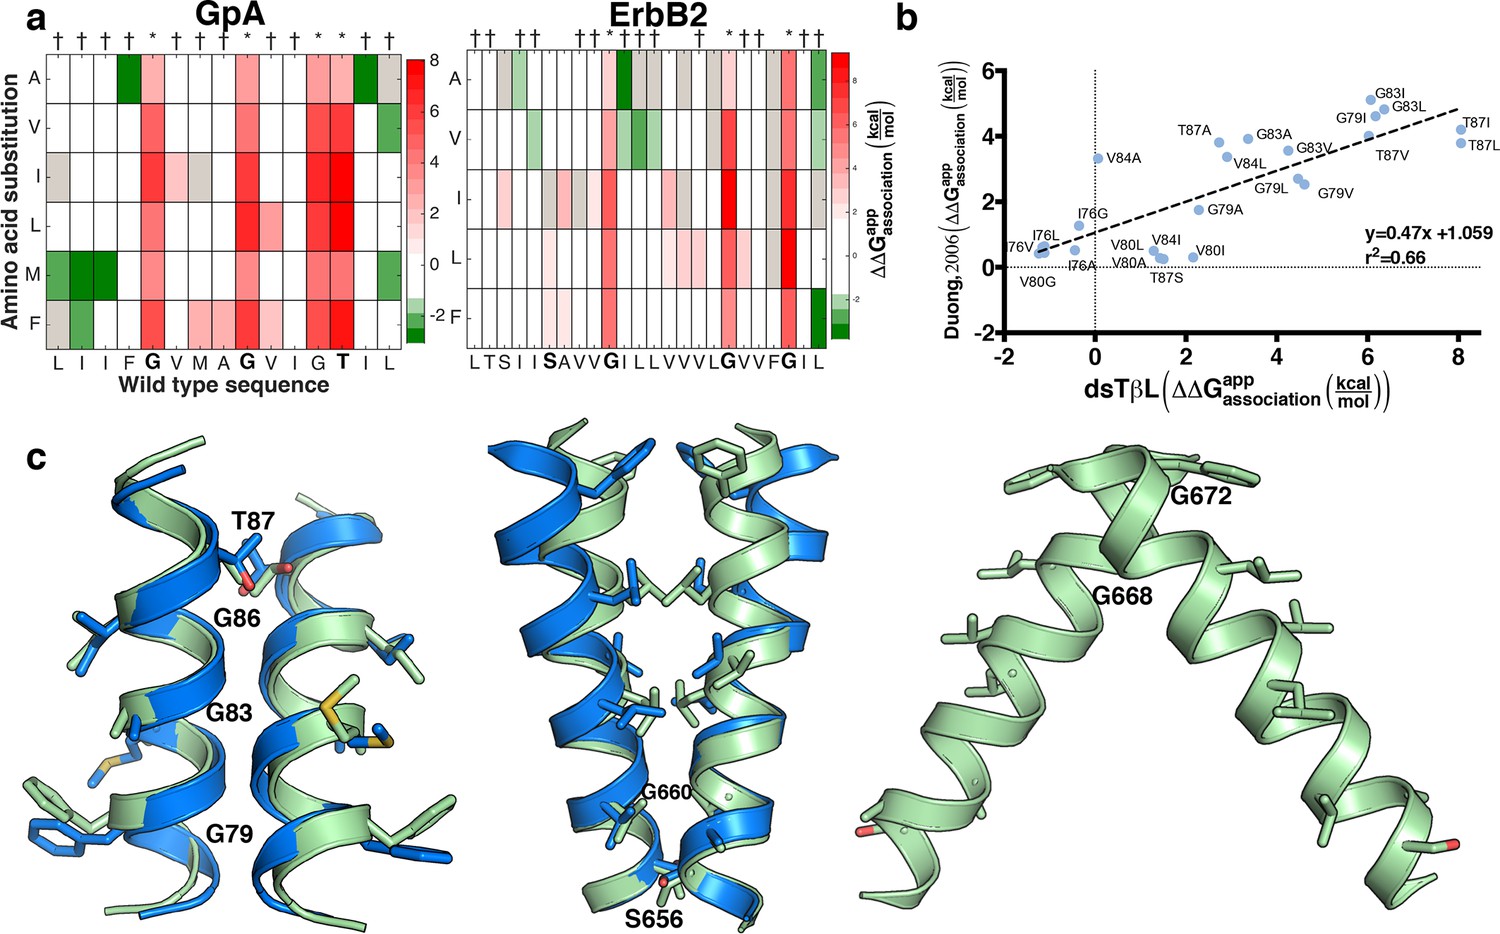
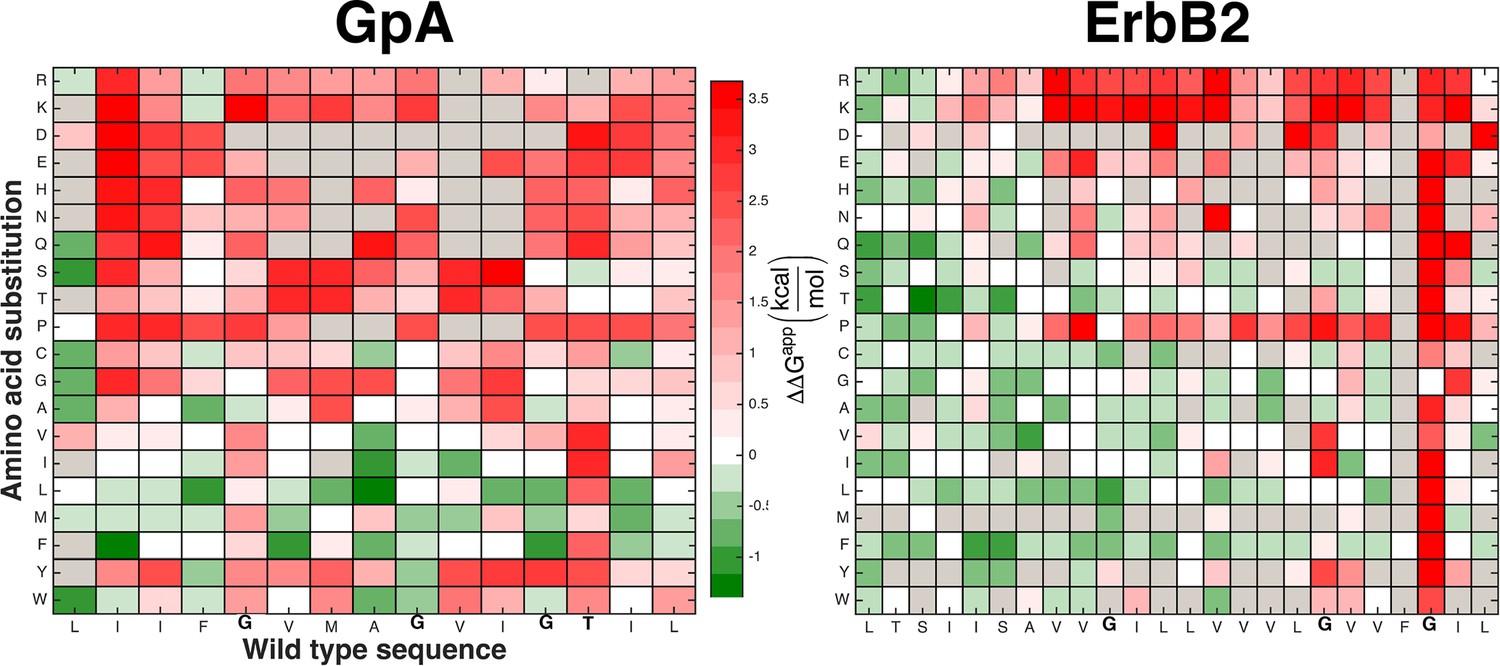
Mutational scanning reveals strong coupling between insertion and self-association in receptor homodimers.
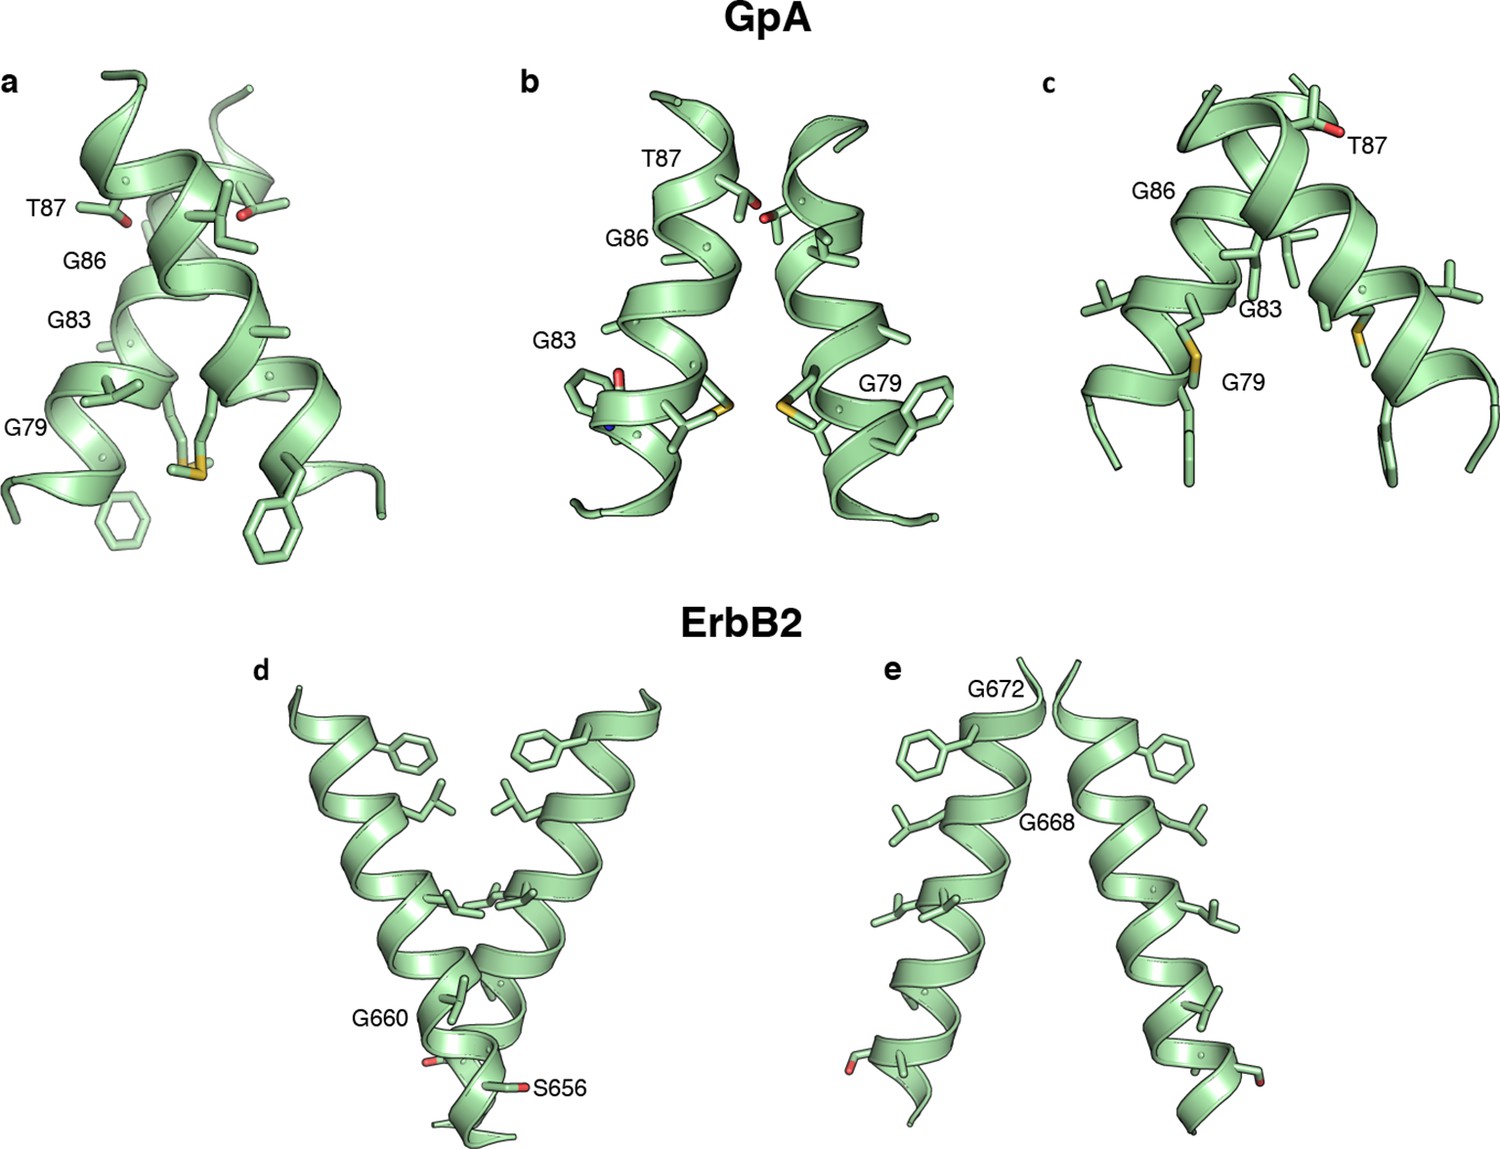
(a) The mutational landscapes discriminate positions that are involved in self-association (known associating residues are depicted in boldface) from those that do not. (b) Comparison of expression-corrected apparent free energy of insertion for 24 Glycophorin A (GpA) mutants (Duong et al., 2007) with results from the dsTβL self-association mutation landscapes. (c) Dimer models that associate through positions that are sensitive to mutation (* in panel a), and do not associate through positions that are insensitive to mutation († in panel a). The models (green) are close to the experimental structures (blue) for Glycophorin A (MacKenzie et al., 1997) (1.3 Å root mean square deviation) and ErbB2 (Bocharov et al., 2008) (1.9 Å). Another ErbB2 model, which agrees with biochemical and computational evidence (Endres et al., 2013; Arkhipov et al., 2013; Fleishman et al., 2002) but has not been observed in experimental structures, is also suggested.
Figure 5—figure supplement 1
The mutational landscapes comparing survival on chloramphenicol and ampicillin are dominated by insertion effects.
Chloramphenicol resistance in the dsTβL assay is expected to correlate with self-association (Lis and Blumenthal, 2006; Russ and Engelman, 1999; Langosch et al., 1996). While mutations at some positions that mediate self-association disrupt viability, the majority of extreme effects observed in the mutational landscapes can be attributed to insertion rather than self-association. For instance, the charged and polar residues are highly disfavored in the membrane core, whereas the large hydrophobic residues, Leu and Phe, are favored in most positions in the membrane core. Figure 5a shows mutational landscapes where the effects of insertion were subtracted.
Figure 5—figure supplement 2
Alternative predicted structures for Glycophorin A and ErbB2.
In addition to the model structures of Figure 5b modeling constrained by the dsTβL, experimental data produced three models for Glycophorin A and two for ErbB2. Improvements in the RosettaMembrane (Yarov-Yarovoy et al., 2006) energy function would be needed to eliminate these alternative models.
Additional files
-
Supplementary file 1
Polynomial fit for the insertion profiles of the 20 amino acids.
The insertion data (Figure 2b, points) were fitted to the following fourth-order polynomial, where Z is given in Å (Z = 0 at the membrane midplane) and ΔG is in kcal/mol: Parameter c is the value of insertion at the membrane midplane. The right-hand column reports the r2 value for the polynomial fit to the data points. The fit for Glu (E) is poor, reflecting the flatness of the Glu profile (Figure 2b).
- https://doi.org/10.7554/eLife.12125.016
-
Supplementary file 2
Wild-type and mutants used in dsTβL experiments.
For each membrane-spanning wild-type segment we optimized the selection stringency. Mutated sequences were used as negative controls in experiments to identify optimal selection regimes, where the difference in bacterial growth between wild-type sequence and mutant was largest.
- https://doi.org/10.7554/eLife.12125.017
Download links
A two-part list of links to download the article, or parts of the article, in various formats.
Downloads (link to download the article as PDF)
Open citations (links to open the citations from this article in various online reference manager services)
Cite this article (links to download the citations from this article in formats compatible with various reference manager tools)
Mutational scanning reveals the determinants of protein insertion and association energetics in the plasma membrane
eLife 5:e12125.
https://doi.org/10.7554/eLife.12125


