The auditory representation of speech sounds in human motor cortex
- University of California, Berkeley-University of California, San Francisco, United States
- University of California, San Francisco, United States
- University of California, Berkeley, United States
Figures
Figure 1 with 2 supplements
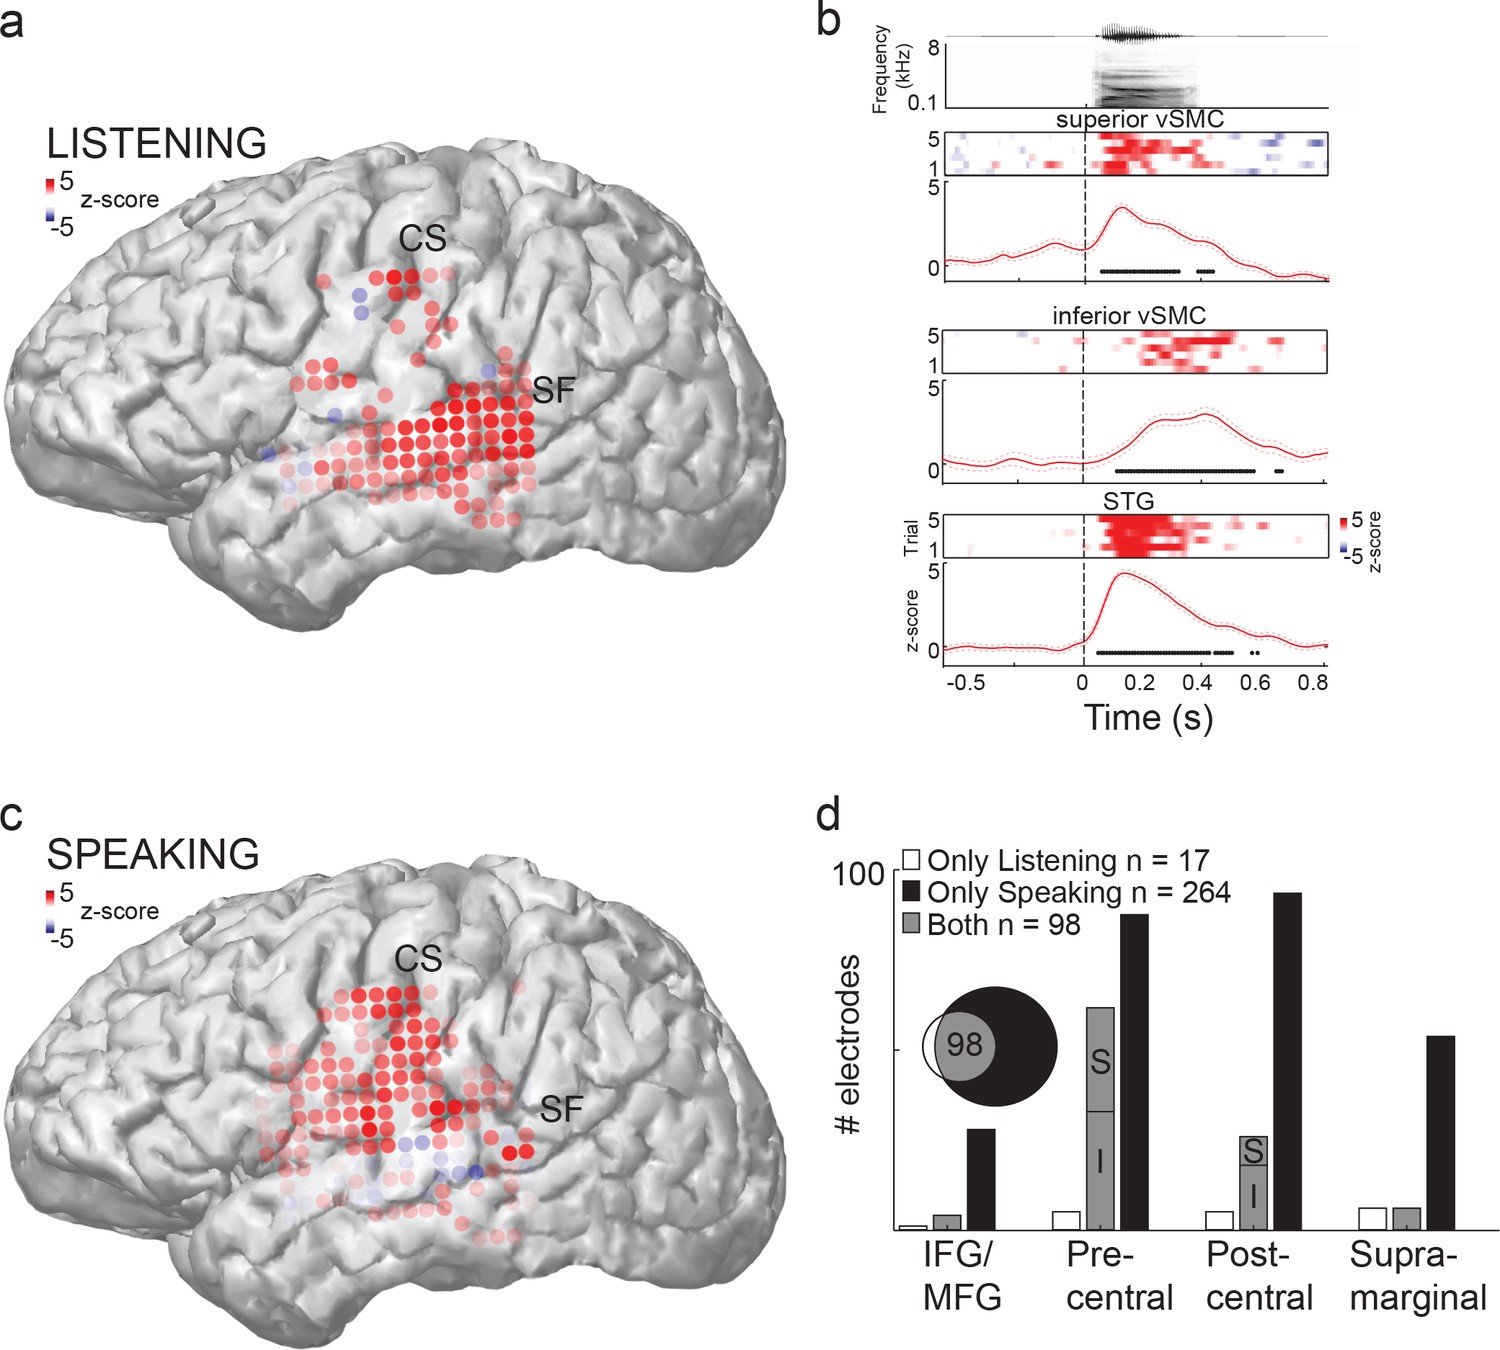
Speech sounds evoke responses in the human motor cortex.
(a) Magnetic resonance image surface reconstruction of one representative subject’s cerebrum (subject 1: S1). Individual electrodes are plotted as dots, and the average cortical response magnitude (z-scored high gamma activity) when listening to CV syllables is signified by the color opacity. CS denotes the central sulcus; SF denotes the Sylvian fissure. (b) Acoustic waveform, spectrogram, single-trial cortical activity (raster), and mean cortical activity (high gamma z-score, with standard error) from two vSMC sites and one STG site when a subject is listening to /da/. Time points significantly above a pre-stimulus silence period (p<0.01, bootstrap resampled, FDR corrected, alpha < 0.005) are marked along the horizontal axis. The vertical dashed line indicates the onset of the syllable acoustics (t=0). (c) Same subject as in (a); distributed vSMC cortical activity when speaking CV syllables (mean high gamma z-score). (d) Total number of significantly active sites in all subjects during listening, speaking, and both conditions (p<0.01, t-test, responses compared to silence and speech). Electrode sites are broken down by their anatomical locations. S denotes superior vSMC sites; I denotes inferior vSMC sites.
Figure 1—figure supplement 1
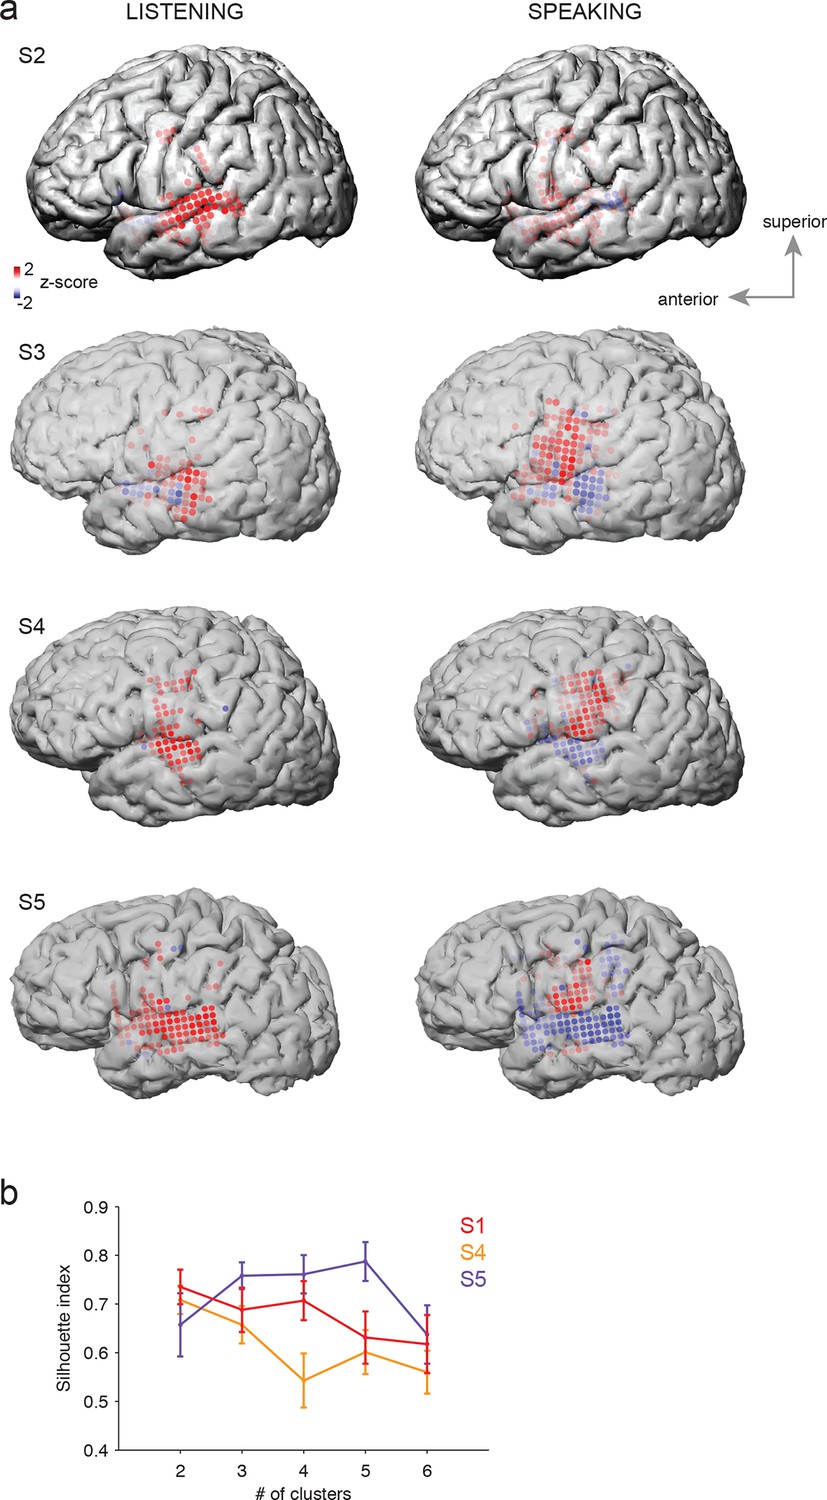
Average cortical responses to speaking and listening in all subjects (S2-S5).
(a) Average Z-scored responses in active electrodes when listening to (left) or speaking (right) CV syllables in all subjects, as shown in Figure 1a and c. (b) Results from spatial clustering of significantly active electrodes in each subject. S1, S4, and S5 showed spatially segregated clusters (see Materials and methods) and were included in k-means clustering analysis. The silhouette index shows that the best number of clusters for S1 (from Figure 1) and S4 was k=2, whereas the best number of clusters for S5 was k=5.
Figure 1—figure supplement 2
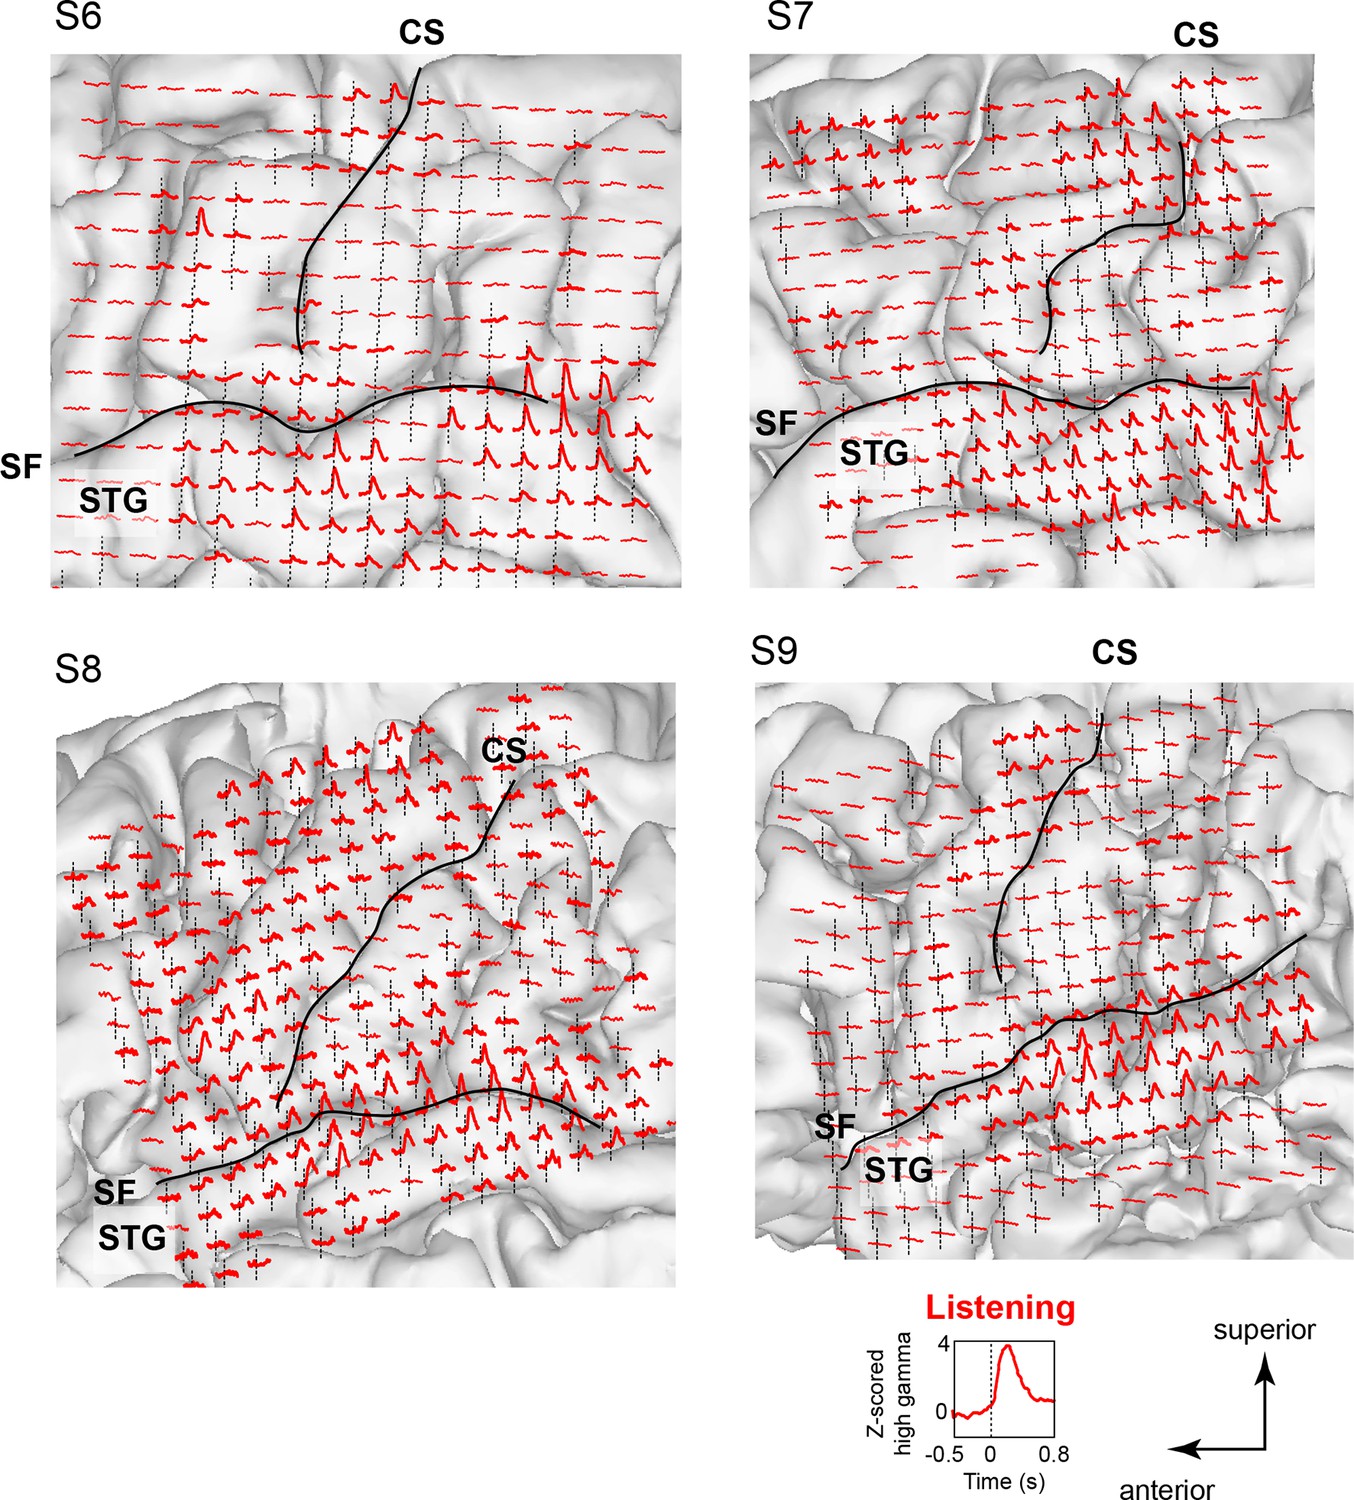
Neural responses while listening to CV syllables in 4 additional subjects not included in MDS analyses (S6 - S9).
Responses are plotted on each subject’s brain surface and are shown for each electrode as the average Z-scored high gamma activity across all syllables, aligned to the acoustic onset of the stimulus (indicated by dashed line at t = 0). As in Figure 1 and Figure 1—figure supplement 1, strong responses are seen during listening in inferior and superior regions of the vSMC (primarily precentral gyrus) in addition to the superior temporal gyrus (STG). For each subject, SF indicates the location of the Sylvian fissure, and CS indicates the central sulcus.
Figure 2 with 1 supplement
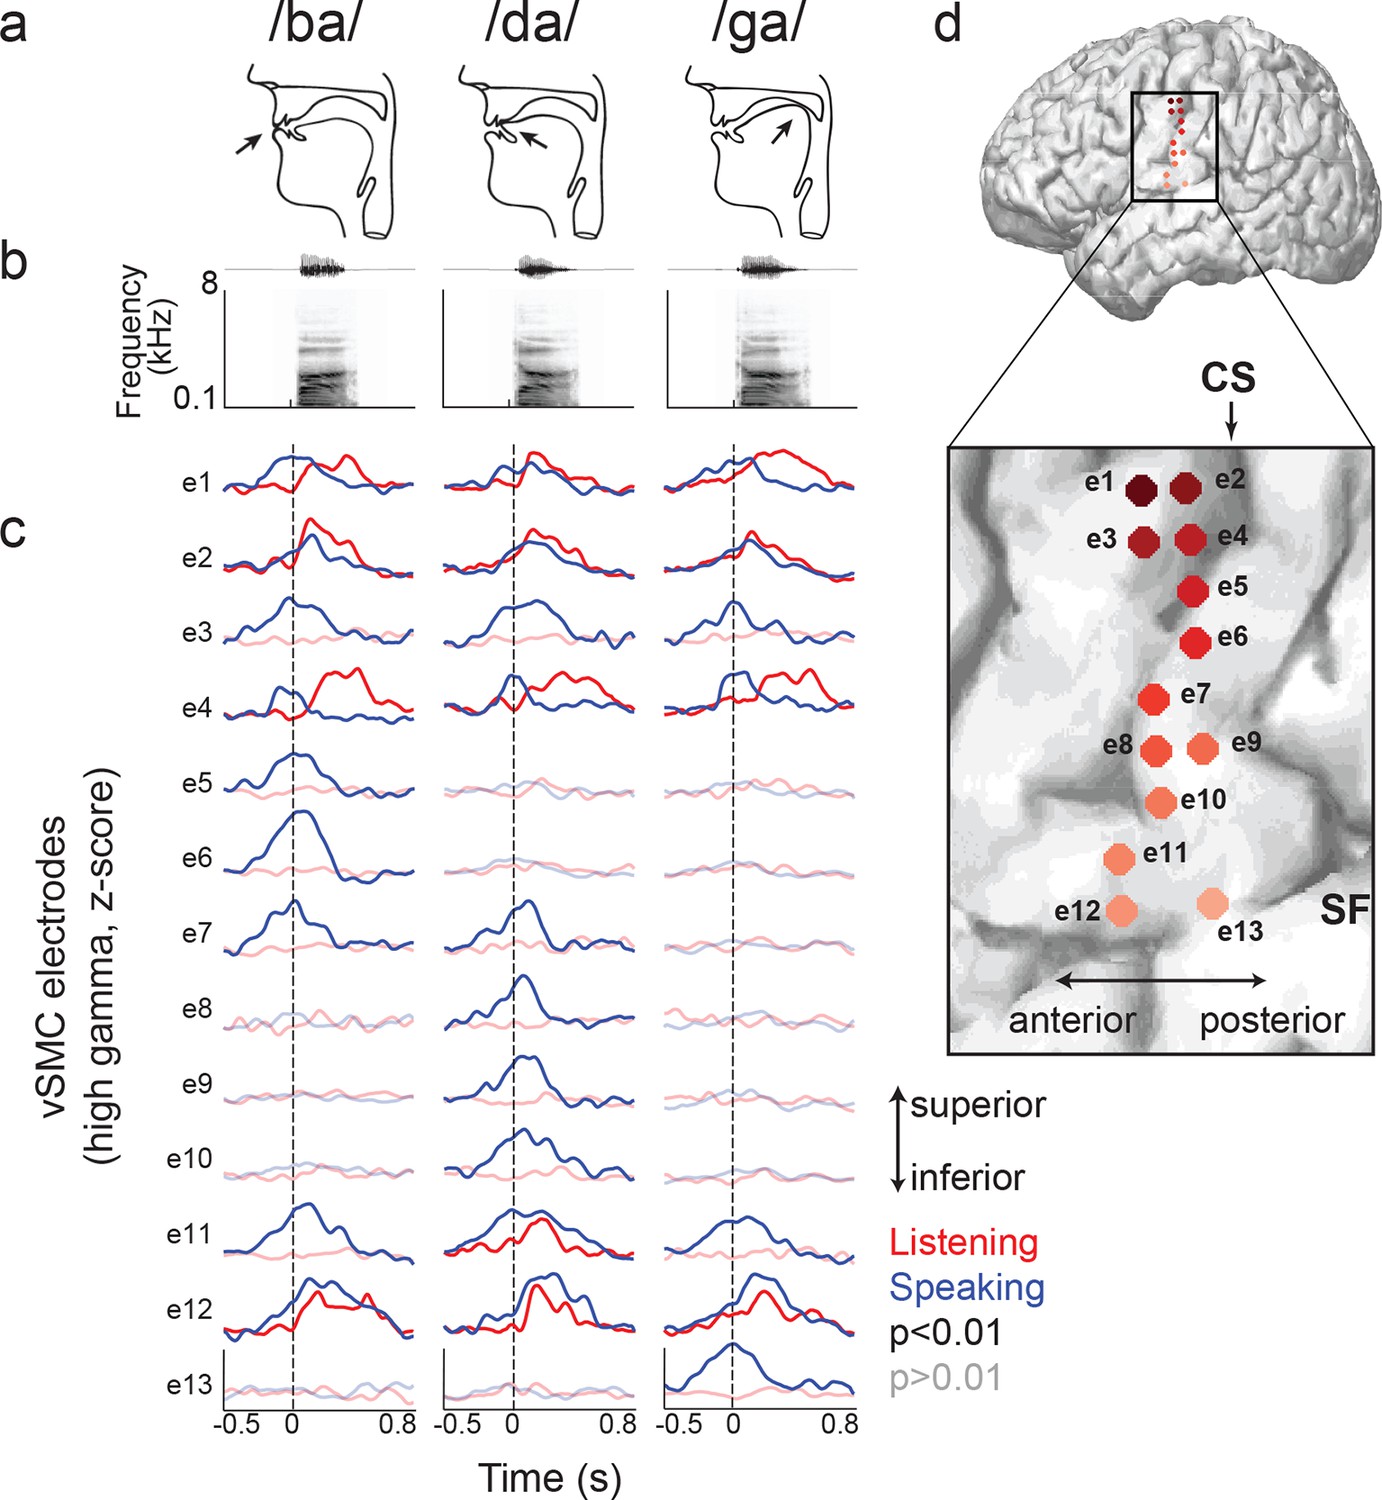
Site-by-site differences in vSMC neural activity when speaking and listening to CV syllables.
(a) Top, vocal tract schematics for three syllables (/ba/, /da/, /ga/) produced by occlusion at the lips, tongue tip, and tongue body, respectively (arrow). (b) Acoustic waveforms and spectrograms of spoken syllables. (c) Average neural activity at electrodes along the vSMC for speaking (blue) and listening (red) to the three syllables (high gamma z-score). Solid lines indicate activity was significantly different from pre-stimulus silence activity (p<0.01). Transparent lines indicate activity was not different from pre-stimulus silence activity (p>0.01). Vertical dashed line denotes the onset of the syllable acoustics (t=0). (d) Location of electrodes 1–13 in panel c, shown on whole brain and with inset detail. CS = central sulcus, SF = Sylvian fissure.
Figure 2—figure supplement 1
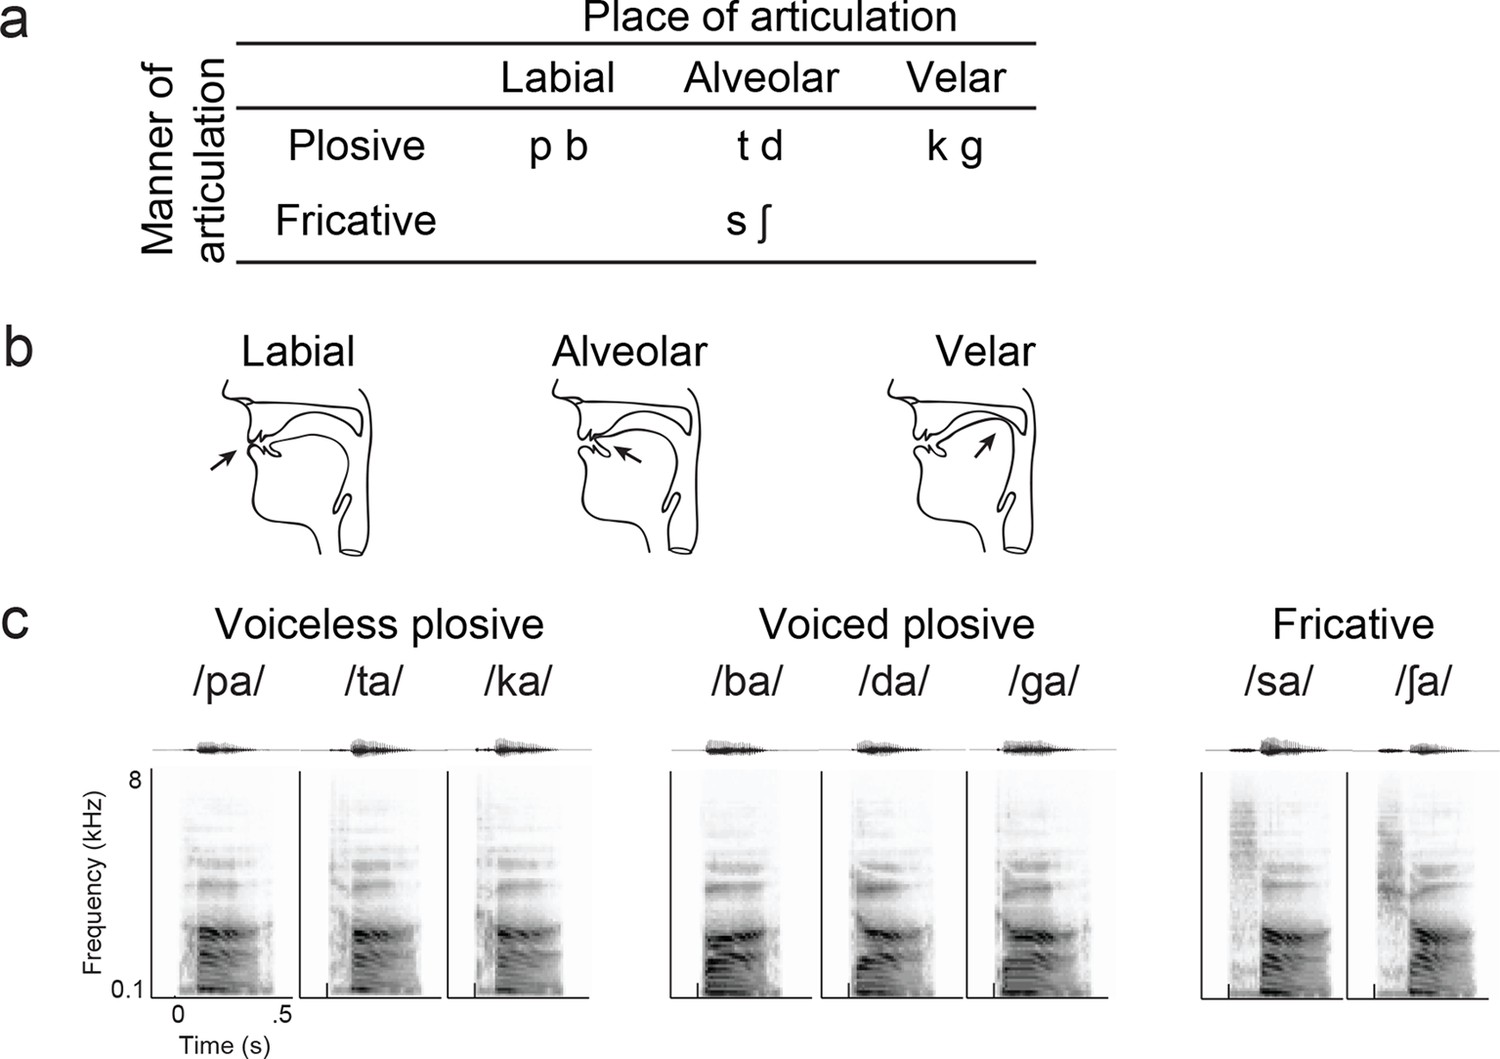
Syllable token set.
(a) Consonants of all syllable tokens. Consonants were paired with the vowel /a/, and are organized by place and manner of articulation. (b) Vocal tract schematics for three occlusions made with the lips, tongue tip, and tongue body, respectively (arrow). (c) Acoustic waveform and spectrogram of the syllable tokens.
Figure 3
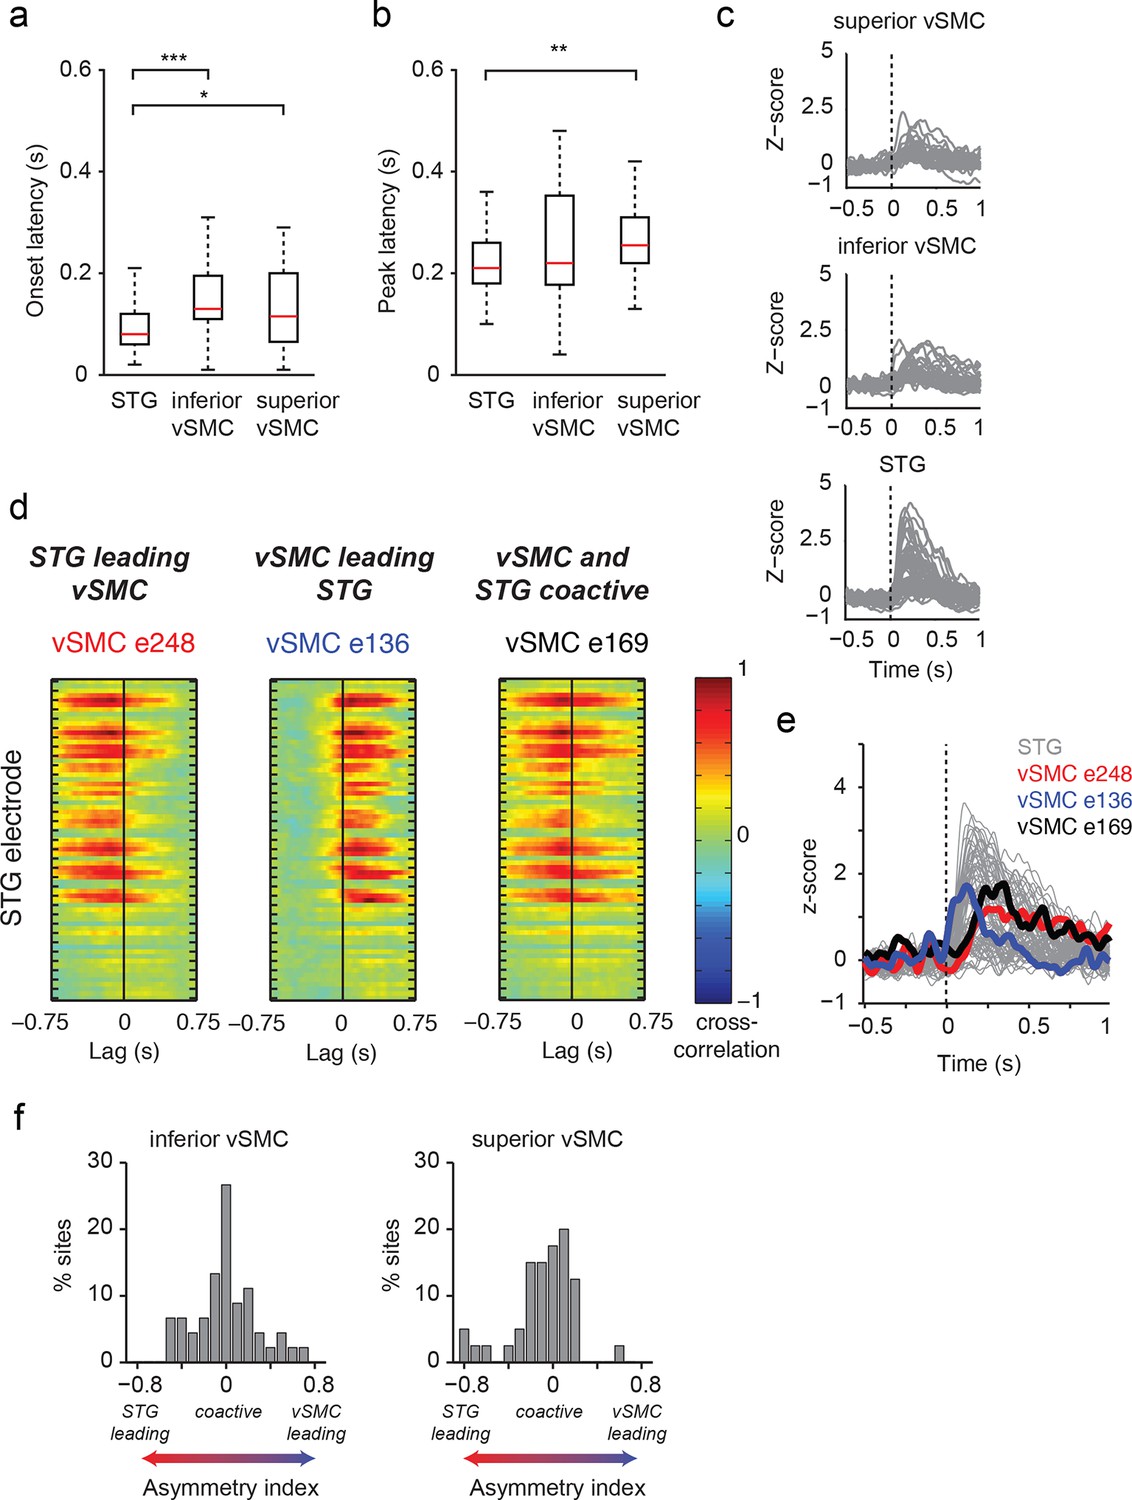
Dynamics of responses during CV listening in STG, inferior vSMC, and superior vSMC.
(a) STG onset latencies were significantly lower than both inferior vSMC (p<0.001, Z = −4.03) and superior vSMC (p<0.05, Z = −2.28). (b) STG peak latencies were significantly lower than superior vSMC (p<0.01, Z = −2.93), but not significantly different from peak latencies in inferior vSMC (p>0.1). In (a) and (b), red bar indicates the median, boxes indicate 25th and 75th percentile, and error bars indicate the range. Response latencies were pooled across all subjects. All p-values in (a) and (b) are from the Wilcoxon rank sum test. (c) Average evoked responses to all syllable tokens across sites in superior vSMC (n=32), inferior vSMC (n=37), and STG. Responses were aligned to the syllable acoustic onset (t=0). A random subset of STG responses (n=52 out of the 273 that were used in the latency analysis in (a) and (b)) are shown here for ease of viewing. (d) Example cross-correlations between three vSMC electrodes and all STG electrodes in one patient, for a maximum lag of ± 0.75 s. More power in the negative lags indicates a faster response in the STG compared to the vSMC electrode, and more power in the positive lags indicates a faster response in vSMC compared to STG. We observe vSMC electrodes that tend to respond later than STG (e248, left panel), vSMC electrodes that tend to respond before STG (e136, middle panel), and vSMC electrodes that respond at similar times to some STG electrodes (e169, right panel). (e) Average evoked responses during CV listening for all STG electrodes from this patient and the three vSMC electrodes shown in panel (d). Responses were aligned to the syllable acoustic onset (t=0), as in panel (c). (f) Percentage of sites with STG leading, coactive, or vSMC leading as expressed by the asymmetry index (see Materials and methods). Both inferior and superior vSMC show leading and lagging responses compared to STG, as well as populations of coactive pairs.
Figure 4 with 3 supplements
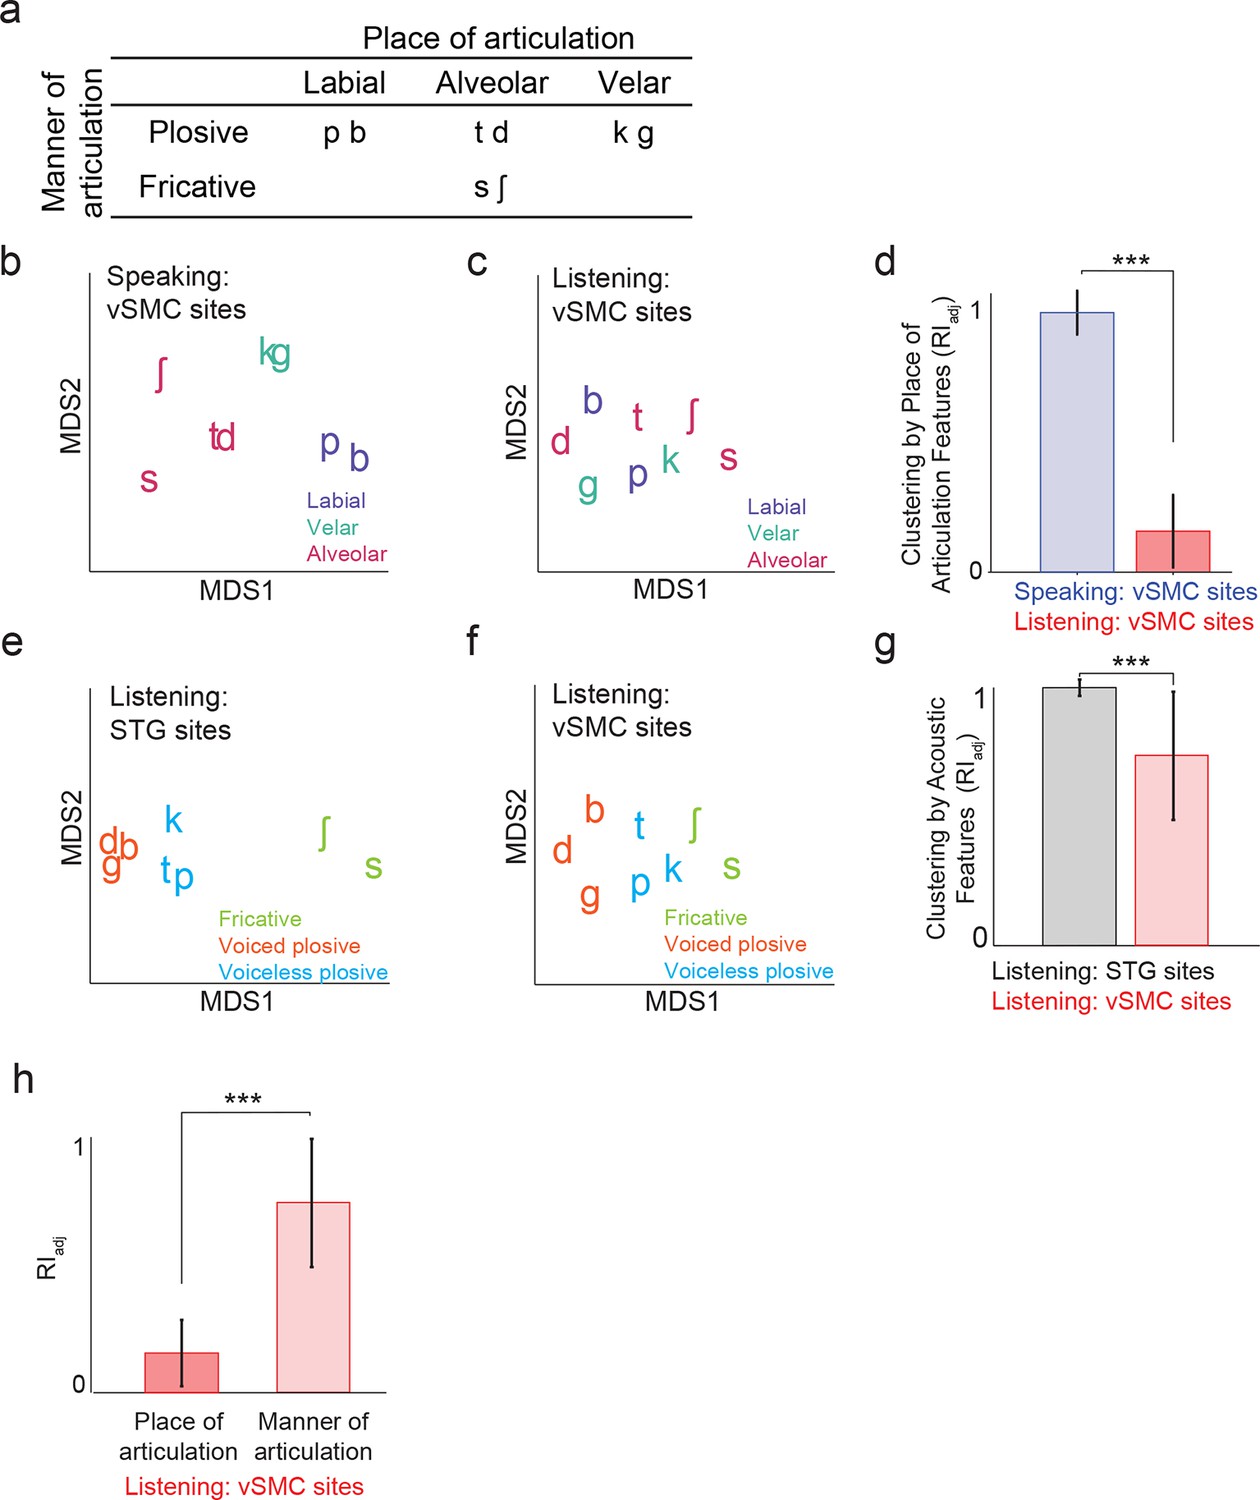
Organization of motor cortex activity patterns.
(a) Consonants of all syllable tokens organized by place and manner of articulation. Where consonants appear in pairs, the right is a voiced consonant, and the left is a voiceless consonant. (b) Relational organization of vSMC patterns (similarity) using multidimensional scaling (MDS) during speaking. Neural pattern similarity is proportional to the Euclidean distance (that is, similar response patterns are grouped closely together, whereas dissimilar patterns are positioned far apart). Tokens are colored by the main place of articulation of the consonants (labial, velar, or alveolar). (c) Similarity of vSMC response patterns during listening. Same coloring by place of articulation. (d) Organization by motor articulators. K-means clustering was used to assign mean neural responses to 3 groups (labial, alveolar, velar) for both listening and speaking neural organizations (b,c). The similarity of the grouping to known major articulators was measured by the adjusted Rand Index. An index of 1 indicates neural responses group by place of articulation features. ***p<0.001, Wilcoxon rank-sum (e) Organization of mean STG responses using MDS when listening. In contrast to c and d, tokens are now colored by their main acoustic feature (fricative, voiced plosive, or voiceless plosive). (f) Organization of mean vSMC responses using MDS when listening colored by their main acoustic feature. (Identical to C, but recolored here by acoustic features). (g) Organization by manner of articulation acoustic features (fricative, voiced plosive, voiceless plosive) for both STG and vSMC organizations when listening (e, f). The similarity of the grouping to known acoustic feature groupings was measured by the adjusted Rand Index. ***p<0.001, Wilcoxon rank sum. (h) During listening, responses in vSMC show significantly greater organization by acoustic manner features compared to place features as assessed by the adjusted Rand Index, indicating an acoustic rather than articulatory representation (***p<0.001, Wilcoxon rank-sum). Bars in this panel are the same as the red bars in (d) and (g). In (d), (g), and (h), bars indicate mean ± standard deviation,
Figure 4—figure supplement 1
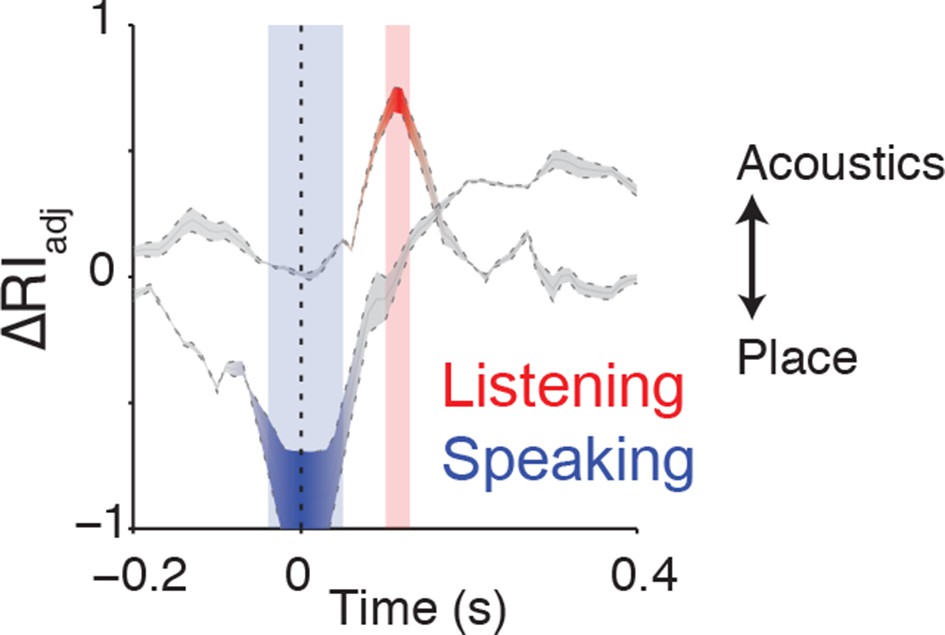
Clustering trajectory analysis of neural responses to syllables.
The clustering trajectory across time was derived from vSMC activity (n=98 electrodes) when speaking (blue) and listening (red) using the ΔRIadj metric. An index of 1 denotes the neural responses organized by acoustic features, and an index of -1 denotes an organization by place of articulation features. Time points indicated by the blue and red windows are significantly organized according to place or acoustics, respectively (FDR-corrected p<0.05, permutation test comparing random clustering at each time point to clustering by acoustics or place).
Figure 4—figure supplement 2
Analysis of short latency responses in vSMC.
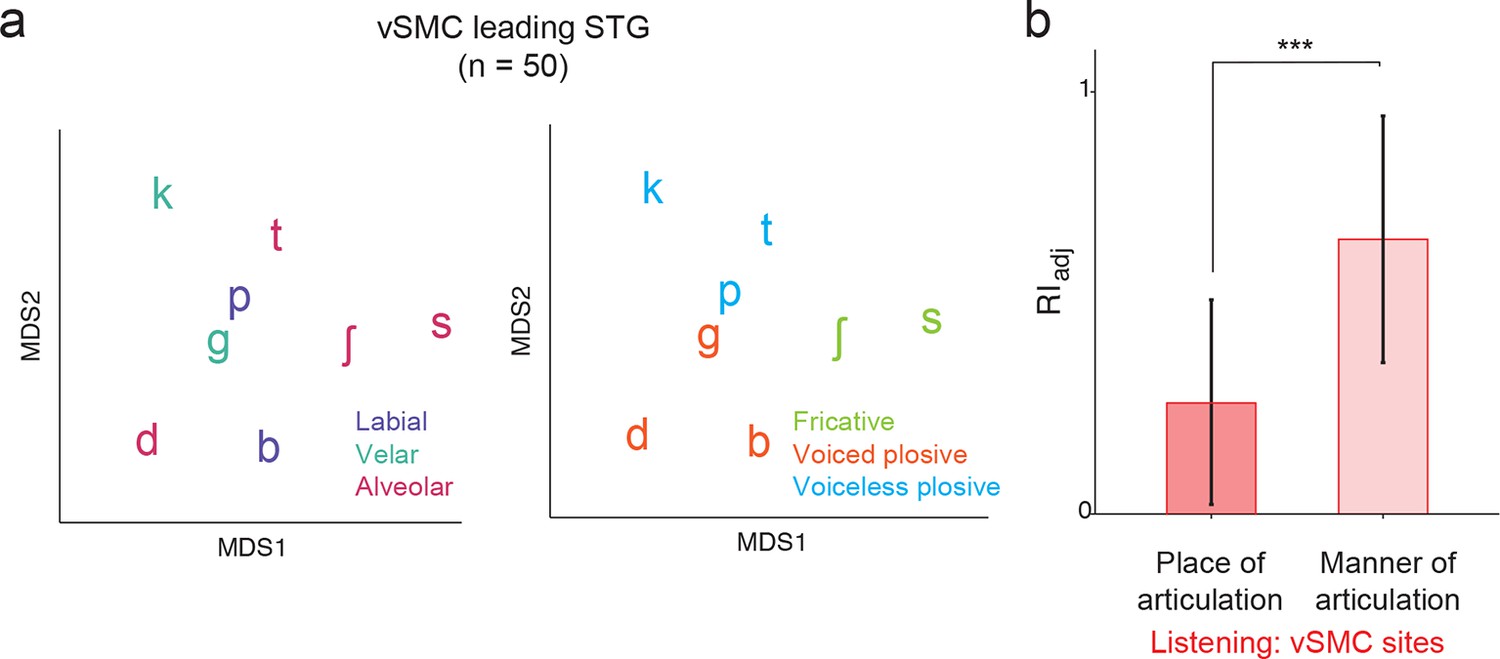
We restricted the MDS analysis to vSMC responses with a positive asymmetry index (see Figure 3d and f, n=50 electrodes) and found significant organization by acoustic manner features during listening in these sites. (a) Similarity of responses to syllables during listening in the subset of vSMC electrodes leading activity in STG. Tokens are colored according to place of articulation features (left) or acoustic manner features (right) as in Figure 4c and f. (b) During listening, responses of short latency sites in the vSMC still show significantly greater organization by acoustic manner features compared to place features as assessed by the adjusted Rand Index, indicating an acoustic rather than articulatory representation (***p<0.001, Wilcoxon rank-sum). Compare with Figure 4h. Bars indicate mean ± standard deviation.
Figure 4—figure supplement 3
Organization of syllable tokens and auditory cortical activity patterns.
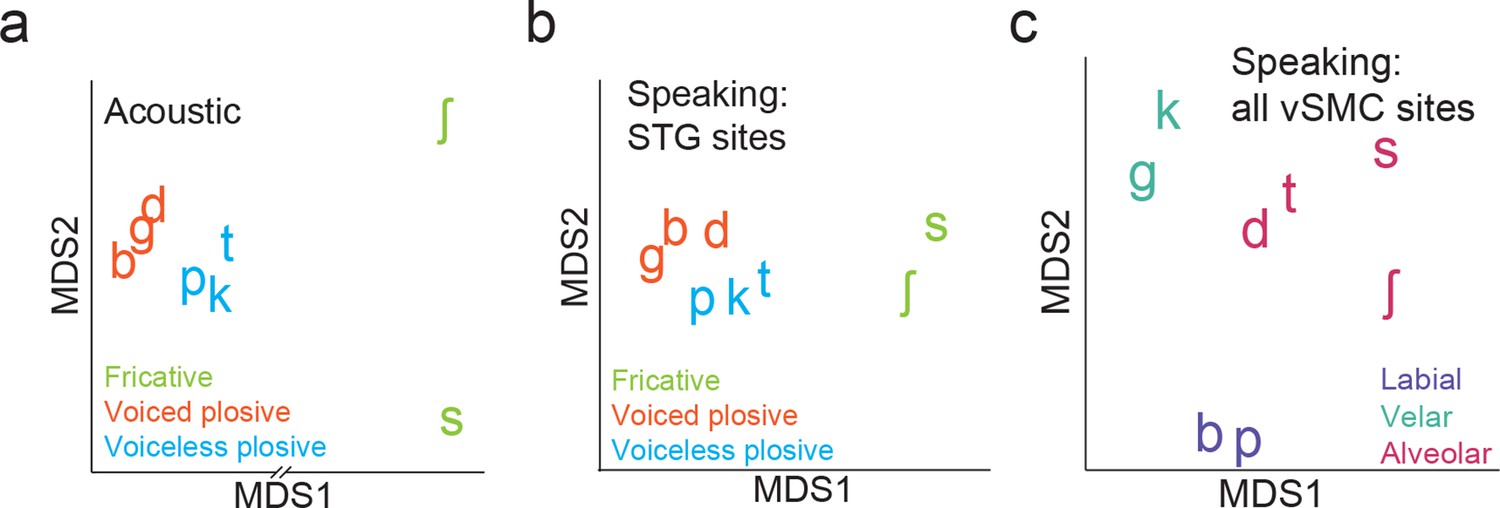
(a) Organization of the acoustic spectrograms of the CV tokens using MDS. (b) Organization of mean STG responses using MDS when speaking. Tokens in (a) and (b) are colored by their main acoustic feature. (c) Organization of vSMC responses by place of articulation using all speech-responsive electrodes (n=362).
Figure 5 with 1 supplement
Acoustic spectrotemporal tuning in vSMC.
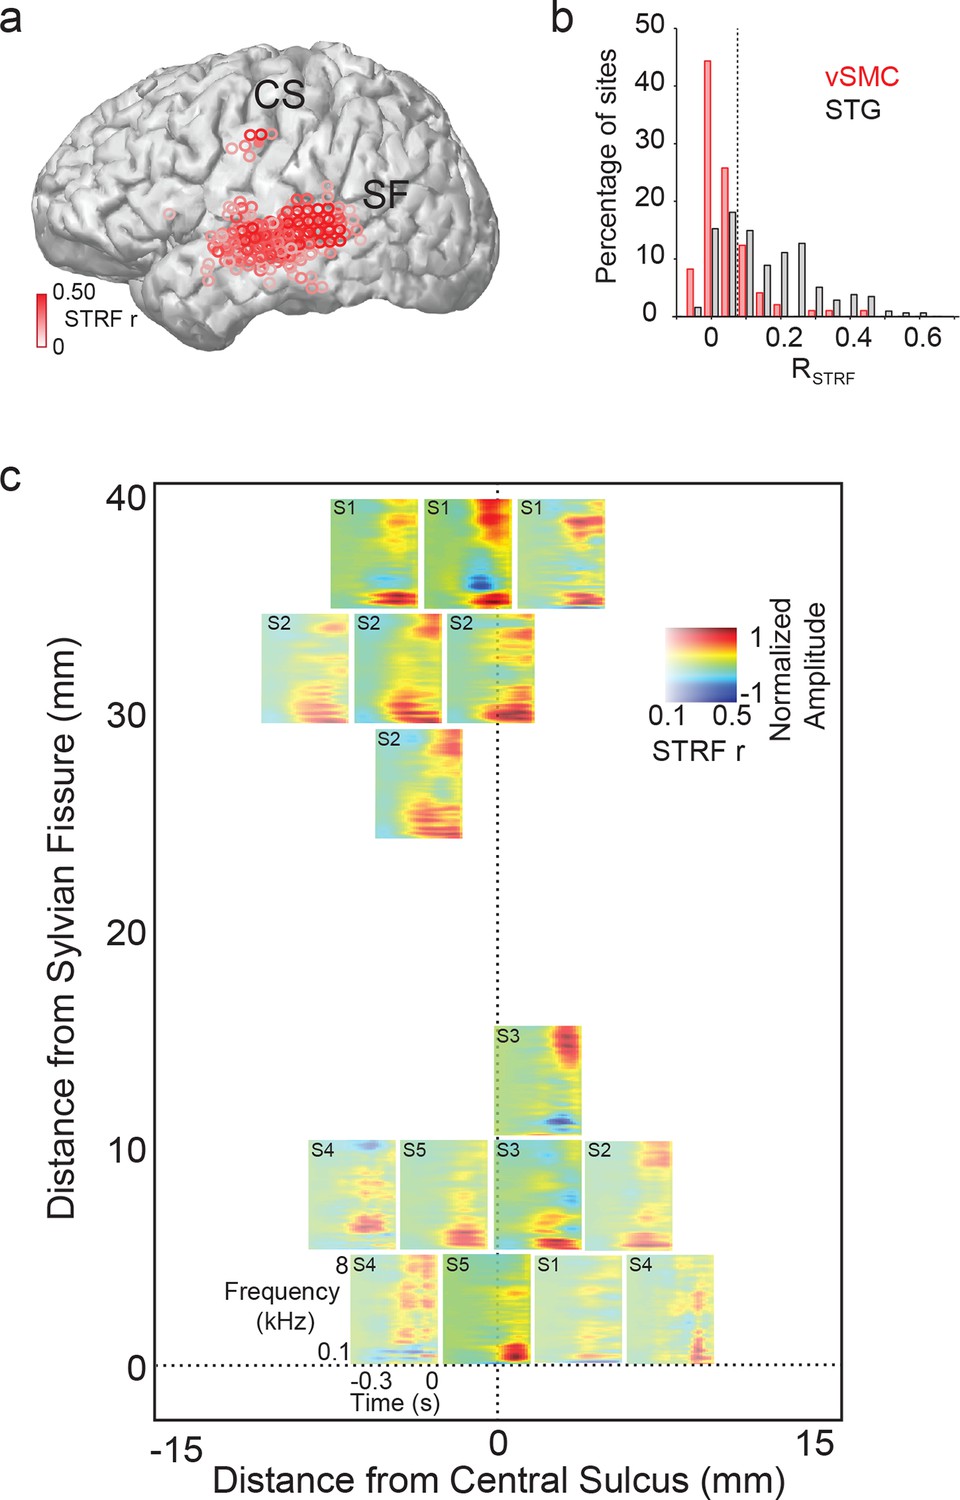
(a) All STRF correlations and locations are plotted with opacity signifying the strength of the correlation. CS denotes the central sulcus; SF denotes the Sylvian fissure. (b) Distribution of STRF prediction correlations for significantly active vSMC and STG sites. Cut-off at r = 0.1 is shown as a dashed line. (c) Individual STRFs from all subjects (S1-S5, STRF correlation>0.1) plotted as a function of distance from the central sulcus and Sylvian fissure, with opacity signifying the strength of the STRF correlation.
Figure 5—figure supplement 1
Summary and comparison of vSMC and STG responses to syllables.
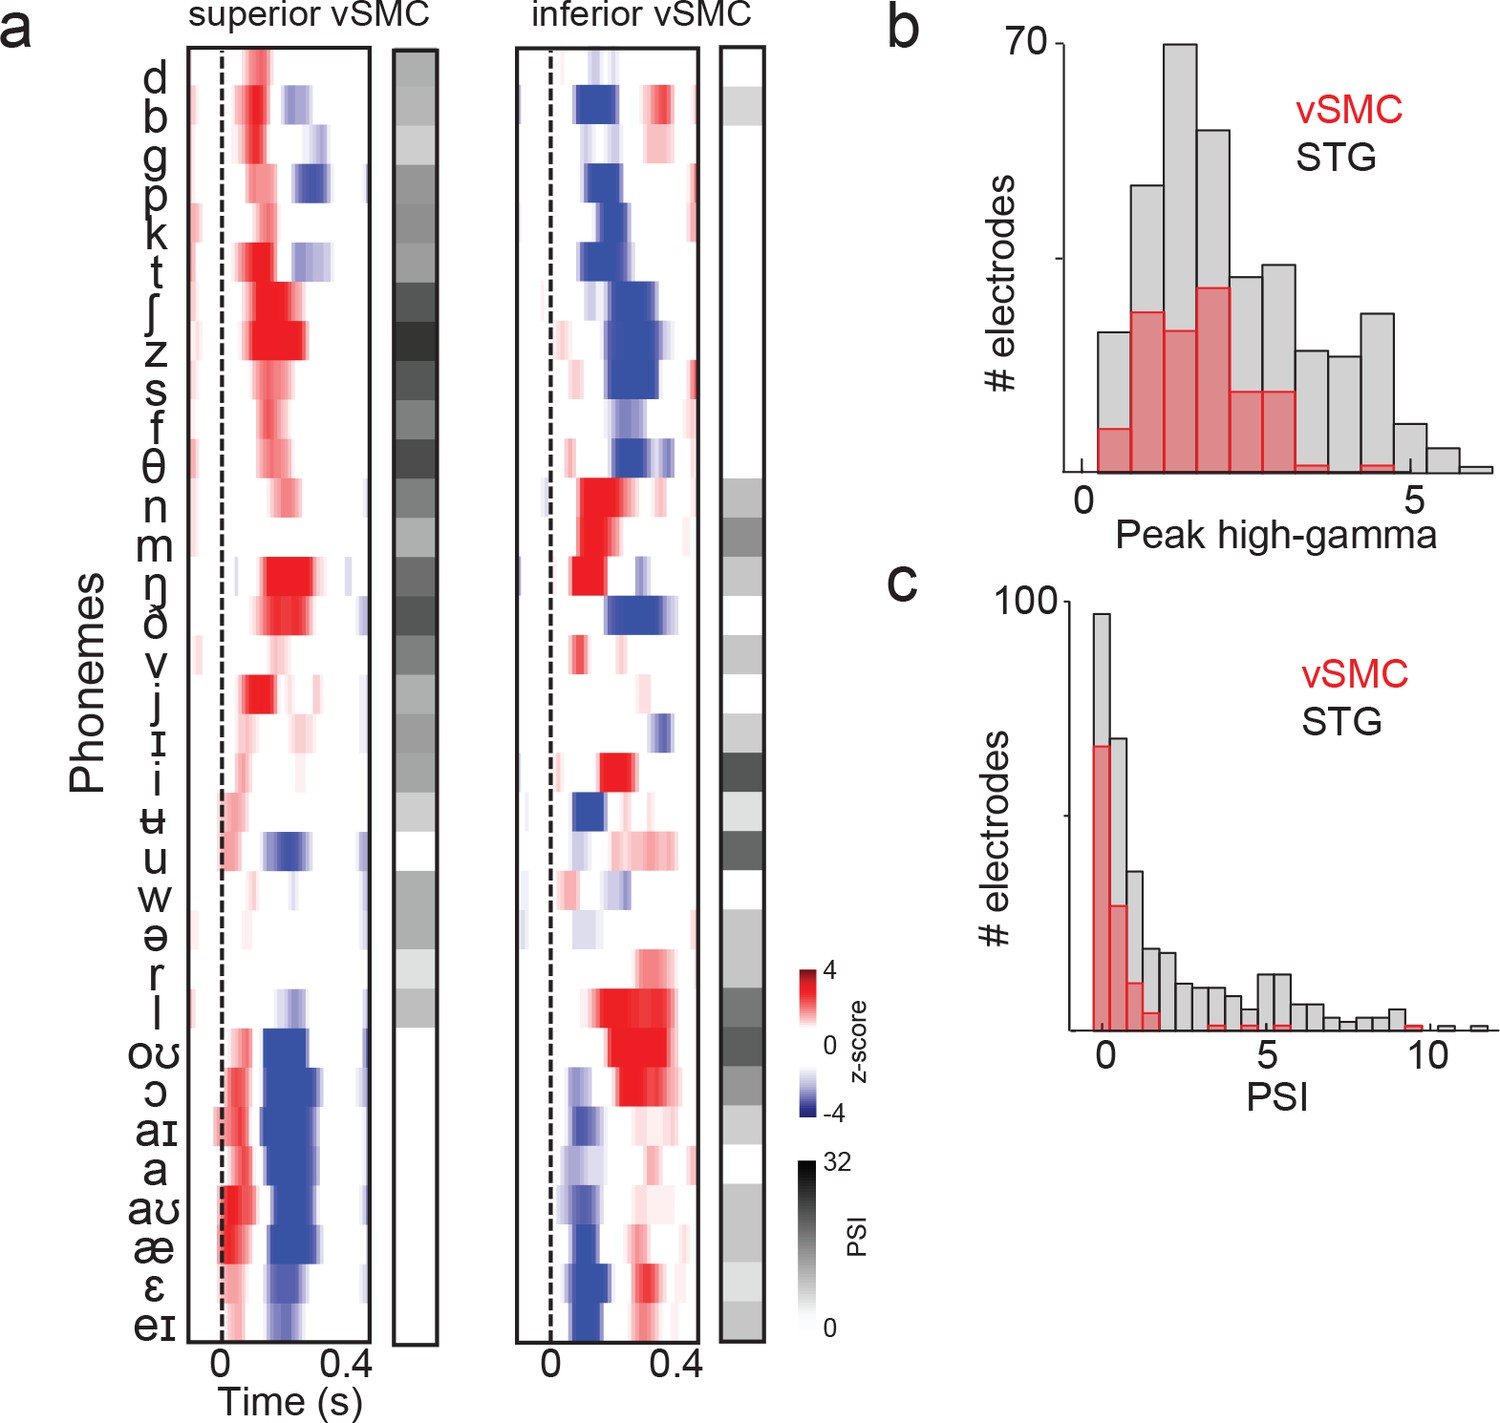
(a) Average responses at sample electrodes to all English phonemes and their PSI vectors. (b) Peak high-gamma z-score distributions for significantly active vSMC and STG sites when listening (p<0.01, comparing silence to stimulus activity). (c) Average PSI distributions for significantly active vSMC and STG sites.
Author response image 1
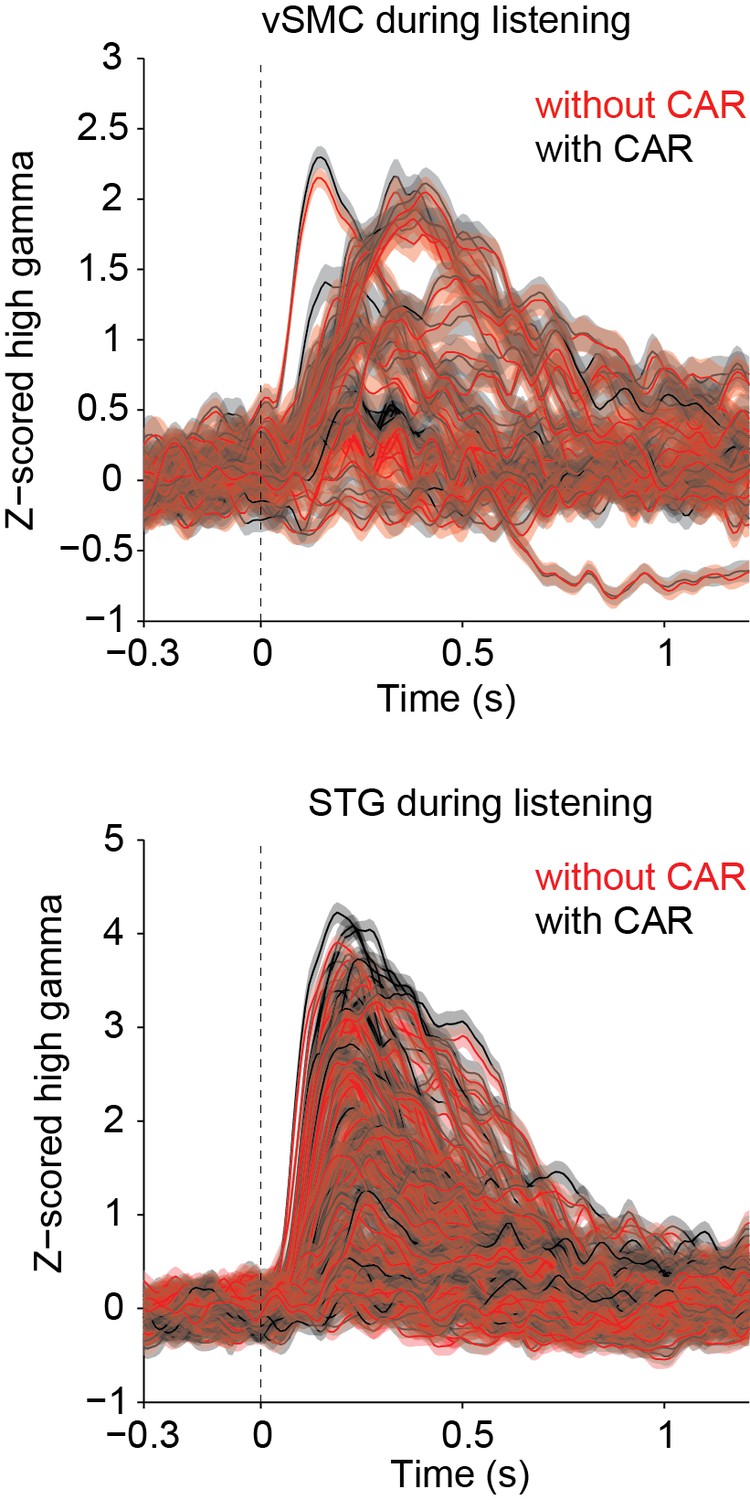
Author response image 2

Download links
A two-part list of links to download the article, or parts of the article, in various formats.
Downloads (link to download the article as PDF)
Open citations (links to open the citations from this article in various online reference manager services)
Cite this article (links to download the citations from this article in formats compatible with various reference manager tools)
The auditory representation of speech sounds in human motor cortex
eLife 5:e12577.
https://doi.org/10.7554/eLife.12577


