Amygdala-ventral striatum circuit activation decreases long-term fear
- Massachusetts Institute of Technology, United States
Figures
Figure 1 with 2 supplements
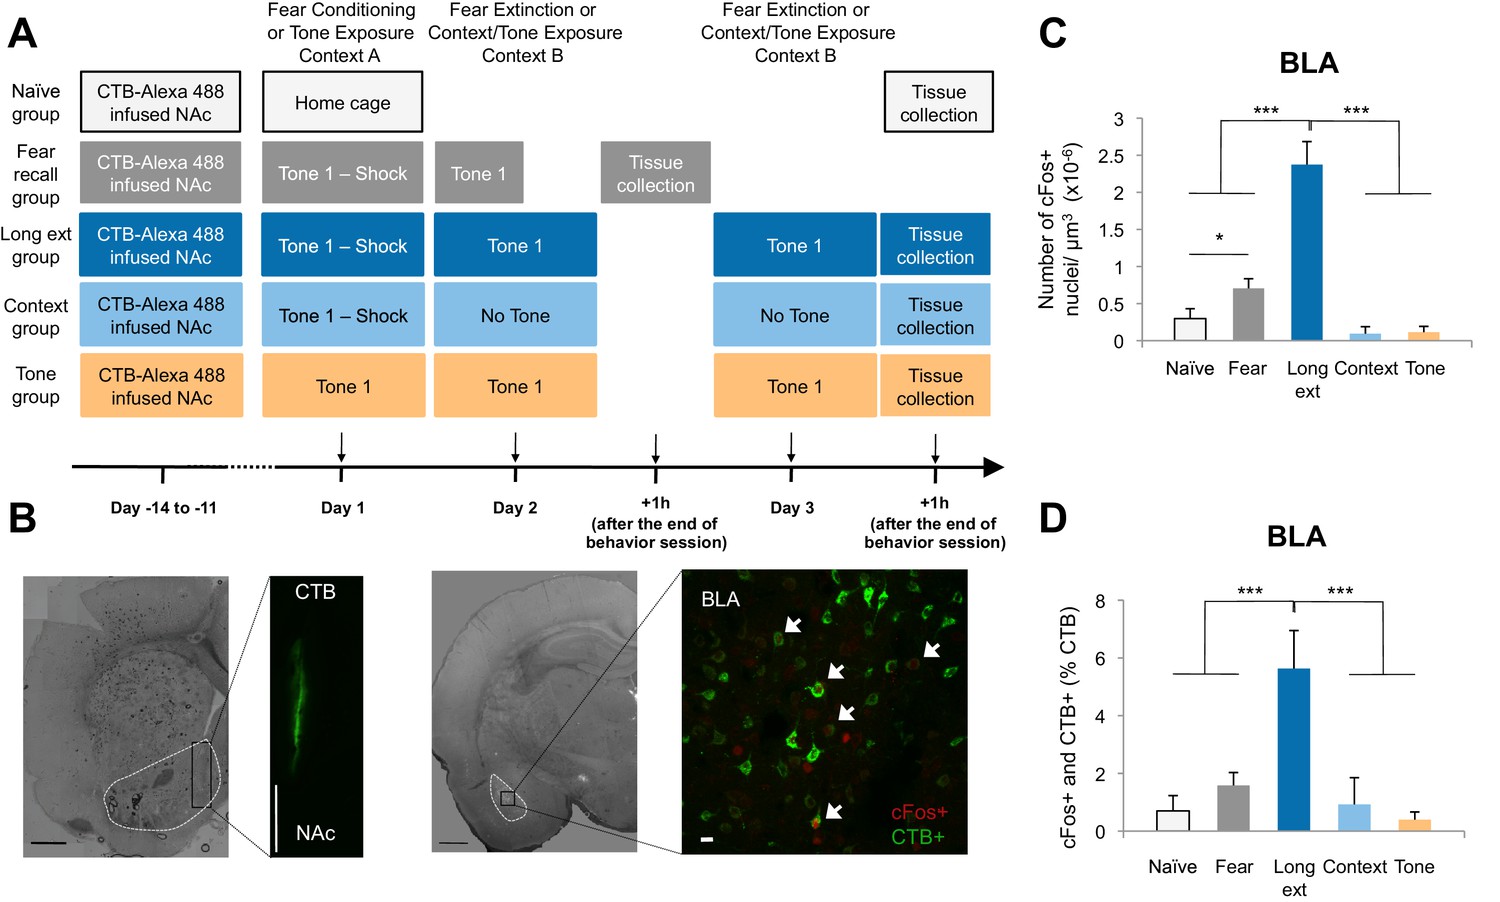
The BLA-NAc circuitry is recruited during extinction of fear.
(A) Experimental design. (B) Coronal slices encompassing the BLA were stained for cFos protein and imaged, and the numbers of CTB+ cells (right panel in green), cFos+ nuclei (right panel in red) and double-labeled cells (right panel, white arrows indicate a subset of this population) were counted (Fear recall group: n = 21 from 3 rats; Long ext group: n = 23 from 4 rats; Context group: n = 12 from 4 rats; Tone group, n = 10 from 4 rats; Naïve group, n = 14 from 3 rats). The right side panel depicts an overlapping image of a Z-projection for each imaged channel. Scale bar on right panel indicates 10 µm; all other scale bars indicate 1 mm. (C) Number of cFos+ cells per µm3 in the BLA (main effect of group, p<0.0001). (D) BLA cells double-labeled for CTB and cFos, normalized to the total number of CTB+ cells (main effect of group, p<0.0001). 'n' represents the number of images analyzed. Statistical significance was calculated with Kruskal-Wallis followed by unpaired planned comparisons. All data are mean ± s.e.m. *p<0.05, ***p<0.001.
Figure 1—figure supplement 1
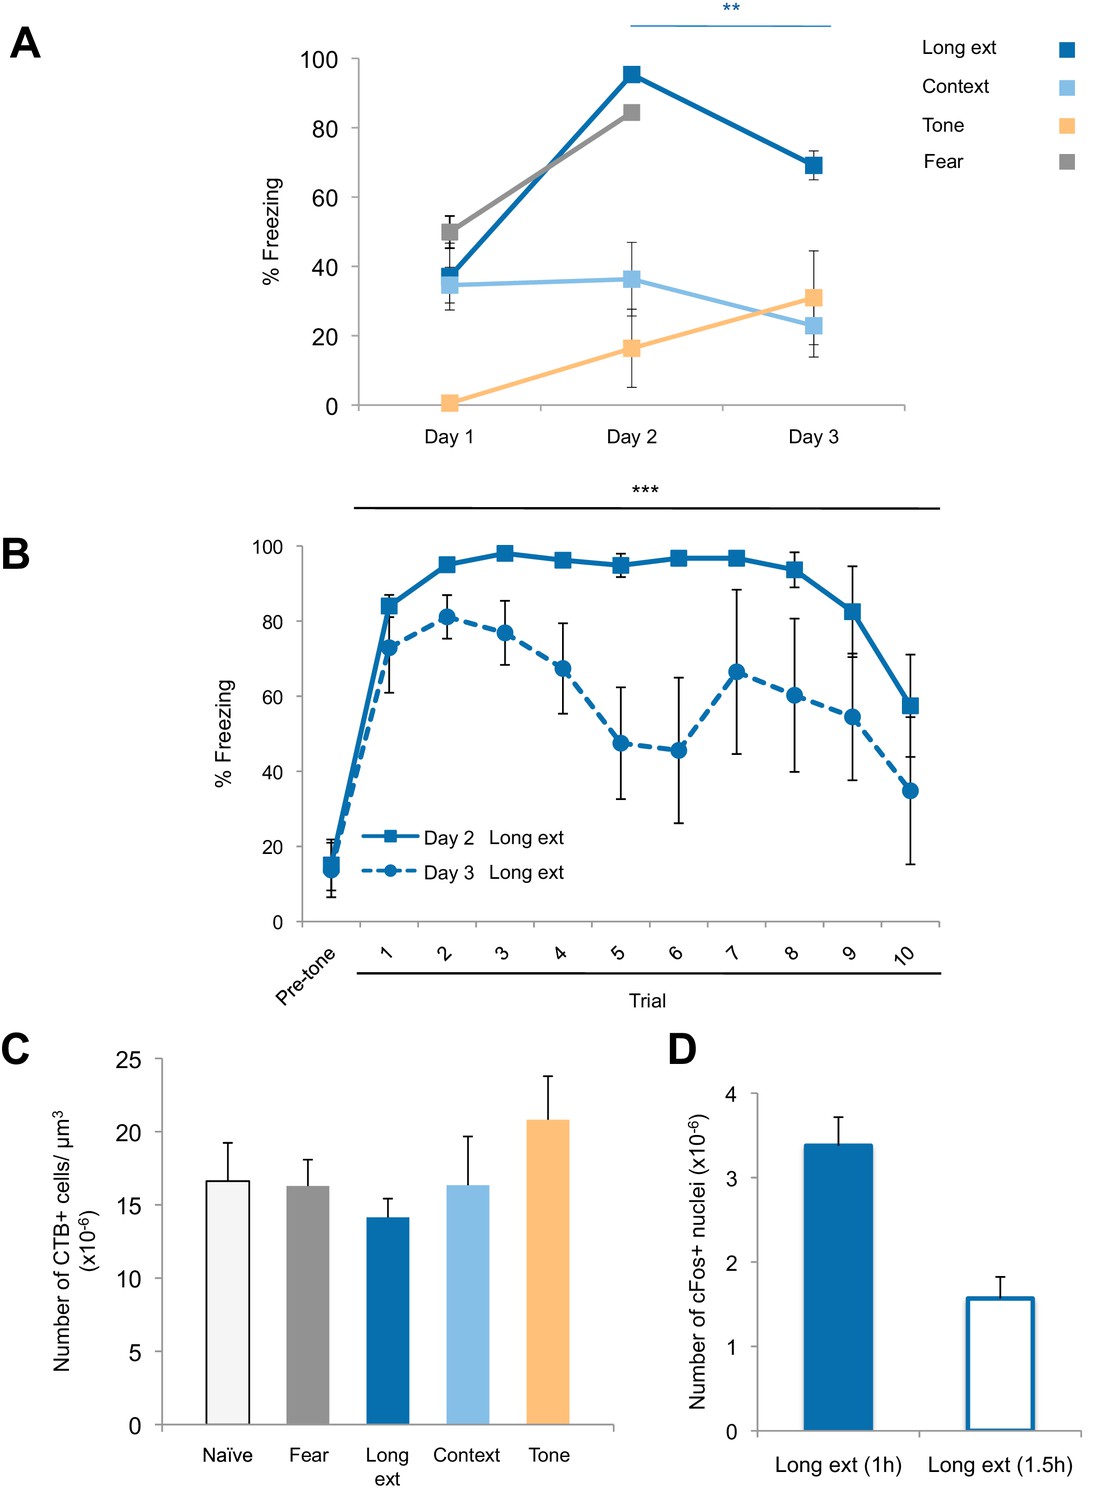
Freezing behavior and retrograde labeling in the BLA.
(A) Freezing behavior for the groups described in Figure 1. Fear to the tone was measured as the percent of time spent freezing during the first five trials of Tone 1 presentations on each behavioral session (main effect of group, p=0.0002). (B) Fear to the tone was measured as the percent of time spent freezing per trial for rats in the Ext recall group for the first 10 trials of each extinction session on Days 2 and 3 (main effect of day, p<0.0001). (C) Coronal slices encompassing the amygdala were imaged and numbers of CTB+ cells were counted. Number of CTB+ cells per µm3, in the BLA was calculated (main effect of group, p=n.s.). 'n' represents the number of animals. (D) An additional set of rats was trained as for the Long ext group, but sacrificed 1.5 hr after the end of the last behavior session. Coronal slices encompassing the BLA were stained for cFos protein and imaged, and the numbers of cFos+ nuclei were counted and plotted as the number of cFos+ cells per µm3 (main effect of group, p=0.0008. Statistical significance was determined by Kruskal-Wallis and paired planned comparisons (A), Wilcoxon test (B), Kruskal-Wallis (C), or the two-tail Mann-Whitney test (D). All data are mean ± s.e.m. **p<0.01, ***p<0.001.
Figure 1—figure supplement 2
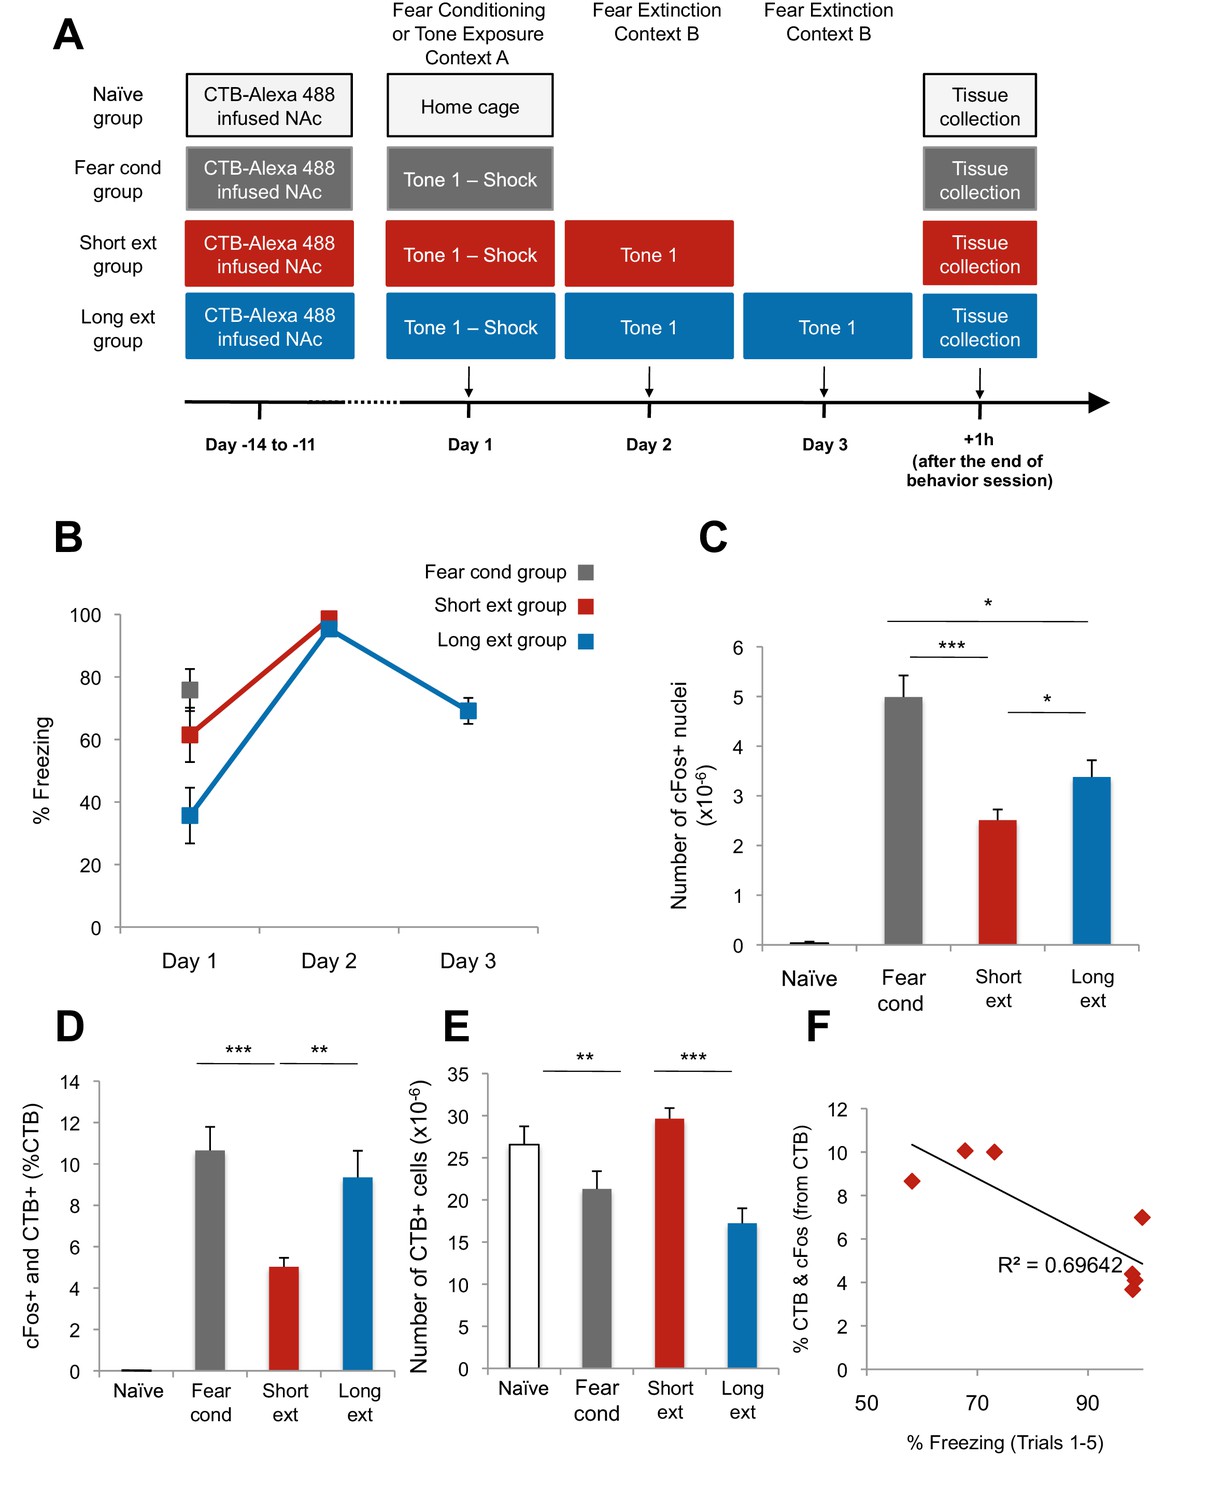
The BLA-NAc circuitry is recruited during fear conditioning and extinction of fear.
(A) Experimental design. (B) Fear to the tone was measured as the percent of time spent freezing during the first five trials of Tone 1 presentations in each behavioral session (one session per day, as indicated, main effect of day, p=0.04). (C–E) Coronal slices encompassing the BLA were stained for cFos protein and imaged, and the numbers of CTB+ cells, cFos+ nuclei, and double-labeled cells were counted. Fear cond group, n = 18 images from 3 rats; Short ext group, n = 26 sections from 4 rats; Long ext group, n = 10 from 3 rats; Naïve group, n = 15 sections from 4 rats. For the Fear cond group, additional coronal brain slices containing the BLA were taken from the rats described in Figure 1. These slices were stained and imaged with slices from the additional groups depicted here. (C) Number of cFos+ cells per µm3, in the BLA (main effect of group, p<0.0001). (D) BLA cells double-labeled for CTB and cFos, normalized to the total number of CTB+ cells (main effect of group, p<0.0001). (E) Number of CTB+ cells per µm3, in the BLA was calculated (main effect of group, p=0.003). (F) For rats in the Short ext and Long ext groups, sacrificed after identical behavioral sessions, a significant inverse correlation was found between the percent of BLA cells double-labeled for CTB and cFos and the percent of time spent freezing during the extinction session prior to sacrifice (p=0.02, each data point represents one rat). Statistical significance was calculated with Kruskal-Wallis followed by paired planned comparisons (A) or Kruskal-Wallis followed by unpaired planned comparisons (C–E) or (G, H). All data are mean ± s.e.m. *p<0.05, ***p<0.001.
Figure 2 with 3 supplements
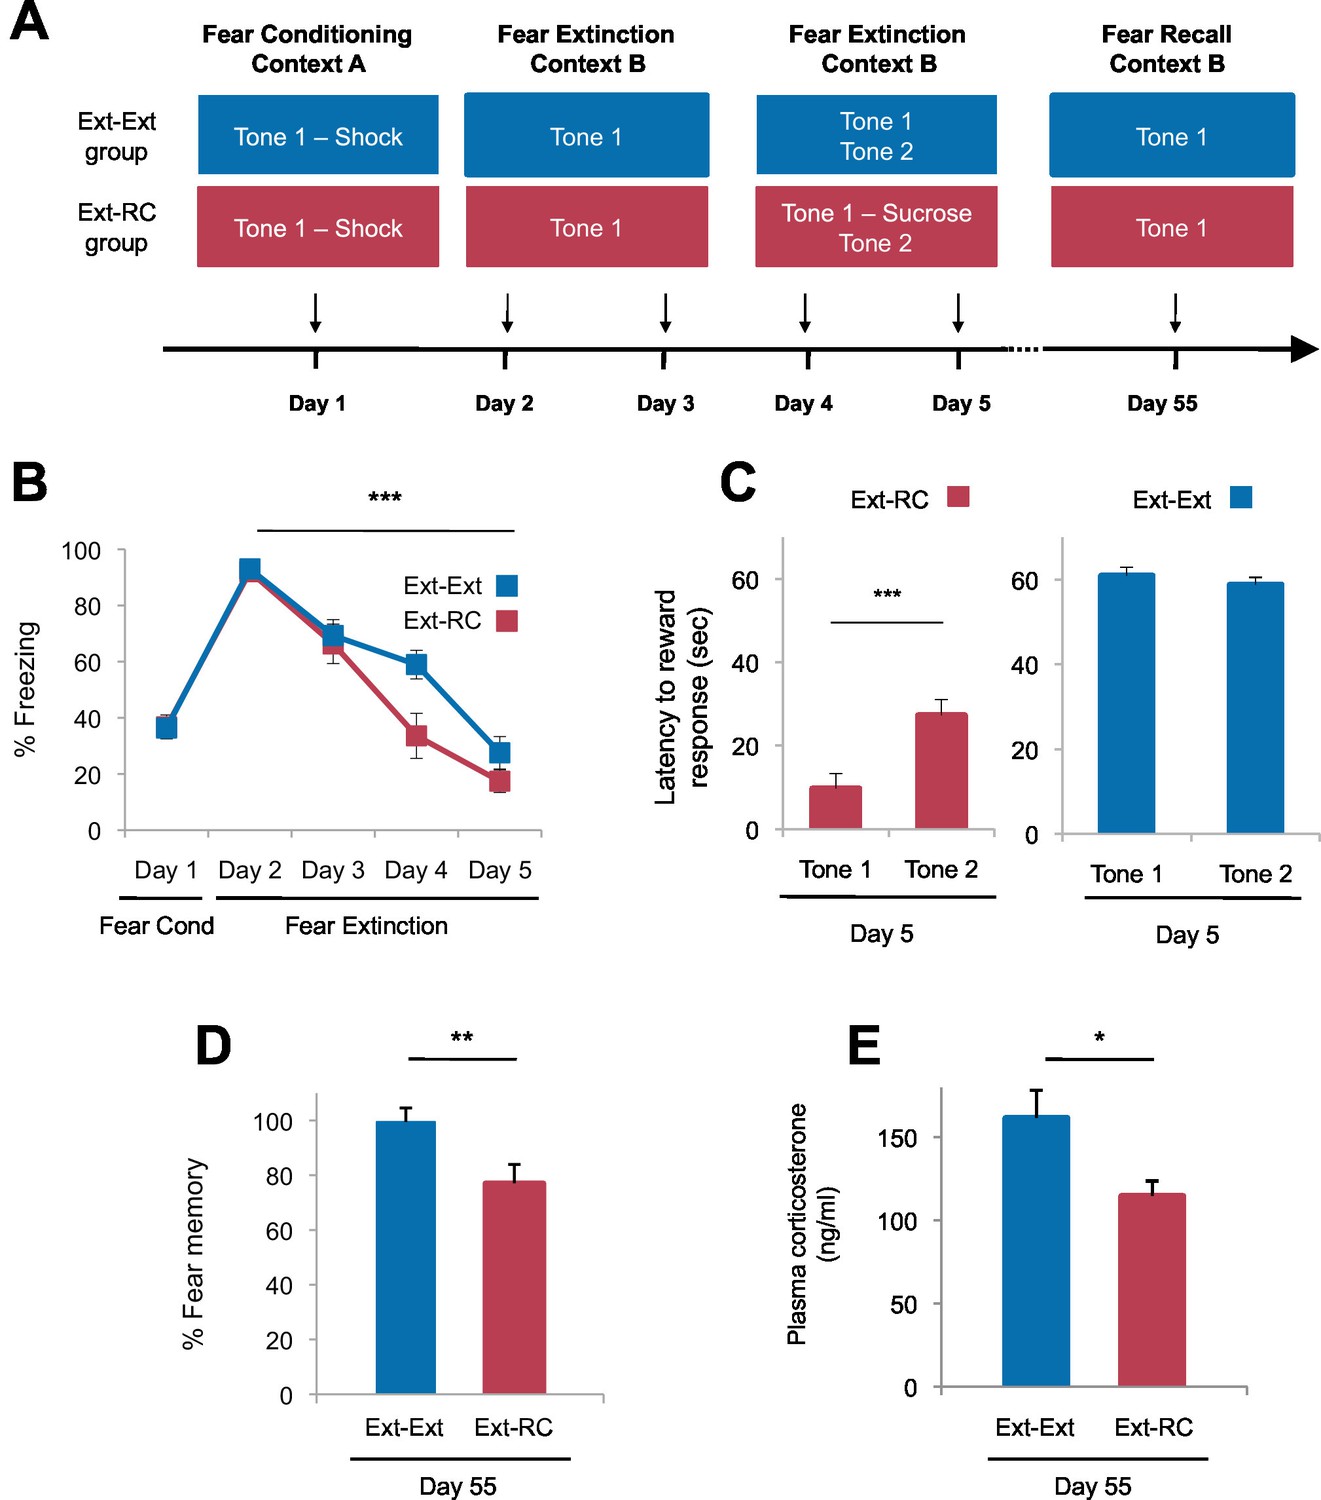
Tone-reward pairing during auditory fear extinction impedes the return of fear.
(A) Experimental design (Ext-Ext group, n = 18; Ext-RC group, n = 16). (B) Fear to the tone was measured as the percent of time spent freezing during Tone 1 trials within the first five trials of each behavioral session (one session per day, as indicated; main effect of group, p=n.s.; for Days 2 to 5: main effect of day, p<0.0001). (C) Reward learning was assessed by the latency to respond at the reward port after Tone 1 (reward paired tone for group Ext-RC, n = 16) and Tone 2 (neutral tone), for rats in the Ext-RC group (p<0.001) and rats in the Ext-Ext group (n = 18, p=n.s.). (D) Return of fear on Day 55 was calculated as the percent of time spent freezing in the first five trials of Tone 1 presentations of Day 55 normalized (per rat) to the percent of time spent freezing during the first five trials of Tone 1 presentations of Day 2 (p<0.01). (E) Plasma corticosterone levels from rats in the Ext-Ext and Ext-RC groups on Day 55 (n = 12 for Ext-Ext, n = 9 for Ext-RC; p<0.05). 'n' represents the number of animals. Statistical significance was calculated using the Wilcoxon paired test (C) or two-tail Mann-Whitney test (B,D,E) followed by planned paired comparisons (B). All data are mean ± s.e.m. *p<0.05, **p<0.01, ***p<0.001.
Figure 2—figure supplement 1
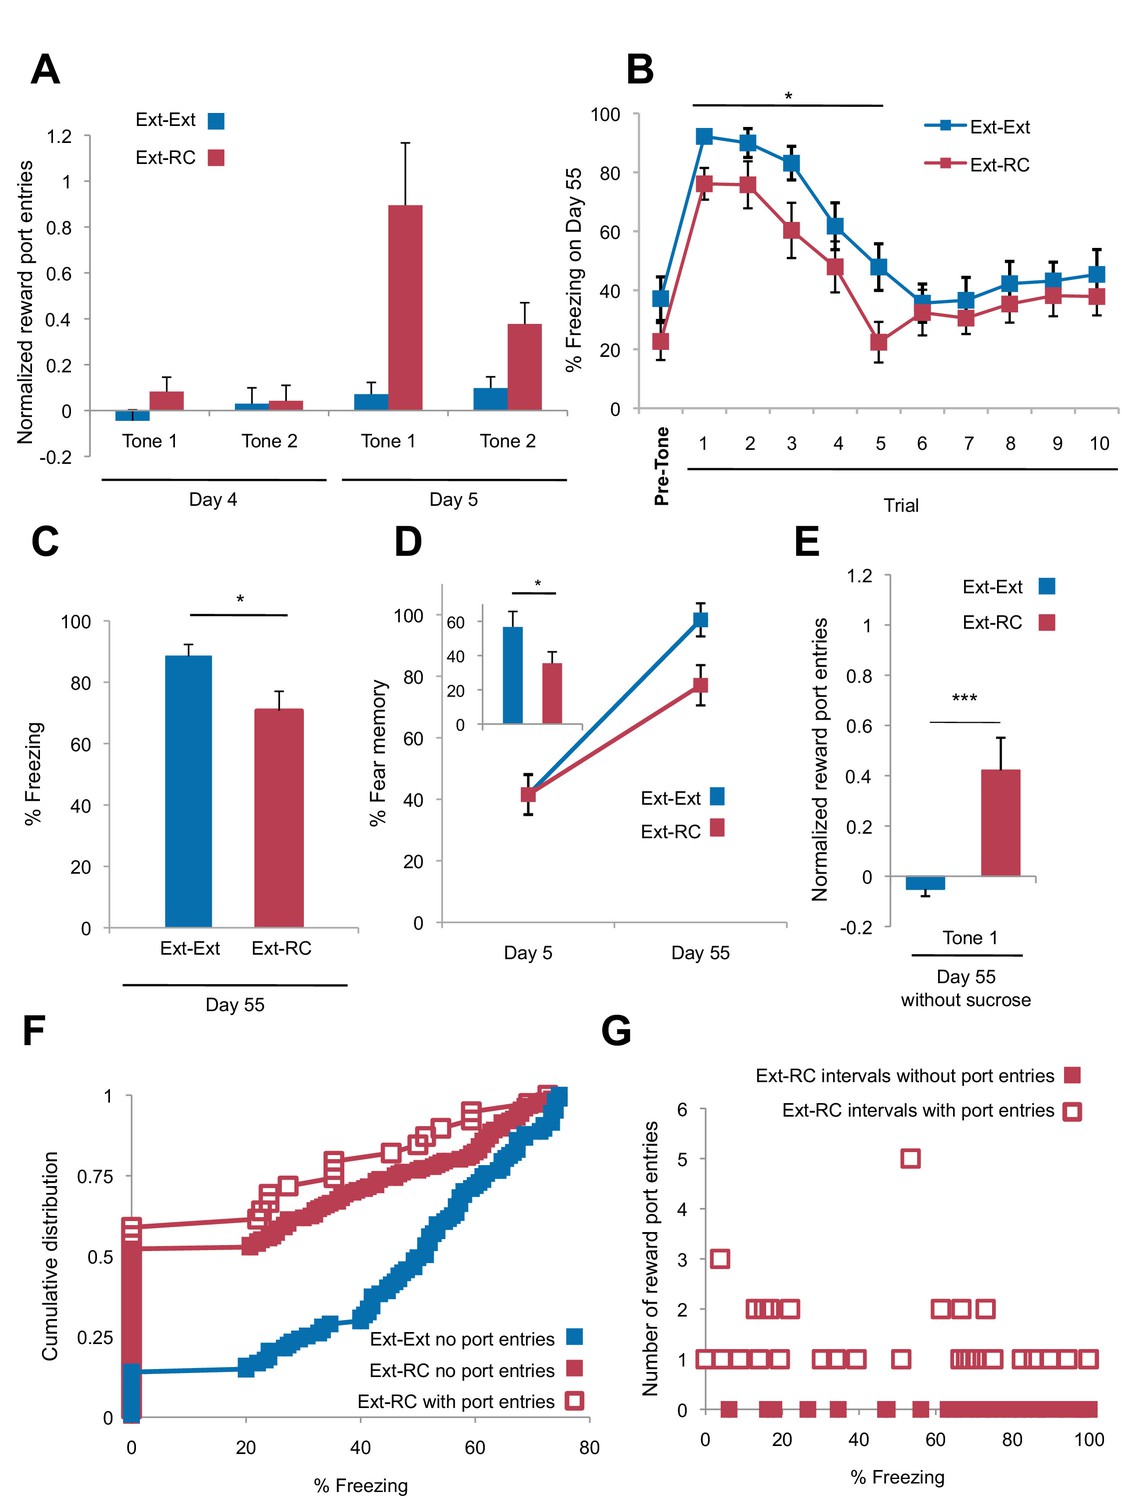
Tone-reward pairing during auditory fear extinction impairs return of fear.
(A) Normalized reward port entries during the first 5 tones of each type are depicted (main effect of group, p<0.01; due to equipment malfunction, n = 15 for Ext-Ext group on Day 4; for all other groups, n is as indicated in Figure 1). (B) Trial-by-trial fear to the tone on Day 55 is shown (main effect of group, p<0.001) for the first 10 trials. (C) The raw percent of time spent freezing during all Tone 1 presentations on Day 55 is shown (p<0.05). (D) The % fear memory for the last four trials of the fear extinction session to Tone 1 on Day 5 and all Tone 1 trials within the first five trials of the fear test with on Day 55 is plotted (main effect of group on Day 55, p<0.01; inset represents the difference between the % fear memory on Day 55 versus Day 5 for each group, p<0.05). (E) Normalized (p<0.001) reward port entries during tone presentations in the Day 55 fear recall test are shown for a subset of rats (Ext-Ext group: n = 16; Ext-RC group: n = 15). (F) For periods of lower fear (freezing values below 75%) the percent of time spent freezing for rats whose fear expression data is represented in Figure 2D was calculated for each 5 s interval during the first three trials of the fear memory test on Day 55 and plotted as cumulative distributions. For the Ext-RC group, the percent of time spent freezing within intervals where a reward port entry occurred was plotted separately from intervals without a reward port entry (no significant difference between the distribution of % freezing intervals with port entries or without port entries for Ext-RC). For the Ext-Ext group the percent of time spent freezing for intervals without a reward port entry was plotted (p<0.001 for comparison between the % freezing distributions for the Ext-Ext and Ext-RC groups for intervals without port entries). (G) For rats in the Ext-RC group, average freezing levels and total number of reward port entries during 30 sec intervals of the first three trials of the fear memory test on Day 55 were calculated. For the majority of intervals in which no port entries were displayed on Day 55, freezing levels were extremely high. This results in an overall negative correlation between reward port entries and freezing (p<0.0001). However, for intervals in which reward port entries were displayed, there was no relationship with the level of freezing behavior observed (p=0.57). 'n' represents number of animals. Statistical significance was calculated with the two-tail Mann-Whitney test (A–D), two-tail t-test for unpaired data (E), Kolmogorov-Smirnov test (F), or correlation analysis (G). All data are mean ± s.e.m. *p<0.05, ***p<0.001.
Figure 2—figure supplement 2
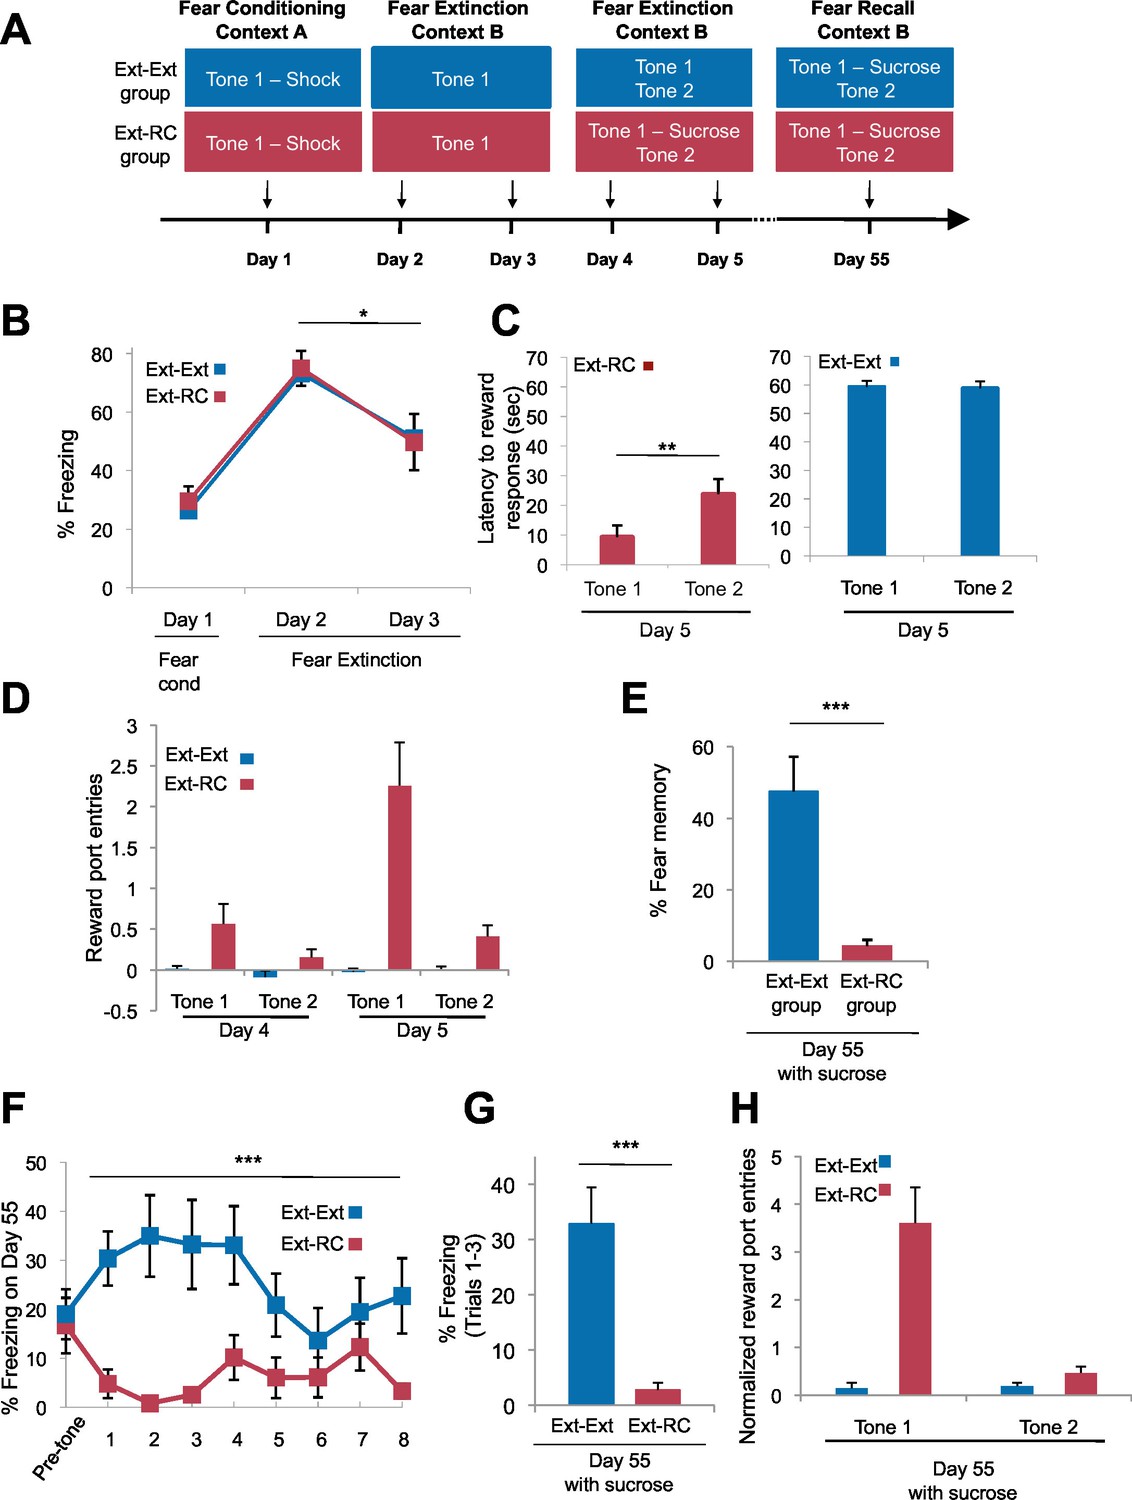
Fear expression is inhibited when reward is delivered during the recovery test.
(A) Experimental design (Ext-Ext group: n = 18; Ext-RC group: n = 12). Rats were trained as in Figure 2, but the fear recall session was conducted with sucrose delivery following Tone 1 presentations. (B) Fear to the tone was measured as the percent of time spent freezing during the first five trials of Tone 1 presentation within each behavioral session (one session per day, as indicated; main effect of group p=n.s.; for Days 2 and 3: main effect of day, p<0.05). (C) Reward learning was calculated as the latency to respond at the reward port after Tone 1 (paired with the reward for Ext-RC group) or Tone 2 (never paired with reward). Left panel, p<0.01; Right panel, p=n.s. (D) Normalized (main effect of group, p<0.0001) reward port entries to Tones 1 and 2 on Days 4 and 5. Note that reward-seeking behavior occurred during both reward sessions on Days 4 and 5 but discriminative tone-induced nose-pokes occurred only during the second reward session on Day 5. (E) The % fear memory recall on Day 55 was calculated (per rat) as the % freezing on all Tone 1 trials within the first five trials of Day 55 normalized to the % freezing on the first five trials of Tone 1 presentation during Day 2 (p<0.0001). (F) Trial-by-trial freezing behavior (percent of time spent freezing) on Day 55 is shown (main effect of group, p<0.0001) for the first 10 trials (a mix of Tone 1 and Tone 2 presentations). (G) Fear to the tone was measured as the average percent of time spent freezing during all Tone 1 trials within the first five trials on Day 55 (p<0.0001). (H) The persistence of reward learning assessed on Day 55. Normalized (main effect of group, p<0.0001) nose-pokes are shown. 'n' represents number of animals. Statistical significance was calculated with two-tail Mann-Whitney test (B,D–H) followed by paired planned comparisons (B) or Wilcoxon paired test (C). All data are mean ± s.e.m. *p<0.05, **p<0.01, ***p<0.001.
Figure 2—figure supplement 3
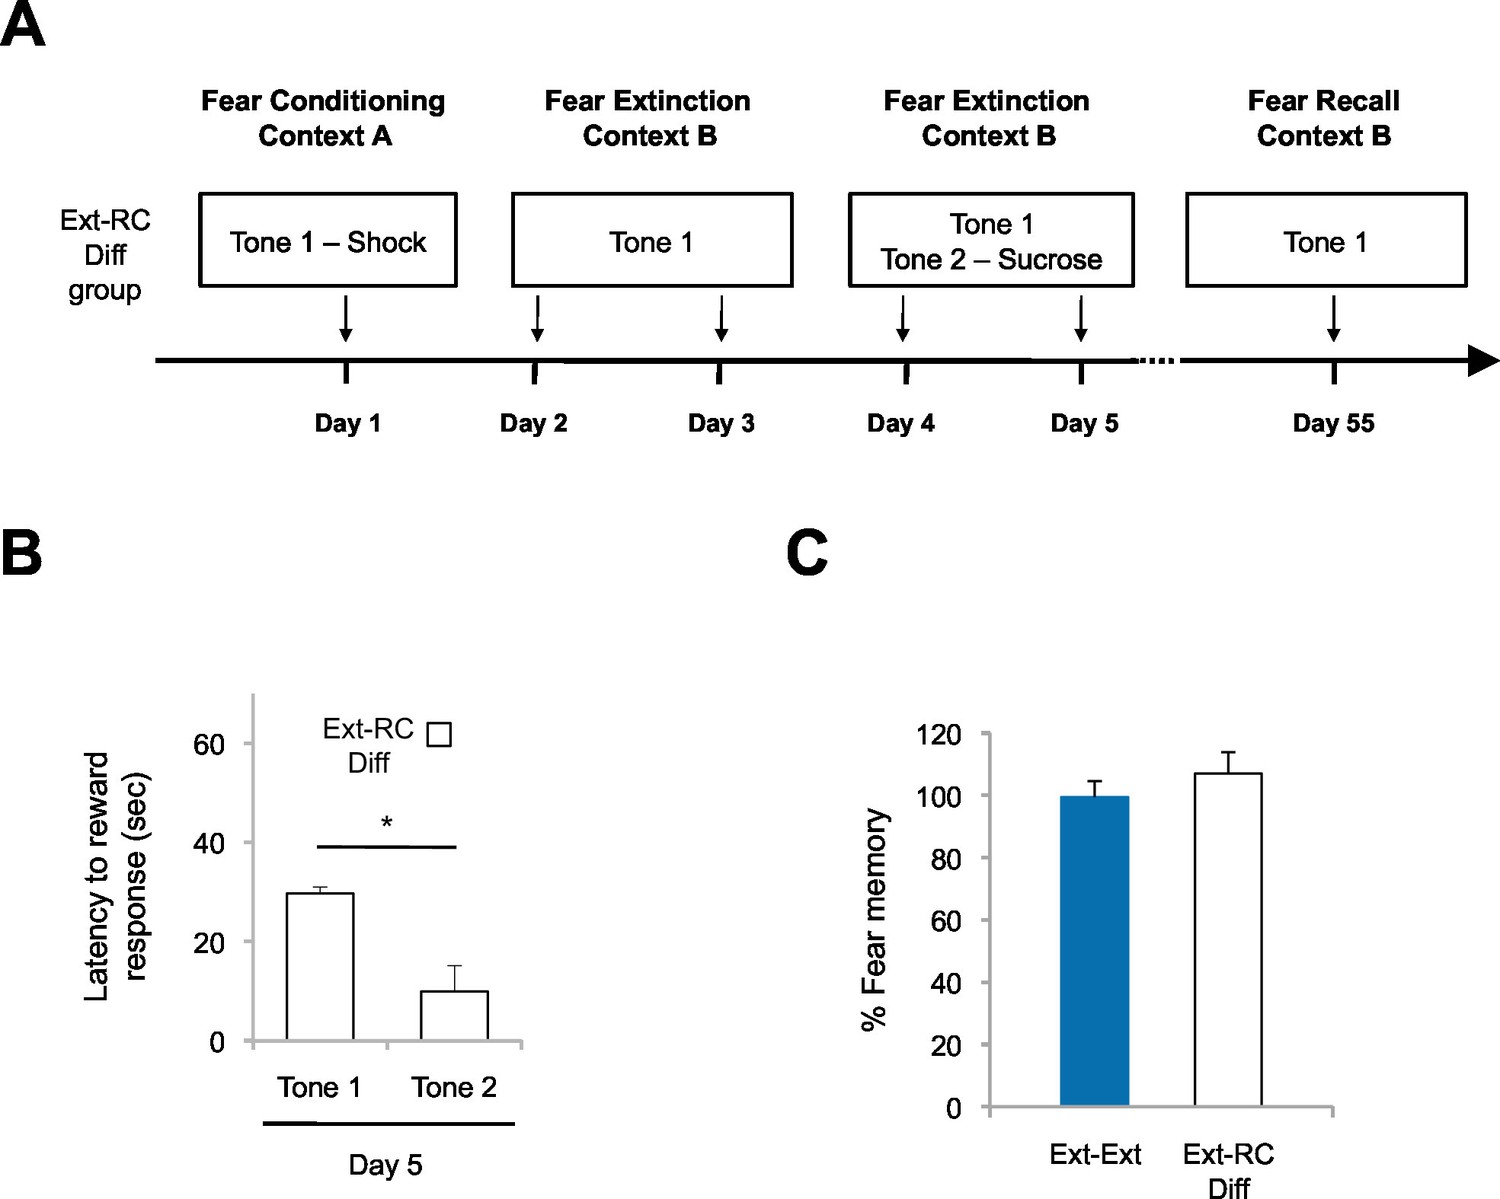
Fear return is not affected by reward conditioning when the fear-associated and reward-associated tones are different.
(A) Experimental design (Ext-RC Diff group, n = 3). (B) Reward learning was calculated as the latency to respond at the reward port after Tone 1 (neutral tone) and Tone 2 (reward paired tone for group Ext-RC tone 2) for rats in the Ext-RC Diff group (p<0.05). (C) Fear recall on Day 55 was calculated as the percent of time spent freezing on the first five trials on Day 55 normalized to the percent of time spent freezing on the first five trials on Day 2 (p=n.s.). Data for the Ext-Ext group is the same as presented in Figure 2D; data for the two groups was collected at the same time. 'n' represents number of animals. Statistical significance was calculated with the two-tail t-test for paired data (B) or two-tail Mann-Whitney test (C). All data are mean ± s.e.m. *p<0.05.
Figure 3 with 3 supplements
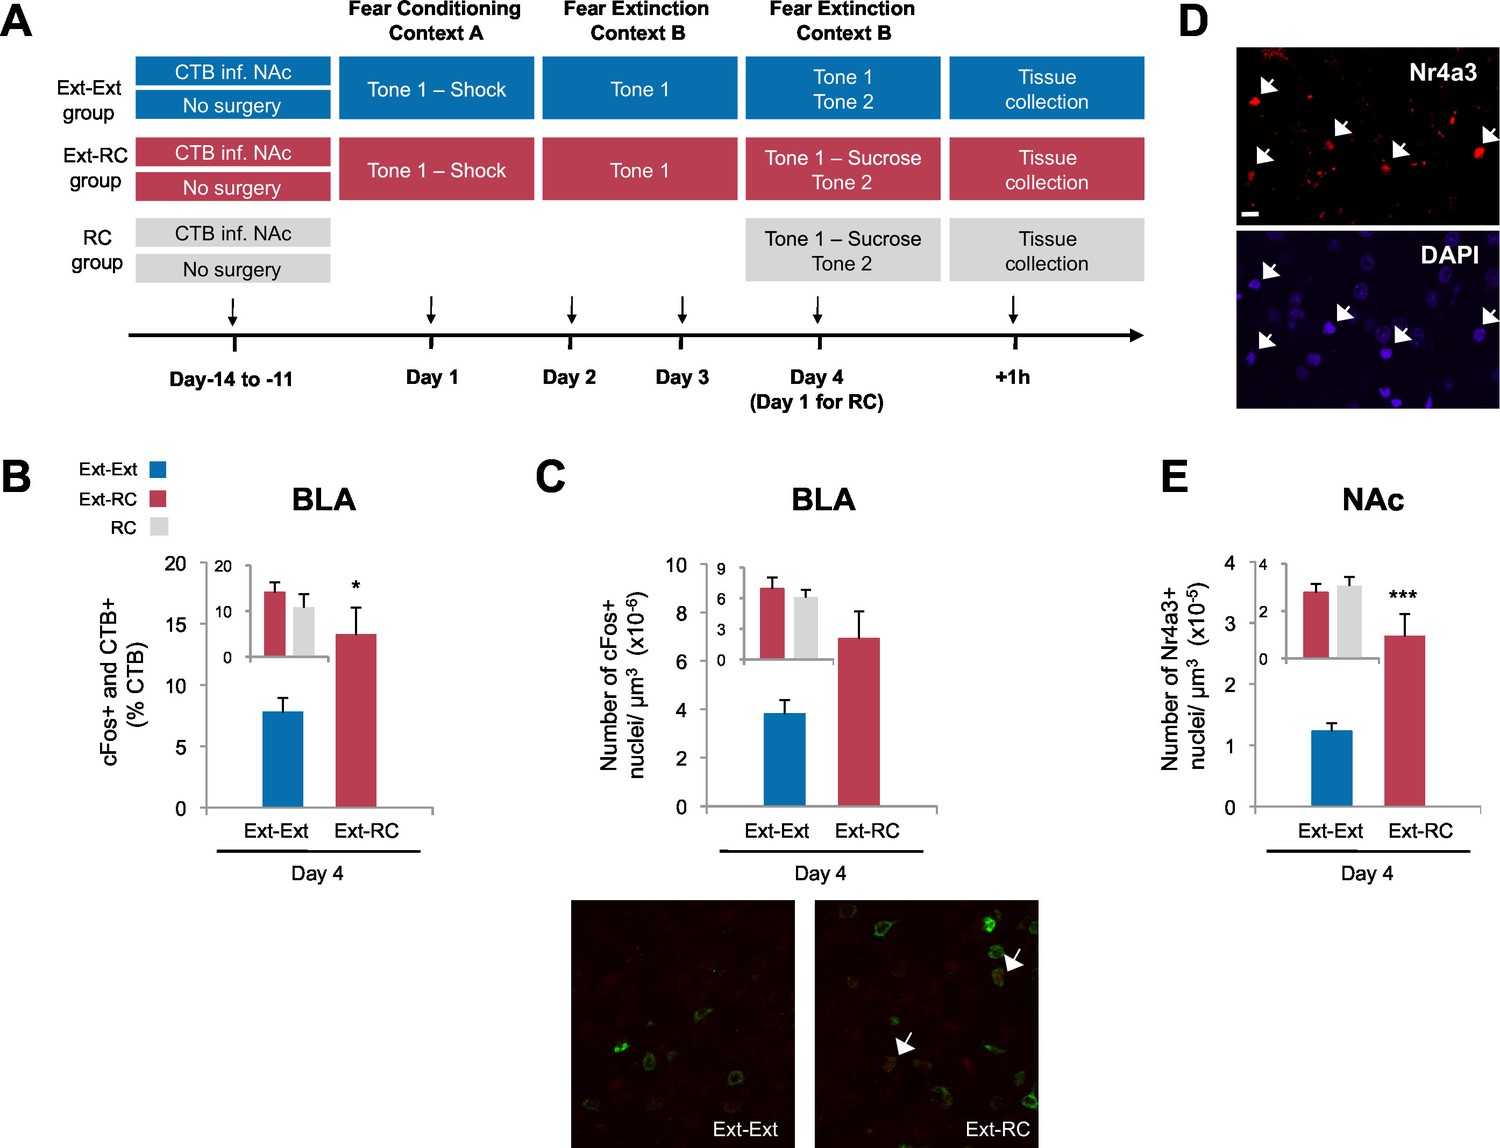
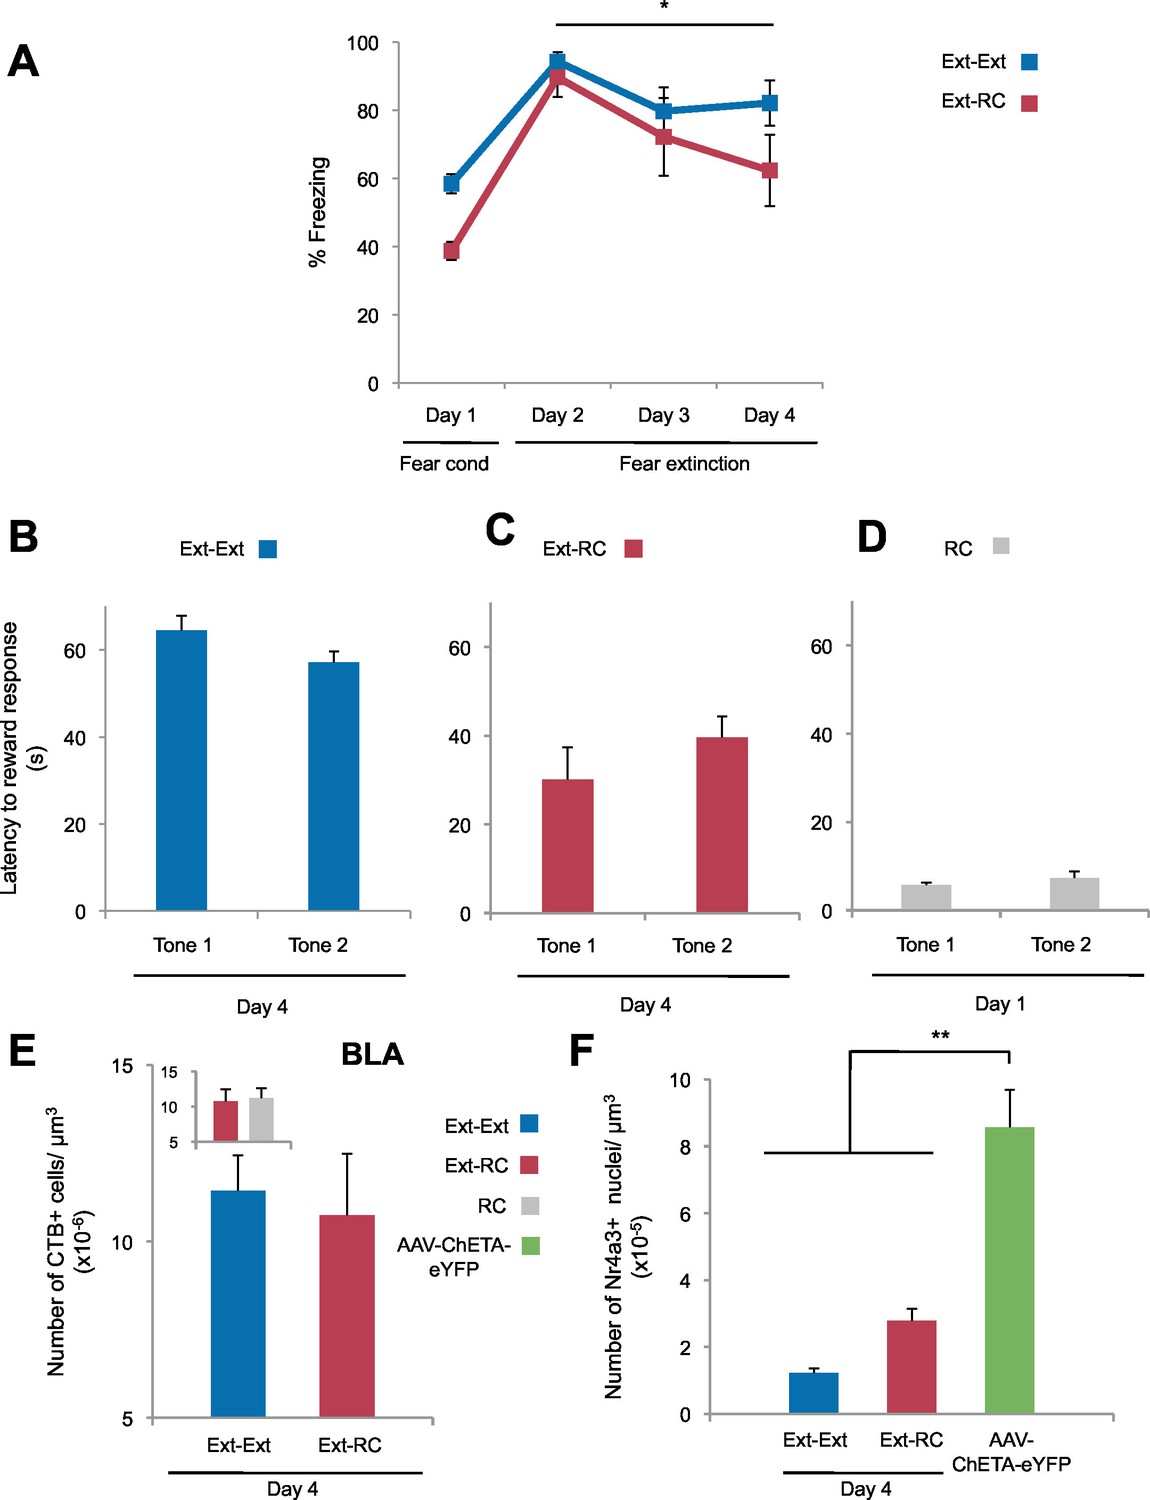
Recruitment of a BLA-NAc circuit is greater following fear extinction with reward conditioning than fear extinction alone.
(A) Experimental design. Coronal slices encompassing the amygdala were stained for cFos protein and imaged, and numbers of CTB+ cells, cFos+ nuclei and double-labeled cells were counted (Ext-Ext group, B and C: n = 22 from 3 rats, E: n = 15 from 4 rats; Ext-RC group, B and C: n = 21 from 5 rats, E: n = 11 from 3 rats; RC group, B and C: n = 24 images from 3 rats, E: n = 19 images from 5 rats). (B) BLA cells double-labeled for CTB and cFos, normalized to the total of CTB+ cells (p<0.05; inset p=n.s.). (C) Number of cFos+ cells per µm3 in the BLA (top panel, p=0.07; inset p=n.s.). Representative images for data shown on panels B and C (bottom panel). (D) Coronal slices encompassing the NAc were stained for Nr4a3 protein and for nuclei (DAPI) and imaged, and numbers of Nr4a3+ nuclei were counted. A Z-projection of each imaged channel is represented. Scale bar represents 10 μm. (E) Number of Nr4a3+ cells per µm3, in the NAc (p<0.001; inset p=n.s). 'n' represents the number of images analyzed. Statistical significance was calculated with two-tail t-test for unpaired data (B, C inset) or two-tail Mann-Whitney test (B inset, C, E, E inset). All data are mean ± s.e.m. *p<0.05, ***p<0.001.
Figure 3—figure supplement 1
Freezing and reward behavior and labeling densities in the BLA.
(A) Fear to the tone was measured as the percent of time spent freezing during the first five trials of Tone 1 presentations in each behavioral session (one session per day, as indicated, main effect of group, p=n.s.; for Days 2 to 4: main effect of day within each group, p<0.05) (Ext-Ext group: n = 7; Ext-RC group: n = 8). (B, C and D) Reward learning was calculated as the latency to respond at the reward port after Tone 1 (Tone 1 was the reward-paired tone for panels C and D; Tone 1 was presented in the absence of reward for panel B) and Tone 2 (neutral tone) for the Ext-Ext group (B, n = 7), Ext-RC group (C, n = 8) and RC group (D, n = 8). Groups Ext-RC and RC displayed reward-seeking behavior without discriminative reward learning (main effect of tone, p=n.s.). (E) Coronal slices encompassing the amygdala were imaged and number of CTB+ cells per µm3 of the BLA was calculated (Ext-Ext group, n = 22 images from 3 rats; Ext-RC group, n = 21 images from 5 rats; RC group n = 24 from 3 rats; main effect of group, p=n.s.). (F) Rats were infused with AAV-ChETA-eYFP in the amygdala. Anesthetized rats were subjected to 25 trials of stimulation of amygdala terminals within the NAc with 473 nm laser light for five second periods, per trial (10–20 mW, 20 Hz, 5 ms pulses; 65 s interstimulation interval). Coronal slices encompassing the NAc were stained for Nr4a3 protein, imaged, and counts of Nr4a3+ nuclei were performed. The number of Nr4a3+ cells per µm3 in the NAc was calculated and compared to Nr4a3 expression in the two groups from Figure 3E (AAV-ChETA-eYFP, n = 8 from 3 rats; main effect of group, p<0.0001). 'n' represents the number of animals (A–D) or the number of images analyzed (E). Statistical significance was determined by Wilcoxon paired test (B,C), two-tail t-test for paired data (D), two-tail t-test for unpaired data (E), two-tail Mann-Whitney test followed by paired planned comparisons (A, inset E) and Kruskal-Wallis test (F) followed by planned comparisons. All data are mean ± s.e.m. *p<0.05, **p<0.01.
Figure 3—figure supplement 2
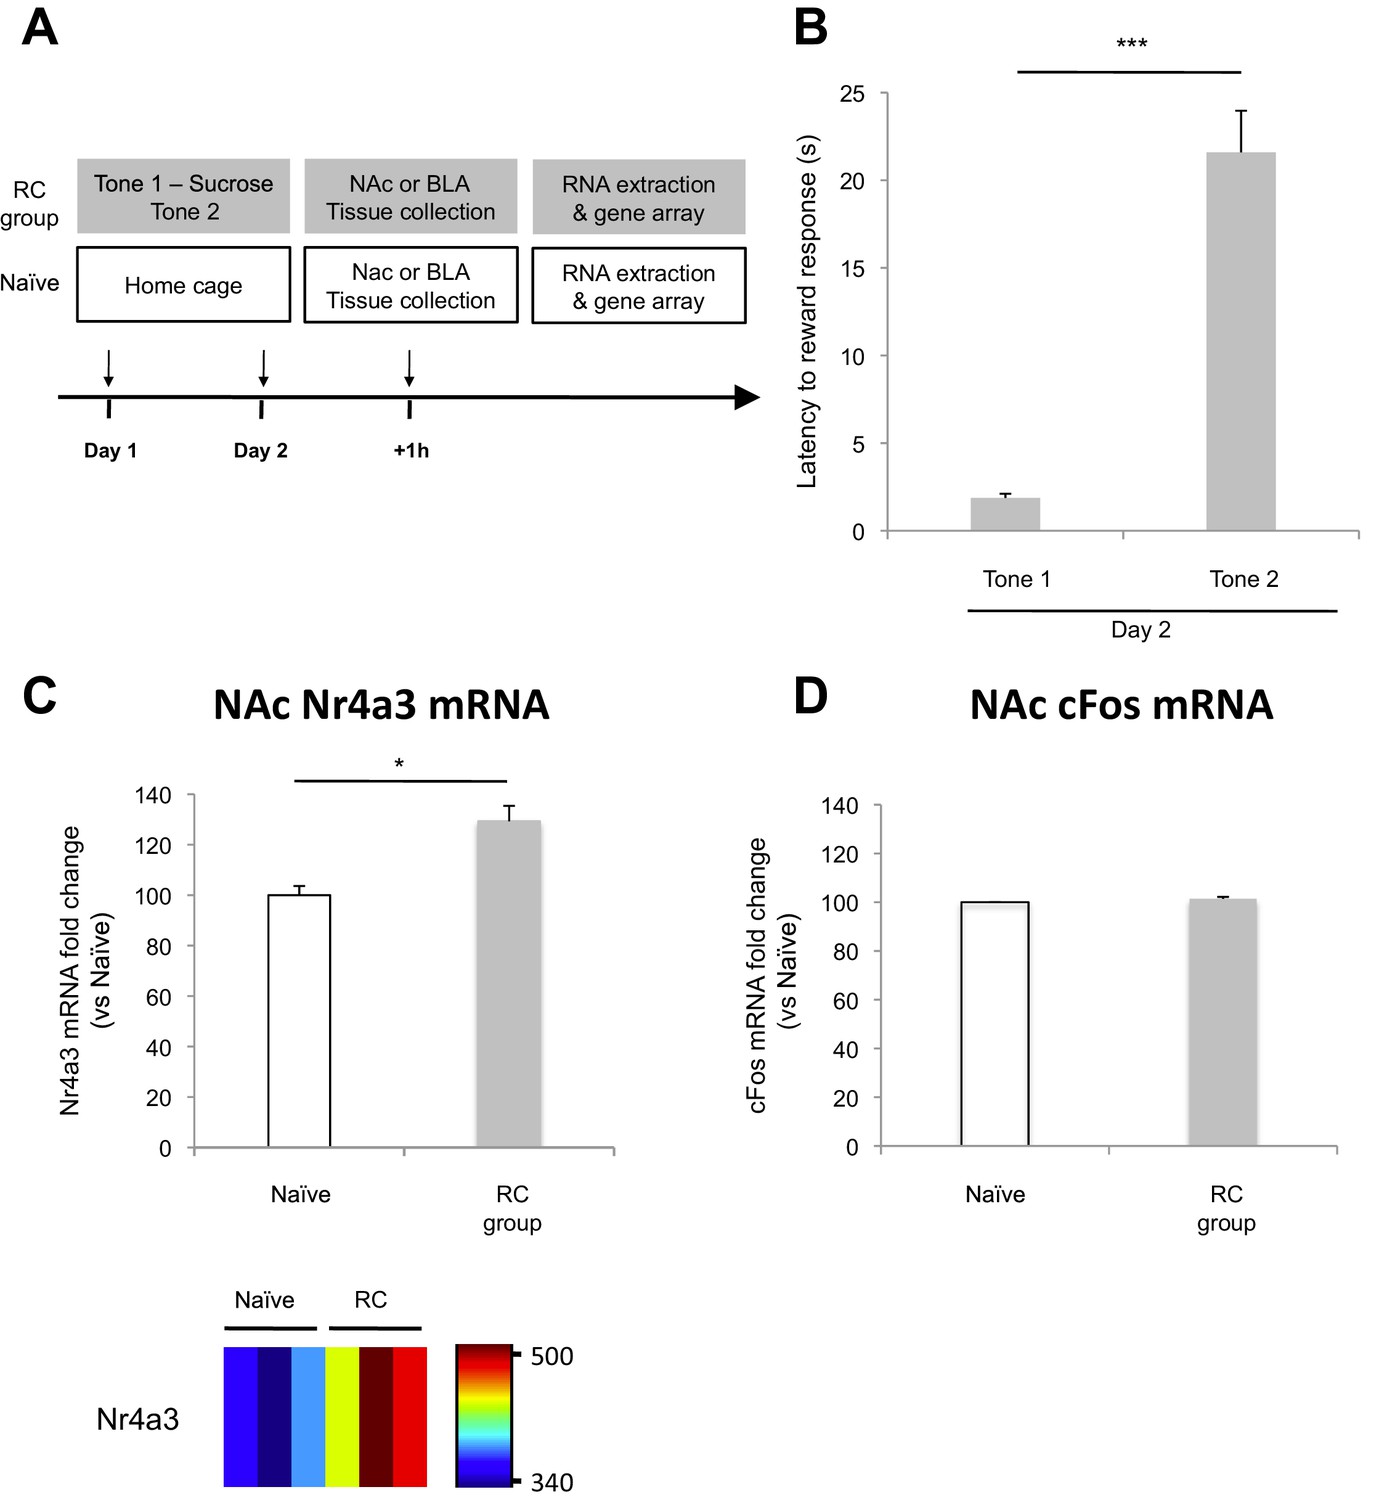
Microarray analysis of the NAc after reward conditioning in rats.
(A) Experimental design (RC group: n = 18; Naïve group, n = 18). One hour after the end of the second behavioral session, NAc tissue was collected and used to extract total mRNA. mRNA was combined to generate three independent pooled samples (n = 6 per pooled sample) and used for gene array analysis. (B) Reward learning was calculated as the latency to respond at the reward port after Tone 1 (reward paired tone) and Tone 2 (neutral tone) (p<0.001). (C) Average Nr4a3 mRNA fold change in the NAc (top panel, p<0.05) and Nr4a3 mRNA probe fluorescence intensity value (bottom panel) for Naïve (n = 3) and RC (n = 3) groups. (D) Average cFos mRNA fold change in the NAc (p=n.s.). 'n' represents the number of animals (B) or the number of pooled mRNA samples (C and D). Statistical significance was determined by Wilcoxon paired test (B) or two-tail t-test for unpaired data (C), two-tail Mann-Whitney test (D). All data are mean ± s.e.m. *p<0.05, ***p<0.001.
Figure 3—figure supplement 3
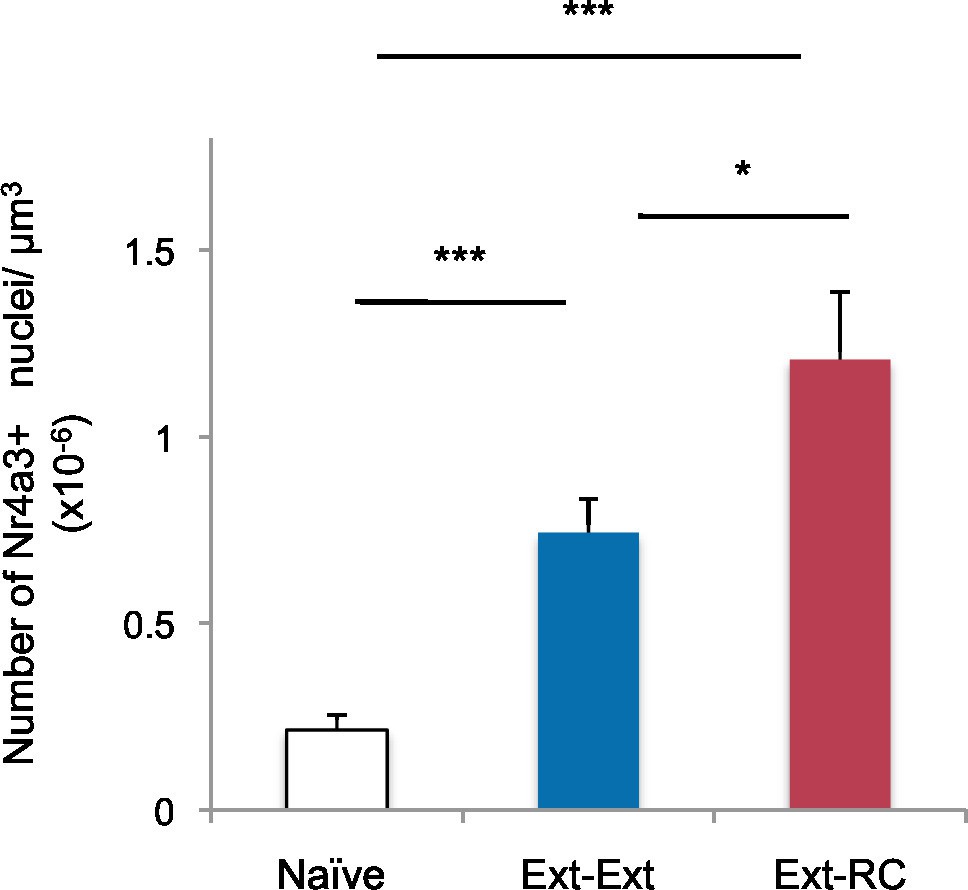
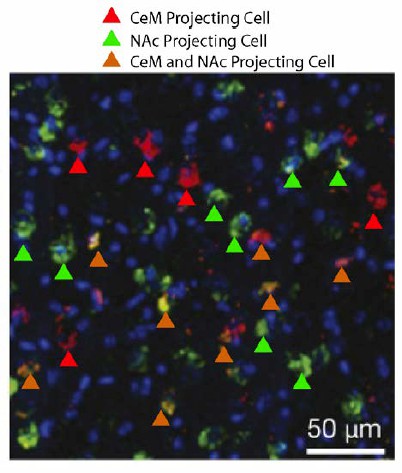
Density of Nr4a3 labeling in the NAc after behavioral training.
In addition to the groups shown in Figure 3, some rats were used as home cage controls (Naïve group). Immunostaining of coronal brain sections containing the NAc (Ext-Ext group: n = 16 sections from 4 rats; Ext-RC group, n = 12 sections from 3 rats; Naïve group: n = 16 sections from 4 rats) was performed. Number of Nr4a3+ cells per µm3, in the NAc is shown (main effect of group, p<0.0001). Statistical significance was determined by Kruskal-Wallis test followed by planned comparisons. All data are mean ± s.e.m.
Figure 4
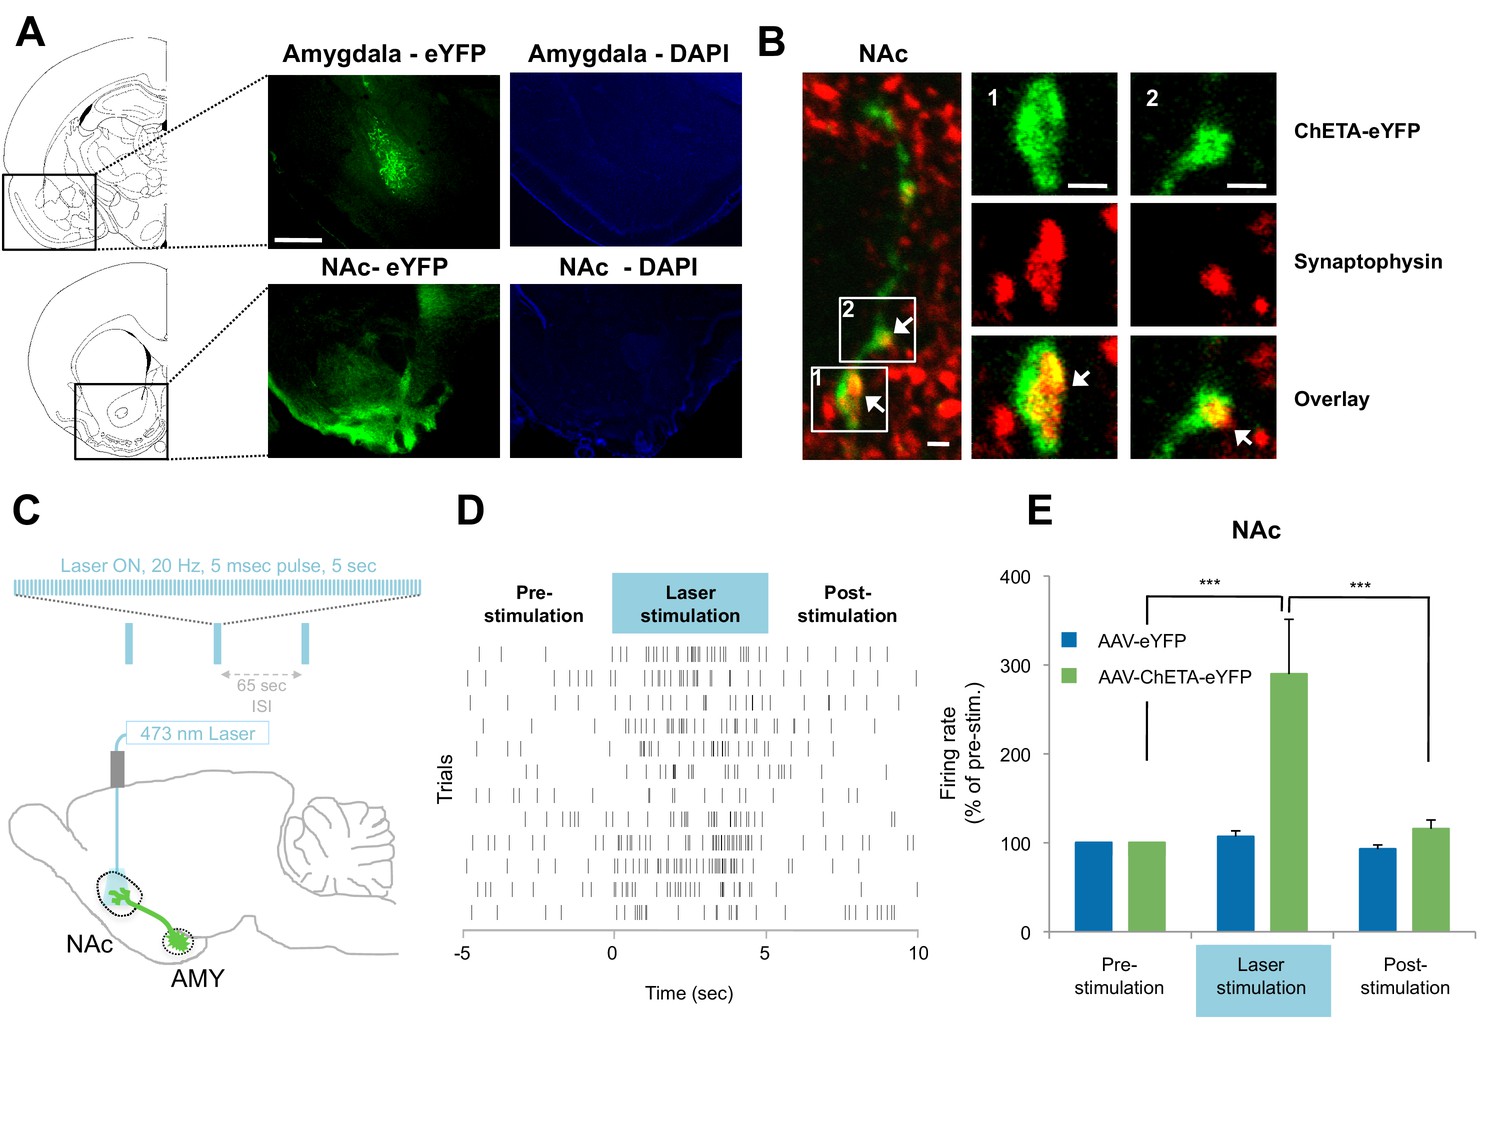
Optogenetic stimulation of amygdala presynaptic terminals projecting to NAc.
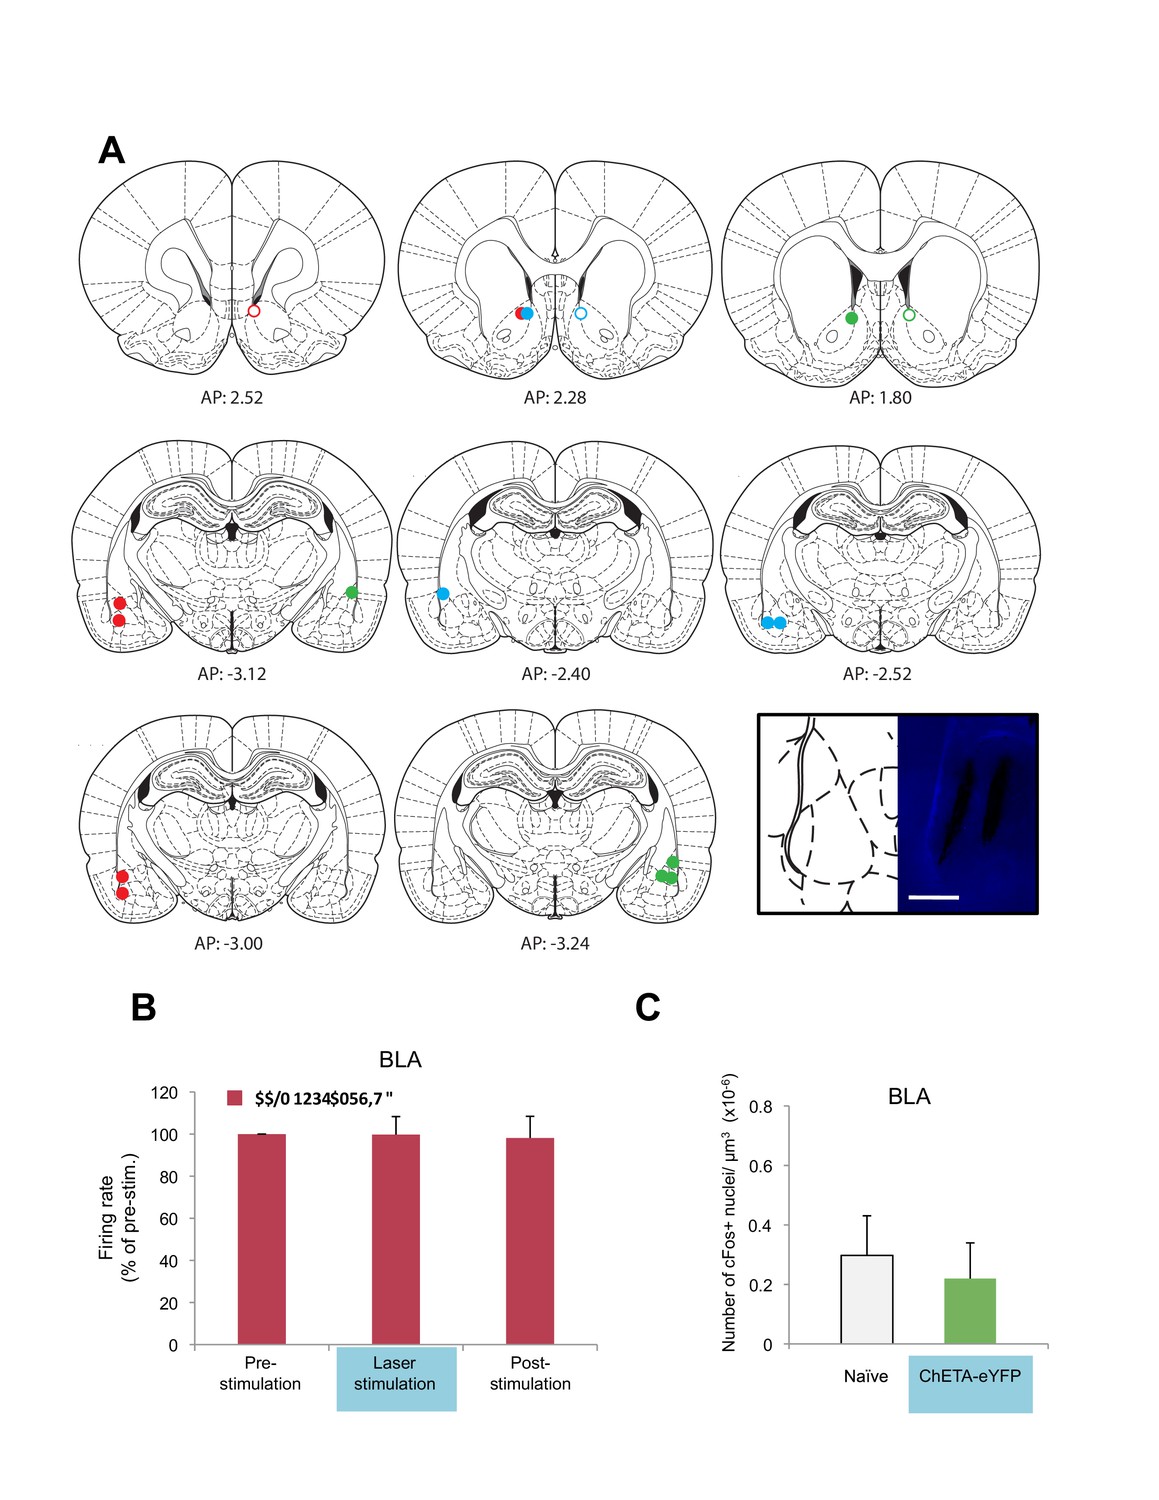
(A) Expression of ChETA-eYFP (left) and DAPI (right) in the BLA and NAc of rats infused with AAV-ChETA-eYFP in the amygdala. Scale bar represents 1 mm. (B) Expression of ChETA-eYFP in presynaptic terminals in the NAc was confirmed by immunolabeling of ChETA-eYFP and synaptophysin, as indicated. White arrows indicate overlapping staining. Scale bars represent 1 μm. (C) Schematic representation of the light stimulation parameters used for in vivo recordings. (D, E) In vivo recordings from the NAc of anesthetized rats infused with AAV-ChETA-eYFP or AAV-eYFP in the amygdala and implanted with fiber optics above the NAc. Optic fibers delivered 473 nm light stimulation for 5 s periods (10–20 mW, 20 Hz, 5 ms pulses; 65 s interstimulation interval). Multiunit activity (MUA) was recorded during the 5 s of stimulation and was compared with the 5 s that preceded and followed the laser stimulation. (D) Example MUA at recording sites expressing ChETA-eYFP. (E) Average firing rate over multiple recording sites in the NAc expressing ChETA-eYFP (green, n = 20; 3 rats) or eYFP (blue, n = 16; 3 rats). Firing rate was normalized to pre-stimulation activity for each recording site (main effect of group, p<0.0001). 'n' represents the number of recording sites sampled. Statistical significance was calculated with Kruskal-Wallis followed by paired planned comparisons. All data are mean ± s.e.m. ***p<0.001.
Figure 5 with 2 supplements
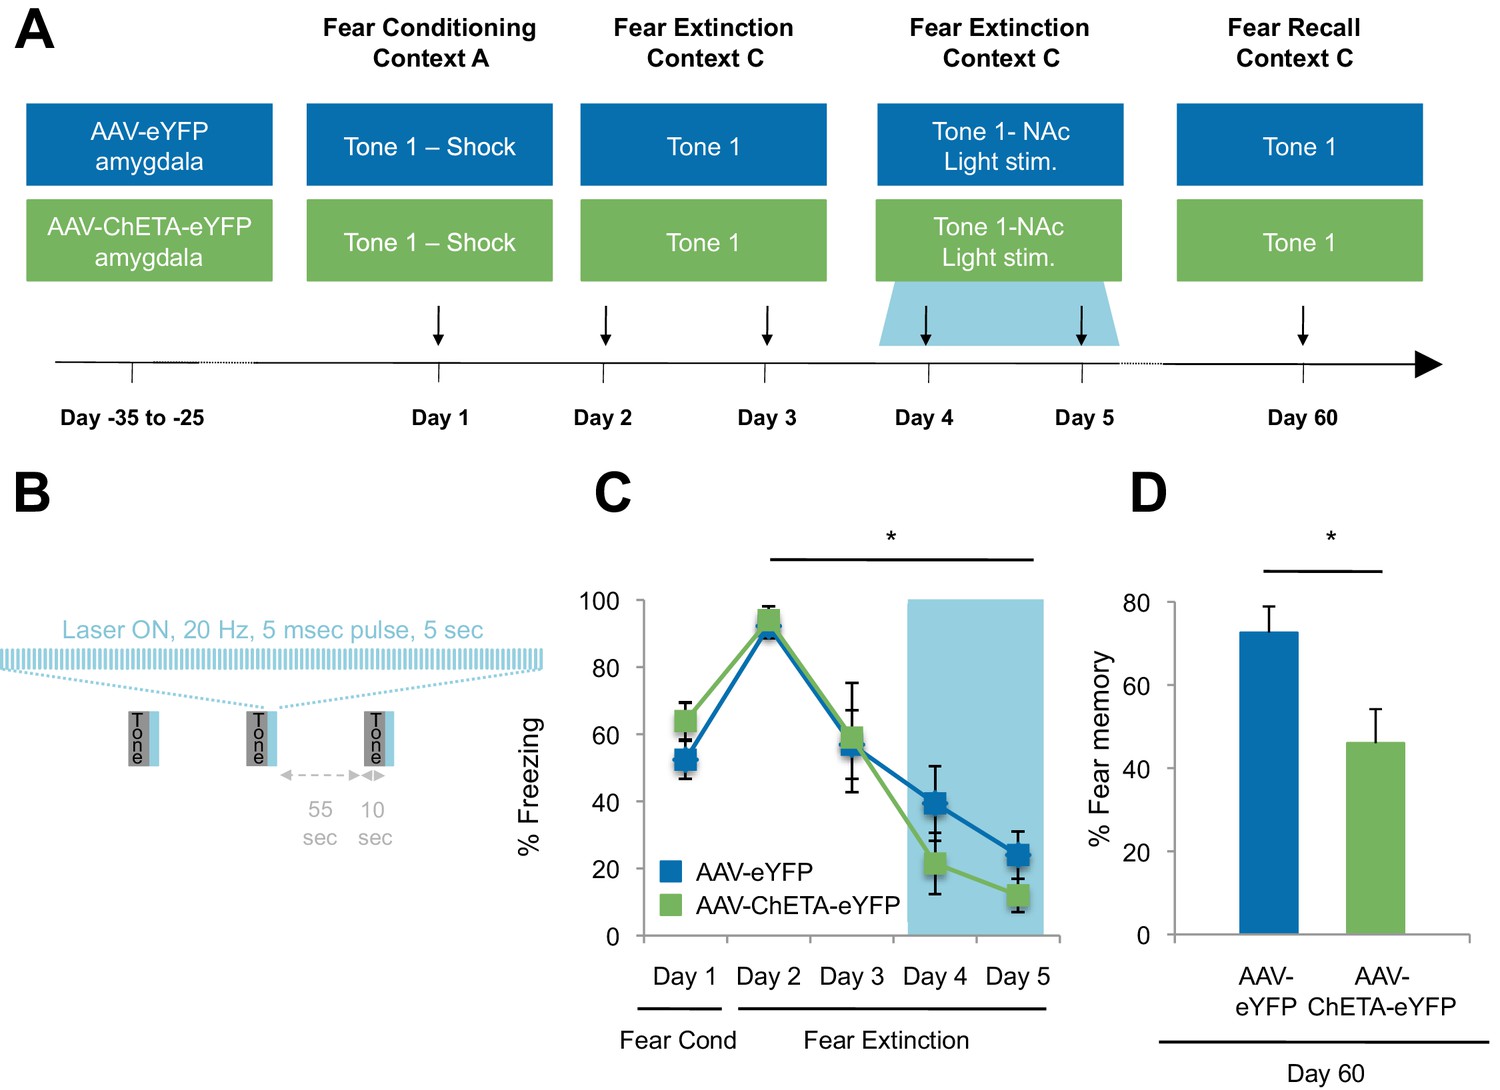
Optogenetic stimulation of the amygdala-NAc circuit during extinction of fear impairs the return of fear.
(A) Experimental design (eYFP, n = 9; ChETA-eYFP, n = 4). (B) The timing of each pulse of light delivery is depicted. (C) Fear to the tone was measured as the percent of time spent freezing during the first five tone presentation trials of each behavioral session (main effect of group, p=n.s.; for Days 2 to 5: main effect of day, p<0.05). (D) Fear return on Day 60 was calculated as the percent of time spent freezing on the first five tone presentation trials on Day 60 normalized (per rat) to the percent of time spent freezing on the first five tone presentations on Day 2 (p<0.05). 'n' represents the number of animals. Statistical significance was determined by two-tail t-test for unpaired data (C) and two-tail Mann-Whitney test (B). All data are mean ± s.e.m. *p<0.05.
Figure 5—figure supplement 1
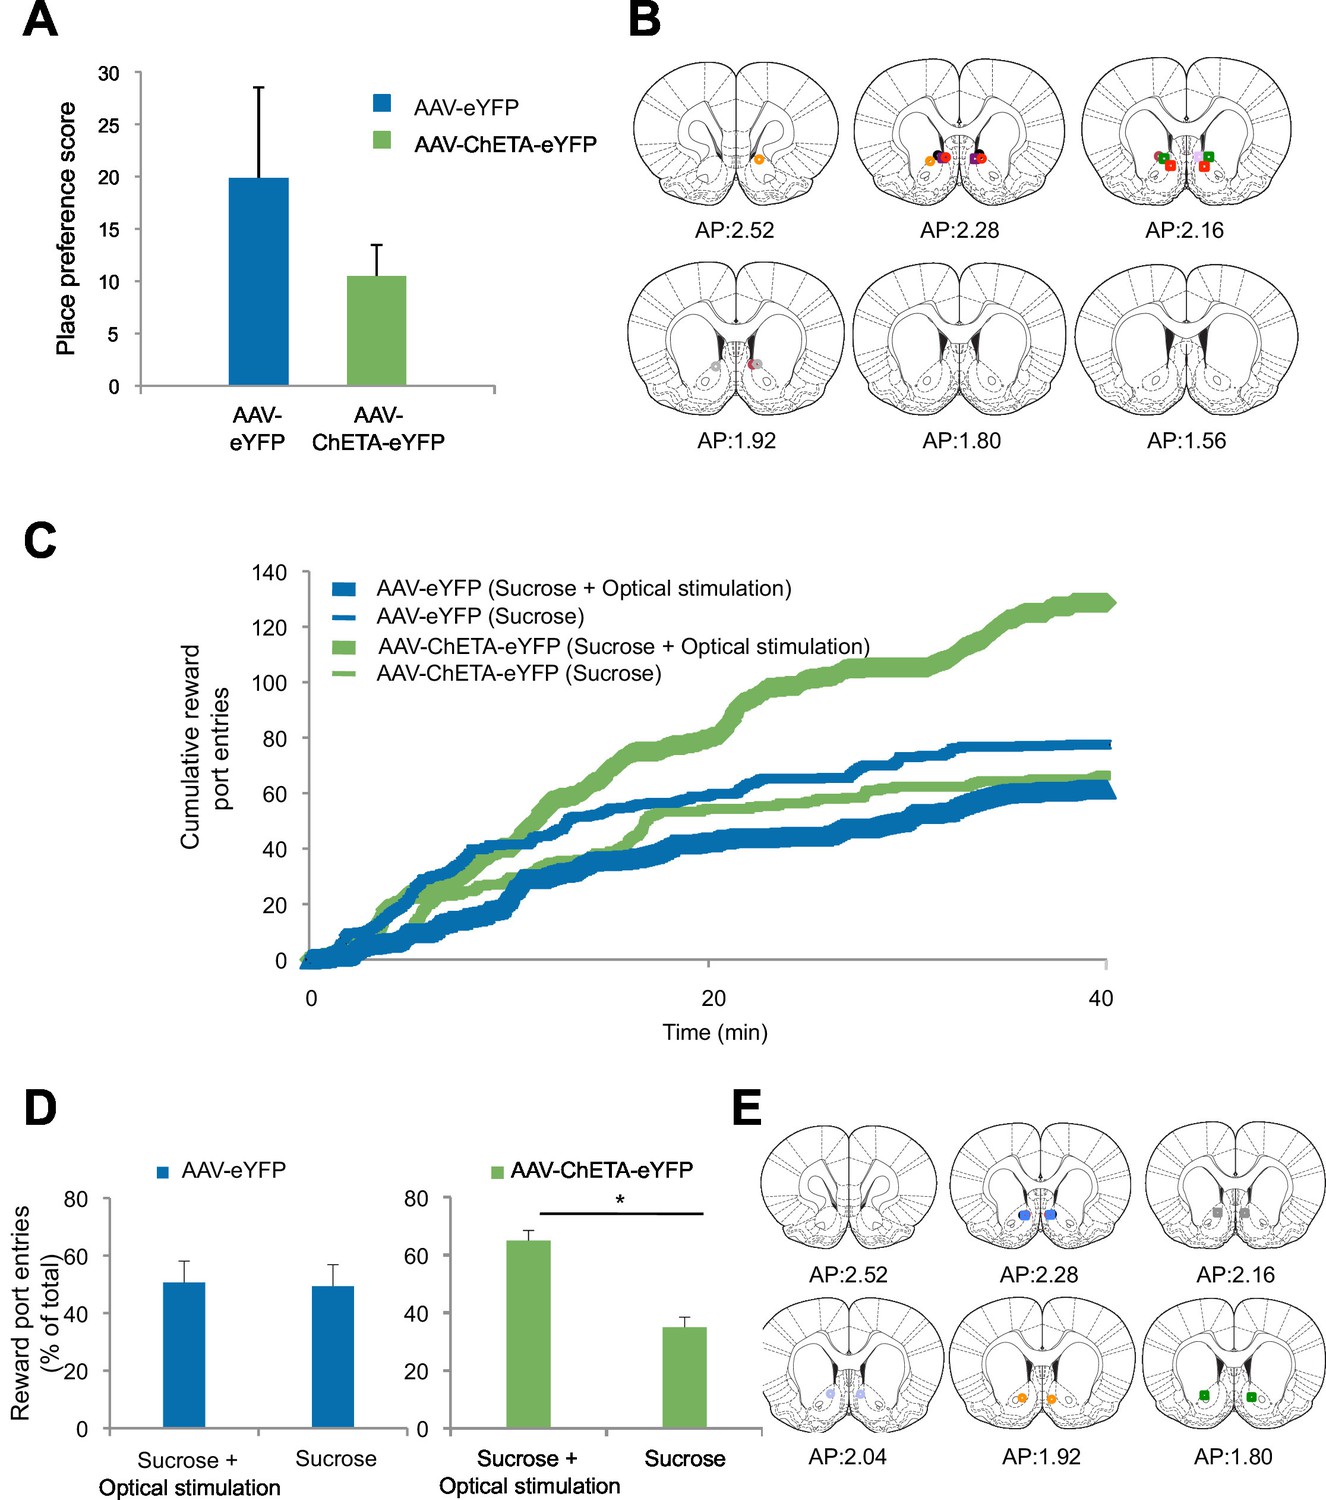
Optogenetic stimulation of amygdala-NAc circuitry can promote reward seeking.
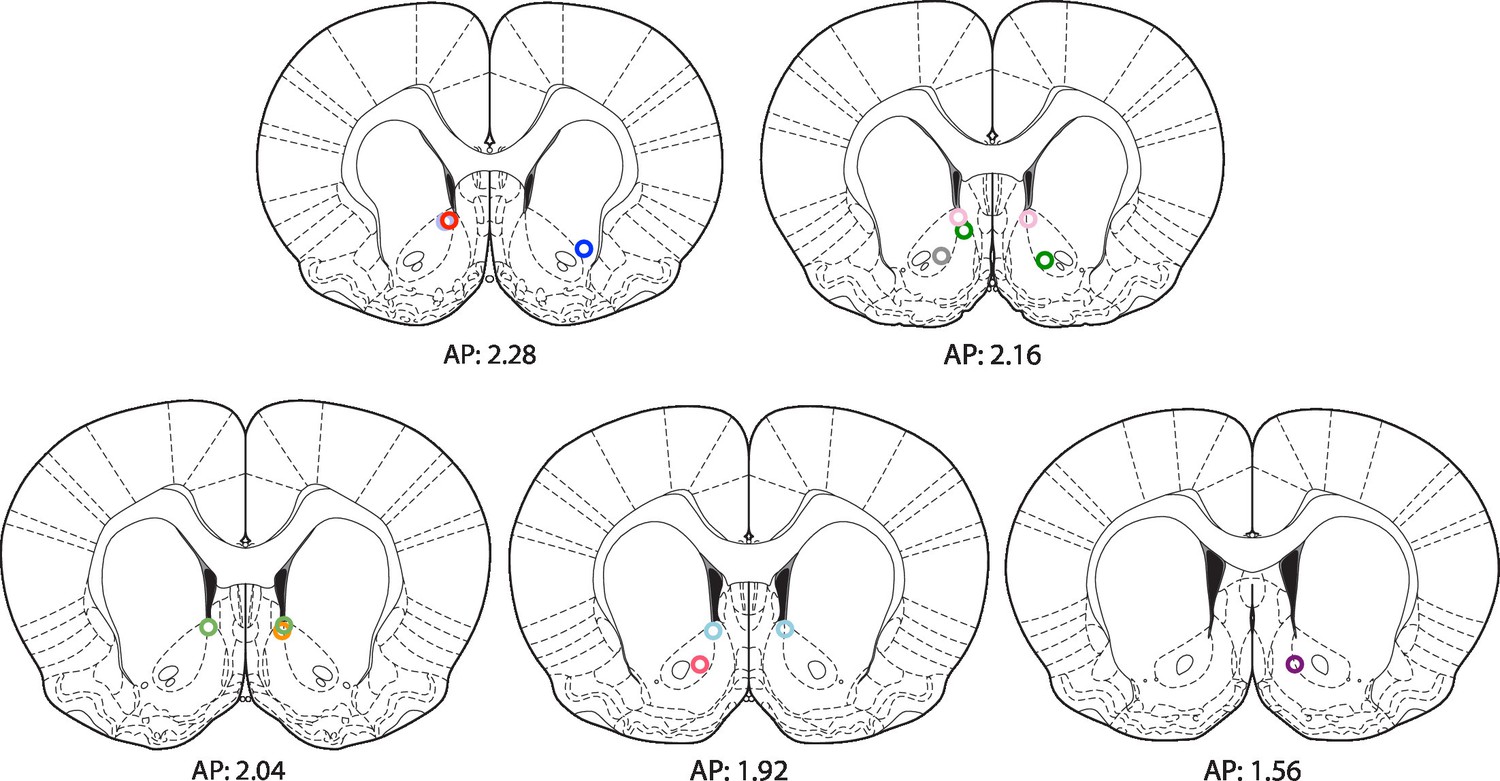
(A) Rats were allowed to freely explore a two-chamber box on Day 1. On Day 2, rats were placed in one side of the chamber while receiving BLA-NAc optogenetic stimulation (5 ms pulses, 20 Hz for 5 s every 20–30 s). Immediately following this, each rat was placed on the other side of the box in the absence of stimulation. On Day 3, rats were again permitted to freely explore the two-chamber box. Average place preference score for each group is shown (AAV-eYFP, n = 5; AAV-ChETA-eYFP, n = 3; group effect, p=n.s.). (B) Location of fiber optic tips in the NAc of rats used for the experiment depicted in panel A (circles and squares represent AAV-eYFP and AAV-eYFP-ChETA infection, respectively). (C and D) Rats were trained to nose-poke for delivery of a reward solution at either an active port (nose-poke produced BLA-NAc optogenetic stimulation for 5 ms pulses, 20 Hz for 5 s) or an inactive port (nose-poke did not lead to laser stimulation). (C) Average cumulative reward port entries made during the behavioral session (AAV-eYFP, n = 4; AAV-ChETA-eYFP, n = 3). (D) Left, Reward port entries for rats infused with AAV-eYFP (n = 4) (main effect of stimulation, p=n.s.). Right, Reward port entries for rats infused with AAV-ChETA-eYFP (n = 3); main effect of stimulation, p<0.05). (E) Location of fiber optic tips in the NAc of rats used in experiment depicted in panels C and D (circles and squares represent AAV-eYFP and AAV-eYFP-ChETA infection, respectively). 'n' represents the number of animals. Coronal brain images from Figures 13–18 and 20 in Paxinos and Watson (2005). Statistical significance was determined by two-tail t-test for unpaired (A) or paired (C,D) data. All data are mean ± s.e.m. *p<0.05.
Figure 5—figure supplement 2
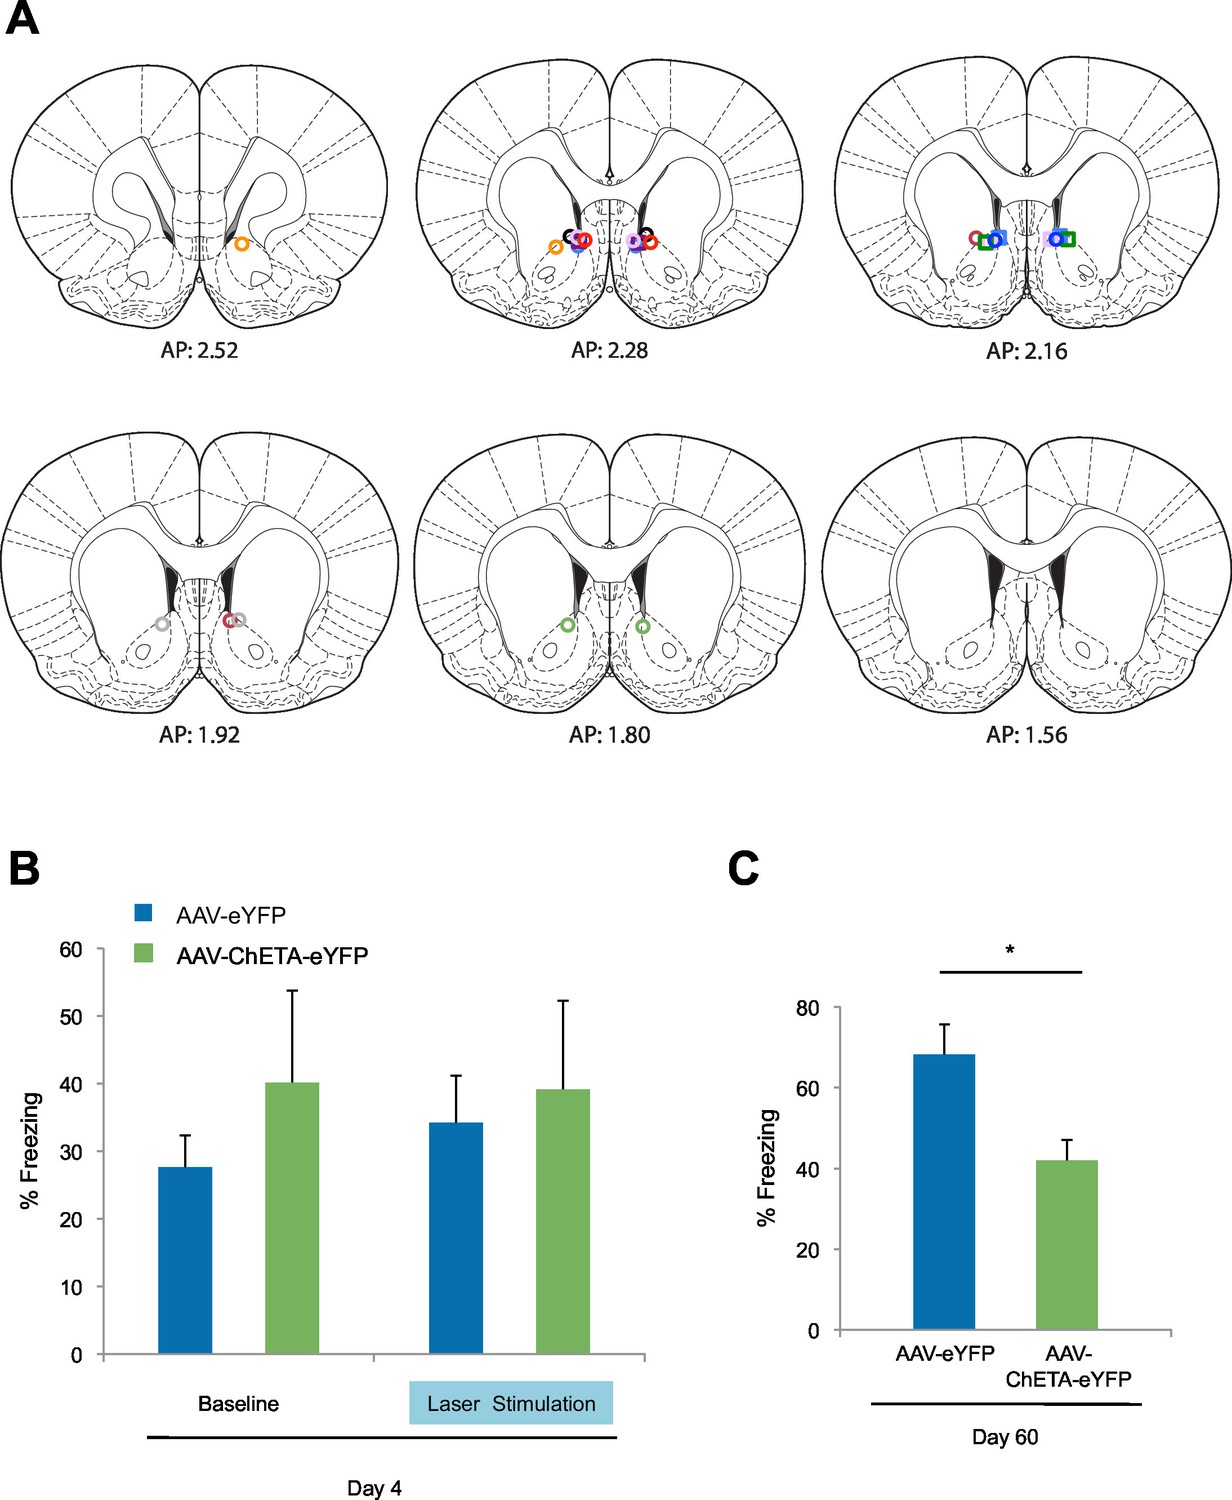
Optogenetic stimulation of amygdala-NAc circuitry during extinction of fear impairs later fear recall.
(A) Location of fiber optic tips in the NAc [circles and squares represent AAV-eYFP (n = 9) and AAV-eYFP-ChETA (n = 4) groups, respectively]. (B) Average percent of time spent freezing during the 6 s before tone presentation (no laser stimulation) and the 6 s after tone presentation (including the laser stimulation period; main effect of stimulation and Group x Stimulation interaction, p=n.s.). (C) Average percent of time spent freezing during the first five tone presentations of the fear recall test on Day 60 is shown (p<0.05). Coronal brain images adapted from Figures 13–15, 17–18 and 20 in Paxinos and Watson (2005). 'n' represents the number of animals. Statistical significance was determined by two-tail t-test for unpaired data (B) or ANOVA (A). All data are mean ± s.e.m. *p<0.05.
Figure 6 with 2 supplements
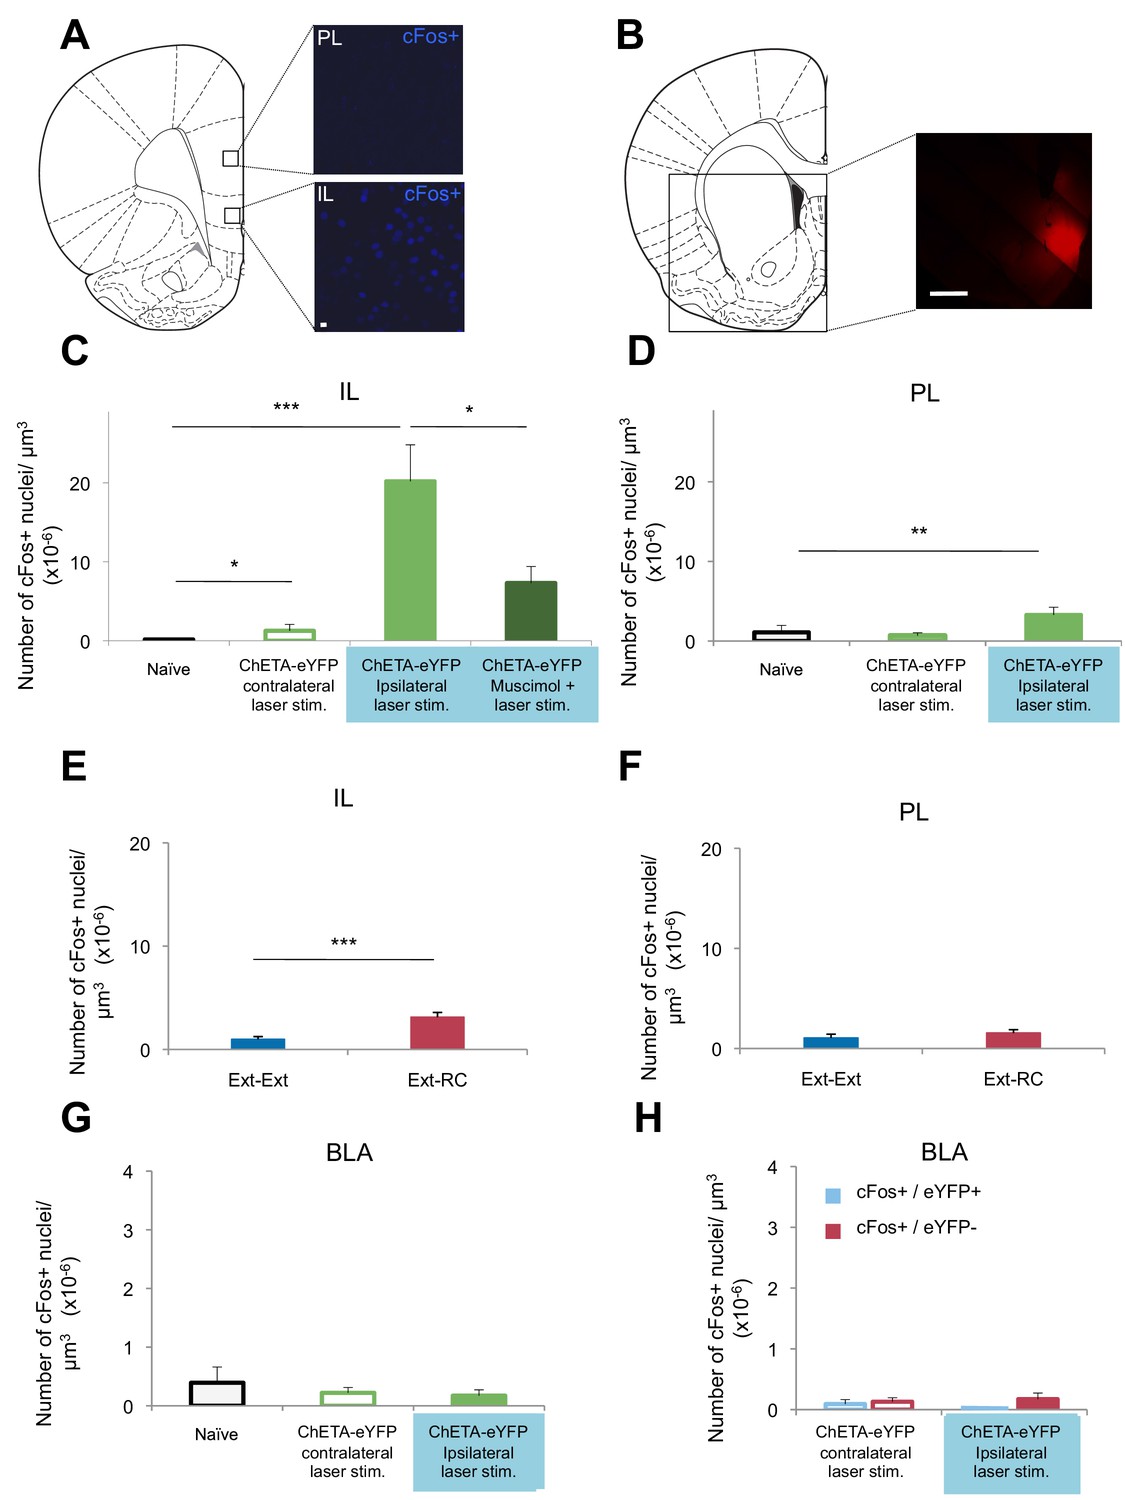
Optogenetic stimulation of an amygdala-NAc circuit or reward conditioning during fear extinction increases activity in IL.
(A–D,G,H) Rats were infused with AAV-ChETA-eYFP in the amygdala. Anesthetized rats were subjected to 25 trials of stimulation of amygdala terminals within the NAc with 473 nm laser light for five-second periods, per trial (10–20 mW, 20 Hz, 5 ms pulses; 65 s interstimulation interval). (A, C, D) Coronal slices encompassing the infralimbic (IL) and prelimbic (PL) cortex were stained for cFos protein. (A) Representative image of cFos staining in the IL and PL. (B) Some rats also received infusion of muscimol-bodipy into the NAc. Representative image of muscimol-bodipy infusion in the NAc. (C, D) Numbers of cFos+ cells (Naïve, C: n = 14, D: n = 18, from the same 3 rats presented in Figure 1C; AAV-ChETA-eYFP contralateral to the stimulation site, C: n = 9, D: n = 10 from 5 rats; AAV-ChETA-eYFP ipsilateral to the stimulation site, C: n = 10, D: n = 10, from 5–6 rats; AAV-ChETA-eYFP + Muscimol, ipsilateral to the stimulation site, C: n = 15 from 3 rats) were counted and plotted per µm3. (E, F) Coronal slices encompassing the IL and PL from animals trained as indicated in Figure 3A, were stained for cFos protein and numbers of cFos+ cells were counted and plotted per µm3 (Ext-RC group, E: n = 14 from 5 rats, F: n = 12 from 5 rats; Ext-Ext, E: n = 11 from 3 rats, F: n = 9 from 3 rats). (G, H) Coronal slices encompassing the amygdala were stained for cFos protein (Naïve, n = 34 different slices from the same 3 rats presented in Figure 1C; AAV-ChETA-eYFP contralateral to the stimulation site, n = 18 from 4 rats; AAV-ChETA-eYFP ipsilateral to the stimulation site, n = 21 from 4 rats). Numbers of cFos+ cells (G), cFos+ and eYFP+ (H), and cFos+ and eYFP− cells (H) were counted in the BLA ipsilateral (n = 21 from 4 rats) and contralateral to the NAc stimulation site (H: n = 18 from 4 rats) and plotted per µm3, in the BLA. 'n' represents the number of images analyzed (C–H). Scale bar represents 10 µm (A) or 1 mm (B). Statistical significance was calculated with two-tail Mann-Whitney test (E, F, H), Kruskal-Wallis test followed by the Mann-Whitney test (C, F, G). All data are mean ± s.e.m.
Figure 6—figure supplement 1
Location of fiber optic tips in rats receiving BLA-NAc optogenetic stimulation while anesthetized.
Rats (in experiments depicted in Figure 6, Figure 3—figure supplement 1F and Figure 6—figure supplement 2C) were infused with AAV-ChETA-eYFP in the amygdala and implanted with fiber optics above the NAc. They were subsequently anesthetized and the optic fibers delivered 473 nm light stimulation for 5 s periods (10–20 mW, 20 Hz, 5 ms pulses; 65 s interstimulation interval). Coronal brain images were adapted from Figures 14–17 and 20 in Paxinos and Watson (2005).
Figure 6—figure supplement 2
Optogenetic stimulation of BLA presynaptic terminals projecting to NAc in anesthetized rats.
(A) Location of fiber optic tips and recording sites in the NAc and recording sites in the BLA (open and filled circles represent AAV-eYFP and AAV-eYFP-ChETA infection, respectively). Coronal brain sections were adapted from Figures 13–14, 18, 53–54, and 58–60 in Paxinos and Watson (2005). (B) In vivo recordings from the BLA of anesthetized rats infused with AAV-ChETA-eYFP or AAV-eYFP in the amygdala and implanted with fiber optics above the NAc. Optic fibers delivered 473 nm light stimulation for 5 s periods (10–20 mW, 20 Hz, 5 ms pulses; 65 s interstimulation interval). Multiunit activity was assessed during the 5 s of stimulation and compared with the 5 s that preceded and followed the laser stimulation. Average firing rate over multiple recording sites in the BLA expressing ChETA-eYFP (n = 11; 3 rats), as indicated. Firing rate in each location was normalized to pre-stimulation activity (main effect of time, p=n.s.). (c) Rats were infused with AAV-ChETA-eYFP in the amygdala. Anesthetized rats were subjected to 25 trials of stimulation of amygdala terminals within the nucleus accumbens with 473 nm laser light for 5 s periods, per trial (10–20 mW, 20 Hz, 5 ms pulses; 65 s interstimulation interval). Coronal slices encompassing the amygdala were stained for cFos protein and numbers of cFos+ cells in BLA were counted. Number of cFos+ cells per µm3 in the BLA is shown (AAV-ChETA-eYFP, n = 15 from 3 rats). Data for the Naïve group is the same as presented in Figure 1C (main effect of group, p=n.s.). 'n' represents the number of recording sites sampled (B) or the number of images analyzed (C). Statistical significance was calculated with the Friedman test (B) or two-tail Mann-Whitney test (C). All data are mean ± s.e.m.
Author response image 1
Author response image 2
Author response image 3
Author response image 4
Download links
A two-part list of links to download the article, or parts of the article, in various formats.
Downloads (link to download the article as PDF)
Open citations (links to open the citations from this article in various online reference manager services)
Cite this article (links to download the citations from this article in formats compatible with various reference manager tools)
Amygdala-ventral striatum circuit activation decreases long-term fear
eLife 5:e12669.
https://doi.org/10.7554/eLife.12669


