Sensitive red protein calcium indicators for imaging neural activity
- Janelia Research Campus, Howard Hughes Medical Institute, United States
- Weizmann Institute of Science, Israel
- Howard Hughes Medical Institute, The Rockefeller University, United States
Figures
Figure 1
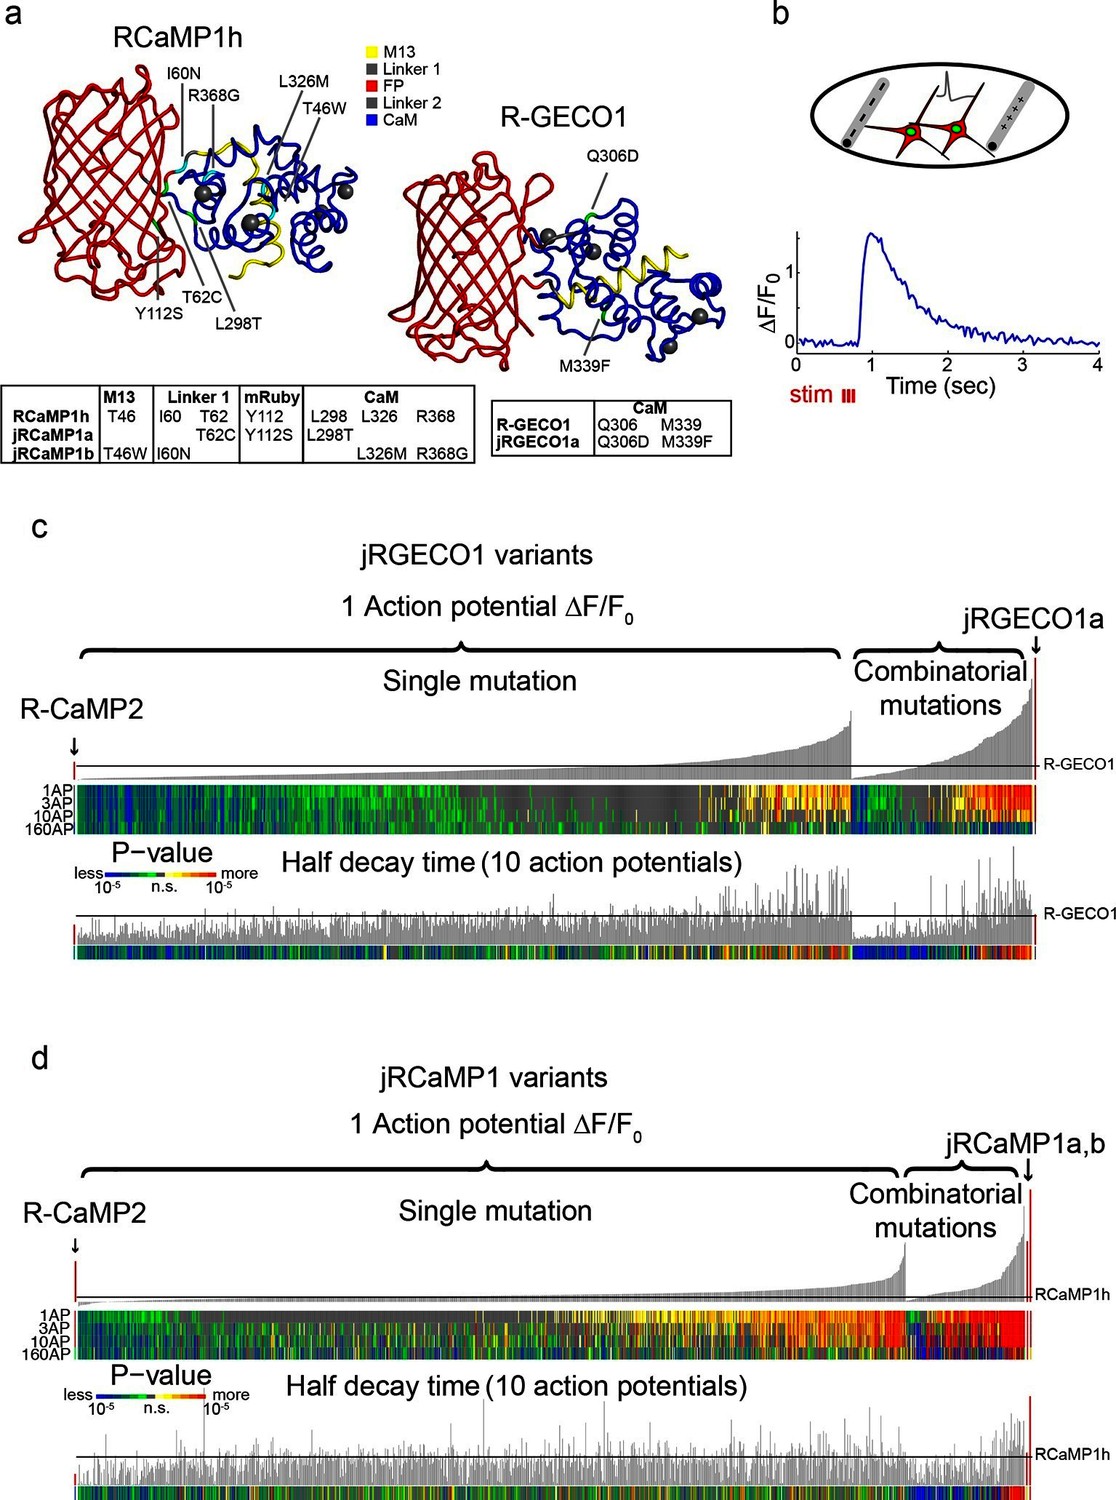
Mutagenesis and screening of jRCaMP1 and jRGECO1 in dissociated neurons.
(a) RCaMP1h and R-GECO1 structure and mutations introduced in jRCaMP1a, jRCaMP1b, and jRGECO1a. M13 peptide (yellow), linker 1 (gray), cpmRuby or cpmApple (red), linker 2 (gray), CaM (blue). Mutation positions for jRCaMP1a (green), jRCaMP1b (cyan), jRGECO1a (green). (b) Schematic of the cultured neuron assay. Field electrodes (gray, upper panel) stimulate cultured neurons expressing a cytosolic red GECI variant and nuclear GFP. Changes in fluorescence are recorded (lower panel) and analyzed. An example response trace of a jRGECO1a-expressing neuron after 3 action potential (AP) stimulus is shown. (c) Screening results for 855 R-GECO1 variants. Top, fluorescence changes in response to 1 action potential (vertical bars, ΔF/F0 amplitudes; black bars, single R-GECO1 mutations and combinatorial mutations; red bars, R-CaMP2 left, jRGECO1a right). Middle, significance value for different AP stimuli (color plot). Bottom, half decay times after 10 APs. Black line indicates R-GECO1 performance levels. (d) Screening results for 1070 RCaMP1h variants. Top, fluorescence changes in response to 1 AP (same order as in b; red bars, R-CaMP2 left, jRCaMP1a and jRCaMP1b right). Middle, significance value for different AP stimuli (color plot). Bottom, half decay times after 10 APs. Black line indicates RCaMP1h performance levels.
Figure 2 with 4 supplements
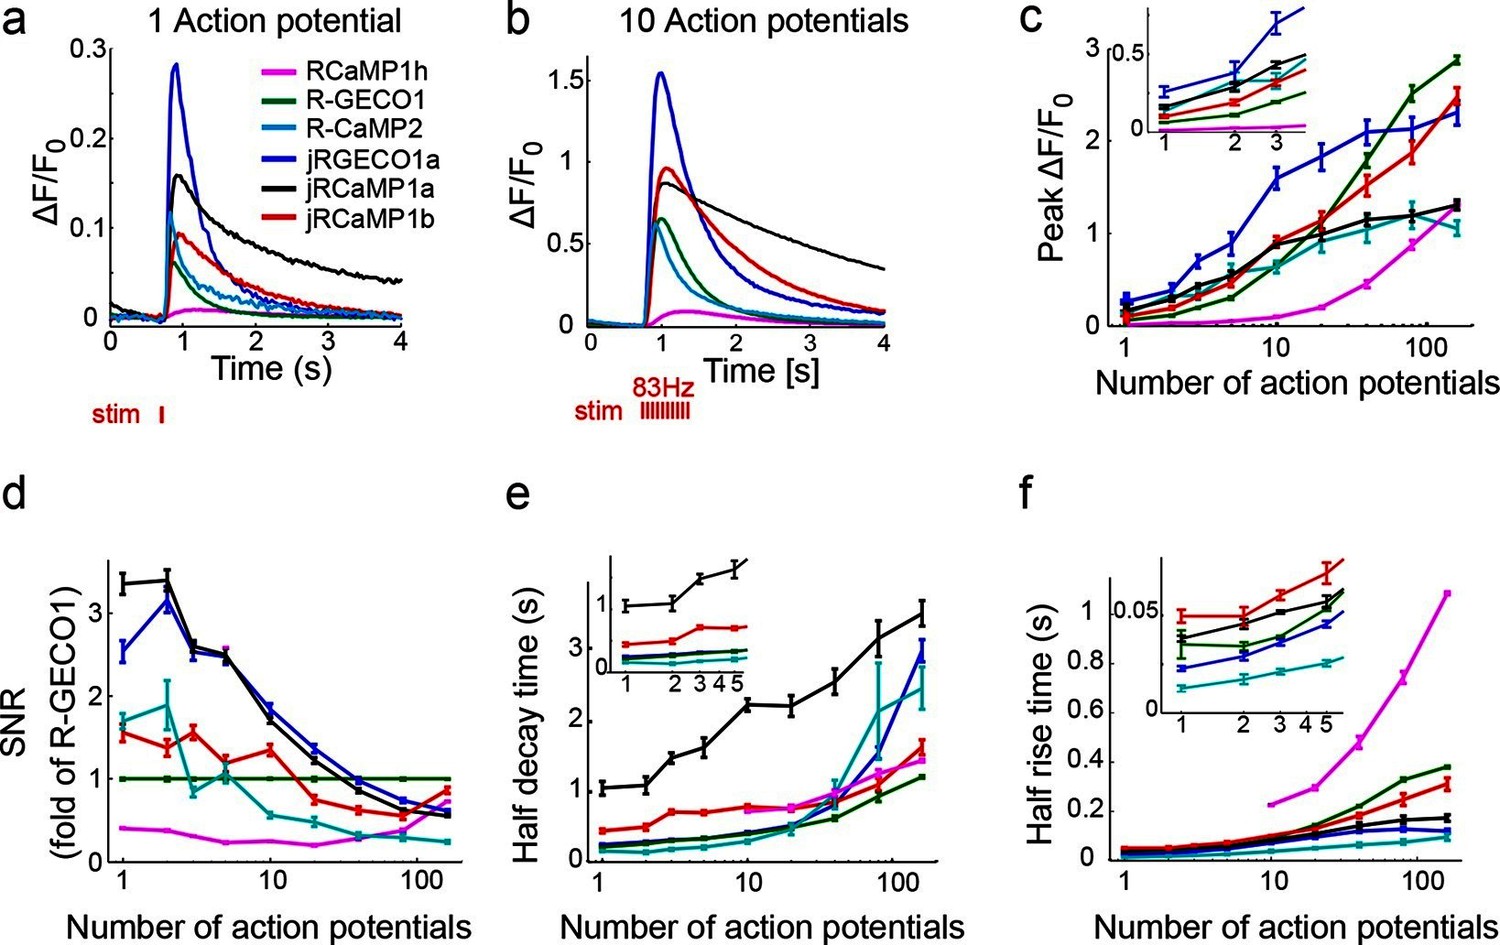
jRGECO1 and jRCaMP1 performance in dissociated neurons.
(a) Average responses in response to one action potential (AP) for RCaMP1h (9479 neurons, 605 wells), R-GECO1 (8988 neurons, 539 wells), R-CaMP2 (265 neurons, 22 wells), jRGECO1a (383 neurons, 26 wells), jRCaMP1a (599 neurons, 38 wells), and jRCaMP1b (641 neurons, 31 wells). (b) Same for 10 APs response. (c–f) Comparison of jRGECO1 and jRCaMP1 sensors and other red GECIs, as a function of number of APs (color code as in a). (c) Response amplitude, ΔF/F0. (d) Signal-to-noise ratio, SNR, defined as the fluorescence signal peak above baseline, divided by the signal standard deviation before the stimulation is given. (e) Half decay time. (f) Half rise time. Error bars correspond to s.e.m (n=605 wells for RCaMP1h; 539, R-GECO1; 22, R-CaMP2; 38, jRCaMP1a; 31, jRCaMP1b; 26, jRGECO1a).
-
Figure 2—source data 1
Biophysical properties of purified jRGECO1 and jRCaMP1 sensors.
Summary of red GECI biophysical properties, mean ± s.d., where indicated, for independently purified protein samples (Materials and methods).
- https://doi.org/10.7554/eLife.12727.005
Figure 2—figure supplement 1
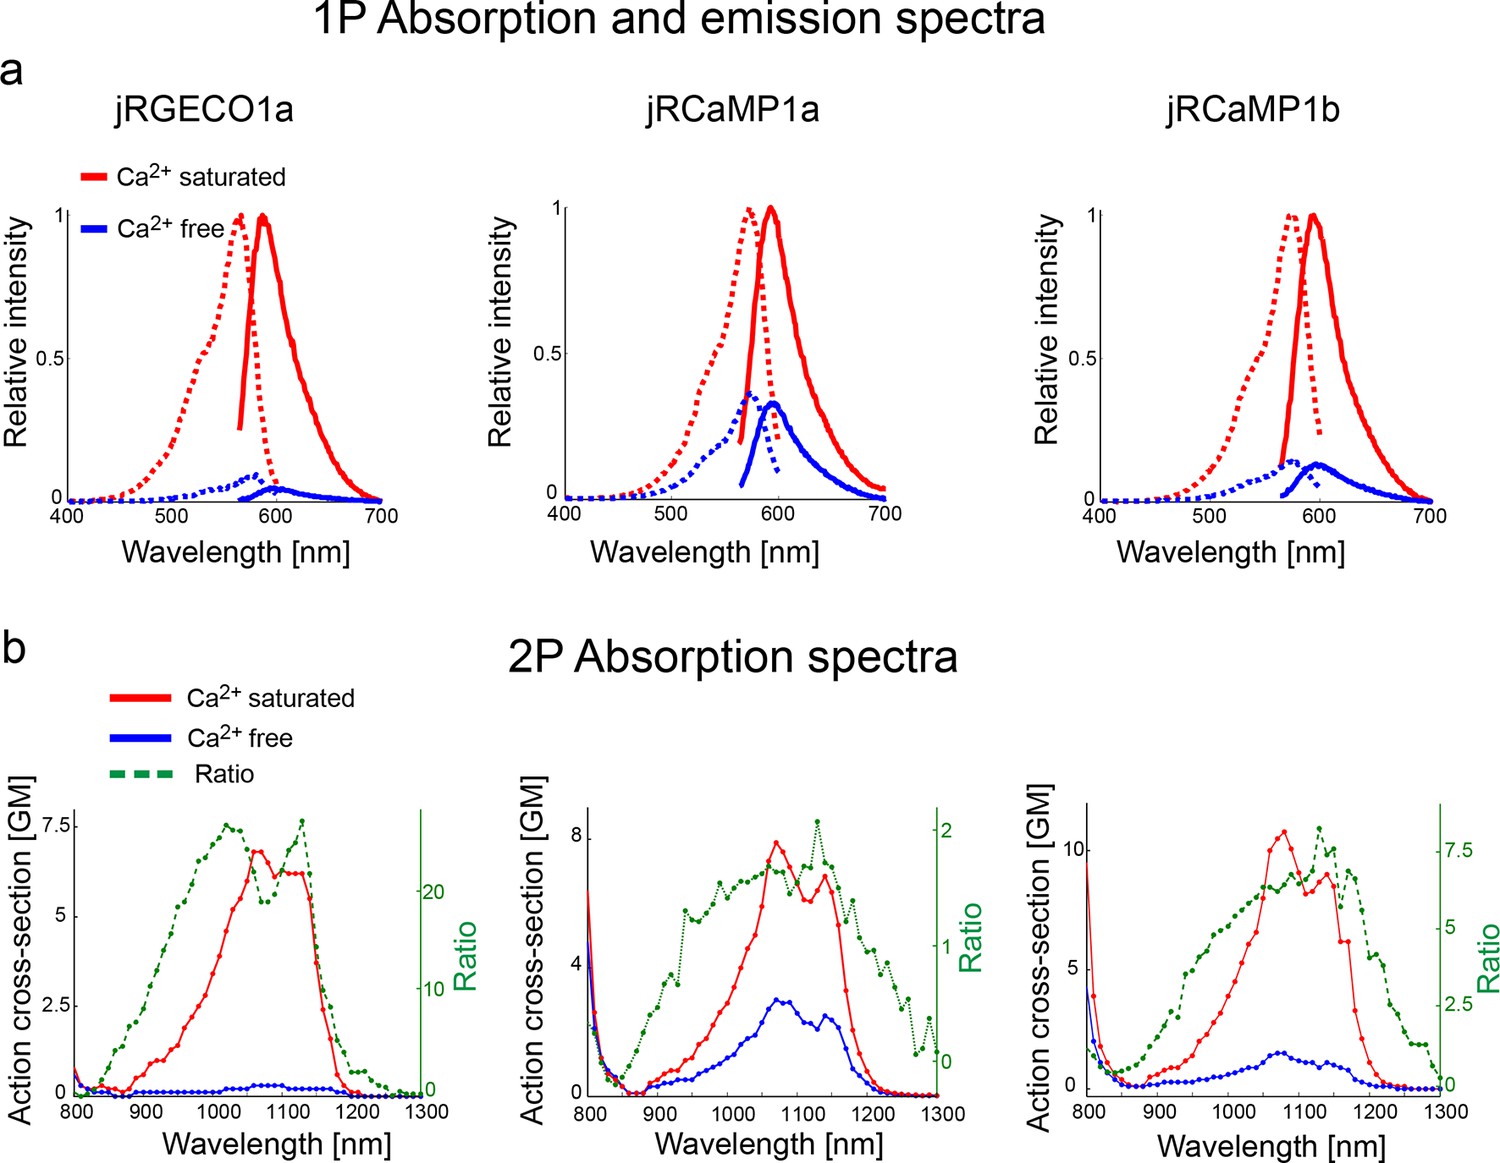
Absorption and emission spectra of red GECIs.
(a) One-photon excitation (dashed lines) and emission (solid lines) spectra for jRGECO1a (left panel), jRCaMP1a (middle), and jRCaMP1b (right) in Ca-free (blue lines) and Ca-saturated (red lines) states. (b) Two-photon excitation spectra for jRGECO1a, jRCaMP1a, and jRCaMP1b, in Ca-free (blue) and Ca- saturated (red) states. Dashed green lines show the ratio between these two states.
Figure 2—figure supplement 2
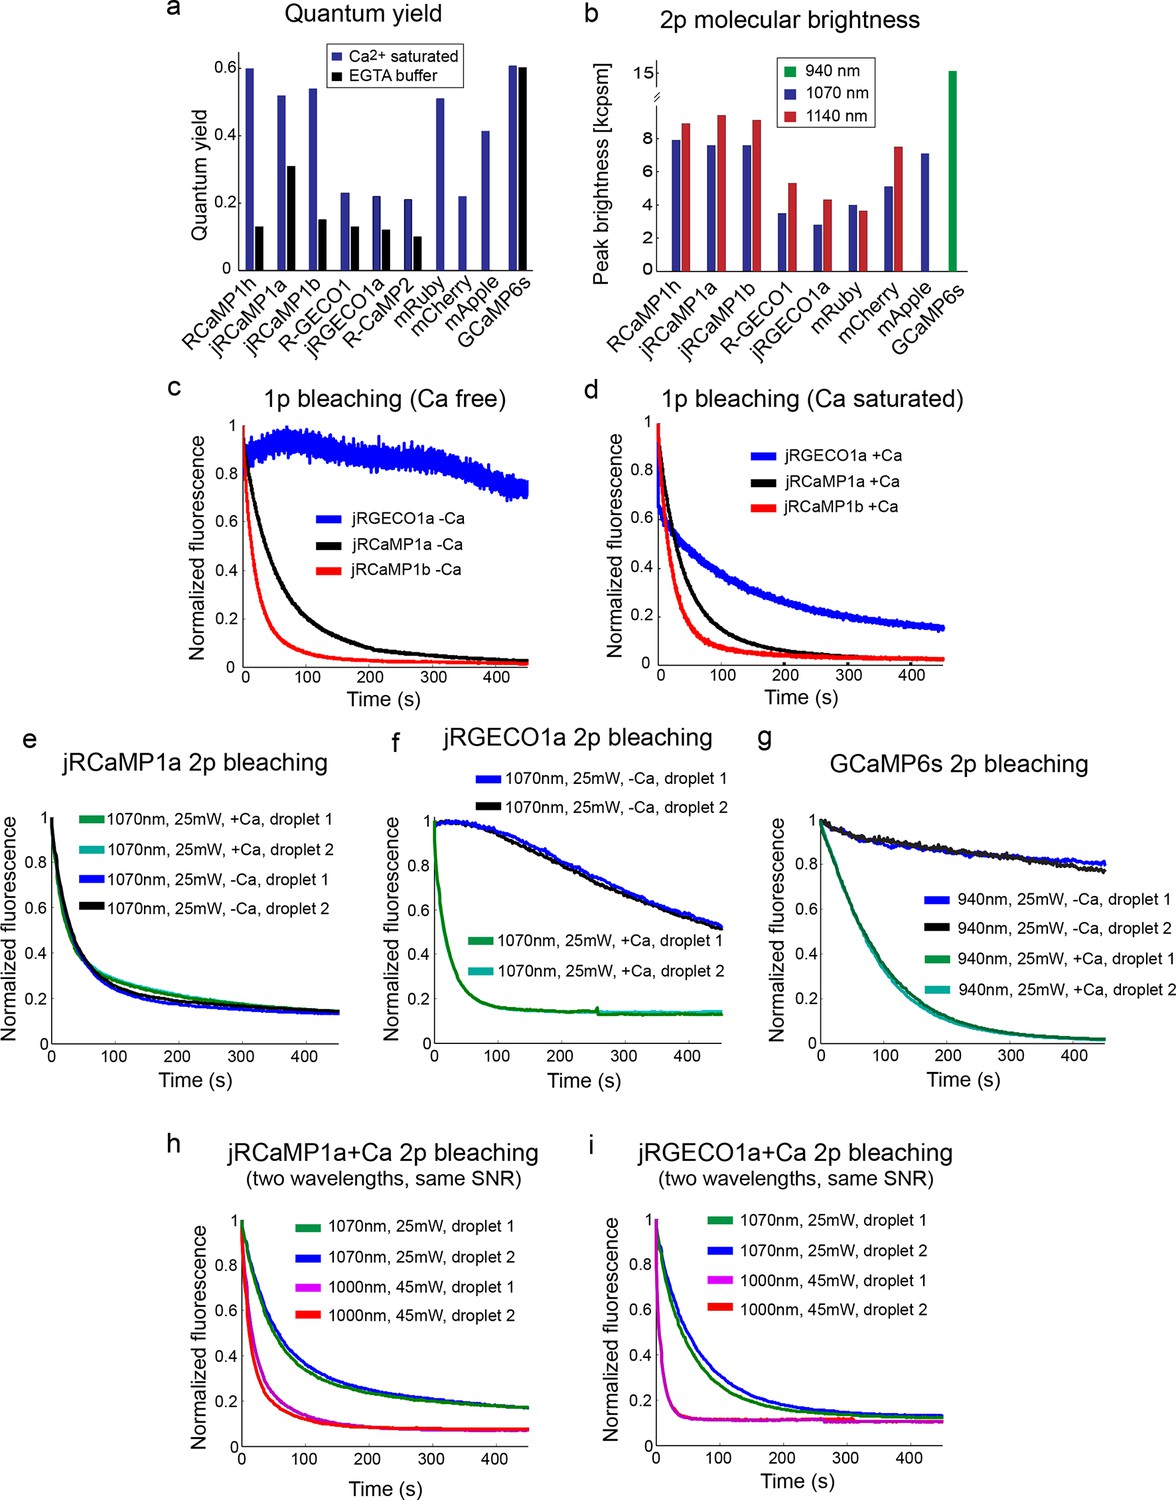
Biophysical properties.
(a) Fluorescence quantum yield of red GECIs and red FPs (all at 1070 nm), and GCaMP6s (940 nm). (b) Peak two-photon molecular brightness (Ca-bound state for GECIs) of red GECIs, red FPs, and GCaMP6s (note the different wavelengths used). mApple data in a and b is taken from Akerboom et al., 2013. Measurements were done in a purified protein assay (Materials and methods). (c–d) One-photon bleaching curves of jRGECO1a (blue), jRCaMP1a (black), and jRCaMP1b (red) in Ca-free (c) and Ca-saturated (d) states. Note that Ca-free jRGECO1a bleaching is negligible, while ~40% of the Ca-saturated jRGECO1a molecules photobleach within few seconds. e–g, Two-photon bleaching curves of jRCaMP1a (e), jRGECO1a (f), and GCaMP6s (g) in Ca-free and Ca-saturated states. h–i, Two-photon bleaching profile of Ca-saturated jRCaMP1a (h) and jRGECO1a (i) when excited with 2 different wavelengths while maintaining an identical SNR.
Figure 2—figure supplement 3
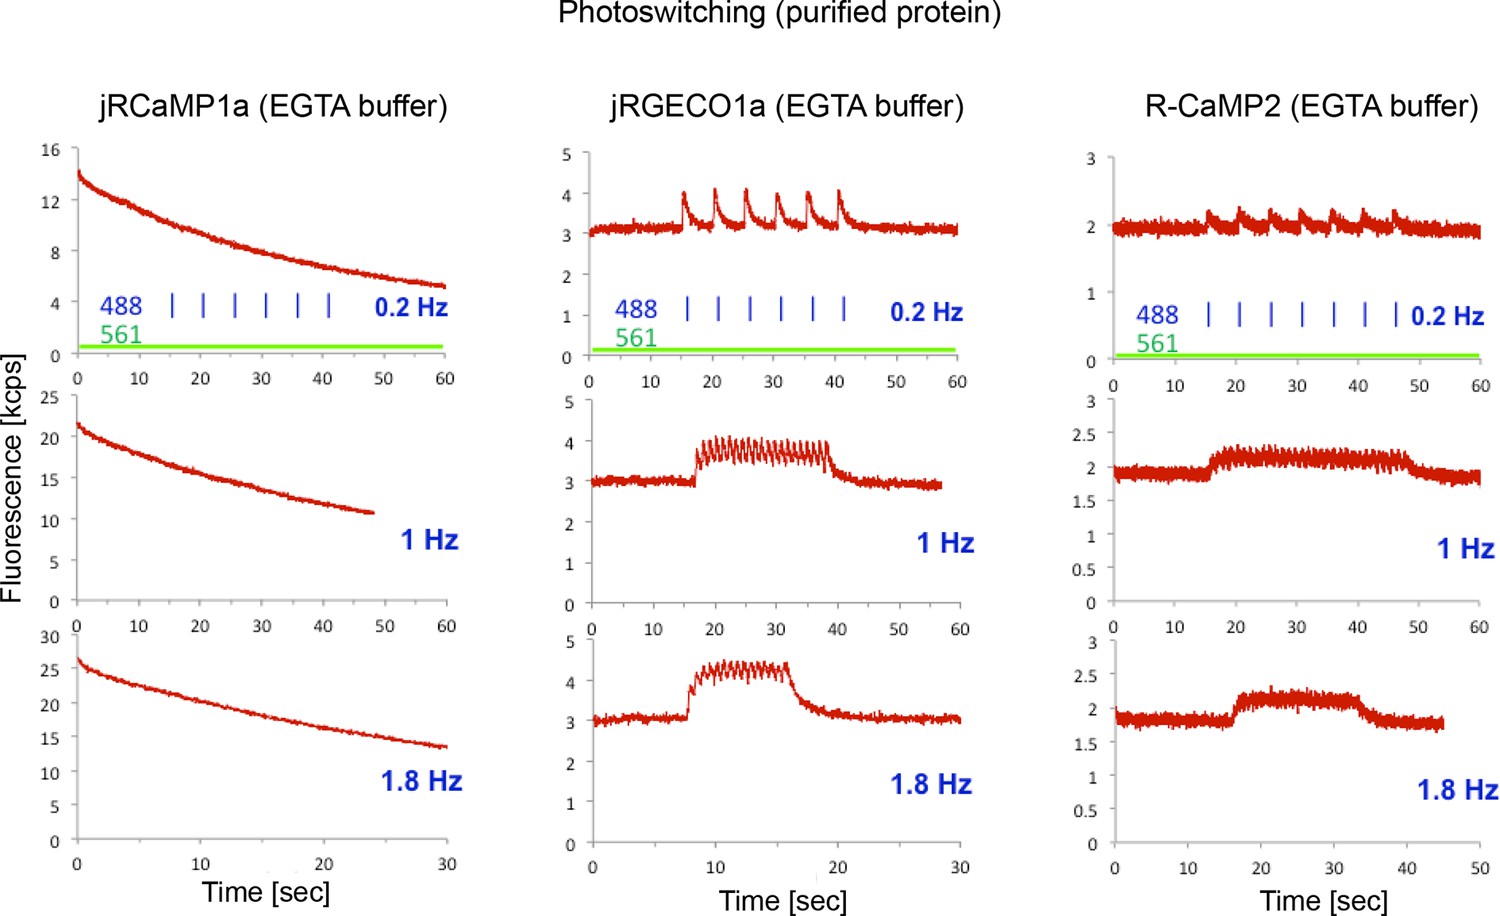
Photoswitching in purified protein assay.
Fluorescence traces of purified Ca2+-free protein droplets (red traces) of jRCaMP1a (left panel), jRGECO1a (middle), and R-CaMP2 (right) constantly illuminated with 561 nm excitation light (40 mW/mm2), and with 488 nm light pulses (3.2 mW/mm2 peak power, 50 ms duration, 0.2 Hz, 1 Hz, and 1.8 Hz in upper, middle, and lower rows respectively). For the mApple-based GECIs, jRGECO1a and R-CaMP2, blue illumination induced a transient, calcium-independent increase in fluorescence intensity indicative of photoswitching, while jRCaMP1a does not photoswitch, but photobleaches.
Figure 2—figure supplement 4
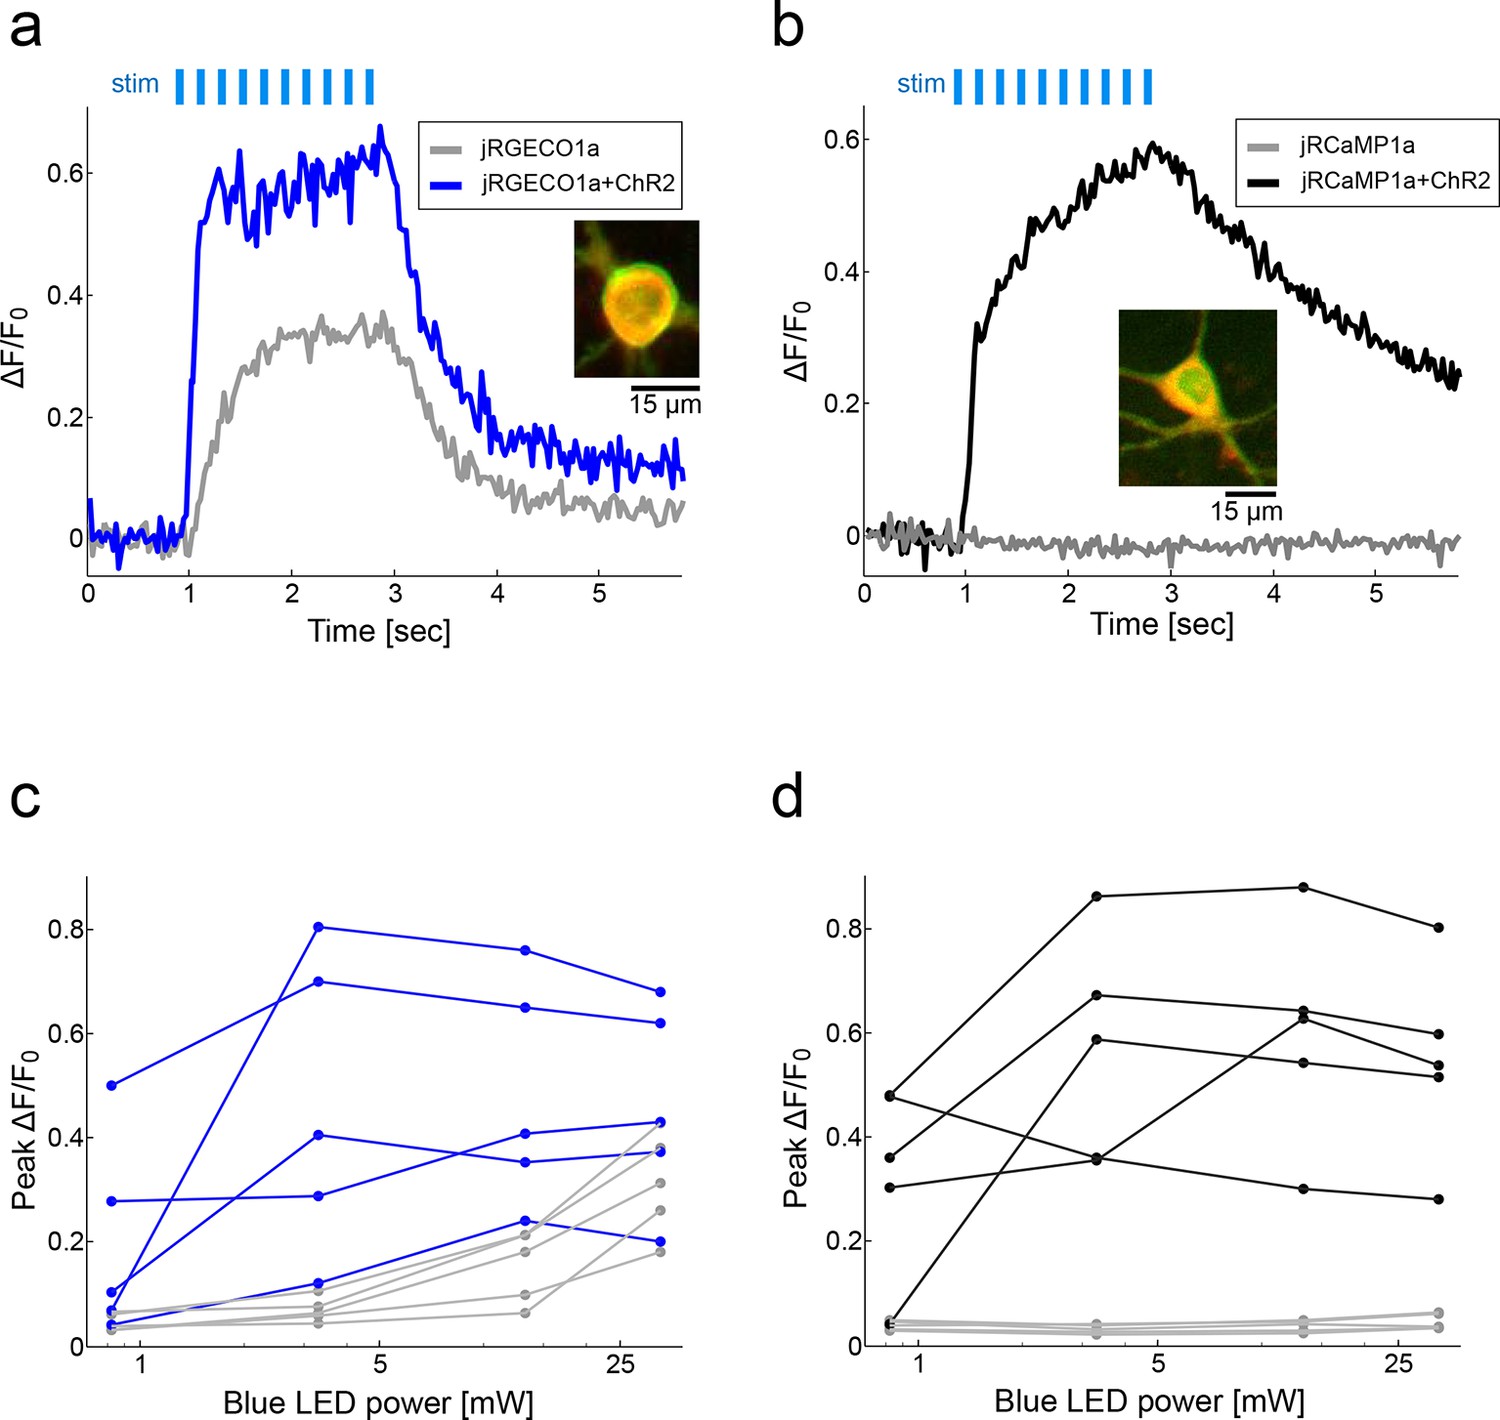
jRCaMP1a is more compatible than jRGECO1a for simultaneous use with ChR2.
(a) Fluorescence signal from cultured rat hippocampal neurons transfected with either jRGECO1a alone (gray) or jRGECO1a+ChR2-Venus (blue) following stimulation with blue light (33 mW, 10 ms pulses, 83 Hz, 200 μm X 200 μm FOV; Materials and methods) stimulus pulses (light blue bars). Inset, merged image of neuron expressing both jRGECO1a (red) and ChR2-Venus (green). (b) Same experiment as in a with cultured neurons expressing jRCaMP1a alone (gray) or jRCaMP1a+ChR2-Venus (black). (c) Peak ΔF/F0 values for 5 neurons expressing jRGECO1a+ChR2-Venus (blue) and 5 neurons expressing jRGECO1a alone (gray) as a function of blue stimulus light power. (d) Peak ΔF/F0 for 5 neurons expressing jRCaMP1a+ChR2-Venus (black) and 5 neurons expressing jRCaMP1a alone (gray) as function of blue stimulus light power.
Figure 3 with 2 supplements
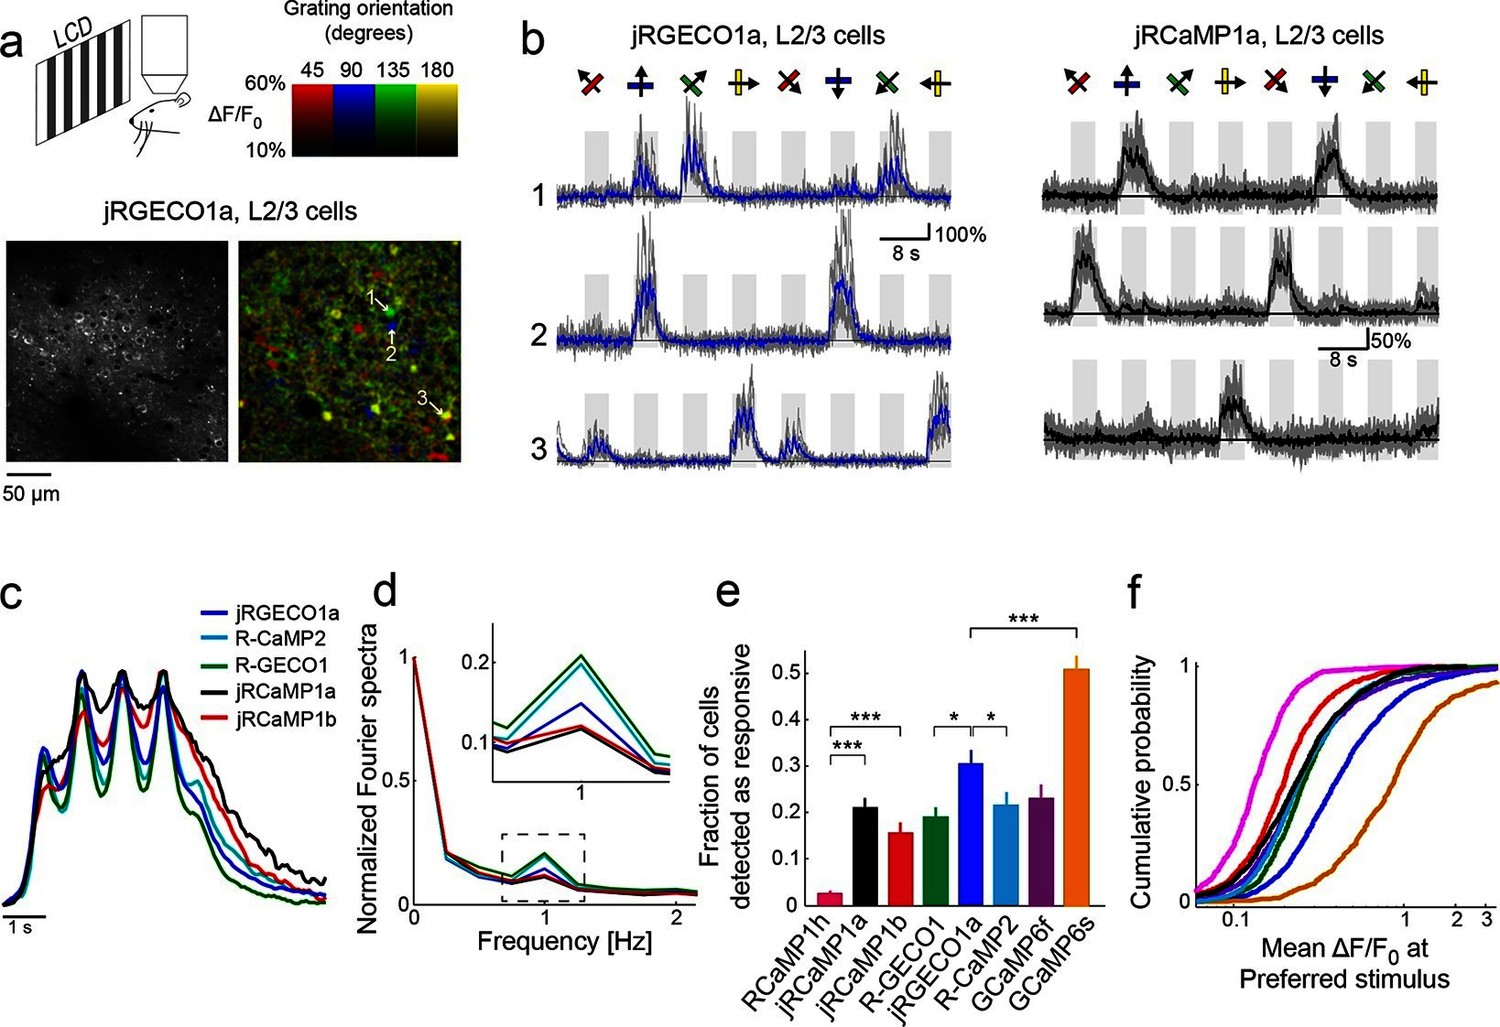
jRGECO1a and jRCaMP1a and jRCaMP1b performance in the mouse primary visual cortex.
(a) Top, schematic of the experiment. Bottom, image of V1 L2/3 cells expressing jRGECO1a (left), and the same field of view color-coded according to the neurons’ preferred orientation (hue) and response amplitude (brightness). (b) Example traces from three L2/3 neurons expressing jRGECO1a (left) and jRCaMP1a (right). Single trials (gray) and averages of 5 trials (blue and black for jRGECO1a and jRCaMP1a respectively) are overlaid. Eight grating motion directions are indicated by arrows and shown above traces. The preferred stimulus is the direction evoking the largest response. jRGECO1a traces correspond to the cells indicated in panel a (see also Video 1). (c) Average response of neurons to their preferred stimulus (175 cells, R-GECO1; 310, R-CaMP2; 395, jRGECO1a; 347, jRCaMP1a; 95, jRCaMP1b. n=4 mice for jRGECO1a and jRCaMP1a, n=3 mice for all other constructs. Panels c-f are based on the same data set. (d) Fourier spectra normalized to the amplitude at 0 Hz for neurons driven with 1 Hz drifting gratings, transduced with RCaMP1h, R-GECO1, R-CaMP2, jRGECaMP1a, jRCaMP1b, and jRGECO1a. Inset, zoomed-in view of 1 Hz response amplitudes. (e) Fraction of cells detected as responding to visual stimulus (ANOVA test, p<0.01) when expressing different calcium indicators. This fraction was 8- and 6-fold higher for jRCaMP1a and jRCaMP1b compared to RCaMP1h, respectively, and 60% higher for jRGECO1a compared to R-GECO1 (Wilcoxon rank sum test; *, p<0.05; **, p<0.01; ***, p<0.001). Error bars correspond to s.e.m (26 fields-of-view, RCaMP1h; 45, jRCaMP1a; 31, jRCaMP1b; 30, R-GECO1; 40, jRGECO1a; 33, R-CaMP2; 23, GCaMP6s; 29, GCaMP6f) (f) Distribution of ΔF/F amplitude for the preferred stimulus. A right-shifted curve, such as jRGECO1a vs. R-GECO1 or jRCaMP1a/b vs. jRCaMP1h, indicates enhancement of response amplitude (75 percentile values of 0.36 and 0.27 vs. 0.18 for jRCaMP1a and jRCaMP1b vs. RCaMP1h, and 0.66 vs. 0.38 for jRGECO1a vs. GCaMP6f, respectively). (1210 cells, R-GECO1; 861, RCaMP1h; 1733, R-CaMP2; 1605, jRGECO1a; 1981, jRCaMP1a; 971, jRCaMP1b; 907, GCaMP6f; 672, GCaMP6s), same colors as in e.
Figure 3—figure supplement 1
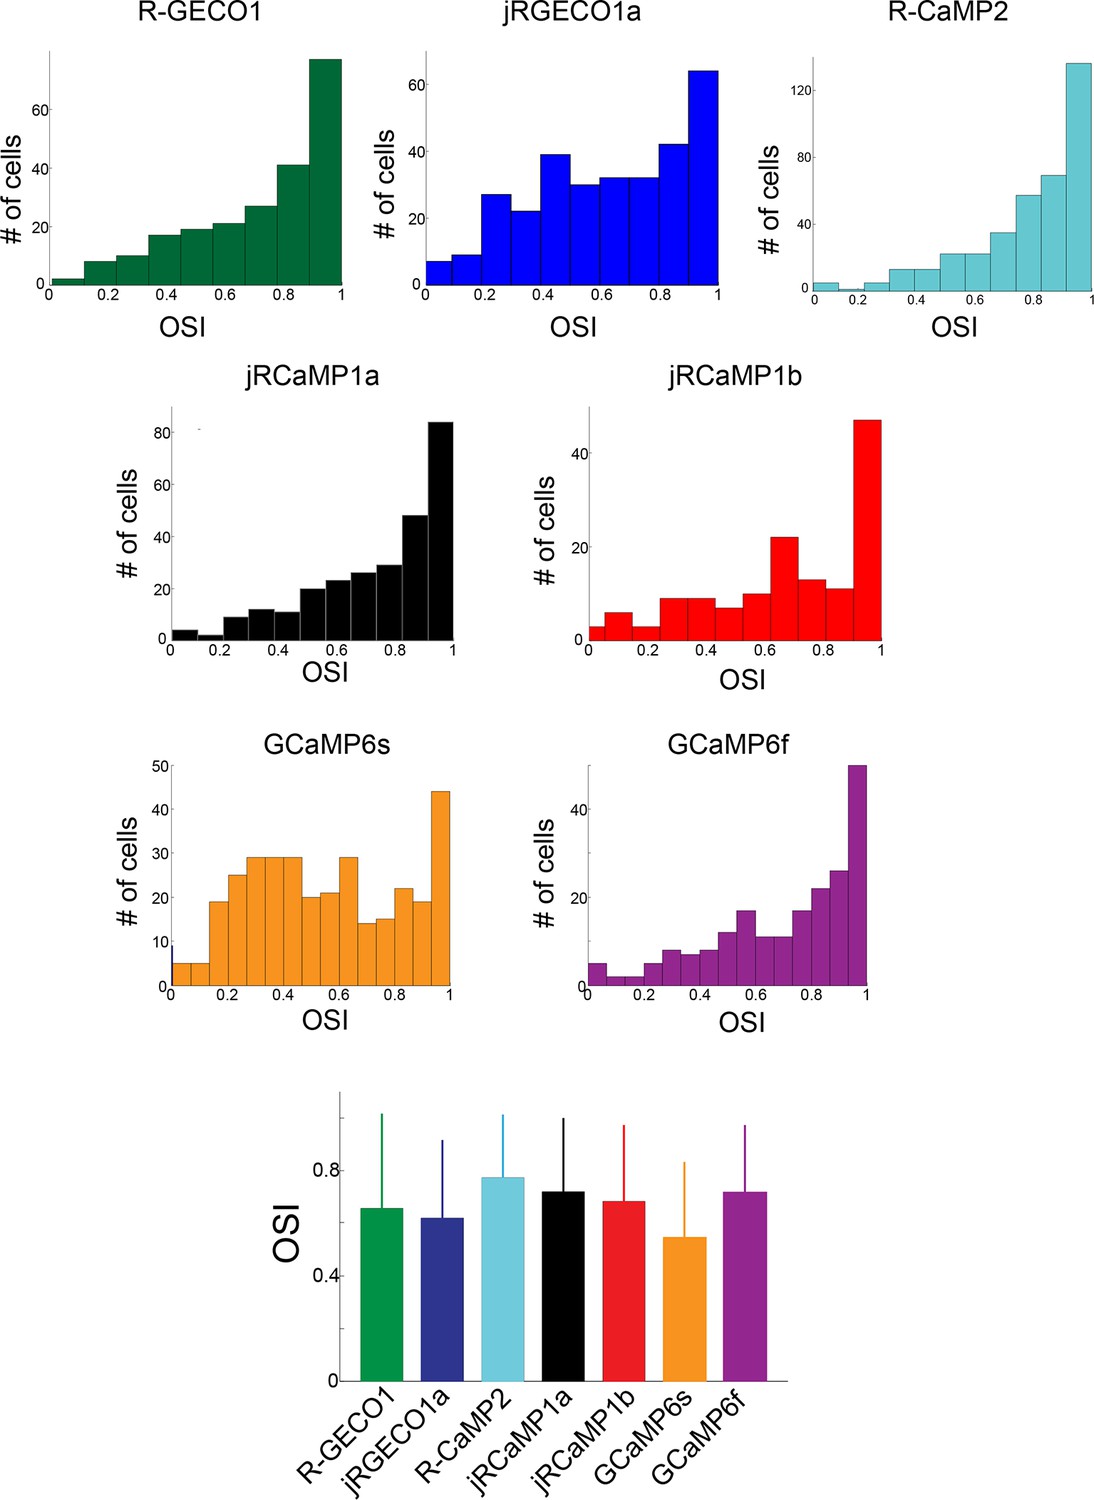
Comparison of orientation tuning in V1 neurons measured with different red GECIs.
Distribution of orientation selectivity index (OSI, 3 upper rows) for all cells detected as responsive, measured using different GECIs. Bottom panel, mean ± s.d for all constructs show similar tuning properties (n=238 cells, R-GECO1; 308, jRGECO1a; 386, R-CaMP2; 277, jRCaMP1a; 141, jRCaMP1b; 337, GCaMP6s; 203, GCaMP6f).
Figure 3—figure supplement 2
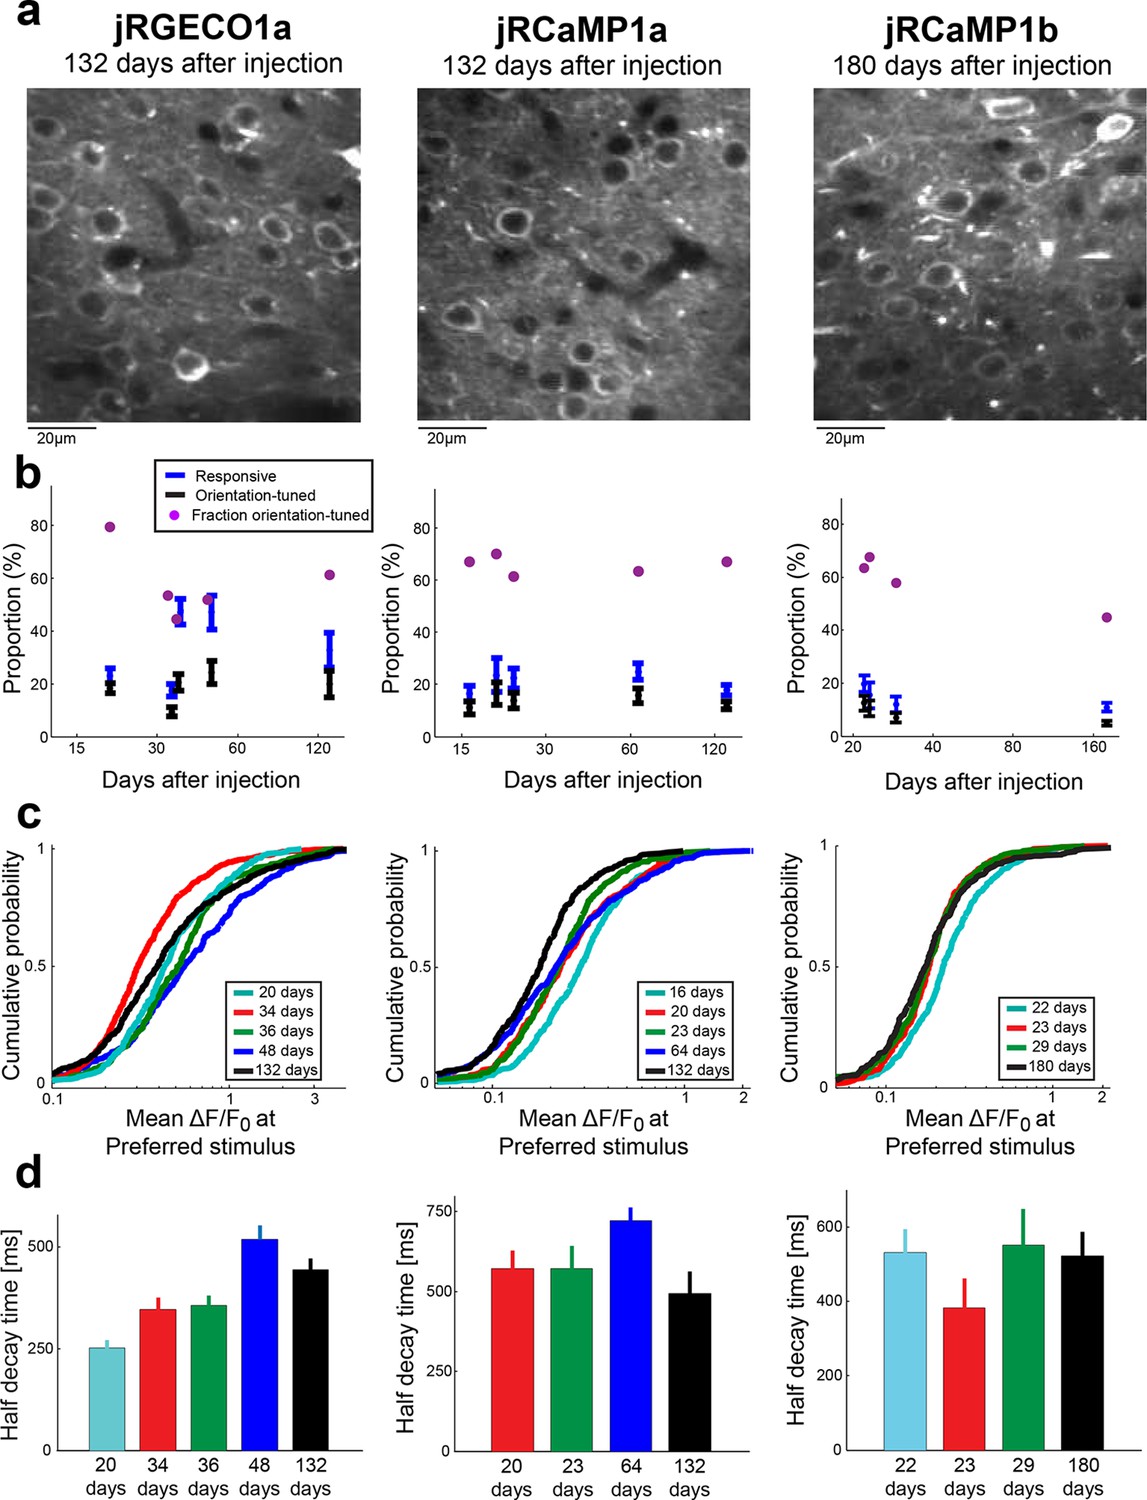
Long-term expression of red GECIs in mouse V1.
(a) Example images of V1 L2/3 neurons after long term expression of red GECIs. (b) Comparison of the proportion of responsive cells, orientation-tuned cells, and the ratio between them. Each time point corresponds to a different mouse. (c) Distributions of peak ΔF/F0 for different animals imaged after different times of expression of the red GECI. No strong effect of expression time on peak response was detected. (d) Half decay times of the fluorescence response for different animals with different expression time of the red GECI. No strong effect of expression time on the decay kinetics was seen. jRCaMP1a data for 16 days of expression is not shown because the number of cells eligible for this analysis was too small (Materials and methods).
Figure 4 with 3 supplements

Combined imaging and electrophysiology in the mouse visual cortex.
(a) Simultaneous fluorescence dynamics and spikes measured from jRGECO1a (top, blue) and jRCaMP1a (bottom, black) expressing neurons. The number of spikes for each burst is indicated below the trace (single spikes are indicated by asterisks). Left inset, a jRCaMP1a expressing neuron with the recording pipette (green). (b) Zoomed-in view of bursts of action potentials (corresponding to boxes in a). Top, jRGECO1a; bottom, jRCaMP1a. (c) jRGECO1a fluorescence changes in response to 1 AP (top, 199 spikes from 11 cells, n=6 mice), and jRCaMP1a fluorescence changes in response to 2 APs (bottom, 65 spikes from 10 cells, n=5 mice). Blue (top) and black (bottom) lines are the median traces. (d) Distribution of peak fluorescence change as a function of number of action potentials in a time bin (jRGECO1a, blue boxes: 199 1AP events; 2 APs: 70 events within a 100 ms time bin; 3 APs: 29, 125 ms; 4 APs: 34, 150 ms; 5 APs: 35, 175 ms; 6 APs: 22, 200 ms; 7 APs:14, 225 ms; 8 APs: 21, 250 ms. jRCaMP1a, black boxes: 135 1 AP events; 2 APs: 65, 150 ms; 3 APs: 71, 200 ms; 4 APs: 52, 250 ms; 5 APs: 33, 300 ms; 6 APs: 20, 350 ms; 7 APs: 14, 350 ms; 8 APs: 11, 350 ms). Each box corresponds to the 25th to 75th percentile of the distribution (q1 and q3 respectively), whisker length is up to the extreme data point or 1.5l (q3 - q1). (e) Receiver operating characteristic (ROC) curve for classifying 1 and 2 APs for jRGECO1a and jRCaMP1a (jRGECO1a: 320 events of no AP firing within a 4 s bin, jRCaMP1a: 274 events of no AP firing within a 5 s bin, 1 AP and 2 APs data same as in d). (f) Detection sensitivity index (d’) as a function of number of spikes in a time bin (same parameters as in d–e). (g) Comparison of mean half rise (left) and decay (right) times of jRGECO1a and jRCaMP1a for 2 AP response. Error bars correspond to s.e.m.
Figure 4—figure supplement 1
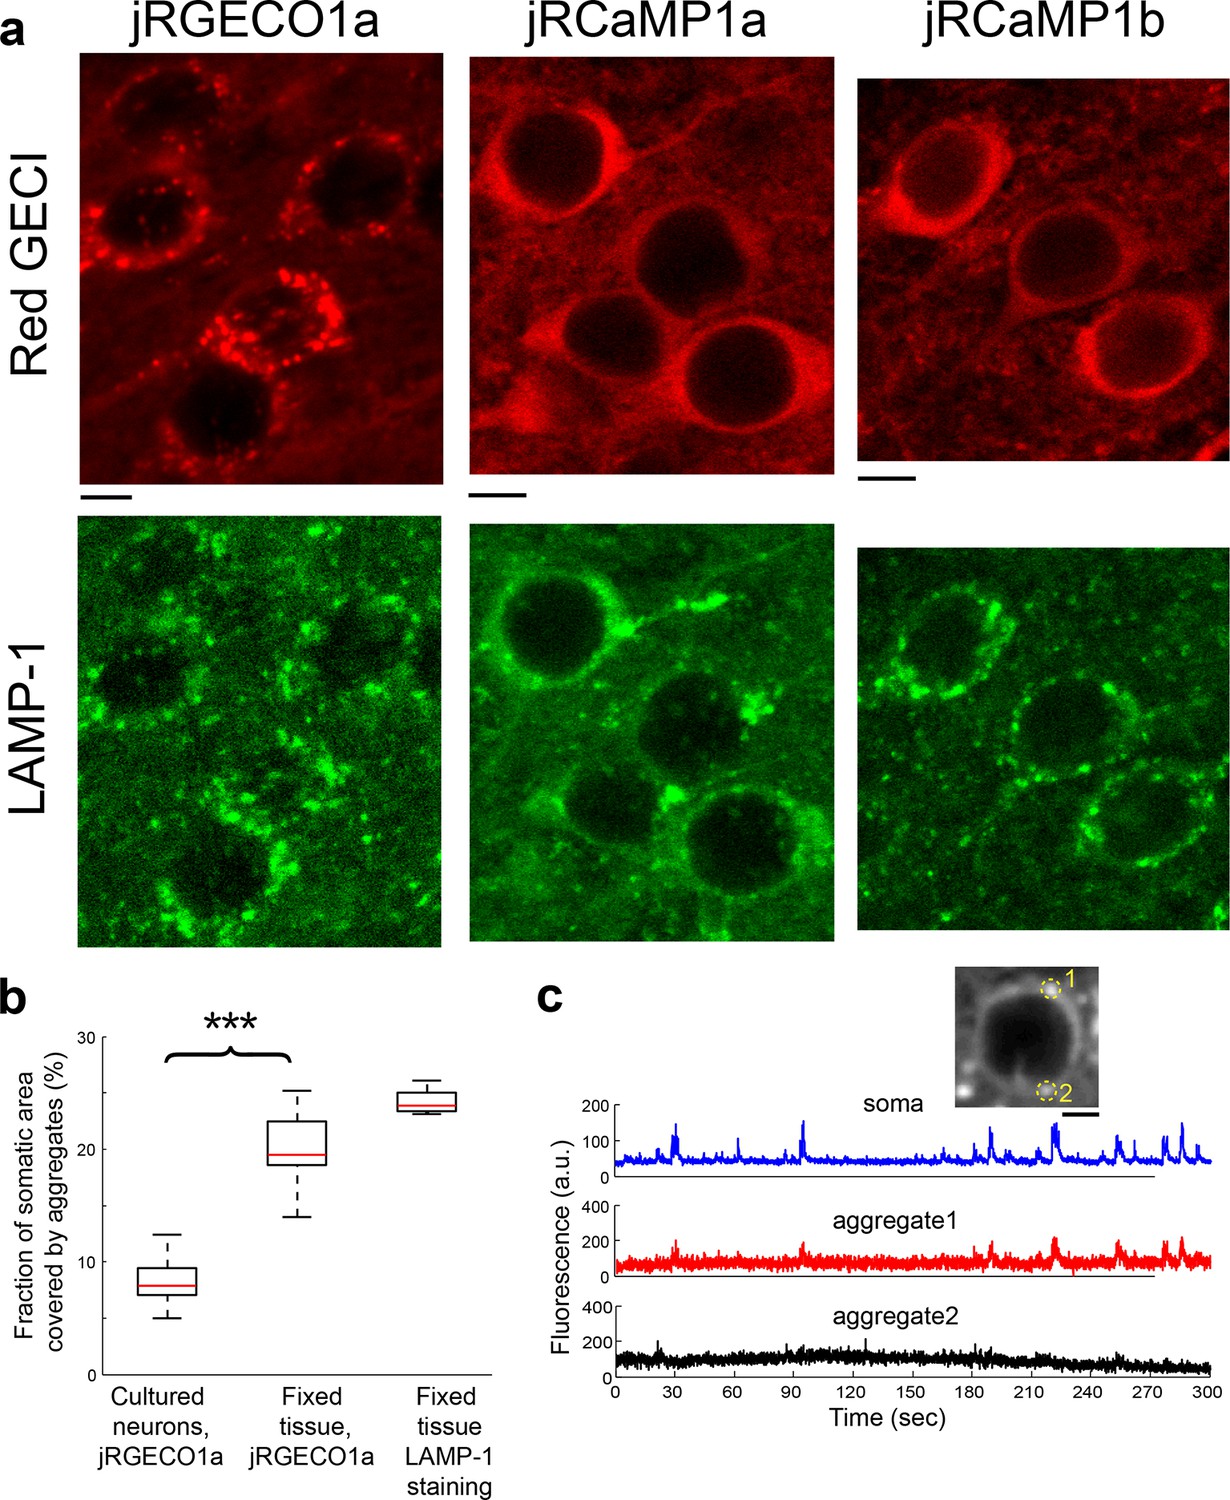
jRGECO1a accumulates in lysosomes.
(a) Red GECI expression (top, red) and LAMP-1 immunostaining (bottom, green) of fixed tissue sections from mouse V1. (b) Distribution of the fraction of somatic area covered by protein aggregates for neurons expressing jRGECO1a. Neurons in V1 (fixed tissue) show more frequent jRGECO1a aggregates than cultured neurons (Wilcoxon rank sum test, p<0.001; n=10 cultured cells; 14, fixed tissue cells; 8, fixed tissue LAMP-1 immunostained cells). (c) Example traces from V1 L2/3 cell showing ΔF/F0 changes of somatic regions overlapping with protein aggregates (red, black) and regions excluding aggregates (blue). Inset, image of the cell, with aggregates indicated by circles.
Figure 4—figure supplement 2
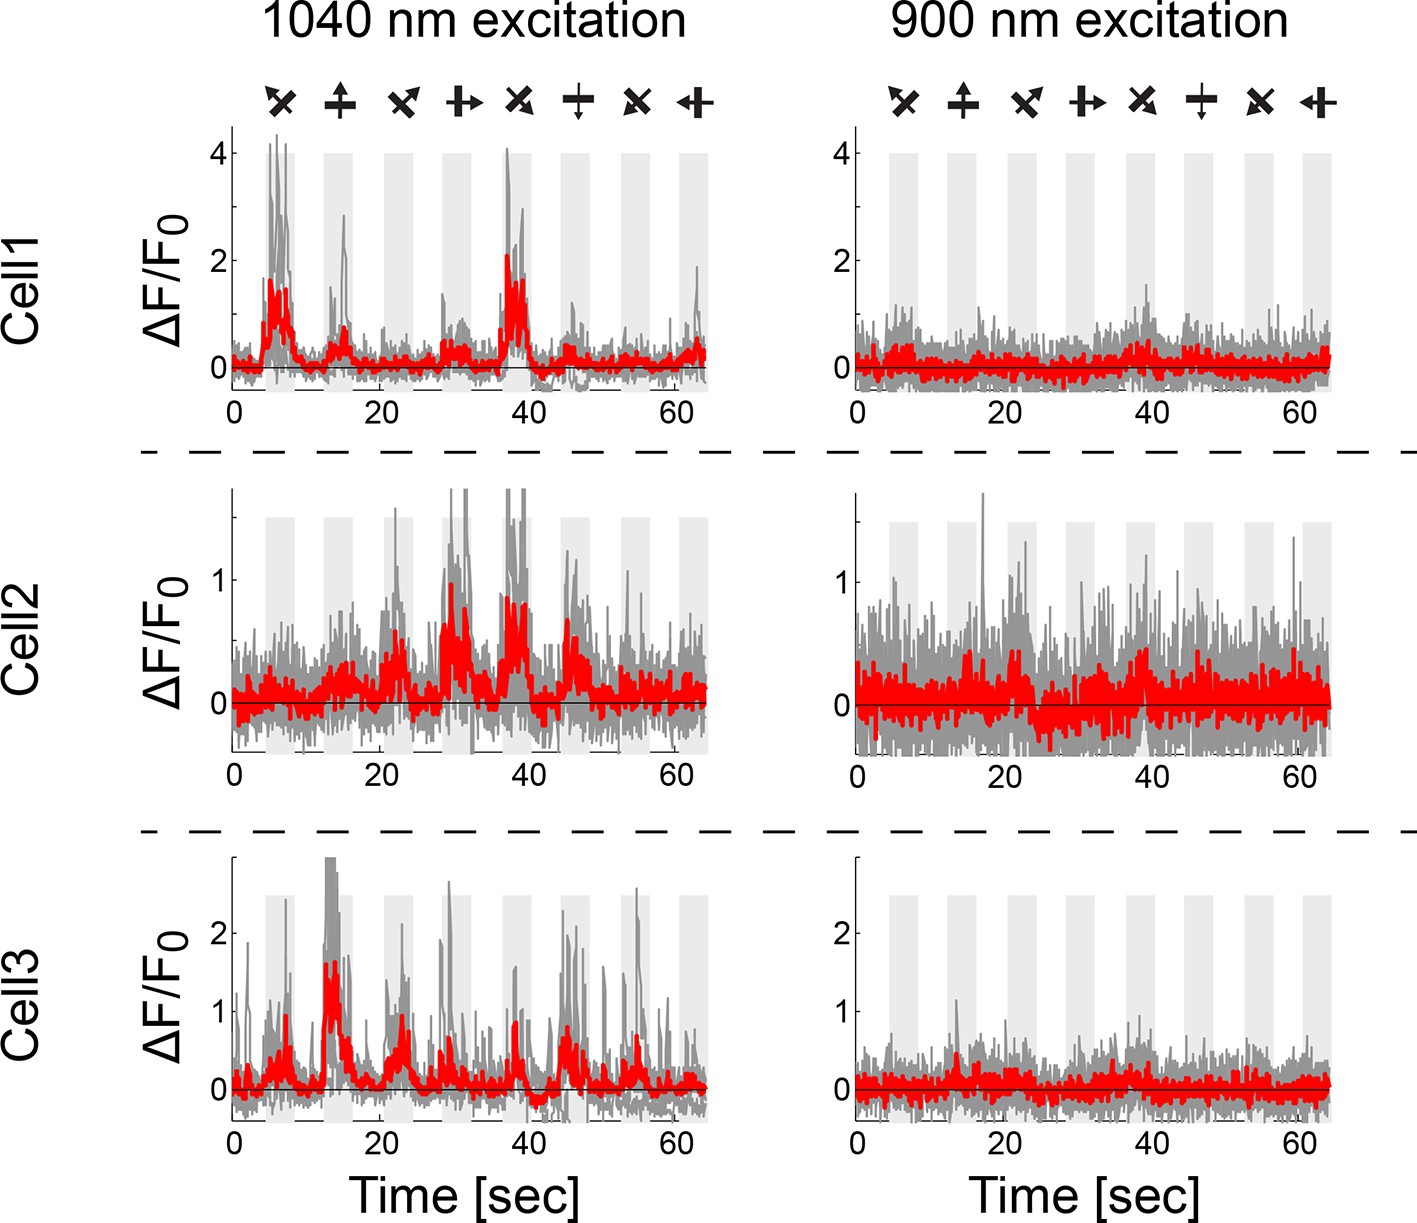
Red GECIs lack functional response at 900nm excitation.
Functional responses of three example cells (jRGECO1a, expressed in L4 V1 neurons) at 1040 nm excitation (left) and 900 nm (25 vs. 1 cells were detected as responsive out of 50 cells in FOV; drifting grating stimuli, Materials and methods).
Figure 4—figure supplement 3
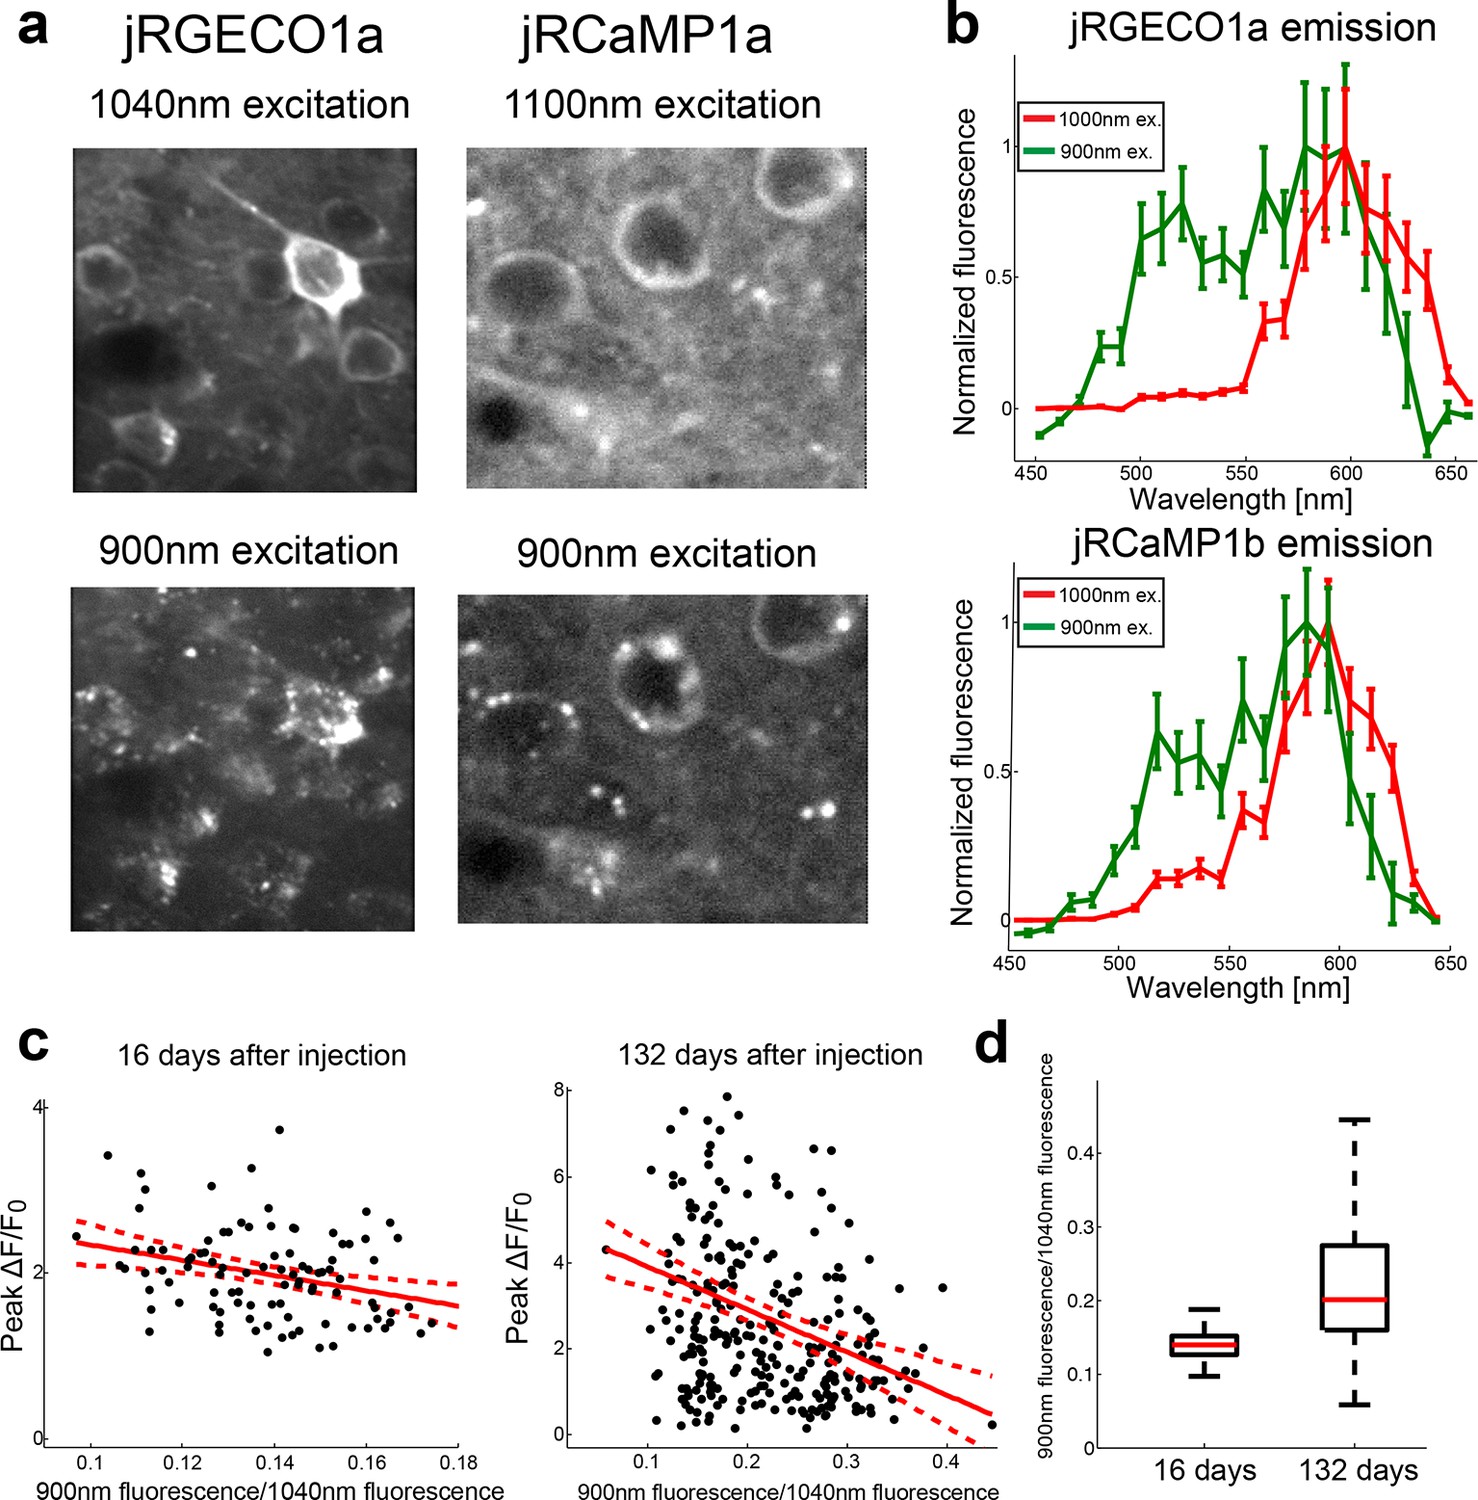
Complex spectral and functional characteristics of the red GECIs after long-term expression in vivo.
(a) Images of jRGECO1a (left) and jRCaMP1a (right) L2/3 neurons in vivo excited by 1040 nm (top) and 900 nm light (bottom). Note the punctate fluorescence image in the bottom images. (b) Emission spectra from fixed tissue cells of jRGEC1a (top) and jRCaMP1b (bottom) when illuminated with 900 nm and 1000 nm laser reveal a greenish emission band. (c) Effect of long-term expression on accumulation of greenish species. Scatter plot of the ratio between jRGECO1a somatic signal detected at 900 nm excitation (red and green channel summed) and baseline fluorescence detected at 1040 nm excitation, and the peak somatic ΔF/F0 for drifting grating stimuli. Measurements were done 16 (left) and 132 (right) days after AAV injection. Red solid line shows the linear regression model, red dashed lines are 95% confidence interval; R2=0.09 for both datasets and slope of -9.2 and -10 respectively (n=98 cells, left panel; n=274 cells, right panel; linear regression model, F test, p<0.005). (d) Distribution of the somatic fluorescence ratio between 900 nm and 1040 nm excitation (same data as in c) show an increase in both the ratio median and its range with longer expression time. Each box corresponds to the 25th to 75th percentile of the distribution (q1 and q3 respectively), whisker length is up to the extreme data point or 1.5 (q3 - q1).
Figure 5

Deep tissue imaging using red GECIs.
(a) Left, schematic of the measurement. L5 neuron apical dendrites were imaged at different depths (FOVs 1-n). Right, RCaMP1h fluorescence from an L5 apical dendrite (red dots) as a function of imaging depth. For fixed excitation light the brightness decreases as a function of imaging depth because of scattering and absorption losses. The decay was characterized by fitting an exponential function to the signal (solid black line). (b) Exponential decay coefficients measured from dendrites expressing green (GCaMP6s or GCaMP6f) or red (RCaMP1h, jRCaMP1a, and jRGECO1a) GECIs. Red GECI signal decay coefficients were significantly longer than for green GECI (Wilcoxon rank sum test, p<0.0001; 3 mice and 19 dendrites for red GECIs; 2 mice and 14 dendrites for green GECIs). (c) L6 neurons, 850 μm under the pia. An NTSR1-cre mouse (Gong et al., 2007) was infected with FLEX-SYN1-NES-jRCaMP1a AAV. (d) Example traces from three example L6 neurons. Single trials (gray) and averages of 5 trials (black) are overlaid. Eight grating motion directions are indicated by arrows and shown above traces.
Figure 6

Dual color imaging in the mouse visual cortex.
(a) Two-photon action spectra of Ca- saturated GCaMP6s, jRCaMP1a, and jRGECO1a. Measurements were done on purified protein (Materials and methods). (b) Image of L5 apical dendrites (red) and LM axons (green) imaged in L1 (50 μm under the pia) of KJ18-cre mice. (c) ΔF/F0 traces of axonal (green) and dendritic (red) ROIs, as indicated in b (Video 2). (d) Zoom-in corresponding to the dashed box in c.
Figure 7 with 3 supplements

Imaging activity in Drosophila larval NMJ boutouns with red GECIs.
(a) Schematic representation of Drosophila larval neuromuscular junction (NMJ) assay. Segmented motor nerve is electrically stimulated while optically imaging calcium responses in presynaptic boutons (green arrows). (b) Response transients (mean ± s.e.m.) to 5 Hz stimulation (2 s duration) for several red and green GECIs. Response amplitudes were 4-fold and 60% higher for jRGECO1a than GCaMP6f and GCaMP6s respectively (p<10–4 and p=0.01, Wilcoxon rank sum test), jRCaMP1a response amplitude was 3-fold higher than GCaMP6f (p=10–4) and similar to GCaMP6s (12 FOVs for jRGECO1a; 11, jRCaMP1a; 13, jRCaMP1b; 12, GCaMP6s; 12, GCaMP6f; n=7 flies for all constructs) (c) Comparison of frequency tuned responses (peak ΔF/F0, mean ± s.e.m.) of red and green GECIs for 1, 5, 10, 20, 40, 80 and 160 Hz stimulation (2 s duration). jRGECO1a and jRCaMP1a response amplitudes were 2–3 fold higher than GCaMP6s and GCaMP6f for 1 Hz stimulus (p<0.001, Wilcoxon rank sum test), but lower for stimulus frequencies of 20 Hz and higher (12 FOVs for jRGECO1a; 10, R-GECO1; 11, jRCaMP1a; 13, jRCaMP1b; 10, RCaMP1h; 12, GCaMP6s; 12, GCaMP6f; n=5 flies for R-GECO1, n=7 flies for all other constructs) (d) Half decay time (mean ± s.e.m.) of red and green GECIs at 160 Hz stimulation (same FOVs and flies as in c; ***, p<0.001, Wilcoxon rank sum test).
-
Figure 7—source data 1
Summary of results shown in Figure 7—figure supplement 1.
Wilcoxon rank sum test is used for p-value.
- https://doi.org/10.7554/eLife.12727.022
-
Figure 7—source data 2
Summary of results shown in Figure 7—figure supplement 2.
Wilcoxon rank sum test is used for p-value.
- https://doi.org/10.7554/eLife.12727.023
-
Figure 7—source data 3
Summary of results shown in Figure 7—figure supplement 3.
Wilcoxon rank sum test is used for p-value.
- https://doi.org/10.7554/eLife.12727.024
Figure 7—figure supplement 1
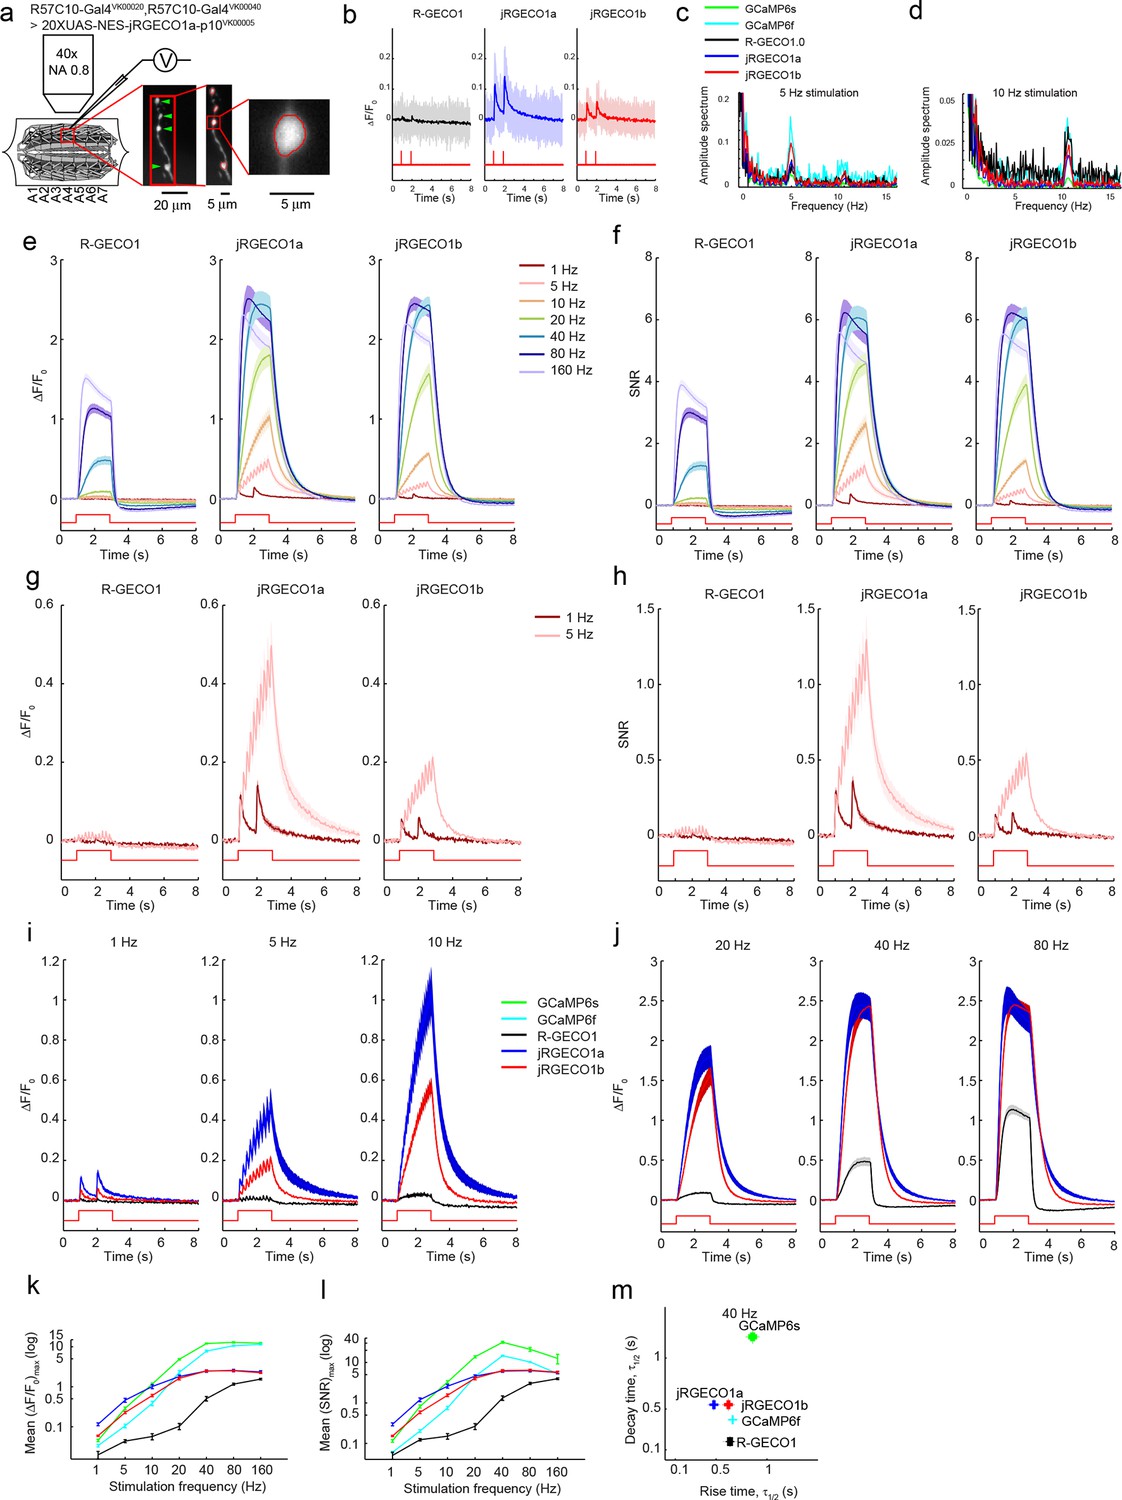
Imaging activity in Drosophila larval NMJ boutons with jRGECO1a.
(a) Schematic of experimental setup. Epifluorescence and high magnification △F/F0 images of Type 1b boutons (green arrowheads) from muscle 13 (segments A3-A5), with image segmentation ROIs superimposed (Materials and methods). (b) Single trial and averaged fluorescence transients after 1 Hz stimulus for 2 s for R-GECO1, jRGECO1a and jRGECO1b (R-GECO1: 10 FOVs in 5 flies, 40 boutons; jRGECO1a: 12 FOVs in 7 flies, 48 boutons; jRGECO1b: 9 FOVs in 6 flies, 36 boutons. Same data set used for all other analyses). jRGECO1a performance was superior to jRGECO1b in the Drosophila NMJ and zebrafish trigeminal neuron; therefore jRGECO1b was not fully tested in other animal models. (c–d) Fourier spectra normalized to 0 Hz of fluorescence signals acquired during 5 Hz (c) and 10 Hz (d) stimulation. (e–f) △F/F0 (e) and SNR (f) traces (mean ± s.e.m.) recorded with 1, 5, 10, 20, 40, 80 and 160 Hz stimulation for 2 s (indicated by red curves at the bottom, amplitude not to scale). (g–h) △F/F0 (g) and SNR (h) traces (mean ± s.e.m.) recorded with 1 and 5 Hz stimulation for 2 s (shown by red curves at the bottom, amplitude not to scale). (i–j) Comparison of △F/F0 traces (mean ± s.e.m.) of R-GECO1 and jRGECO1 variants with 1, 5, 10 Hz (i) and 20, 40, 80 Hz (j) stimulation for 2 s (shown by red curves at the bottom, amplitude not to scale). (k–l) Comparison of frequency tuned averaged peak △F/F0 (k) and peak SNR (l) (mean ± s.e.m.) of GCaMP6 variants, R-GECO1 and jRGECO1 variants, with 1, 5, 10, 20, 40, 80 and 160 Hz stimulation. Note that vertical axes are log scale. (m) Comparison of kinetics of GCaMP6 variants, R-GECO1 and jRGECO1 variants with 40 Hz stimulation. Horizontal axes are half rise time and vertical axes are half decay time.
Figure 7—figure supplement 2
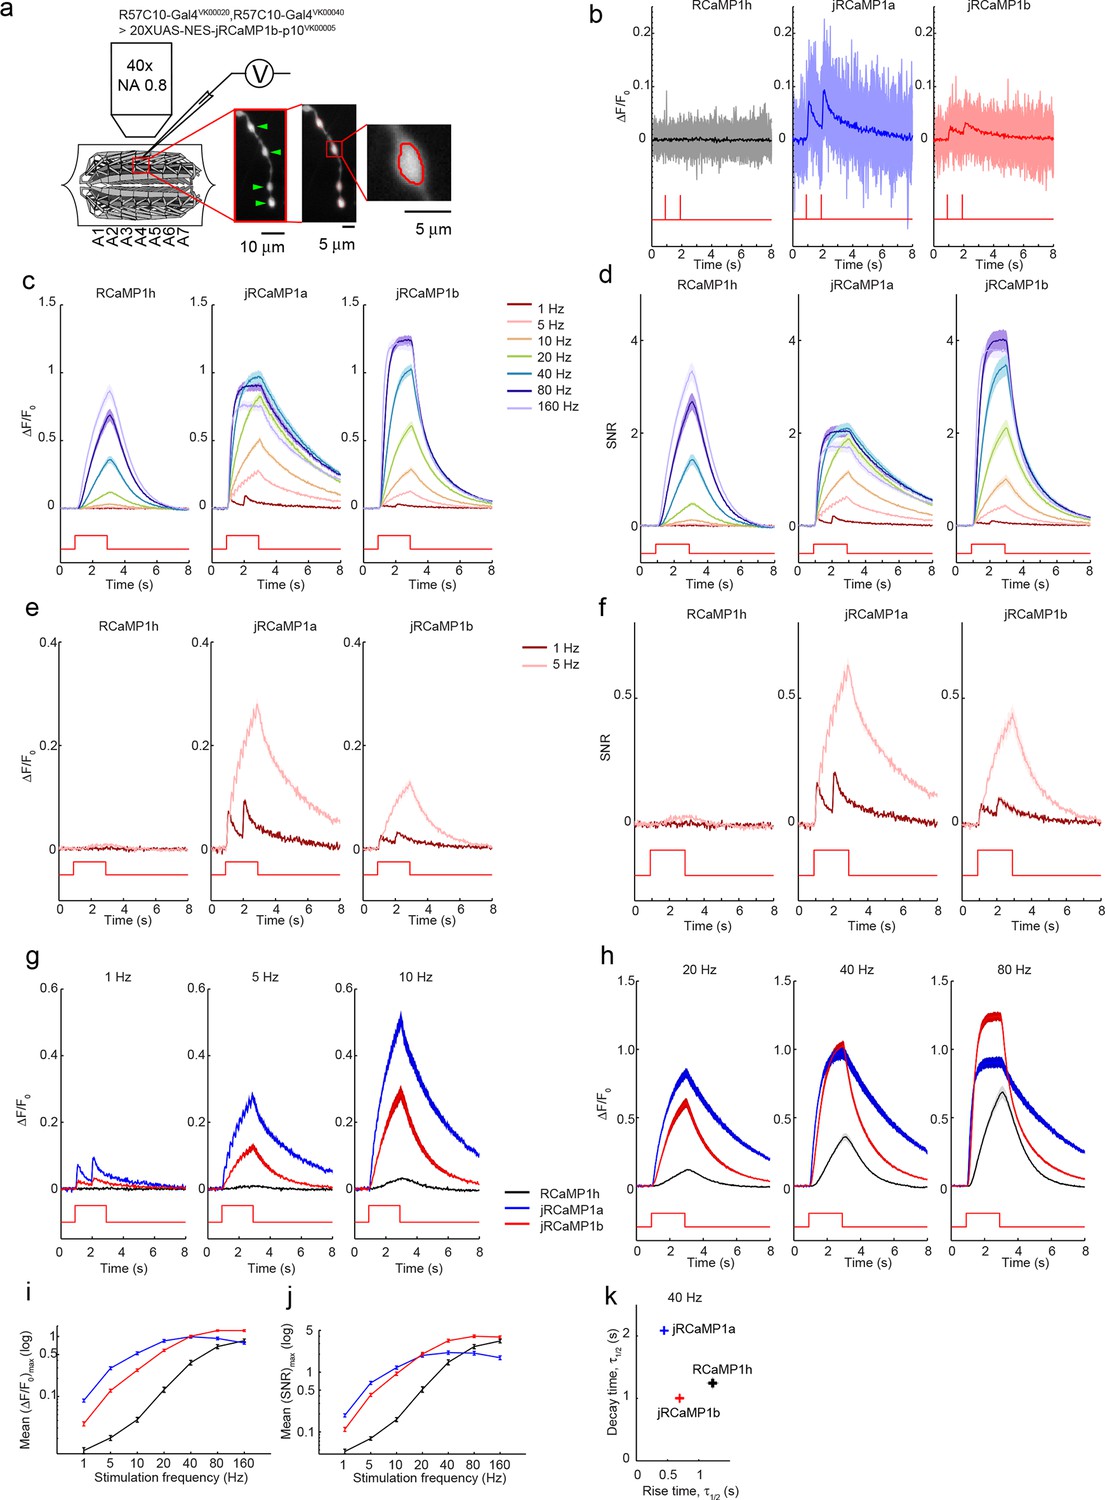
Imaging activity in Drosophila larval NMJ boutons with jRCaMP1 constructs.
(a) Schematic of experimental setup. Epifluorescence and high magnification △F/F0 images of Type 1b boutons (green arrowheads) from muscle 13 (segments A3-A5), with image segmentation ROIs superimposed (Materials and methods). (b) Single trial and averaged fluorescence transients after 1 Hz stimulus for 2 s for R-GECO1, jRCaMP1a and jRCaMP1b (RCaMP1h: 10 FOVs in 7 flies, 40 boutons; jRCaMP1a: 11 FOVs in 7 flies, 44 boutons; jRCaMP1b: 13 FOVs in 7 flies, 52 boutons. Same data set used for all other analyses). (c-d) △F/F0 (c) and SNR (d) traces (mean ± s.e.m.) recorded with 1, 5, 10, 20, 40, 80 and 160 Hz stimulation for 2 s (shown by red curves at the bottom, amplitude not to scale). (e–f) △F/F0 (e) and SNR (f) traces (mean ± s.e.m.) recorded with 1 and 5 Hz stimulation for 2 s (shown by red curves at the bottom, amplitude not to scale). (g–h), Comparison of △F/F0 traces (mean ± s.e.m.) of R-GECO1 and jRCaMP1 variants with 1, 5, 10 Hz (g) and 20, 40, 80 Hz (h) stimulation for 2 s (shown by red curves at the bottom, amplitude not to scale). (i–j) Comparison of frequency tuned averaged peak △F/F0 (i) and peak SNR (j) (mean ± s.e.m.) of RCaMP1h and jRCaMP1 variants, with 1, 5, 10, 20, 40, 80 and 160 Hz stimulation. Note that vertical axes are log scale. (k) Comparison of kinetics of RCaMP1h and jRCaMP1 variants with 40 Hz stimulation. Horizontal axes are half rise time and vertical axes are half decay time.
Figure 7—figure supplement 3
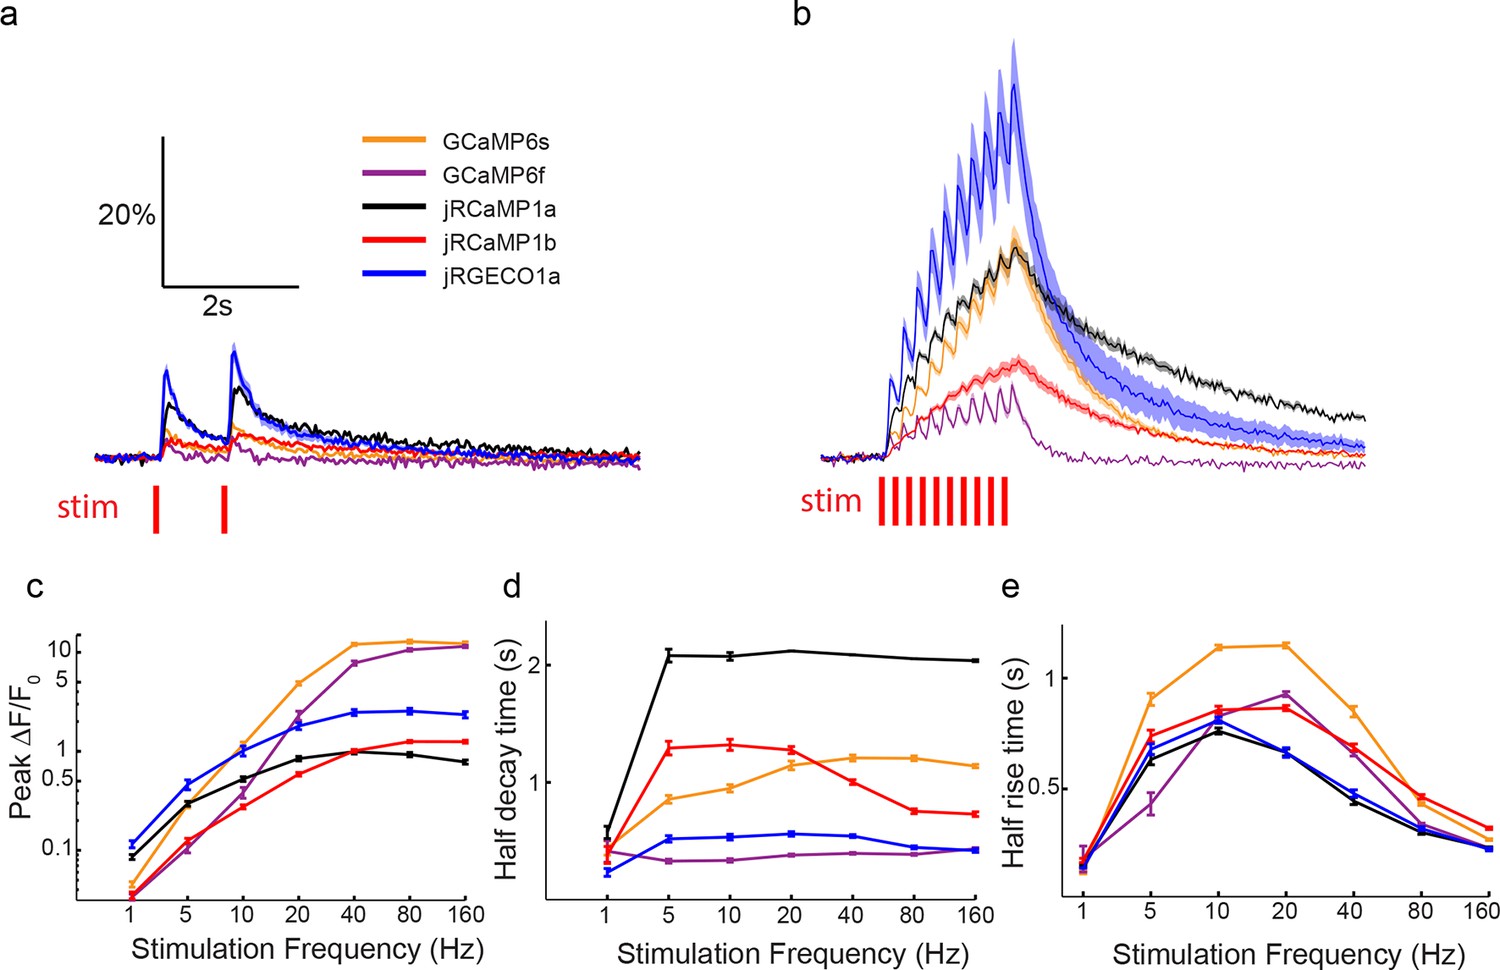
Comparing red and green GECI activity in Drosophila larval NMJ boutons.
(a–b) Single trial and averaged fluorescence transients after 1 Hz (a) and 5 Hz (b) stimulus for 2 s for jRGECO1a, jRCaMP1a, jRCaMP1b, GCaMP6s and GCaMP6f (jRGECO1a: 12 FOVs in 7 flies, 48 boutons; jRCaMP1a: 11 FOVs in 7 flies, 44 boutons; jRCaMP1b: 13 FOVs in 7 flies, 52 boutons; GCaMP6s: 12 FOVs in 7 flies, 48 boutons; GCaMP6f: 12 FOVs in 7 flies. Same data set used for all other analyses). (c) Comparison of frequency tuned averaged peak △F/F0 (mean ± s.e.m.) of jRGECO1a, jRCaMP1 variants and GCaMP6 variants, with 1, 5, 10, 20, 40, 80 and 160 Hz stimulation. Note that vertical axes are log scale. (d–e) Comparison of frequency tuned averaged half decay (d) and half rise (e) (mean ± s.e.m.) of jRGECO1a, jRCaMP1 variants and GCaMP6 variants, with 1, 5, 10, 20, 40, 80 and 160 Hz stimulation.
Figure 8
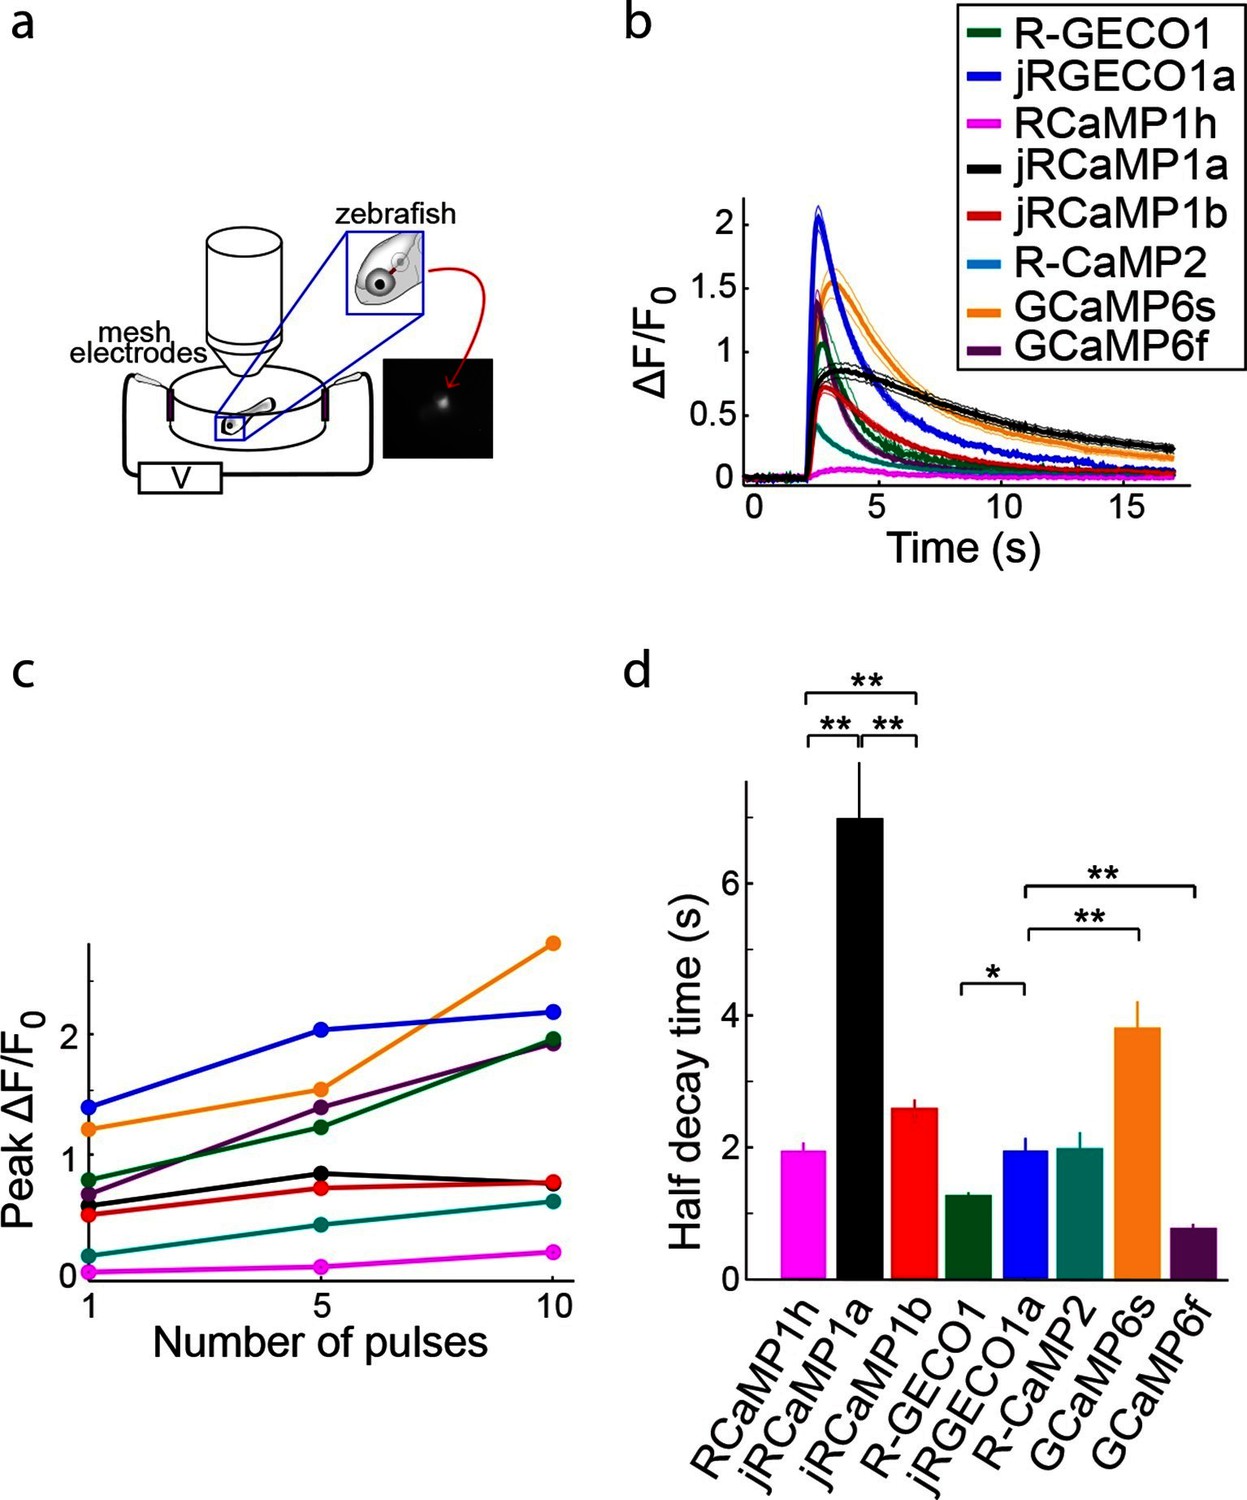
Imaging activity in the zebrafish trigeminal neurons with red GECIs.
(a) Schematic representation of zebrafish trigeminal neurons assay. Zebrafish larvae (3–4 days post fertilization) were paralyzed, embedded in agarose, and stimulated with electrodes (20 ms pulses; 1, 5, and 10 pulses at 20 Hz; Materials and methods). (b) Response transients to five-pulse stimulus (mean ± s.e.m; n=5 fish for R-GECO1; 7, jRGECO1a; 6, R-CaMP2; 6, RCaMP1h; 7, jRCaMP1a; 6, jRCaMP1b; 6, GCaMP6s; 6, GCaMP6f). Response amplitudes were 7- and 8- fold higher for jRCaMP1a and jRCaMP1b than RCaMP1h, respectively, and 4-fold higher for jRGECO1a than R-CaMP2 (Wilcoxon rank-sum test, p<0.01). (c) Averaged peak ΔF/F0 (same fish as in b) in response to one, five, and ten pulses stimuli. (d) Half decay time for different red and green GECIs (10 pulses stimulus, mean ± s.e.m., same fish as in b; *, p<0.05; **, p<0.01, Wilcoxon rank sum test).
Figure 9
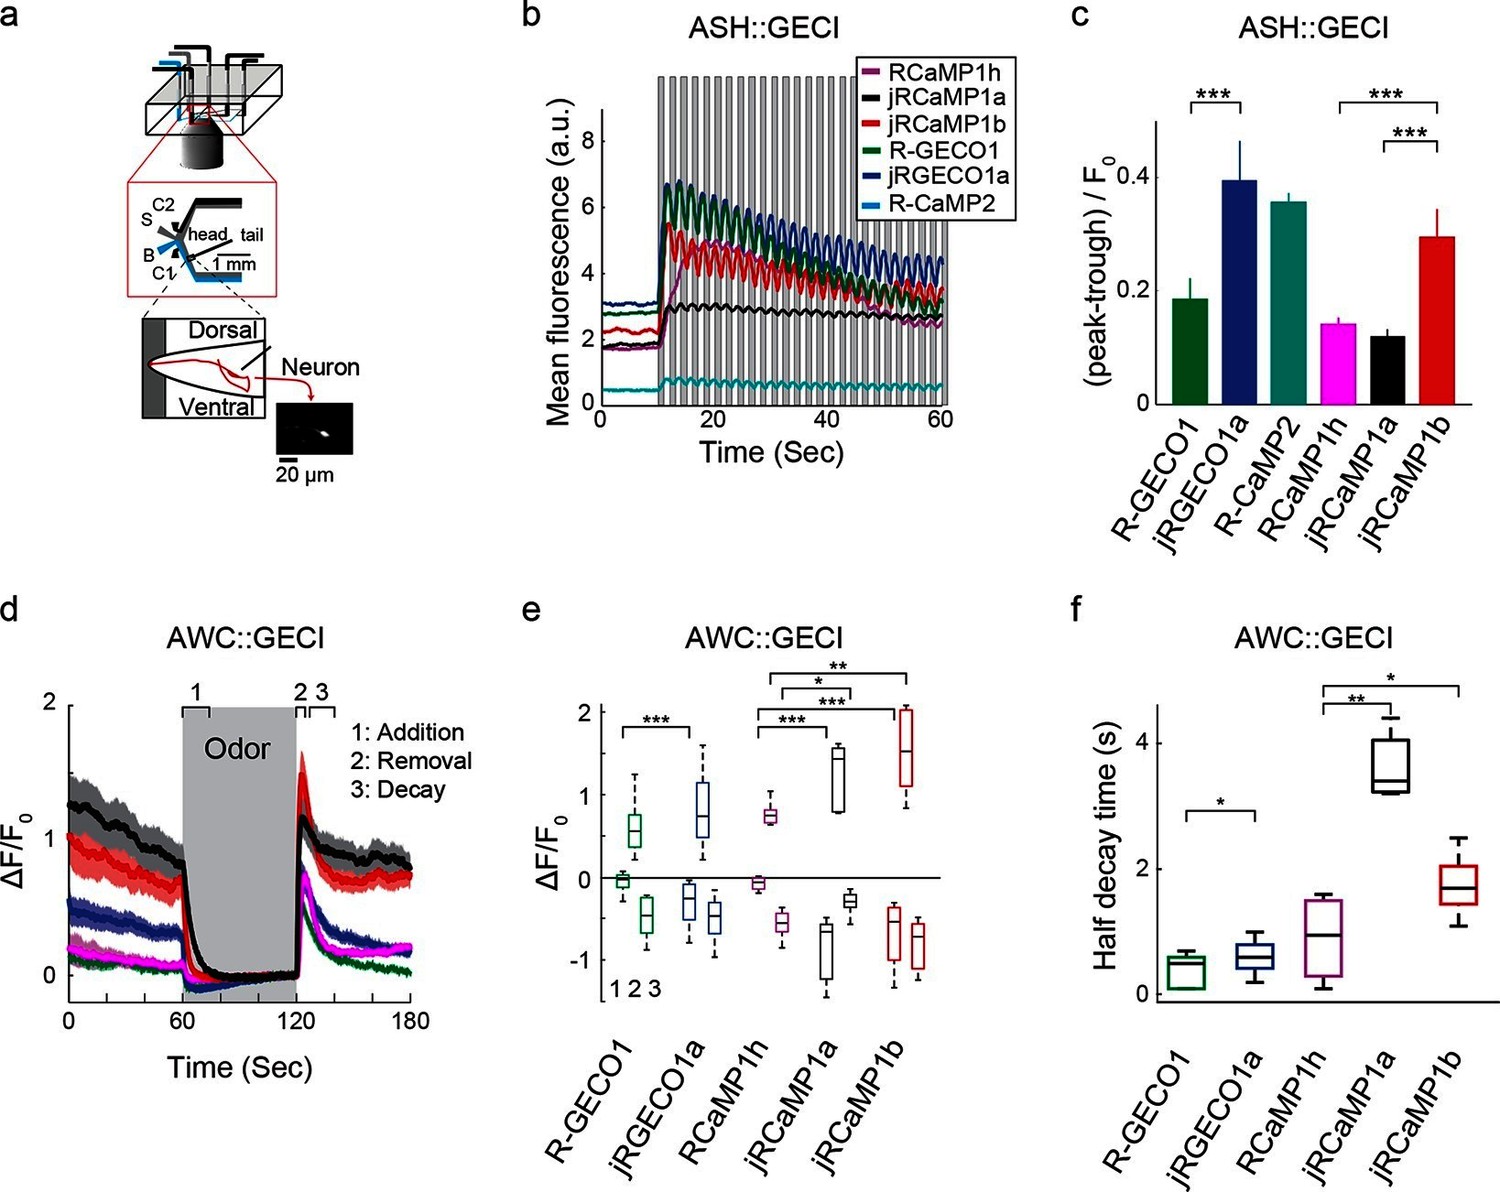
Imaging activity in the C. elegans ASH and AWC neurons with red GECIs.
(a) Schematic representation of the Caenorhabditis elegans imaging assay. A paralyzed animal is restrained in a microfluidic device with its nose exposed to a fluid channel. Delivery of stimulus (S) or buffer (B) is controlled indirectly by alternating side streams from control channels C1 and C2. (b) Mean fluorescence transients in ASH neurons in response to 1 s pulses of 1 M hyperosmotic glycerol (mean across worms, n=10 worms for jRGECO1a; 8, jRCaMP1a; 9, jRCaMP1b; 8, R-GECO1; 12, R-CaMP2; 9, RCaMP1h). (c) Quantification of signal modulation across 1 s glycerol pulses (mean peak to trough difference over all 2 s cycles, divided by the signal average fluorescence during the first 10 s in buffer (mean ± s.e.m., same data as in b). Asterisks represent a significant difference (Wilcoxon rank sum test; *, p<0.05; **, p<0.01; ***, p<0.001). (d) Mean fluorescence transients in AWC neurons in response to a one minute exposure to 92 µM isoamyl alcohol (n=19 worms for jRGECO1a; 7, jRCaMP1a; 8, jRCaMP1b; 15, R-GECO1; 6, RcaMP1h). Epochs 1–3 are quantified in e and f. (e) Comparison of fluorescence changes in AWC during epochs 1 (odor addition), 2 (odor removal) and 3 (return to baseline), same data as in d. Each box corresponds to the 25th to 75th percentile of the distribution (q1 and q3 respectively), whisker length is up to the extreme data point or . (f) Comparison of decay rates in AWC upon odor addition (epoch 1), same data as in d.
Author response image 1
Author response image 2
Videos
Video 1
jRGECO1a L2/3 functional imaging in the mouse V1.
The mouse was anesthetized and presented with moving gratings in eight directions to the contralateral eye. Gratings were presented for 4 s (indicated by appearance of an arrowhead in the grating propagation direction) followed by a 4 s of blank display. Field of view size was 250x250 μm2, acquired at 15 Hz and filtered with a 5 frame moving average.
Video 2
Dual-color imaging of axons and apical dendrites in L1 of the mouse V1.
jRGECO1a labeled apical L5 dendrites (red), and GCaMP6s labeled axons from LM (green) were imaged in L1 of V1 (left). ΔF/F0 traces from 4 ROIs (Figure 6b) are presented (right). Field of view size was 40x40 μm2 acquired at 15 Hz and filtered with a 5 frame moving average.
Additional files
-
Supplementary file 1
Comprehensive neuronal culture screening results for RCaMP1h variants.
- https://doi.org/10.7554/eLife.12727.030
-
Supplementary file 2
Comprehensive neuronal culture screening results for R-GECO1 variants.
- https://doi.org/10.7554/eLife.12727.031
Download links
A two-part list of links to download the article, or parts of the article, in various formats.
Downloads (link to download the article as PDF)
Open citations (links to open the citations from this article in various online reference manager services)
Cite this article (links to download the citations from this article in formats compatible with various reference manager tools)
Sensitive red protein calcium indicators for imaging neural activity
eLife 5:e12727.
https://doi.org/10.7554/eLife.12727


